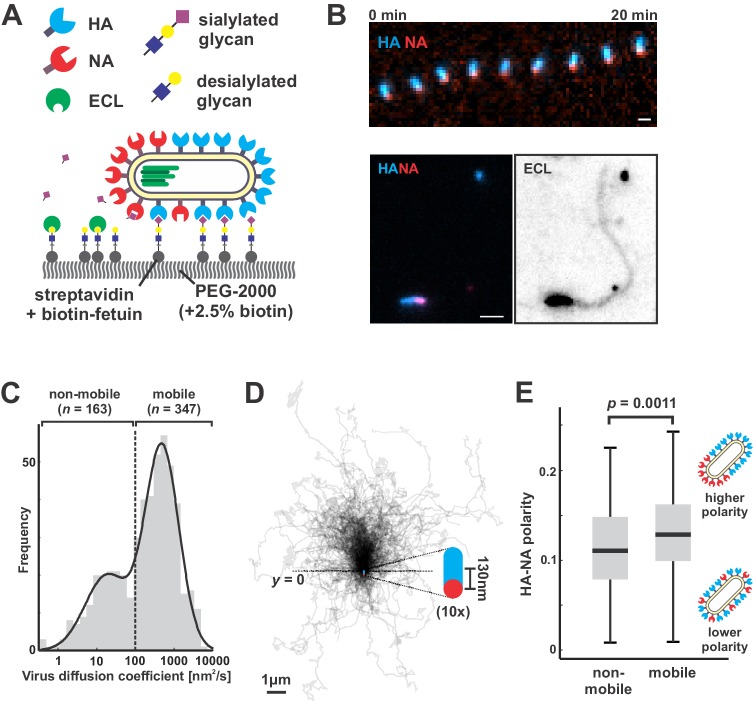
Figure 2. Filamentous IAV diffuses via a Brownian ratchet mechanism.
(A) Labeled viruses are placed on coverslips passivated with PEG2K and functionalized with biotinylated fetuin, which provides a high density of receptors for HA and substrates for NA that can be imaged using TIRF microscopy. (B) Time series of a virus migrating in the direction of its higher-HA pole (scale bar = 2 µm). Viruses exhibiting persistent motion on sialic acid-coated surfaces leave a trail of terminal galactose to which fluorescent ECL binds, indicating NA cleavage of receptors as the virus moves. (C) Distribution of virus diffusion coefficients determined by measuring the mean squared displacement versus time. Mobile particles are defined as those with diffusion coefficients > 100 nm2/s, corresponding to the more diffusive subset of the bimodally-distributed population. (D) Trajectories (measured from timelapse images) of n = 347 mobile viruses registered to their initial positions and aligned based on the orientation of the HA-NA axis. Blue and red dots at y = 0 show the median positions of HA and NA (with median separation of ~130 nm), respectively, across all viruses. Data is pooled from three biological replicates. (E) HA-NA organization correlates with virus mobility. Populations exhibiting little motion (‘non-mobile’) have significantly less polarized distributions of HA and NA than those that exhibit persistent directional mobility (quantification of n = 163 non-mobile and n = 347 mobile viruses combined from three biological replicates; boxes are centered on median values and span from 25th to 75th percentile; p-value calculated using a two-sample KS-test). See also Figure 2—source data 1.


