

Abstract
Background
Higher intakes of foods containing omega‐3 long‐chain polyunsaturated fatty acids (LCPUFA), such as fish, during pregnancy have been associated with longer gestations and improved perinatal outcomes. This is an update of a review that was first published in 2006.
Objectives
To assess the effects of omega‐3 LCPUFA, as supplements or as dietary additions, during pregnancy on maternal, perinatal, and neonatal outcomes and longer‐term outcomes for mother and child.
Search methods
For this update, we searched Cochrane Pregnancy and Childbirth’s Trials Register, ClinicalTrials.gov, the WHO International Clinical Trials Registry Platform (ICTRP) (16 August 2018), and reference lists of retrieved studies.
Selection criteria
Randomised controlled trials (RCTs) comparing omega‐3 fatty acids (as supplements or as foods, stand‐alone interventions, or with a co‐intervention) during pregnancy with placebo or no omega‐3, and studies or study arms directly comparing omega‐3 LCPUFA doses or types. Trials published in abstract form were eligible for inclusion.
Data collection and analysis
Two review authors independently assessed study eligibility, extracted data, assessed risk of bias in trials and assessed quality of evidence for prespecified birth/infant, maternal, child/adult and health service outcomes using the GRADE approach.
Main results
In this update, we included 70 RCTs (involving 19,927 women at low, mixed or high risk of poor pregnancy outcomes) which compared omega‐3 LCPUFA interventions (supplements and food) compared with placebo or no omega‐3. Overall study‐level risk of bias was mixed, with selection and performance bias mostly at low risk, but there was high risk of attrition bias in some trials. Most trials were conducted in upper‐middle or high‐income countries; and nearly half the trials included women at increased/high risk for factors which might increase the risk of adverse maternal and birth outcomes.
Preterm birth < 37 weeks (13.4% versus 11.9%; risk ratio (RR) 0.89, 95% confidence interval (CI) 0.81 to 0.97; 26 RCTs, 10,304 participants; high‐quality evidence) and early preterm birth < 34 weeks (4.6% versus 2.7%; RR 0.58, 95% CI 0.44 to 0.77; 9 RCTs, 5204 participants; high‐quality evidence) were both lower in women who received omega‐3 LCPUFA compared with no omega‐3. Prolonged gestation > 42 weeks was probably increased from 1.6% to 2.6% in women who received omega‐3 LCPUFA compared with no omega‐3 (RR 1.61 95% CI 1.11 to 2.33; 5141 participants; 6 RCTs; moderate‐quality evidence).
For infants, there was a possibly reduced risk of perinatal death (RR 0.75, 95% CI 0.54 to 1.03; 10 RCTs, 7416 participants; moderate‐quality evidence: 62/3715 versus 83/3701 infants) and possibly fewer neonatal care admissions (RR 0.92, 95% CI 0.83 to 1.03; 9 RCTs, 6920 participants; moderate‐quality evidence ‐ 483/3475 infants versus 519/3445 infants). There was a reduced risk of low birthweight (LBW) babies (15.6% versus 14%; RR 0.90, 95% CI 0.82 to 0.99; 15 trials, 8449 participants; high‐quality evidence); but a possible small increase in large‐for‐gestational age (LGA) babies (RR 1.15, 95% CI 0.97 to 1.36; 6 RCTs, 3722 participants; moderate‐quality evidence, for omega‐3 LCPUFA compared with no omega‐3. Little or no difference in small‐for‐gestational age or intrauterine growth restriction (RR 1.01, 95% CI 0.90 to 1.13; 8 RCTs, 6907 participants; moderate‐quality evidence) was seen.
For the maternal outcomes, there is insufficient evidence to determine the effects of omega‐3 on induction post‐term (average RR 0.82, 95% CI 0.22 to 2.98; 3 trials, 2900 participants; low‐quality evidence), maternal serious adverse events (RR 1.04, 95% CI 0.40 to 2.72; 2 trials, 2690 participants; low‐quality evidence), maternal admission to intensive care (RR 0.56, 95% CI 0.12 to 2.63; 2 trials, 2458 participants; low‐quality evidence), or postnatal depression (average RR 0.99, 95% CI 0.56 to 1.77; 2 trials, 2431 participants; low‐quality evidence). Mean gestational length was greater in women who received omega‐3 LCPUFA (mean difference (MD) 1.67 days, 95% CI 0.95 to 2.39; 41 trials, 12,517 participants; moderate‐quality evidence), and pre‐eclampsia may possibly be reduced with omega‐3 LCPUFA (RR 0.84, 95% CI 0.69 to 1.01; 20 trials, 8306 participants; low‐quality evidence).
For the child/adult outcomes, very few differences between antenatal omega‐3 LCPUFA supplementation and no omega‐3 were observed in cognition, IQ, vision, other neurodevelopment and growth outcomes, language and behaviour (mostly low‐quality to very low‐quality evidence). The effect of omega‐3 LCPUFA on body mass index at 19 years (MD 0, 95% CI ‐0.83 to 0.83; 1 trial, 243 participants; very low‐quality evidence) was uncertain. No data were reported for development of diabetes in the children of study participants.
Authors' conclusions
In the overall analysis, preterm birth < 37 weeks and early preterm birth < 34 weeks were reduced in women receiving omega‐3 LCPUFA compared with no omega‐3. There was a possibly reduced risk of perinatal death and of neonatal care admission, a reduced risk of LBW babies; and possibly a small increased risk of LGA babies with omega‐3 LCPUFA.
For our GRADE quality assessments, we assessed most of the important perinatal outcomes as high‐quality (e.g. preterm birth) or moderate‐quality evidence (e.g. perinatal death). For the other outcome domains (maternal, child/adult and health service outcomes) GRADE ratings ranged from moderate to very low, with over half rated as low. Reasons for downgrading across the domain were mostly due to design limitations and imprecision.
Omega‐3 LCPUFA supplementation during pregnancy is an effective strategy for reducing the incidence of preterm birth, although it probably increases the incidence of post‐term pregnancies. More studies comparing omega‐3 LCPUFA and placebo (to establish causality in relation to preterm birth) are not needed at this stage. A further 23 ongoing trials are still to report on over 5000 women, so no more RCTs are needed that compare omega‐3 LCPUFA against placebo or no intervention. However, further follow‐up of completed trials is needed to assess longer‐term outcomes for mother and child, to improve understanding of metabolic, growth and neurodevelopment pathways in particular, and to establish if, and how, outcomes vary by different types of omega‐3 LCPUFA, timing and doses; or by characteristics of women.
Plain language summary
Omega‐3 fatty acid addition during pregnancy
What is the issue?
Do omega‐3 long chain polyunsaturated fatty acids (LCPUFA) taken during pregnancy ‐ either as supplements or as dietary additions in food (such as some types of fish) ‐ improve health outcomes for babies and their mothers? This is an update of a Cochrane Review that was first published in 2006.
Why is this important?
Preterm birth (babies born before 37 weeks pregnancy (gestation)) is a leading cause of disability or death in the first five years of life. Fish and fish oil contain omega‐3 LCPUFA (particularly docosahexaenoic acid (DHA) and eicosapentaenoic acid (EPA)) and have been associated with longer pregnancies. So it is suggested that additional omega‐3 LCPUFAs in pregnancy may reduce the number of babies born preterm and may improve outcomes for children and mothers. However, many pregnant women do not eat fish very often. Encouraging pregnant women to eat fatty fish (which generally have low toxin levels) or to use omega‐3 LCPUFA supplements may improve children’s and women's health. This is an update of a Cochrane Review that was first published in 2006.
What evidence did we find?
We searched for evidence in August 2018 and found 70 randomised controlled trials (RCTs; this type of trial provides the most reliable results) (involving 19,927 women). Most trials evaluated a group of women who received omega‐3 LCPUFA and compared them with a group of women who received something that looked like omega‐3 LCPUFA but did not contain it (placebo) or received no omega‐3. The trials were mostly undertaken in upper‐middle or high‐income countries. Some studies included women at increased risk of preterm birth. The quality of the evidence from the included studies ranged from high to very low; this affected the certainty of the findings for different outcomes.
We found the incidence of preterm birth (before 37 weeks) and very preterm birth (before 34 weeks) was lower in women who received omega‐3 LCPUFA compared with no additional omega‐3. There were also fewer babies with low birthweight. However, omega‐3 LCPUFA probably increased the incidence of pregnancies continuing beyond 42 weeks, although there was no difference identified in induction of labour for post‐term pregnancies. The risk of the baby dying or being very sick and going to neonatal intensive care may be lower with omega‐3 LCPUFA compared with no omega‐3. We did not see any differences between groups for serious adverse events for mothers or in postnatal depression. Very few differences between the omega‐3 LCPUFA groups and no omega‐3 groups were observed in child development and growth.
Eleven trials reported that they had received industry funding. When we omitted these trials from the main outcomes (such as preterm birth and very preterm birth) it made very little, or no difference, to the results.
What does this mean?
Increasing omega‐3 LCPUFA intake during pregnancy, either through supplements or in foods, may reduce the incidence of preterm birth (before 37 weeks and before 34 weeks) and there may be less chance of having a baby with a low birthweight. Women who take omega‐3 LCPUFA supplements during pregnancy may also be more likely to have longer pregnancies. More studies are underway and their results will be included in a further update of this review. Future studies could consider if and how outcomes may vary in different populations of women, and could test different ways of increasing omega‐3 LCPUFA during pregnancy.
Summary of findings
Summary of findings for the main comparison. Birth/infant outcomes.
| Omega‐3 LCPUFA compared with no omega‐3 during pregnancy: birth/infant outcomes | ||||||
|
Population: pregnant women and their babies Settings: Angola (1 RCT), Australia (1 RCT), Belgium (1 RCT), Canada (1 RCT), Chile (1 RCT), Croatia (1 RCT), Chile (1 RCT), Denmark (3 RCTs), Egypt (1 RCT), Germany (2 RCTs), India (1 RCT), Iran (3 RCTs), Italy (1 RCT), Mexico (1 RCT), Netherlands (3 RCTs), Norway (1 RCT), Russia (1 RCT), Sweden (1 RCT), Turkey (1 RCT), UK (4 RCTs), USA (8 RCTs) Intervention: omega 3 Comparison: no omega‐3 | ||||||
| Outcomes | Illustrative comparative risks* (95% CI) | Relative effect (95% CI) | No of participants (studies) | Quality of the evidence (GRADE) | Comments | |
| Assumed risk | Corresponding risk | |||||
| Risk with no omega‐3 | Risk with omega‐3 | |||||
| Preterm birth < 37 weeks | 134/1000 | 119 per 1000 (109 to 130) |
RR 0.89 (0.81 to 0.97) | 10,304 (26 RCTs) | ⊕⊕⊕⊕ HIGH1 |
|
| Early preterm birth < 34 weeks | 46/1000 | 27 per 1000 (20 to 35) |
RR 0.58 (0.44 to 0.77) | 5204 (9 RCTs) | ⊕⊕⊕⊕ HIGH2 |
|
| Perinatal death | 20/1000 | 15 per 1000 (11 to 21) |
RR 0.75 (0.54 to 1.03) | 7416 (10 RCTs) | ⊕⊕⊕⊝ MODERATE3 |
|
| SGA/IUGR | 129/1000 | 130 per 1000 (116 to 146) |
RR 1.01 (0.90 to 1.13) | 6907 (8 RCTs) | ⊕⊕⊕⊝ MODERATE3 |
|
| LBW | 156/1000 | 140 (128 to 154) |
RR 0.90 (0.82 to 0.99) | 8449 (15 RCTs) | ⊕⊕⊕⊕ HIGH |
|
| LGA | 117/1000 | 134 per 1000 (113 to 159) |
RR 1.15 (0.97 to 1.36) | 3722 (6 RCTs) | ⊕⊕⊕⊝ MODERATE4 |
|
| Serious adverse events for neonate/infant | 63/1000 | 45 per 1000 (37 to 62) | RR 0.72 (0.53 to 0.99) | 2690 (2 RCTs) | ⊕⊕⊝⊝ low:5 |
|
| *The basis for the assumed risk (e.g. the median control group risk across studies) is provided in footnotes. The corresponding risk (and its 95% confidence interval) is based on the assumed risk in the comparison group and the relative effect of the intervention (and its 95% CI). CI: confidence interval; LBW: low birth weight LGA: large‐for‐gestational age;RCT: randomised controlled trial; RR: risk ratio; SGA/IUGR: small‐for‐gestational age/intrauterine growth restriction | ||||||
| GRADE Working Group grades of evidence High quality: further research is very unlikely to change our confidence in the estimate of effect. Moderate quality: further research is likely to have an important impact on our confidence in the estimate of effect and may change the estimate. Low quality: further research is very likely to have an important impact on our confidence in the estimate of effect and is likely to change the estimate. Very low quality: we are very uncertain about the estimate. | ||||||
1 Design limitations: larger studies of high quality, but some smaller studies with unclear risk of selective reporting and some smaller studies with unclear or high attrition bias at the time of birth (not downgraded for study limitations)
2 Design limitations: larger studies of higher quality, but several studies with unclear or high attrition bias at the time of birth, or baseline imbalances (not downgraded for study limitations)
3 Imprecision (‐1): downgraded one level due to crossing line of no effect and/or wide confidence intervals
4 Imprecision (‐1): downgraded one level due to wide confidence intervals
5 Design limitations (‐2): downgraded two levels; one study with unclear allocation concealment and attrition bias; specific adverse events not detailed in this study
Summary of findings 2. Maternal outcomes.
| Omega‐3 LCPUFA compared with no omega‐3 during pregnancy: maternal outcomes | ||||||
|
Population: pregnant women Settings: Angola (1 RCT), Australia (2 RCTs), Belgium (1 RCT), Brazil (1 RCT), Chile (1 RCT), Croatia (1 RCT), Denmark (3 RCTs), Egypt (1 RCT), Germany (3 RCTs), Hungary (1 RCT), Iran (5 RCTs), India (1 RCT), Italy (2 RCTs), Mexico (1 RCT), Netherlands (4 RCTs), Norway (2 RCTs), Russia (1 RCT), Scotland (2 RCTs), Spain (4 RCTs) Sweden (2 RCTs), Turkey (1 RCT), UK (3 RCTs) USA (12 RCTs), Venezuela (1 RCT) Intervention: omega‐3 Comparison: no omega‐3 | ||||||
| Outcomes | Illustrative comparative risks* (95% CI) | Relative effect (95% CI) | No of participants (studies) | Quality of the evidence (GRADE) | Comments | |
| Assumed risk | Corresponding risk | |||||
| Risk with no omega‐3 | Risk with omega‐3 | |||||
| Prolonged gestation > 42 weeks | 16/1000 | 26/1000 (18 to 37) |
RR 1.61 (1.11 to 2.33) | 5141 (6) | ⊕⊕⊕⊝ MODERATE6 |
|
| Induction post‐term | 83/1000 | 68/1000 (18 to 247) |
Average RR 0.82 (0.22 to 2.98) | 2900 (3) | ⊕⊕⊝⊝ LOW7 |
|
| Pre‐eclampsia | 53/1000 | 44/1000 (37 to 53) |
RR 0.84 (0.69 to 1.01) | 8306 (20) | ⊕⊕⊝⊝ LOW7 |
Defined as hypertension with proteinuria |
| Gestational length | The mean gestational age in the intervention group was 1.67 days greater (0.95 greater to 2.39 days greater) | Average MD 1.67 days (0.95 to 2.39) | 12,517 (41) | ⊕⊕⊕⊝ MODERATE8 |
||
| Maternal serious adverse events | 6/1000 | 6/1000 (2 to 16) |
RR 1.04 (0.40 to 2.72) | 2690 (2) | ⊕⊕⊝⊝ LOW9 |
|
| Maternal admission to intensive care | 1/1000 | 1/1000 (0 to 3) |
RR 0.56 (0.12 to 2.63) | 2458 (2) | ⊕⊕⊝⊝ LOW9 |
|
| Postnatal depression | 112/1000 | 100 (80 to 125) |
Average RR 0.99 (0.56 to 1.77) | 2431 (2) | ⊕⊕⊝⊝ LOW10 |
|
| *The basis for the assumed risk (e.g. the median control group risk across studies) is provided in footnotes. The corresponding risk (and its 95% confidence interval) is based on the assumed risk in the comparison group and the relative effect of the intervention (and its 95% CI). CI: confidence interval; RR: risk ratio | ||||||
| GRADE Working Group grades of evidence High quality: further research is very unlikely to change our confidence in the estimate of effect. Moderate quality: further research is likely to have an important impact on our confidence in the estimate of effect and may change the estimate. Low quality: further research is very likely to have an important impact on our confidence in the estimate of effect and is likely to change the estimate. Very low quality: we are very uncertain about the estimate. | ||||||
6 Design limitations (‐1): downgraded one level due to some studies with attrition bias and some selective reporting bias; and some imprecision (not downgraded)
7 Design limitations (‐1): downgraded one level for combined study limitations (mostly attrition bias and selective reporting bias); Imprecision (‐1): downgraded one level due to confidence intervals including line of no effect
8 Design limitations (‐1): downgraded one level for study limitations (mainly attrition bias): heterogeneity I2 = 54%, but not downgraded due to use of a random‐effects model
9 Imprecision (‐2): downgraded two levels for wide confidence intervals and only 2 studies
10 Design limitations (‐1): downgraded one level for study limitations (unclear randomisation in 1 study); downgraded one level for imprecision (wide confidence intervals; 2 studies only)
Summary of findings 3. Child/adult outcomes.
| Omega‐3 LCPUFA compared with no omega‐3 during pregnancy: child/adult outcomes | ||||||
|
Population: children of women randomised to omega‐3 or no omega‐3 during pregnancy Settings: Australia (2 RCTs), Bangladesh (1 RCT), Canada (1 RCT), Denmark (1 RCT), Hungary (1 RCT), Germany (1 RCT), Spain (2 RCTs), Mexico (1 RCT), Netherlands (1 RCT) Intervention: omega‐3 Comparison: no omega‐3 | ||||||
| Outcomes | Illustrative comparative risks* (95% CI) | Relative effect (95% CI) | No of participants (studies) | Quality of the evidence (GRADE) | Comments | |
| Assumed risk | Corresponding risk | |||||
| Risk with no omega‐3 | Risk with omega‐3 | |||||
| Cognition: BSID II score at < 24 months |
The mean BSID II score at 24 months in the intervention group was 0.37 points lower in the intervention group (1.47 lower to 0.76 higher) | MD ‐0.37 (‐1.49 to 0.76) | 1154 (4) | ⊕⊕⊝⊝ LOW11 |
||
| Cognition: BSID III score at < 24 months |
The mean BSID III score at 24 months in the intervention group was 0.04 points higher (1.59 lower to 1.68 higher) | MD 0.04 (‐1.59 to 1.68) | 809 (2) | ⊕⊕⊝⊝ LOW12 |
||
| IQ: WASI at 7 years | The mean WASI at 7 years in the intervention group was identical to the mean in the control group (0.79 points lower to 2.79 higher) | MD 1.00 (‐0.79 to 2.79) | 543 (1) | ⊕⊕⊝⊝ LOW12 |
||
| IQ: WISC‐IV at 12 years | The WISC‐IV at 12 years in the intervention group was identical to in the control group (5.16 points lower to 7.16 higher) | MD 1.00 (‐5.16 to 7.16) | 50 (1) | ⊕⊝⊝⊝ VERY LOW13 |
||
| Behaviour: BSID III adaptive behaviour score at 12‐18 months | The mean BSID III adaptive behaviour score in the intervention group at 12‐18 months was 1.20 points lower (3.12 lower to 0.72 higher) | MD ‐1.20 (‐3.12 to 0.72) | 809 (2) | ⊕⊕⊝⊝ LOW14 |
At 12 months (one study), 18 months (one study) | |
| Behaviour: SDQ Total Difficulties at 7 years | The mean SDQ total difficulties score at 7 years in the intervention group was 1.08 higher (0.18 higher to 1.98 higher) | MD 1.08 (0.18 to 1.98) | 543 (1) | ⊕⊕⊝⊝ LOW12 |
||
| BMI at 19 years | The mean BMI at 19 years in the intervention group was identical to that in the control group (0.83 lower to 0.83 higher) | MD 0 (‐0.83 to 0.83) | 243 (1) | ⊕⊝⊝⊝ VERY LOW15 |
||
| Diabetes | Not reported | |||||
| *The basis for the assumed risk (e.g. the median control group risk across studies) is provided in footnotes. The corresponding risk (and its 95% confidence interval) is based on the assumed risk in the comparison group and the relative effect of the intervention (and its 95% CI). BMI: body mass index; BSID: Bayley Scales of Infant Development; CI: confidence interval; IQ: Intelligence Quotient; MD: mean difference; SDQ: Strengths and Difficulties Questionnaire; WASI: Weschler Abbreviated Scale of Intelligence; WISC: Weschler Intelligence Scale for Children | ||||||
| GRADE Working Group grades of evidence High quality: further research is very unlikely to change our confidence in the estimate of effect. Moderate quality: further research is likely to have an important impact on our confidence in the estimate of effect and may change the estimate. Low quality: further research is very likely to have an important impact on our confidence in the estimate of effect and is likely to change the estimate. Very low quality: we are very uncertain about the estimate. | ||||||
11 Design limitations (‐1): downgraded one level due to unclear randomisation in 3 studies (that contributed 40% to meta‐analysis) and some studies at high risk of attrition bias; Imprecision (‐1): downgraded one level for wide confidence intervals including line of no effect
12 Imprecision (‐2): downgraded one level for confidence intervals including line of no effect; and one level for small number of studies/single study
13 Design limitations (‐1): downgraded one level for unclear selection bias (not clear if random sequence generated), possible attrition and/or reporting bias; Imprecision (‐2): downgraded two levels for wide confidence intervals including line of no effect and 1 study with small number of participants
14 Design limitations (‐1): downgraded one level for unclear randomisation (possible lack of allocation concealment), possible attrition and/or selective bias in 1 of the trials (contributing 15% to analysis); Imprecision (‐1): downgraded one level for confidence intervals including line of no effect and few studies
Design limitations (‐1): downgraded one level for unclear sequence generation and unclear blinding: Imprecision (‐2): downgraded two levels for confidence intervals including line of no effect and 1 study with small number of participants
Summary of findings 4. Health service outcomes.
| Omega‐3 compared with no omega‐3 during pregnancy: health services outcomes | ||||||
|
Population: pregnant women and their infants Settings: Australia (1 RCT), Belgium (1 RCT), Denmark (2 RCTs), Egypt (1), Iran (2 RCTs), Italy (1 RCT), Netherlands (1 RCT), Norway (1 RCT), Russia (1 RCT), Scotland (1 RCT), UK (1 RCT), USA (5 RCTs) Intervention: omega‐3 Comparison: no omega‐3 | ||||||
| Outcomes | Illustrative comparative risks* (95% CI) | Relative effect (95% CI) | No of participants (studies) | Quality of the evidence (GRADE) | Comments | |
| Assumed risk | Corresponding risk | |||||
| no omega‐3 | omega‐3 | |||||
| Maternal hospital admission (antenatal) | 273/1000 | 251/1000 (221 to 284) |
RR 0.92 (0.81 to 1.04) | 2876 (5) | ⊕⊕⊝⊝ LOW 16 |
|
| Infant admission to neonatal care | 151/1000 | 139/1000 (125 to 156) |
RR 0.92 (0.83 to 1.03) | 6920 (9) | ⊕⊕⊕⊝ MODERATE 17 |
|
| Maternal length of hospital stay (days) | The mean length of stay in the intervention group was 0.18 days greater (0.20 less to 0.57 days greater) | MD 0.18 (‐0.20 to 0.57) | 2290 (2) | ⊕⊕⊝⊝ LOW 8 |
||
| Infant length of hospital stay (days) | The mean length of stay in the intervention group was 0.11 days greater (1.40 less to 1.62 days greater) | MD 0.11 (‐1.40 to 1.62) | 2041 (1) | ⊕⊕⊝⊝ LOW 8 |
||
| Costs | Not reported | |||||
| *The basis for the assumed risk (e.g. the median control group risk across studies) is provided in footnotes. The corresponding risk (and its 95% confidence interval) is based on the assumed risk in the comparison group and the relative effect of the intervention (and its 95% CI). CI: confidence interval; MD: mean difference; RR: risk ratio | ||||||
| GRADE Working Group grades of evidence High quality: further research is very unlikely to change our confidence in the estimate of effect. Moderate quality: further research is likely to have an important impact on our confidence in the estimate of effect and may change the estimate. Low quality: further research is very likely to have an important impact on our confidence in the estimate of effect and is likely to change the estimate. Very low quality: we are very uncertain about the estimate. | ||||||
16 Design limitations (‐1): downgraded one level due to some studies with possible risk of attrition bias; Imprecision (‐1): downgraded one level for confidence intervals including line of no effect
17 Imprecision (‐1): downgraded one level for confidence intervals including line of no effect
18 Imprecision (‐2): downgraded one level for confidence intervals including line of no effect and once for small number of studies
Background
Description of the condition
Complications of pregnancy such as preterm birth, fetal growth restriction, postnatal depression and pre‐eclampsia are relatively common and are associated with poorer outcomes for both the mother and child.
Of these, preterm birth has the highest burden of mortality and morbidity. Worldwide, approximately 15 million infants are born preterm (< 37 weeks completed gestation) every year (World Health Organization 2017). National rates range from 5% to 18%, and are rising in most countries (World Health Organization 2017). Preterm birth is the leading cause of death in newborns, accounting for more than 85% of all perinatal complications and death (Thornton 2008). Preterm birth is also the leading cause of deaths in children under five years of age, with 1 million of the 5.9 million child deaths each year due to preterm birth complications (Liu 2016).
Advances in perinatal and neonatal care mean more preterm babies are surviving, but many of these infants go on to suffer the short‐ and long‐term consequences of being born before their organs are mature (Saigal 2008). Infants born before 34 weeks often require intensive care and are at increased risk of respiratory distress syndrome, intraventricular haemorrhage, necrotising enterocolitis, blindness and cerebral palsy (Saigal 2008). In early childhood, developmental difficulties may emerge, with later societal and economic impacts due to low educational achievement, high unemployment, and deficits in social and emotional well‐being (Westrupp 2014).
For mothers, postnatal depression is the most prevalent mood disorder associated with childbirth; symptoms include mood disturbances, sleep disturbances (not related to the infant), appetite disturbances or weight loss, and suicidal ideation. Systematic reviews report that nearly 20% of women experience depression within 12 weeks of giving birth (Gaynes 2005), with symptoms persisting beyond the first year in 8% of affected women (Dennis 2012). Postnatal depression impairs maternal social and psychological functioning with possible subsequent adverse effects on child development outcomes (Conroy 2012; Zhu 2014).
Fetal growth restriction is associated with stillbirth, neonatal death and perinatal morbidity and an increased risk of adverse health outcomes into adulthood (Stillbirth CRE 2018). Pre‐eclampsia, characterised by high blood pressure and protein in the urine, can affect the kidneys, liver and blood‐clotting systems and have serious life‐threatening complications for the mother, such as eclampsia and can also result in preterm birth and fetal growth restriction (Mol 2016).
Description of the intervention
Maternal diet, including type and quantity of fat consumed, can have profound effects on pregnancy outcomes (Nordgren 2017). Omega‐3 long chain polyunsaturated fatty acid status (LCPUFA) in pregnancy was first linked to longer gestation, higher birthweight and less preterm birth by researchers observing longer pregnancies among Faroe Islanders (who consume a diet high in fish) than the Danish population (Olsen 1985; Olsen 1986; Olsen 1991).
A prospective observational study in 8729 Danish women showed that reporting low consumption of fish in pregnancy was a strong risk factor for preterm and early preterm birth (Olsen 2002; Olsen 2006) particularly if low intake occurred during a prolonged period of pregnancy (Olsen 2006). A study pooling results from 19 European birth cohorts with over 150,000 mother‐child pairs has subsequently shown an association between consumption of fish more than once a week by the mother and lower risk of preterm birth (Leventakou 2014), while a later study from Norway of over 67,000 women has also shown an association between increased fish consumption (particularly lean fish) and a lower prevalence of preterm birth (Brantsaeter 2017). Brantsaeter 2017 also examined the effect of omega‐3 LCPUFA in the form of supplements, and found an association with reduced early, but not later, preterm birth. Observational studies have also shown links between fish consumption in pregnancy and child neurodevelopment (Hibbeln 2007).
In this review we have taken a comprehensive approach and specified any form or dose of omega‐3 fatty acid as eligible, whether as fish or algal oil supplements, as food, or advice to consume particular foods rich in omega‐3 LCPUFA (such as fish). We have also specified any type of omega‐3 fatty acid (e.g. docosahexaenoic acid (DHA); eicosapentaenoic acid (EPA)); and any combination of omega‐3 LCPUFAs as eligible. We have also included the omega‐3 PUFA alpha‐linolenic acid for completeness, although it is not a LCPUFA.
How the intervention might work
Consumption of omega‐3 fatty acids during pregnancy and lactation, particularly those forms derived from fish or marine sources, are thought to influence a wide range of maternal, fetal, neonatal, and later outcomes. These include child growth and development outcomes (Borge 2017; Jensen 2006), preventing childhood allergies (see separate Cochrane Review ‐ Gunaratne 2015), prevention of pre‐eclampsia, decreasing maternal depression and anxiety (Golding 2009; Vaz Jdos 2013), and increasing gestational length (as discussed above).
When consumed in the diet, the essential fatty acid alpha‐linolenic acid (ALA; 18:3 omega‐3) can be converted to biologically active derivatives including eicosapentaenoic acid (EPA; 20:5 omega‐3), docosapentaenoic acid (DPA; 22:5 omega‐3) and docosahexaenoic acid (DHA; 22:6 omega‐3). These fatty acids are precursors to a range of compounds that are known to minimise and help resolve inflammatory responses and oxidative stress (Leghi 2016). Pregnancy outcomes with an inflammatory component, such as preterm birth, are thought to be reduced by increasing omega‐3 LCPUFA concentrations through including fish in the maternal diet or taking fish oil supplements. Maintaining a balance between the metabolites of omega‐3 LCPUFA and the often pro‐inflammatory omega‐6 arachidonic acid is important in maintaining normal gestation length and is a critical element in cervical ripening and the initiation of labour (Zhou 2017). Adequate DHA, in particular, is thought to be crucial in fetal and early‐life brain development (Shulkin 2018).
Fish and seafood are the richest dietary sources of DHA (Greenberg 2008). However, fish consumption is low in many countries, and women of childbearing age may be reluctant to increase their fish intake due to perceptions that mercury and other pollutants in fish may affect their unborn child (Oken 2018). For example only 10% of women of childbearing age in Australia meet the recommended docosahexaenoic acid (DHA) intake (Koletzko 2007; Meyer 2016), which includes fish as well as fish oil supplementation. Many pregnant women are likely to have low concentrations of omega‐3 LCPUFA and may benefit from increasing DHA in their diet, either from food sources or as supplements.
Why it is important to do this review
Over the last 40 years, a slew of observational studies, randomised trials and reviews addressing omega‐3 fatty acids and pregnancy (e.g. Newberry 2016), involving hundreds of thousands of women, have been published. However many of these studies and reviews have concentrated on a particular focus such as allergy or child development, and reported only a selection of outcomes. Some outcomes such as preterm birth have not always been reported, despite the growing realisation that omega‐3 LCPUFA supplementation may have a role in preventing it. Furthermore, studies and reviews on omega‐3 LCPUFAs in pregnancy have differed in their findings and conclusions (e.g. Saccone 2016), sometimes due to selective reporting and other methodological issues.
Therefore, a comprehensive systematic review of omega‐3 fatty acids in pregnancy that covers all relevant maternal, perinatal and child outcomes (except allergy which is covered in Gunaratne 2015), all forms of omega‐3 fatty acids, and comparisons of doses, timing and types of omega‐3 fatty acids is required.
Objectives
To assess the effects of omega‐3 LCPUFA, as supplements or as dietary additions, during pregnancy on maternal, perinatal, and neonatal outcomes and longer‐term outcomes for mother and child.
Methods
Criteria for considering studies for this review
Types of studies
Randomised controlled trials (RCTs), including quasi‐randomised trials, and trials published in abstract form were eligible for inclusion.
We intended to include RCTs that use a cluster‐randomised design but identified none for inclusion in this update. Cross‐over trials are not eligible for inclusion in this review.
Types of participants
Pregnant women, regardless of their risk for pre‐eclampsia, preterm birth or intrauterine growth restriction (IUGR).
Types of interventions
Omega‐3 fatty acids (usually fish or algal oils) compared with placebo or no omega‐3 fatty acids
Trials that assessed omega‐3 fatty acid co‐interventions (e.g. omega‐3 with another agent)
Studies or study arms that compared omega‐3 doses or types of omega‐3 (e.g. DHA versus EPA) directly
Types of outcome measures
Primary outcomes
Preterm birth < 37 weeks
Early preterm birth < 34 weeks
Prolonged gestation (> 42 weeks)
Secondary outcomes
For the woman
Hypertension
Pre‐eclampsia
Eclampsia
Admission to hospital (antenatal or postnatal)
Caesarean section
Caesarean section (post‐term)
Induction (post‐term)
Haemorrhage; blood loss
Serious morbidity/mortality
Length of gestation
Adverse effects
Gestational diabetes
Depression
Anxiety
Stress (scale or response to challenge)
Gestational weight gain
Miscarriage
For babies
Stillbirths
Neonatal deaths
Perinatal deaths
Birthweight
Birth length
Head circumference
Low birthweight (< 2.5 kg)
Small‐for‐gestational age (SGA) (< 10th percentile)/IUGR
Large‐for‐gestational age
Intraventricular haemorrhage (and grade)
Respiratory distress syndrome
Necrotising enterocolitis
Jaundice requiring phototherapy
Sepsis
Retinopathy of prematurity
Neonatal convulsion
Admission to a neonatal intensive care unit
Longer term infant/child follow‐up
Physical growth
Mental and emotional health
Behaviour
Neurological/neurosensory and developmental outcomes (including cognitive domains: attention, executive function, language, memory, visuospatial and motor development)
Neurological disorders (e.g. cerebral palsy)
For health service resources
Admission and length of stay in hospital and intensive care facilities
Use of community health services
Search methods for identification of studies
The following methods section of this review is based on a standard template used by Cochrane Pregnancy and Childbirth.
Electronic searches
For this update, we searched Cochrane Pregnancy and Childbirth’s Trials Register by contacting their Information Specialist (16 August 2018)
The Register is a database containing over 25,000 reports of controlled trials in the field of pregnancy and childbirth. It represents over 30 years of searching. For full current search methods used to populate Pregnancy and Childbirth’s Trials Register including the detailed search strategies for CENTRAL, MEDLINE, Embase and CINAHL; the list of handsearched journals and conference proceedings, and the list of journals reviewed via the current awareness service, please follow this link
Briefly, Cochrane Pregnancy and Childbirth’s Trials Register is maintained by their Information Specialist and contains trials identified from:
monthly searches of the Cochrane Central Register of Controlled Trials (CENTRAL);
weekly searches of MEDLINE (Ovid);
weekly searches of Embase (Ovid);
monthly searches of CINAHL (EBSCO);
handsearches of 30 journals and the proceedings of major conferences;
weekly current awareness alerts for a further 44 journals plus monthly BioMed Central email alerts.
Search results are screened by two people and the full text of all relevant trial reports identified through the searching activities described above is reviewed. Based on the intervention described, each trial report is assigned a number that corresponds to a specific Pregnancy and Childbirth review topic (or topics), and is then added to the Register. The Information Specialist searches the Register for each review using this topic number rather than keywords. This results in a more specific search set that has been fully accounted for in the relevant review sections (Included studies; Excluded studies; Studies awaiting classification; Ongoing studies).
In addition, we searched ClinicalTrials.gov and the World Health Organization (WHO) International Clinical Trials Registry Platform (ICTRP) for unpublished, planned and ongoing trial reports (29 August 2017) using the search terms given in Appendix 1.
Searching other resources
We searched the reference lists of retrieved studies.
We did not apply any language or date restrictions.
Data collection and analysis
Selection of studies
Two review authors independently assessed all the potential studies we identified as a result of the search strategy for inclusion. We resolved any disagreement through discussion or, if required, we consulted a third review author.
Data extraction and management
We designed a form to extract data. For eligible trials, two review authors extracted the data using the agreed form. We resolved discrepancies through discussion or, if required, we consulted a third review author. We entered data into Review Manager 5 software (Review Manager 2014), and checked for accuracy.
When information regarding any of the above was unclear, we attempted to contact authors of the original reports to request further details.
Assessment of risk of bias in included studies
Two review authors independently assessed risk of bias for each study using the criteria outlined in the Cochrane Handbook for Systematic Reviews of Interventions (Higgins 2011). We resolved any disagreement by discussion or by involving a third assessor.
(1) Random sequence generation (checking for possible selection bias)
For each included study we described the method used to generate the allocation sequence in sufficient detail to allow an assessment of whether it should produce comparable groups.
We assessed the method as:
low risk of bias (any truly random process, e.g. random number table; computer random number generator);
high risk of bias (any non‐random process, e.g. odd or even date of birth; hospital or clinic record number);
unclear risk of bias.
(2) Allocation concealment (checking for possible selection bias)
For each included study we described the method used to conceal allocation to interventions prior to assignment and assessed whether intervention allocation could have been foreseen in advance of, or during recruitment, or changed after assignment.
We assessed the methods as:
low risk of bias (e.g. telephone or central randomisation; consecutively numbered sealed opaque envelopes);
high risk of bias (open random allocation; unsealed or non‐opaque envelopes, alternation; date of birth);
unclear risk of bias.
(3.1) Blinding of participants and personnel (checking for possible performance bias)
For each included study we described the methods used, if any, to blind study participants and personnel from knowledge of which intervention a participant received. We considered that studies were at low risk of bias if they were blinded, or if we judged that the lack of blinding unlikely to affect results. We assessed blinding separately for different outcomes or classes of outcomes.
We assessed the methods as:
low, high or unclear risk of bias for participants;
low, high or unclear risk of bias for personnel.
(3.2) Blinding of outcome assessment (checking for possible detection bias)
For each included study we described the methods used, if any, to blind outcome assessors from knowledge of which intervention a participant received. We assessed blinding separately for different outcomes or classes of outcomes.
We assessed methods used to blind outcome assessment as:
low, high or unclear risk of bias.
(4) Incomplete outcome data (checking for possible attrition bias due to the amount, nature and handling of incomplete outcome data)
For each included study we described, and for each outcome or class of outcomes, the completeness of data including attrition and exclusions from the analysis. We stated whether attrition and exclusions were reported and the numbers included in the analysis at each stage (compared with the total randomised participants), reasons for attrition or exclusion where reported, and whether missing data were balanced across groups or were related to outcomes. Where sufficient information was reported, or could be supplied by the trial authors, we planned to reinclude missing data in the analyses which we undertook.
We assessed methods as:
low risk of bias (e.g. no missing outcome data; missing outcome data balanced across groups);
high risk of bias (e.g. numbers or reasons for missing data imbalanced across groups; ‘as treated’ analysis done with substantial departure of intervention received from that assigned at randomisation);
unclear risk of bias.
(5) Selective reporting (checking for reporting bias)
For each included study we described how we investigated the possibility of selective outcome reporting bias and what we found.
We assessed the methods as:
low risk of bias (where it is clear that all of the study’s prespecified outcomes and all expected outcomes of interest to the review were reported);
high risk of bias (where not all the study’s prespecified outcomes were reported; one or more reported primary outcomes was not prespecified; outcomes of interest are reported incompletely and so cannot be used; study failed to include results of a key outcome that would have been expected to have been reported);
unclear risk of bias.
(6) Other bias (checking for bias due to problems not covered by (1) to (5) above)
For each included study we described any important concerns we had about other possible sources of bias.
(7) Overall risk of bias
We made explicit judgements about whether studies were at high risk of bias, according to the criteria given in the Handbook (Higgins 2011).
Assessment of the quality of the evidence using the GRADE approach
For this update, we evaluated the quality of the evidence for the outcomes below using the GRADE approach as outlined in the GRADE handbook. The GRADE approach uses five considerations (study limitations, consistency of effect, imprecision, indirectness and publication bias) to assess the quality of the body of evidence for each outcome. In randomised controlled trials, the evidence can be downgraded from 'high quality' by one level for serious (or by two levels for very serious) limitations, depending on assessments for risk of bias, indirectness of evidence, serious inconsistency, imprecision of effect estimates or potential publication bias.
Baby/infant
Preterm birth < 37 weeks
Preterm birth < 34 weeks
Perinatal death
SGA/IUGR
Low birthweight
Large‐for‐gestational age
Mother
Prolonged gestation (> 42 weeks)
Induction post‐term
Pre‐eclampsia
Length of gestation
Maternal adverse events
Maternal morbidity composite (serious morbidity)
Depression and/or anxiety (postnatal)
Child/adult
Cognition
Vision (neurosensory outcome)
Neurodevelopment
Behaviour
BMI (long‐term growth outcome)
Diabetes (long‐term development outcome)
Health services
Maternal hospital admission (antenatal; postnatal)
NICU admission
Maternal length of hospital stay
Infant length of hospital stay
Resource use
'Summary of findings' table
We used the GRADEpro Guideline Development Tool to import data from Review Manager 5 in order to create 'Summary of findings’ tables for maternal, baby/infant, child and health service outcomes (Review Manager 2014). We created 'Summary of findings' tables for the main comparison: omega‐3 LCPUFA versus no omega‐3 (e.g. placebo or no supplement). We have presented summaries of the intervention effect and measures of quality according to the GRADE approach in the 'Summary of findings' tables.
Measures of treatment effect
Dichotomous data
For dichotomous data, we have presented results as summary risk ratios with 95% confidence intervals.
Continuous data
For continuous data, we have used the mean differences if outcomes were measured in the same way between trials. In future updates, we plan to use the standardised mean difference to combine trials that measure the same outcome, but use different methods.
Unit of analysis issues
Cluster‐randomised trials
We did not identify any cluster‐randomised trials.
In future updates of this review, if cluster‐randomised trials are included, we will adjust their sample sizes and event rates using the methods described in the Cochrane Handbook for Systematic Reviews of Interventions (Higgins 2011), using an estimate of the intra‐cluster correlation co‐efficient (ICC) derived from the trial (if possible), from a similar trial or from a study of a similar population. If we use ICCs from other sources, we will report this and conduct sensitivity analyses to investigate the effect of variation in the ICC. If we identify both cluster‐randomised trials and individually‐randomised trials, we plan to synthesise the relevant information. We will consider it reasonable to combine the results from both if there is little heterogeneity between the study designs and the interaction between the effect of intervention and the choice of randomisation unit is considered to be unlikely.
We will also acknowledge heterogeneity in the randomisation unit and we will perform a subgroup analysis to investigate the effects of the randomisation unit.
Cross‐over trials
We considered cross‐over designs to be an inappropriate design for this research question.
Multi‐arm trials
For included multi‐arm trials, we used methods described in the Cochrane Handbook for Systematic Reviews of Interventions to overcome possible unit‐of analysis errors (Higgins 2011), by combining groups to make a single pair‐wise comparison (where appropriate), or by splitting the 'shared' group into two (or more) groups with smaller sample sizes, and including the two (or more) comparisons (see Included studies text for details of how this was done for each of the 10 multi‐arm trials we included).
Dealing with missing data
For included trials, we noted levels of attrition.
For all outcomes, we carried out analyses, as far as possible, on an intention‐to‐treat basis, that is, we have attempted to include all participants randomised to each group in the analyses, and all participants were analysed in the group to which they were allocated, regardless of whether or not they received the allocated intervention. The denominator for each outcome in each trial was the number randomised minus any participants whose outcomes were known to be missing.
Assessment of heterogeneity
We assessed statistical heterogeneity in each meta‐analysis using the Tau², I² and Chi² statistics. We regarded heterogeneity as substantial if I² was greater than 30% and either Tau² was greater than zero, or there was a low P value (less than 0.10) in the Chi² test for heterogeneity.
Assessment of reporting biases
Where there were 10 or more trials in a meta‐analysis we investigated reporting biases (such as publication bias) using funnel plots. We assessed funnel plot asymmetry visually.
Data synthesis
We carried out statistical analysis using Review Manager 5 software (Review Manager 2014). We used fixed‐effect meta‐analysis for combining data where it was reasonable to assume that trials were estimating the same underlying treatment effect, that is, where trials were examining the same intervention, and the trials’ populations and methods were judged to be sufficiently similar. Where there was clinical heterogeneity sufficient to expect that the underlying treatment effects differed between trials, or where substantial statistical heterogeneity was detected (I² > 30%), we used random‐effects meta‐analysis to produce an overall summary, if an average treatment effect across trials was considered clinically meaningful. The random‐effects summary was treated as the average of the range of possible treatment effects and we have discussed the implications of treatment effects differing between trials. If the average treatment effect was not clinically meaningful, we would not have combined trials. Where we have used random‐effects analyses, the results have been presented as the average treatment effect with 95% confidence intervals, and the estimates of T² and I².
Subgroup analysis and investigation of heterogeneity
We investigated substantial heterogeneity using subgroup analyses and sensitivity analyses.
We carried out the following subgroup analyses.
1. Type of intervention
All the following interventions compared with each other:
omega‐3 LCPUFA supplements only;
omega‐3 supplements plus omega enriched food or dietary advice;
omega enriched food only;
omega‐3 LCPUFA supplements plus advice and/or other agents.
2. Dose of omega‐3 LCPUFA
The following doses compared to each other:
low (< 500 mg/day);
mid (500 mg to 1 g/day);
high (> 1 g/day).
3. Timing
Comparison of the following gestational ages when omega‐3 LCPUFA supplements commenced:
≤ 20 weeks' gestation;
> 20 weeks' gestation.
4. Type of omega‐3
Comparison of the following types of omega‐3:
DHA/largely DHA;
mixed EPA/DHA;
mixed DHA/EPA/other
5. Risk of poorer maternal/perinatal outcomes
Comparison of the following risk levels with each other:
increased or high risk
low risk
any or mixed risk
For subgroup 1 type of intervention (Analysis 2) we did not restrict this analysis to the selected group of outcomes used in the other subgroup analyses. This was done to help readers to see results across all outcomes by type of omega‐3 intervention (except for longer term outcomes or other outcomes reporting multiple time points (analyses 1.63 to 1.92) which were sparsely reported).
The following outcomes were used in the other four subgroup analyses (analyses 2‐5):
preterm birth < 37 weeks;
early preterm birth < 34 weeks;
prolonged gestation (> 42 weeks);
pre‐eclampsia;
caesarean section;
length of gestation;
perinatal death;
stillbirth;
neonatal death;
low birthweight;
SGA/IUGR;
birthweight.
We assessed subgroup differences by interaction tests available within Review Manager 5 (Review Manager 2014). We reported the results of subgroup analyses quoting the Chi² statistic and P value, and the interaction test I² value.
Sensitivity analysis
We carried out sensitivity analyses (Analysis 9) to explore the effects of trial quality assessed by sequence generation and concealment of allocation, and inadequate blinding, by omitting trials rated as 'high risk of bias' or 'unclear risk of bias' for any one or more of these sources of bias, to assess whether this made any difference to the overall result. We restricted this analysis to 12 outcomes:
preterm birth < 37 weeks;
early preterm birth < 34 weeks;
prolonged gestation > 42 weeks;
pre‐eclampsia;
caesarean section;
birthweight;
perinatal death;
stillbirth;
neonatal death;
gestational age;
low birthweight;
SGA/IUGR
These outcomes are this review's three primary outcomes, plus nine secondary outcomes that were selected for use in subgroup analyses 3, 4 and 5).
Results
Description of studies
Results of the search
For this update, we assessed 447 trial reports in total. This included 406 new reports, plus we reassessed the six included studies (17 reports), 15 excluded studies (20 reports), three ongoing studies and one awaiting further classification in the previous version of the review (Makrides 2006Makrides 2006).
Where required, we reclassified some of the studies/records which were listed as excluded, ongoing or awaiting classification in the previous version of this review (Makrides 2006).
Overall, we have included 70 trials (374 reports). The six trials originally included are still included. The three trials originally listed as ongoing have reported results and are now included. Eight trials that were previously excluded are now included (either due to the enlarged scope of the review or changes in review methodology (e.g. fulfilling inclusion criteria, even if the trial does not report any of the review's prespecified outcomes)).
As of August 2018, we have:
15 excluded studies (25 reports) (Escobar 2008; Fievet 1985; Gholami 2017; Herrera 1993; Herrera 1998; Herrera 2004; Lauritzen 2004; Marangell 2004; Morrison 1984; Morrison 1986; Nishi 2016; Starling 1990; Valentine 2013; Velzing‐Aarts 2001; Yelland 2016).
23 ongoing studies (28 reports) (Albert 2017; Carlson 2017 ADORE; Carvajal 2014; de Carvalho 2017; Dos Santos 2018; Dragan 2013; FOPCHIN; Garg 2017; Garmendia 2015; Ghebremeskel 2014; Hegarty 2012; Hendler 2017; Khandelwal 2012; Kodkhany 2017; Li 2013; Makrides 2013 (ORIP); Martini 2014 (CORDHA); Mbayiwa 2016; Murff 2017 (FORTUNE); Nishi 2015 (SYNCHRO); Wang 2018; Zielinsky 2015; Zimmermann 2018).
17 studies (20 reports) awaiting further classification (Farahani 2010; Gopalan 2004; Jamilian 2018; Kadiwala 2015; Laitinen 2013; Lazzarin 2009; Parisi 2013; Pavlovich 1999; Sajina‐Stritar 1994; Sajina‐Stritar 1998; Salvig 2009; Salzano 2001; Stoutjesdijk 2014; Vahedi 2018; Vakilian 2010; Valentine 2014; Valenzuela 2017).
See Figure 1 which outlines the study flow.
1.
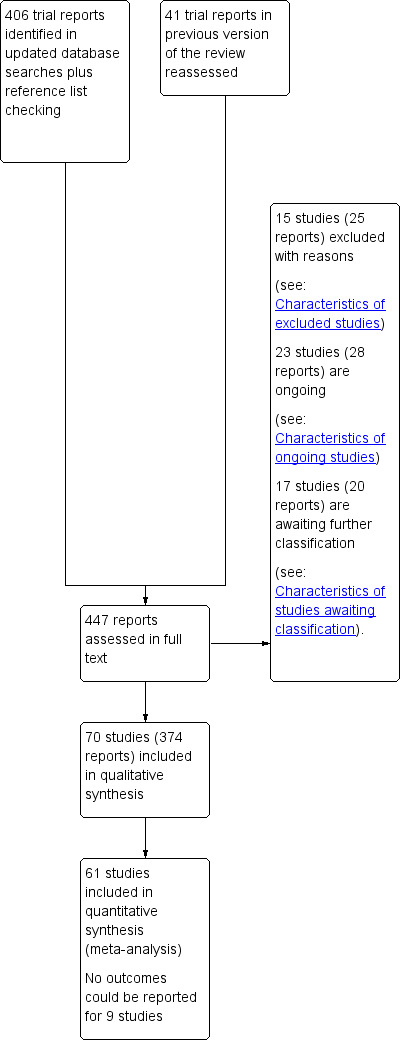
Study flow diagram.
Included studies
Following application of eligibility criteria, we included 70 RCTs comparing an omega‐3 fatty acid intervention (stand‐alone or with a co‐intervention), with placebo or no omega‐3 fatty acids in this review (Ali 2017; Bergmann 2007; Bisgaard 2016; Boris 2004; Bosaeus 2015; Bulstra‐Ramakers 1994; Carlson 2013; Chase 2015; D'Almedia 1992; de Groot 2004; Dilli 2018; Dunstan 2008; England 1989; Freeman 2008; Furuhjelm 2009; Giorlandino 2013; Gustafson 2013; Haghiac 2015; Harper 2010; Harris 2015; Hauner 2012; Helland 2001; Horvaticek 2017; Hurtado 2015; Ismail 2016; Jamilian 2016; Jamilian 2017; Judge 2007; Judge 2014; Kaviani 2014; Keenan 2014; Khalili 2016;. Knudsen 2006; Krauss‐Etschmann 2007; Krummel 2016; Laivuori 1993; Makrides 2010; Malcolm 2003; Mardones 2008; Martin‐Alvarez 2012; Miller 2016; Min 2014; Min 2016; Mozurkewich 2013; Mulder 2014; Noakes 2012; Ogundipe 2016; Oken 2013; Olsen 1992; Olsen 2000; Onwude 1995; Otto 2000; Pietrantoni 2014; Ramakrishnan 2010; Ranjkesh 2011;Razavi 2017; Rees 2008; Ribeiro 2012; Rivas‐Echeverria 2000; Samimi 2015; Sanjurjo 2004; Smuts 2003a; Smuts 2003b; Su 2008; Taghizadeh 2016; Tofail 2006; Valenzuela 2015; Van Goor 2009; Van Winden 2017; Vaz 2017).
All the included trials were individually randomised. Ten were multi‐arm trials (Bergmann 2007; Harris 2015; Jamilian 2017; Knudsen 2006; Krauss‐Etschmann 2007; Laivuori 1993; Mozurkewich 2013; Oken 2013; Razavi 2017; Van Goor 2009).
A total of 19,927 women were involved in the included trials. Knudsen 2006 was the largest trial, randomising 3098 women, followed by Makrides 2010 and Olsen 2000, in which 2399 and 1647 women, respectively, were randomised. Ribeiro 2012 was the smallest trial, randomising 11 women, followed by Van Winden 2017 and Laivuori 1993 (14 and 18 women, respectively). For the majority of the included trials, fewer women were included in analyses than were randomised.
The included trials have been published over nearly three decades ‐ from 1989 to 2018.
Review structure
The analyses in the review are structured as follows.
Overall: omega‐3 fatty acids versus placebo or no omega‐3 fatty acids (Analysis 1)
Type of intervention subgroups: omega‐3 supplementation alone; combined with food and/or advice; omega‐3 rich food; omega‐3 plus another agent ‐ all versus no omega‐3 (Analysis 2)
Dose subgroups (DHA/EPA): low (< 500 mg/day) versus mid (500 mg to 1 g/day) versus high (> 1 g/day) (Analysis 3)
Timing subgroups: gestational age when omega‐3 supplements commenced: ≤ 20 weeks' gestation versus > 20 weeks' gestation (Analysis 4)
Type of omega‐3: DHA/largely DHA; mixed EPA/DHA; mixed DHA/EPA/other (Analysis 5)
Risk subgroups: increased/high risk versus low risk versus any/mixed risk (Analysis 6)
Direct comparisons of omega‐3 doses (Analysis 7)
Direct comparisons of omega‐3 types (Analysis 8)
Sensitivity analysis (Analysis 9)
Further details are given below and in the Characteristics of included studies tables.
Settings
The 70 trials were conducted in a wide range of countries, and most (but not all) in upper‐middle or high‐income countries:
16 trials were conducted in the USA (Carlson 2013; Chase 2015; Freeman 2008; Gustafson 2013; Haghiac 2015; Harper 2010; Harris 2015; Judge 2007; Judge 2014; Keenan 2014; Krummel 2016; Miller 2016; Mozurkewich 2013; Oken 2013; Smuts 2003a; Smuts 2003b);
eight in Iran (Jamilian 2016; Jamilian 2017; Kaviani 2014; Khalili 2016; Ranjkesh 2011; Razavi 2017; Samimi 2015; Taghizadeh 2016);
six in the UK (Malcolm 2003; Min 2014; Min 2016; Noakes 2012; Ogundipe 2016; Onwude 1995);
four in the Netherlands (Bulstra‐Ramakers 1994; de Groot 2004; Otto 2000; Van Goor 2009); and four in Demark (Bisgaard 2016; Boris 2004; Knudsen 2006; Olsen 1992);
three in Australia (Dunstan 2008; Makrides 2010; Rees 2008); and three in Spain (Hurtado 2015; Martin‐Alvarez 2012; Sanjurjo 2004);
two each in Chile (Mardones 2008; Valenzuela 2015); Egypt (Ali 2017; Ismail 2016); Germany (Bergmann 2007; Hauner 2012); Italy (Giorlandino 2013; Pietrantoni 2014); Brazil (Ribeiro 2012; Vaz 2017); and Sweden (Bosaeus 2015; Furuhjelm 2009);
and one each in Angola (D'Almedia 1992); Bangladesh (Tofail 2006); Canada (Mulder 2014); Croatia (Horvaticek 2017); Finland (Laivuori 1993); Mexico (Ramakrishnan 2010); Norway (Helland 2001); South Africa (England 1989); Taiwan (Su 2008); Turkey (Dilli 2018) and Venezuela (Rivas‐Echeverria 2000).
Two of the 70 trials were performed in more than one country: Krauss‐Etschmann 2007 (Germany, Spain and Hungary); and Olsen 2000 (Denmark, Scotland, Sweden, United Kingdom, Italy, the Netherlands, Norway, Belgium and Russia). Van Winden 2017 did not report where the study was conducted.
Participants
All participants were pregnant women (and their children). Most pregnancies were singletons, with some studies specifically excluding multiple births. Characteristics of the women are summarised below, including age, parity, eligibility criteria relating to omega‐3 consumption, socioeconomic status, ethnicity, smoking status and risk of adverse pregnancy outcomes. Further details are included in the Additional tables.
Age
Where reported, the mean age of the women ranged from 22 years in Smuts 2003a to 40 years in several studies. The mean age of the women in both groups was at least 30 years in 18 of the included trials (Bergmann 2007; Bisgaard 2016; Bosaeus 2015; Dilli 2018; Dunstan 2008; Furuhjelm 2009; Hauner 2012; Jamilian 2016; Jamilian 2017; Krauss‐Etschmann 2007; Laivuori 1993; Miller 2016; Min 2014 [diabetic women]; Min 2016; Mulder 2014; Rees 2008; Su 2008; Van Goor 2009). Maternal age of women across the included trials is summarised further in Table 5.
1. Maternal age (years).
| Study ID | Omega‐3 (mean (SD)unless otherwise reported) | No omega‐3 (mean (SD)unless otherwise reported) |
| Ali 2017 | 27 (4.3) | 27 (4.8) |
| Bergmann 2007 | 30.9 (4.6) for DHA/FOS group | 30.0 (4.62) in vitamin/mineral group; 31 (4.71) for FOS group |
| Bisgaard 2016; | 32.3 (4.3) | 32.2 (4.5) |
| Boris 2004 | "The three study groups were similar in baseline characteristics with regard to maternal age at delivery (data not shown)". | |
| Bosaeus 2015 | 31.4 (3.9) | 31.2 (4.0) |
| Bulstra‐Ramakers 1994 | Not reported | |
| Carlson 2013 | 25.3 (4.9) | 24.8 (4.7) |
| Chase 2015 | Not reported | |
| D'Almedia 1992 | "Ages ranged from 14‐40 years" | |
| de Groot 2004 | 30.0 (3.3) | 29.2 (3.8) |
| Dilli 2018 | 30.9 (5.3) | 32.7 (5.9) |
| Dunstan 2008 | 30.9 (3.7) | 32.6 (3.6) |
| England 1989 | Not reported | |
| Freeman 2008 | 31.0 (5.8) | 29.7 (6.2) |
| Furuhjelm 2009 | 31.1 (4.1) | 31.7 (3.9) |
| Giorlandino 2013 | 32.6 (4.6) | 32.2 (4.8) |
| Gustafson 2013 | 25.5 (4.3) | 25.6 (4.8) |
| Haghiac 2015 | 27 (5) | 27 (5) |
| Harper 2010 | Median (interquartile range): 28 (23 ‐ 32) | Median (interquartile range): 27 (24‐32) |
| Harris 2015 | In high‐dose group 24.5 (12.72); In low‐dose group 24.3 (12.72) |
27.0 (9.05) |
| Hauner 2012 | 31.9 (4.9) | 31.6 (4.5) |
| Helland 2001 | 28.6 (3.4) | 27.6 (3.2) |
| Horvaticek 2017 | 29.8 (5.5) | 29.6 (4.8) |
| Hurtado 2015 | 30.5 (4.8) | 29.9 (4.7) |
| Ismail 2016 | 27.17 (6.34) | 26.71 (5.66) |
| Jamilian 2016 | 30.1 (5.3) | 30.0 (5.5) |
| Jamilian 2017 | 30.7 (3.5) for omega‐3 group 31.2 (4.3) for omega‐3 + vitamin D group |
30.7 (4.1) for placebo group 31.5 (7.0) for vitamin D group |
| Judge 2007 | 23.9 (4.3) | 24.7 (4.8) |
| Judge 2014 | Not reported | |
| Kaviani 2014 | 26.33 (4.2) | 25.15 (4.2) |
| Keenan 2014 | Not reported | |
| Khalili 2016 | 25.9 (4.8) | 26.9 (4.5) |
| Knudsen 2006 | 28.4 for 0.1 g/day EPA + DHA group 28.7 for 0.3 g/day EPA + DHA group 28.4 for 0.7 g/day EPA + DHA group 28.9 for 1.4 g/day EPA + DHA group 28.8 for 2.8 g/day EPA + DHA group 28.8 for 2.2g/day ALA group |
28.5 for no treatment group |
| Krauss‐Etschmann 2007 | Median (range): 30.6 (20.1 ‐ 41.1) for DHA/EPA group Median (range): 31.1 (21.5 ‐ 40.1) for DHA/EPA+folate group |
Median (range): 31.1 (18.8 ‐ 40.8) for folate group Median (range): 31.1 (18.4 ‐ 40.3) for no treatment (placebo) group |
| Krummel 2016 | 27.9 (4.6) | 26.3 (5.0) |
| Laivuori 1993 | Median (IQR): 30.3 (24‐40) | Median (IQR): 30.2 (26‐32) in placebo group; 32.0 (23‐40) in primrose oil group |
| Makrides 2010 | 28.9 (5.7) | 28.9 (5.6) |
| Malcolm 2003 | Not reported | |
| Mardones 2008 | 25.06 (5.73) | 25.11 (7.45) |
| Martin‐Alvarez 2012 | Not reported | |
| Miller 2016 | 31.7 (4.4) | 31.2 (4.4) |
| Min 2014 | Median (range): 29 (18 ‐ 42) | Median (range): 29 (18 ‐ 44) |
| Min 2014 [diabetic women] | Median (range): 34 (20 ‐ 45) | Median (range): 37 (27‐45) |
| Min 2016 | Median (range): 31.0 (21.0 ‐ 41.0) | Median (range): 32.0 (21.0 ‐ 44.0) |
| Mozurkewich 2013 | 30.6 (4.5) in DHA rich fish oil group; 29.9 (5.0) in EPA rich fish oil group | 30.4 (5.9) |
| Mulder 2014 | 32.6 (4.04) | 33.4 (3.61) |
| Noakes 2012 | 29.5 (3.94) | 28.4 (4.69) |
| Ogundipe 2016 | Not reported | |
| Oken 2013 | Median (IQR): 32.6 (27.9 ‐ 35.9) advice group; 27.6 (24.5 ‐ 32.0) advice + gift card group |
Median (IQR): 32.4 (27.7 to 34.3) |
| Olsen 1992 | 29.4 (4.4) | olive oil group 29.7 (4.3); placebo/no oil group 29.1 (4.1) |
| Olsen 2000 |
Prophylactic trials PD trial 29.3 (4.87) IUGR trial 30 (4.64) PIH trial 30.3 (7.01) Twins trial 30.2 (6.18) Therapeutic trials Threat‐PE trial 32.1 (11.7) Susp‐IUGR trial 29.3 (7.88) |
Prophylactic trials PD trial 30.0 (6.22) IUGR trial 29.0 (3.93) PIH trial 28.9 (5.32) Twins trial 30.2 (6.35) Therapeutic trials Threat‐PE trial 32.9 (14.6) Susp‐IUGR trial 29.8 (10.3) |
| Olsen 2000 [twins] | see Olsen 2000 | |
| Onwude 1995 | Mean (range): 26.6 (18‐39) | Mean (range): 26.1 (16‐40) |
| Otto 2000 | 30.3 (5.2) | 28.3 (4.85) |
| Pietrantoni 2014 | 30.86 (4.18) | 29.92 (4.80) |
| Ramakrishnan 2010 | 26.2 (4.6) | 26.3 (4.8) |
| Ranjkesh 2011 | 30.06 (7.59) | 28.96 (6.40) |
| Razavi 2017 | 29.7 (3.6) for omega‐3 group 29.9 (4.0) for omega‐3 + vitamin D group |
29.2 (3.4) for placebo group 29.9 (5.0) for vitamin D group |
| Rees 2008 | 31.2 (4.4) | 34.5 (3.8) |
| Ribeiro 2012 | Not reported | |
| Rivas‐Echeverria 2000 | Not reported | |
| Samimi 2015 | Median (range): 26.8 (18‐39) | Median (range): 26.1 (16‐40) |
| Sanjurjo 2004 | 34.5 (7.41) | 31.25 (5.18) |
| Smuts 2003a | 21.7 (4.3) | 21.6 (4.2) |
| Smuts 2003b | High DHA egg group 19.9 (4.1) | Ordinary egg group 24.8 (7.8) |
| Su 2008 | 30.9 (3.9) | 31.3 (5.7) |
| Taghizadeh 2016 | 28.6 (6.3) | 29.4 (4.4) |
| Tofail 2006 | 22.1 (4.2) | 23.4 (4.5) |
| Valenzuela 2015 | 29 (4.7) | 28.3 (6.7) |
| Van Goor 2009 | Median (range): 32.3 (22.3 ‐ 43.3) in DHA group; 31.5 (24.8 ‐ 41.4) in DHA + AA group |
Median (range): 33.5 (26.0 ‐ 40.3) |
| Van Winden 2017 | Not reported | |
| Vaz 2017 | Median (IQR): 25.5 (22.0‐34.5) | Median (IQR): 27.0 (21.0 ‐ 31.0) |
Abbreviations: IQR (interquartile range)
Parity
Five trials specifically reported parity: Rivas‐Echeverria 2000 excluded nulliparous women; Smuts 2003b excluded women with more than four prior pregnancies; Valenzuela 2015 included women with one to four prior births; Van Goor 2009 included women with a first or second pregnancy. Olsen 2000, for the prophylactic trials, included women who in an early pregnancy had experienced preterm birth (before 259 days gestation). Twenty‐eight of the trials did not report baseline information related to parity clearly (Boris 2004; Bulstra‐Ramakers 1994; Chase 2015; D'Almedia 1992; Dilli 2018; England 1989; Furuhjelm 2009; Giorlandino 2013; Gustafson 2013; Harper 2010; Harris 2015; Jamilian 2016; Jamilian 2017; Judge 2014; Kaviani 2014; Keenan 2014; Krummel 2016; Malcolm 2003; Martin‐Alvarez 2012; Miller 2016; Noakes 2012; Ogundipe 2016; Ramakrishnan 2010; Razavi 2017; Ribeiro 2012; Samimi 2015; Taghizadeh 2016; Van Winden 2017). Both nulliparous and multiparous women were included in the remaining 38 trials (Ali 2017; Bergmann 2007; Bisgaard 2016; Bosaeus 2015; Carlson 2013; de Groot 2004; Dunstan 2008; Freeman 2008; Haghiac 2015; Hauner 2012; Helland 2001 (nulliparous and primiparous only); Horvaticek 2017; Hurtado 2015; Ismail 2016; Judge 2007; Khalili 2016; Knudsen 2006; Krauss‐Etschmann 2007; Laivuori 1993; Makrides 2010; Mardones 2008; Min 2014; Min 2016; Mozurkewich 2013; Mulder 2014; Oken 2013; Olsen 1992; Olsen 2000 (therapeutic trials only); Onwude 1995; Otto 2000; Pietrantoni 2014; Ranjkesh 2011; Rees 2008; Sanjurjo 2004; Smuts 2003a; Su 2008; Tofail 2006; Vaz 2017). Detailed information relating to parity is reported in Table 6.
2. Maternal parity.
| Study ID | Omega‐3 | No omega‐3 |
| Ali 2017 | Mean (SD): 2.9 (4.8) | Mean (SD): 2.8 (1.6) |
| Bergmann 2007 | > 1: 22 (45.8%) in DHA/FOS group | > 1: 28 (57.1%) in vitamin/mineral group 24 (51.1%) in FOS group |
| Bisgaard 2016; | 1: 155 (44.8%) | 1: 166 (47.6%) |
| Boris 2004 | Not reported | |
| Bosaeus 2015 | Median (IQR): 0.5 (0,1) | Median (IQR): 0 (0,1) |
| Bulstra‐Ramakers 1994 | Not reported | |
| Carlson 2013 | Prior pregnancies, N Mean (SD): 1.2 (1.3) |
Prior pregnancies, N Mean (SD): 1.3 (1.4) |
| Chase 2015 | Not reported | |
| D'Almedia 1992 | Not reported | |
| de Groot 2004 | 0: 11 (38%) 1: 15 (52%) 2: 3 (10%) 3: 0 (0%) |
0: 12 (41%) 1: 11 (38%) 2: 5 (17%) 3: 1 (3%) |
| Dunstan 2008 | ≥ 1: 15 (45.5%) | ≥ 1: 21 (53.8%) |
| England 1989 | Not reported | |
| Freeman 2008 | Primiparous: 24 (77.4%) | Primiparous: 22 (78.6%) |
| Furuhjelm 2009 | Not reported | |
| Giorlandino 2013 | Not reported | |
| Gustafson 2013 | Not reported | |
| Haghiac 2015 | 0: 7 (28%) 1:18 (72%) |
0: 5 (21%) 1: 19 (79%) |
| Harper 2010 | Not reported | |
| Harris 2015 | Not reported | |
| Hauner 2012 | Primiparous: 55.8% | Primiparous: 61.2% |
| Helland 2001 | Mean (SD): 0.3 (0.5) | Mean (SD): 0.3 (0.5) |
| Horvaticek 2017 | Nulliparous: 25 (53%) Primiparous: 22 (47%) |
Nulliparous: 26 (60%) Primiparous: 17 (40%) |
| Hurtado 2015 | Multiparous: 35.6% | Multiparous: 31.8% |
| Ismail 2016 | Mean (SD): 1.38 (1.67) | Mean (SD): 1.53 (1.55) |
| Jamilian 2016 | Not reported | |
| Jamilian 2017 | Not reported | |
| Judge 2007 | Mean (SD): 1.5 (0.8) | Mean (SD): 1.8 (0.8) |
| Judge 2014 | Not reported | |
| Kaviani 2014 | Not reported | |
| Keenan 2014 | Not reported | |
| Khalili 2016 | 1: 38 (50.7%) 2: 28 (37.3%) ≥ 3: 9 (12.0%) |
1: 37 (49.3%) 2: 27 (36%) ≥ 3: 11 (14.7%) |
| Knudsen 2006 | Primiparous women 0.1 g/day EPA + DHA group: 257 (66.2%) 0.3 g/day EPA + DHA group: 267 (69.5%) 0.7 g/day EPA + DHA group: 244 (63.5%) 1.4 g/day EPA + DHA group: 247 (64.7%) 2.8 g/day EPA + DHA group: 246 (62.9%) 2.2 g/day ALA group: 258 (66.3%) |
Primiparous women No treatment group: 513 (66.4%) |
| Krauss‐Etschmann 2007 | < 2: 56 (86%) for DHA/EPA group; 56 (88%) for DHA/EPA+folate group 2: 7 (11%) for DHA/EPA group; 6 (9%) for DHA/EPA+folate group > 2: 2 (3%) for DHA/EPA group; 2 (3%) for DHA/EPA+folate group |
< 2: 65 (90%) for folate group; 61 (88%) for placebo group 2: 7 (10%).for folate group; 7 (10%) for placebo group > 2: 0 (0) for folate group; 1 (1%) for placebo group |
| Krummel 2016 | Not reported | |
| Laivuori 1993 | Nulliparous: 2 (66%) in fish oil group Primiparous: 1 in (33%) fish oil group |
Nulliparous: 1 (25%) in primrose oil group; 3 (75%) in placebo group Primiparous: 3 (60%) in primrose oil group; 2 (40%) in placebo group |
| Makrides 2010 | Primiparous: 471 (39.3%) | Primiparous: 474 (39.4%) |
| Malcolm 2003 | Not reported | |
| Mardones 2008 | Mean (SD): 1.68 (0.90) | Mean (SD): 1.74 (0.91) |
| Martin‐Alvarez 2012 | Not reported | |
| Miller 2016 | Not reported | |
| Min 2014 | 0: 18 (40%) 1‐3: 26 (57.8%) > 4: 1 (2.2%) |
0: 14 (35.0%) 1‐3: 23 (57.5%) > 4: 2 (5.0%) |
| Min 2014 [diabetic women] | 0: 10 (24%) 1‐3: 27 (65.9%) > 4: 3 (7.3%) |
0: 7 (14.9%) 1‐3: 32 (68.1%) > 4: 6 (12.8%) |
| Min 2016 | 0: 33 (50%) 1‐3: 27 (41%) ≥ 4: 6 (9%) |
0: 24 (35%) 1‐3: 40 (57%) ≥ 4: 5 (7%) |
| Mozurkewich 2013 | Mean (SD): 0.87 (0.83) for EPA rich fish oil group; 1.08 (0.94) for DHA rich fish oil group |
Mean (SD): 0.85 (1.2) |
| Mulder 2014 | 1: 60.6% 2: 30.8% > 2: 8.6% |
1: 47.7% 2: 36.7% > 2: 15.6% |
| Noakes 2012 | Not reported | |
| Ogundipe 2016 | Not reported | |
| Oken 2013 | Primiparous: 6 (35%) in advice group; 4 (24%) in advice + gift card group |
Primiparous: 6 (30%) in control group |
| Olsen 1992 | Primiparous: Fish oil group: 56% |
Primiparous: Olive oil group: 61% No oil group: 60% |
| Olsen 2000 |
Prophylactic trials: no nulliparous women except for: Twins trial: 52.5% nulliparous Therapeutic trials Threat‐PE trial: 71.4% nulliparous Susp‐IUGR trial: 52.0% nulliparous |
Prophylactic trials: no nulliparous women except for: Twins trial: 52.5% nulliparous Therapeutic trials Threat‐PE trial: 65.6% nulliparous Susp‐IUGR trial: 51.9% nulliparous |
| Onwude 1995 | Included primiparous and multiparous women | |
| Otto 2000 | Primiparous: 8 (67%) | Primiparous: 5 (42%) |
| Pietrantoni 2014 | 0: 46 (36%) 1: 83 (64%) |
0: 50 (40%) 1: 76 (60%) |
| Ramakrishnan 2010 | Not reported | |
| Ranjkesh 2011 | Mean (SD): 0.46 (0.50) | Mean (SD): 0.40 (0.49) |
| Razavi 2017 | Not reported | |
| Rees 2008 | Mean (SD): 1.4 (0.9) | Mean (SD): 1.6 (1.2) |
| Ribeiro 2012 | Not reported | |
| Rivas‐Echeverria 2000 | Excluded nulliparous women | |
| Samimi 2015 | Not reported | |
| Sanjurjo 2004 | Mean (SD): 1.63 (0.74) | Mean (SD): 1.38 (0.52) |
| Smuts 2003a | Nulliparous before study: 68% |
Nulliparous before study: 58% |
| Smuts 2003b | Women were excluded if they had more than 4 previous pregnancies Mean (SD): 1.9 (1.1) |
Mean (SD): 2.3 (1.9) |
| Su 2008 | Mean (SD): 1.7 (1.1) | Mean (SD): 1.8 (1.1) |
| Taghizadeh 2016 | Not reported | |
| Tofail 2006 | Women with > 2 children: 16.8% | Women with > 2 children: 31.5% |
| Valenzuela 2015 | Included women with 1‐4 prior births | |
| Van Goor 2009 | Included women with a first or second pregnancy | |
| Van Winden 2017 | Not reported | |
| Vaz 2017 | 0‐1: 26 (81.2%) ≥ 2: 6 (18.8%) |
0‐1: 18 (64.3%) ≥ 2: 10 (35.7%) |
Eligibility criteria relating to omega‐3 intake
Forty of the 70 trials reported eligibility criteria relating to omega‐3 intake, such as excluding women with an allergy to fish or fish products and/or excluding women taking omega‐3, fish oil or DHA supplements or regular/any intake of fish. However in one case, women were required to be consuming fish at least twice a week to be eligible for inclusion in the trial in addition to either omega‐3 LCPUFA supplementation or placebo (Pietrantoni 2014). See Table 7 for further details for each relevant trial.
3. Maternal omega‐3 intake criteria.
| Study | Eligibility criteria |
| Carlson 2013 | Excluded women taking ≥ 300 mg DHA a day |
| Chase 2015 | Excluded women planning to take DHA during pregnancy |
| de Groot 2004 | Excluded women consuming fish more than twice a week |
| Dunstan 2008 | Excluded women consuming fish more than twice a week |
| Freeman 2008 | Excluded women with a previous intolerance to omega‐3 fatty acids |
| Furuhjelm 2009 | Excluded women with an allergy to fish or undergoing treatment with omega‐3 fatty acid supplements |
| Giorlandino 2013 | Excluded women with an allergy to fish or regular intake of fish oil |
| Gustafson 2013 | Excluded women taking more than 200 mg DHA a day |
| Haghiac 2015 | Excluded women with an allergy to fish or fish products; women who do not eat any fish; and women with a regular intake of fish oil (> 500 mg/week in the previous 4 weeks) |
| Harper 2010 | Excluded women with an allergy to fish or fish products; and women with a regular intake of fish oil supplements (> 500 mg/week at any time during the preceding month) |
| Harris 2015 | Excluded women with allergies to fish or consumption of salmon, mackerel, rainbow trout or sardines at least weekly |
| Hauner 2012 | Excluded women taking omega‐3 supplementation before randomisation |
| Helland 2001 | Excluded women already taking DHA |
| Hurtado 2015 | Did not include women taking DHA supplements in pregnancy |
| Jamilian 2017 | Excluded women taking omega‐3 fatty acid supplements |
| Kaviani 2014 | Excluded women consuming fish more than twice a week |
| Keenan 2014 | Excluded women consuming ≥ 2 servings of sea fish a week |
| Khalili 2016 | Excluded women with an allergy to fish oil or fish products; and women consuming fish more than twice a week |
| Knudsen 2006 | Included women with only limited fish intake and who did not use fish oil capsules during pregnancy |
| Krauss‐Etschmann 2007 | Excluded women who had used fish oil supplements since the beginning of their pregnancy |
| Krummel 2016 | Excluded women who consumed > 1 fish meal/week or who used DHA‐fortified foods or supplements |
| Makrides 2010 | Excluded women who were already taking DHA supplements |
| Malcolm 2003 | Excluded women with an allergy to fish products |
| Miller 2016 | Excluded women with an allergy to seafood or fish oils |
| Min 2016 | Excluded women taking fish oil supplements |
| Mozurkewich 2013 | Excluded women taking omega‐3 fatty acid supplements and women consuming > 2 fish meals a week |
| Mulder 2014 | Excluded women taking any lipid or fatty acid supplementation |
| Noakes 2012 | included women with a diet low in oily fish (excluding canned tuna) ≤ twice per month |
| Ogundipe 2016 | Excluded women with an allergy to fish and fish oil and women previously regularly taking a preconception fish oil supplement |
| Oken 2013 | Excluded women consuming fish > 3 times a month; or with no contraindications to fish consumption such as allergy, or self‐restrictions such as a vegetarian diet |
| Olsen 1992 | Excluded women with a fish allergy or regular intake of fish oil |
| Olsen 2000 | Excluded women with a fish allergy or regular intake of fish oil |
| Pietrantoni 2014 | Only included women who consumed fish at least twice a week (equivalent to 600 g fish a week) |
| Ramakrishnan 2010 | Excluded women regularly taking fish oil or DHA supplements |
| Razavi 2017 | Excluded women taking omega‐3 fatty acid supplements |
| Rees 2008 | Excluded women taking fish oil supplements or eating more than 3 oily fish portions per week; not showing any signs of intolerance or allergy to fish |
| Ribeiro 2012 | Excluded women with any signs of intolerance or allergy to fish or using dietary supplements containing omega‐3 and omega‐6 PUFA |
| Valenzuela 2015 | Excluded women with a diet including polyunsaturated fatty acids (PUFA, ALA supplements) or LCPUFA (EPA and or DHA supplements) |
| Van Goor 2009 | Excluded women who were vegetarians or vegans |
| Vaz 2017 | Excluded women taking any oil supplementation (such as fish oil, flaxseed oil or cod liver oil) |
Socioeconomic status
The socioeconomic status of women at baseline was reported by a range of measures including, education, employment, household income, socioeconomic index, and welfare/benefit dependence. Education measures were reported by 21 trials (Bergmann 2007; Bosaeus 2015; Carlson 2013; de Groot 2004; Dunstan 2008; Freeman 2008; Gustafson 2013; Harper 2010; Hauner 2012; Helland 2001; Judge 2007; Kaviani 2014; Khalili 2016; Krummel 2016; Makrides 2010; Mardones 2008; Pietrantoni 2014; Ramakrishnan 2010; Rees 2008; Tofail 2006; Vaz 2017), with all but seven of these trials suggesting that most women had at least 12 years education ‐ see Table 8. Five trials reported other measures of socio‐economic status ‐ Bisgaard 2016 reported that 10% of participants had low incomes; D'Almedia 1992 reported that 69% of women were employed; Krauss‐Etschmann 2007 stated that 40% of fathers had no training qualifications; Oken 2013 reported that 40% of women worked full‐time and Smuts 2003a reported that "most subjects received government assistance for medical aid". The remaining 42 trials did not report socioeconomic status of participants.
4. Maternal socioeconomic status.
| Study ID | omega‐3 | no omega‐3 |
| Ali 2017 | Not reported | |
| Bergmann 2007 |
Employed: 31 (77.5%) in DHA/folate group 13 years of schooling: 32 (66.7%) in DHA/folate group |
Employed: 35 (85.4%) in Vit/Min group; 30 (78.9%) in folate group 13 years of schooling: 28 (57.1%) in Vit/Min group; 32 (68.1%) in folate group |
| Bisgaard 2016; |
Household annual income: Low: 33 (9.6%) Medium: 179 (51.9%) High: 133 (38.6%) |
Household annual income: Low: 34 (9.7%) Medium: 187 (53.6%) High: 128 (36.7%) |
| Boris 2004 | Not reported | |
| Bosaeus 2015 |
15 or more years of education: 17 (94.4%) |
15 or more years of education: 15 (88.2%) |
| Bulstra‐Ramakers 1994 | Not reported | |
| Carlson 2013 |
Maternal education: Mean (SD): 13.69 years (2.67) |
Maternal education: Mean (SD): 13.36 years (2.72) |
| Chase 2015 | Not reported | |
| D'Almedia 1992 | "Sixty‐nine percent were employed; ninety‐four percent of their husbands were employed". | |
| de Groot 2004 |
Education measured on an 8‐point scale: Mean (SD): 4.3 (1.4) |
Education measured on an 8‐point scale: Mean (SD): 3.9 (1.5) |
| Dunstan 2008 |
Maternal education: 10‐12 years: 10 (30.3%) > 12 years: 23 (69.7%) |
Maternal education: 10‐12 years: 9 (23.1%) > 12 years: 30 (76.9%) |
| England 1989 | Not reported | |
| Freeman 2008 | Maternal employment: 61.3% employed Maternal education: Mean (SD): 15.5 years ((2.1) |
Maternal employment: 60.7% employed Maternal education, Mean (SD): 14.6 years (2.2) |
| Furuhjelm 2009 | Not reported | |
| Giorlandino 2013 | Not reported | |
| Gustafson 2013 |
Maternal education: Mean (SD): 14.0 years (3.1) |
Maternal education: Mean (SD): 13.9 years (2.7) |
| Haghiac 2015 | Not reported | |
| Harper 2010 |
Maternal education: Median (IQR): 13 years (12‐16) |
Maternal education: Median (IQR): 13 years (12‐16) |
| Harris 2015 | Not reported | |
| Hauner 2012 |
Maternal education: 63.8% attended ≥ 12 years of school |
Maternal education: 69.9% attended ≥ 12 years of school |
| Helland 2001 |
Maternal education: < 10 years: 2.9% 10‐12 years: 21.4% > 12 years: 75.7% |
Maternal education: < 10 years: 1.8% 10‐12 years: 31.1% > 12 years: 67.1% |
| Horvaticek 2017 | Not reported | |
| Hurtado 2015 | Not reported | |
| Ismail 2016 | Not reported | |
| Jamilian 2016 | Not reported | |
| Jamilian 2017 | Not reported | |
| Judge 2007 |
Maternal education: Mean (SD): 12.8 years (2.2) |
Maternal education; Mean (SD): 12.2 years (1.5) |
| Judge 2014 | Not reported | |
| Kaviani 2014 |
Maternal education: < 6 years: 7.5% 6 to 9 years: 12.5% 9 to 12 years: 20% |
Maternal education: < 6 years: 7.5 % 6 to 9 years: 15% 9 to 12 years: 10% |
| Keenan 2014 | Not reported | |
| Khalili 2016 |
Maternal education: Primary school (1‐5 years): 14 (18.7%) Seconday school (6‐8 years): 23 (30.7%) High school (9‐12 years): 33 (44.0%) University (> 12 years): 5 (6.7%) Family income: Adequate: 15 (20%) Relatively adequate: 44 (58.7%) Non adequate: 16 (21.3%) |
Maternal education: Primary school (1‐5 years): 15 (20.0%) Seconday school (6‐8 years): 14 (18.7%) High school (9‐12 years): 39 (52.0%) University (> 12 years): 7 (9.3%) Family income; Adequate: 13 (17.3%) Relatively adequate: 50 (66.7%) Non adequate: 12 (16.0%) |
| Knudsen 2006 | Not reported | |
| Krauss‐Etschmann 2007 |
Job training of father: None: 29 (45%) for DHA/EPA group; 17 (27%) for DHA/EPA+folate group Apprenticeship: 14 (22%) for DHA/EPA group; 19 (31%) for DHA/EPA+folate group University degree: 15 (23%) for DHA/EPA group; 21 (34%) for DHA/EPA+folate group |
Job training of father: None: 33 (47%) for folate group; 27 (40%) for placebo group Apprenticeship: 10 (14%) for folate group; 14 (21%) for placebo group University degree: 24 (34%) for folate group; 20 (29%) for placebo group |
| Krummel 2016 |
Education: Mean (SD): 14.8 years (2.1) |
Education: Mean (SD): 14.9 years (3.2) |
| Laivuori 1993 | Not reported | |
| Makrides 2010 | Mother completed secondary education: 755 (63.1%) Mother completed further education: 816 (68.2%) MSSI score: median 28.5, IQR (25.0 ‐ 31.0) |
Mother completed secondary education: 760 (63.2%) Mother completed further education: 824 (68.6%) MSSI score: median 29.0, IQR (25.0 ‐ 31.0) |
| Malcolm 2003 | Not reported | |
| Mardones 2008 |
Education: > 8 years: 82.1% ESOMAR classification: AB (high level): 0.5% CA (medium level): 4.4% CB (medium level): 34.9% D (medium ‐ low level): 40.4% E (low level): 19.8% |
Education: > 8 years: 80.7% ESOMAR classification: AB (high level): 0.3% CA (medium level): 4.2% CB (medium level): 33.4% D (medium ‐ low level): 44.6% E (low level): 17.5% |
| Martin‐Alvarez 2012 | Not reported | |
| Miller 2016 | Not reported | |
| Min 2014 | Not reported | |
| Min 2014 [diabetic women] | Not reported | |
| Min 2016 | Not reported | |
| Mozurkewich 2013 | Not reported | |
| Mulder 2014 | Not reported | |
| Noakes 2012 | Not reported | |
| Ogundipe 2016 | Not reported | |
| Oken 2013 |
Working full time: 6 (35%) for advice to eat fish group; 9 (50%) for advice to eat fish + gift card group |
Working full time: 7 (35%) for control group |
| Olsen 1992 | Not reported | |
| Olsen 2000 | Not reported | |
| Olsen 2000 [twins] | see Olsen 2000 | |
| Onwude 1995 | Not reported | |
| Otto 2000 | Not reported | |
| Pietrantoni 2014 |
High school or university degree: 129 (100%) Average socioeconomic status (not defined): 129 (100%) |
High school or university degree: 126 (100%) Average socioeconomic status (not defined): 126 (100%) |
| Ramakrishnan 2010 | High school education or above: 56.6% | High school education or above: 59.5% |
| Ranjkesh 2011 | Not reported | |
| Razavi 2017 | Not reported | |
| Rees 2008 |
Maternal education: Mean (SD): 14.5 years (3.5) |
Maternal education: Mean (SD): 15.3 (2.9) |
| Ribeiro 2012 | Not reported | |
| Rivas‐Echeverria 2000 | Not reported | |
| Samimi 2015 | Not reported | |
| Sanjurjo 2004 | Not reported | |
| Smuts 2003a | "Most subjects received government assistance for medical care" | |
| Smuts 2003b | Not reported | |
| Su 2008 | Not reported | |
| Taghizadeh 2016 | Not reported | |
| Tofail 2006 |
Mostly low‐income participants Mothers with > 5 years of schooling: 36.8% Working mothers: 16.0 Fathers with stable job: 65.6 Family income (taka/month, 1 USD = 59 taka): 64.0 |
Mostly low‐income participants Mothers with > 5 years of schooling: 32.3% Working mothers: 12.1% Fathers with stable job: 65.3% Family income (taka/month, 1 USD = 59 taka): 54.0 |
| Valenzuela 2015 |
SES assessed using the ESOMAR criteria: High: 5.3% Medium: 73.7% Low: 21.1% |
SES assessed using the ESOMAR criteria: High: 19.0% Medium: 66.7% Low: 14.3% |
| Van Goor 2009 | Not reported | |
| Van Winden 2017 | Not reported | |
| Vaz 2017 |
Family income, not further defined: US $263.2 (181.9‐383.0) Maternal education: Median (IQR): 11.0 years (7.0 ‐ 11) |
Family income (US $) not further defined: US $304.1 (180.7 ‐ 379.8) Maternal education: Median (IQR): 8.0 years (7.5 ‐ 10.5) |
Abbreviations: DHA: docosahexaenoic acid; EPA: eicosapentaenoic acid; ESOMAR: European Society for Opinion and Marketing Research; IQR: interquartile range; MSSI: maternal social support index; SD: standard deviation; SES: socioeconomic status
Ethnicity or race
Most trials (46) reported no baseline information on ethnicity or race, though they did report the country where the study was conducted (with the exception of Van Winden 2017). Ten trials reported a mix of ethnicities, nine trials reported including only Caucasian women (understood to be white women) or women of similar ethnicities; two trials included African women, and one trial each reported including African‐American women or Hispanic women ‐ see Table 9.
5. Maternal ethnicity.
| Study ID | Omega‐3 | No omega‐3 |
| Ali 2017 | Not reported (study conducted in Egypt) | |
| Bergmann 2007 | "Caucasian women" | |
| Bisgaard 2016 | Caucasian: 333 (96.2%) |
Caucasian: 332 (95.1%) |
| Boris 2004 | Not reported (conducted in Denmark) | |
| Bosaeus 2015 | Women of European descent | |
| Bulstra‐Ramakers 1994 | Not reported (study conducted in the Netherlands) | |
| Carlson 2013 | Hispanic: 8% Not Hispanic: 92% |
Hispanic: 8% Not Hispanic 92% |
| African‐American: 38% | ||
| Chase 2015 | Maternal ethnicity not reported; reported that 98% of included infants were white |
Maternal ethnicity not reported; reported that 93% of included infants were white |
| D'Almedia 1992 | Not reported (conducted in Angola) | |
| de Groot 2004 | "White women" | |
| Dunstan 2008 | Caucasian women | |
| England 1989 | Not reported (conducted in South Africa) | |
| Freeman 2008 | Not reported (conducted in USA) | |
| Furuhjelm 2009 | Not reported (conducted in Sweden) | |
| Giorlandino 2013 | Not reported (conducted in Italy) | |
| Gustafson 2013 | 28% African‐American (conducted in USA) | |
| Haghiac 2015 | African American: 11 (44%) Caucasian: 10 (40%) Other (e.g. Hispanic or Asian): 4 (16%) |
African American: 6 (25%) Caucasian: 11 (46%) Other (e.g. Hispanic or Asian): 7 (29%) |
| Harper 2010 | African American: 148 (34.1%) White: 245 (56.5%) Asian: 13 (3.0%) Other: 28 (6.5%) Hispanic/Latina ethnicity: 64 (14.7%) |
African American: 145 (34.9%) White: 240 (57.7%) Asian: 5 (1.2%) Other: 26 (6.3%) Hispanic/Latina ethnicity: 57 (13.6%) |
| Harris 2015 | Not reported (conducted in USA) | |
| Hauner 2012 | Not reported (conducted in Germany) | |
| Helland 2001 | Not reported (conducted in Norway) | |
| Horvaticek 2017 | Not reported (conducted in Croatia) | |
| Hurtado 2015 | Not reported (conducted in Spain) | |
| Ismail 2016 | Not reported (conducted in Egypt) | |
| Jamilian 2016 | Not reported (conducted in Iran) | |
| Jamilian 2017 | Not reported (conducted in Iran) | |
| Judge 2007 | Not reported (conducted in USA) | |
| Judge 2014 | Not reported (conducted in USA) | |
| Kaviani 2014 | Not reported (conducted in Iran) | |
| Keenan 2014 | African American women | |
| Khalili 2016 | Not reported (conducted in Iran) | |
| Knudsen 2006 | Not reported (conducted in Denmark) | |
| Krauss‐Etschmann 2007 | Not reported (conducted in Spain, Germany or Hungary) | |
| Krummel 2016 | African American: 12 (37.5%) White: 20 (62.5%) |
African American: 15 (53.6%) White: 13 (46.4%) |
| Laivuori 1993 | Not reported (conducted in Finland) | |
| Makrides 2010 | Not reported (conducted in Australia) | |
| Malcolm 2003 | Not reported (conducted in UK) | |
| Mardones 2008 | "mainly ethnically mixed (American and Hispanic)" | |
| Martin‐Alvarez 2012 | Not reported (conducted in Spain) | |
| Miller 2016 | African American: 1 (1.7%) Caucasian: 55 (92%) Hispanic: 2 (3%) Asian: 1 (1.67%) Other: 1 (1.67%) |
African American: 0 (0%) Caucasian: 52 (95%) Hispanic: 2 (3%) Asian: 1 (2%) Other: 0 (0%) |
| Min 2014 | Asian: 16 (35.6%) African/Afro‐Caribbean: 10 (22.2%) Caucasian: 13 (28.9%) Others: 6 (13.3%) |
Asian: 18 (45.0%) African/Afro‐Caribbean: 14 (35.0%) Caucasian: 6 (15.0%) Others: 2 (5.0%) |
| Min 2014 [diabetic women] | Asian: 18 (43.9%) African/Afro‐Caribbean: 15 (36.6%) Caucasian: 5 (12.2%) Others: 3 (7.3%) |
Asian: 27 (57.5%) African/Afro‐Caribbean: 10 (21.3%) Caucasian: 5 (10.6%) Others: 5 (10.6%) |
| Min 2016 | Asian: 40 (60%) African/Afro‐Caribbean: 18 (27%) Caucasian: 5 (7%) Others: 4 (7%) |
Asian: 44 (62%) African/Afro‐Caribbean: 18 (25%) Caucasian: 5 (7%) Others: 4 (6%) |
| Mozurkewich 2013 | White: 33 (85%) for EPA‐rich group; 29 (76%) for DHA‐rich group African‐American: 4 (10%) for EPA‐rich group; 4 (11%) for DHA‐rich group Hispanic‐Latina: 0 (0%) for EPA‐rich group; 4 (11%) for DHA‐rich group Asian: 1 (3%) for EPA‐rich group; 1 (3%) for DHA‐rich group American Indian or Alaska Native: 0 (0%) for EPA‐rich group; 0 (0) for DHA‐rich group Native Hawaiian or other Pacific ethnicity: 1 (3) for EPA‐rich group; 0 (0%) for DHA‐rich group |
White: 34 (83%) African‐American: 2 (5%) Hispanic‐Latina: 3 (7%) Asian: 1 (2%) American Indian or Alaska Native: 1 (2%) Native Hawaiian or other Pacific ethnicity: 0 (0%) |
| Mulder 2014 | White: 73.1% Non‐white: 26.9% |
White: 73.9% Non‐white: 26.1% |
| Noakes 2012 | Not reported (conducted in UK) | |
| Ogundipe 2016 | Not reported (conducted in UK) | |
| Oken 2013 | White: 9 (50%) advice only group; 9 (53%) advice+voucher group Black: 2 (11%) advice only group; 2 (12%) advice+voucher group Asian: 2 (11%) advice only group; 1 (6%) advice+voucher group Hispanic/other: 5 (28%) advice only group; 5 (29%) advice+voucher group |
White: 9 (45%) Black: 2 (10%) Asian: 3 (15%) Hispanic/other: 6 (30%) |
| Olsen 1992 | Not reported (conducted in Denmark) | |
| Olsen 2000 | Not reported (conducted in Denmark, Scotland, Sweden, England, Italy, Netherlands, Norway, Belgium and Russia) | |
| Olsen 2000 [twins] | See Olsen 2000 | |
| Onwude 1995 | Not reported (conducted in UK) | |
| Otto 2000 | Not reported (conducted in the Netherlands) | |
| Pietrantoni 2014 | Caucasians | |
| Ramakrishnan 2010 | Not reported (conducted in Mexico) | |
| Ranjkesh 2011 | Not reported (conducted in Iran) | |
| Razavi 2017 | Not reported (conducted in Iran) | |
| Rees 2008 | Not reported (conducted in Australia) | |
| Ribeiro 2012 | Not reported (conducted in Brazil) | |
| Rivas‐Echeverria 2000 | Not reported (conducted in Venezuela) | |
| Samimi 2015 | Not reported (conducted in Iran) | |
| Sanjurjo 2004 | Not reported (conducted in Spain) | |
| Smuts 2003a | African:104 (73%) Other: 38 (27%) |
African: 109 (73%) Other: 40 (27%) |
| Smuts 2003b | African: 15 (83%) Other: 3 (17%) |
African: 15 (78%) Other: 4 (22%) |
| Su 2008 | Not reported (conducted in Taiwan) | |
| Taghizadeh 2016 | Not reported (conducted in Iran) | |
| Tofail 2006 | Not reported (conducted in India) | |
| Valenzuela 2015 | Hispanic: 19 (100%) | Hispanic: 21 (100%) |
| Van Goor 2009 | Not reported (conducted in the Netherlands) | |
| Van Winden 2017 | Neither ethnicity, race or country where study conducted reported | |
| Vaz 2017 | White: 13 (40.6%) Non‐white: 19 (59.4%) |
White: 5 (17.9%) Non‐white: 23 (82.1%) |
Smoking
Thirteen trials reported excluding women who smoked. Twenty‐three trials reported smoking rates in pregnancy ranged from several per cent to nearly 50% in one trial. The remaining 35 trials did not report maternal smoking status, see Table 10.
6. Maternal smoking status.
| Study ID | Omega‐3 | No omega‐3 | |
| Ali 2017 | Smokers were excluded | ||
| Bergmann 2007 | Smokers were excluded | ||
| Bisgaard 2016 | Smoking during pregnancy: 21 (6.1%) | Smoking during pregnancy: 33 (9.5%) | |
| Boris 2004 | "The three study groups were similar in baseline characteristics with regard to... percentage of smokers (data not shown)". | ||
| Bosaeus 2015 | Not reported | ||
| Bulstra‐Ramakers 1994 | Not reported | ||
| Carlson 2013 | History of smoking: 41% Smoking during pregnancy: 30% |
History of smoking: 45% Smoking during pregnancy: 38% |
|
| Chase 2015 | Not reported | ||
| D'Almedia 1992 | Not reported | ||
| de Groot 2004 |
Smoking at 14 weeks GA: Yes: 4 (14%) |
Smoking at 14 weeks GA: Yes: 10 (34%) |
|
| Dilli 2018 | 15 (28%) | 24 (35%) | |
| Dunstan 2008 | Smokers were excluded | ||
| England 1989 | Not reported | ||
| Freeman 2008 | Not reported | ||
| Furuhjelm 2009 |
Exposure to smoke: (at least 1 of immediate family a smoker) 9 (17%) |
Exposure to smoke: (at least 1 of immediate family a smoker) 11 (17%) |
|
| Giorlandino 2013 | Maternal smoking at baseline: 50% | Maternal smoking at baseline: 48% | |
| Gustafson 2013 | Not reported | ||
| Haghiac 2015 | Not reported | ||
| Harper 2010 | Smoking during pregnancy: 64 (15%) | Smoking during pregnancy: 72 (17%) | |
| Harris 2015 | Not reported | ||
| Hauner 2012 | Smoking before pregnancy: 16% | Smoking before pregnancy: 24% | |
| Helland 2001 | Smoking: 16% | Smoking: 22% | |
| Horvaticek 2017 | Not reported | ||
| Hurtado 2015 | Not reported | ||
| Ismail 2016 | Not reported | ||
| Jamilian 2016 | Smokers were excluded | ||
| Jamilian 2017 | Smokers were excluded | ||
| Judge 2007 | Smokers were excluded | ||
| Judge 2014 | Not reported | ||
| Kaviani 2014 | Smokers were excluded | ||
| Keenan 2014 | Regular smokers were excluded | ||
| Khalili 2016 | Not reported | ||
| Knudsen 2006 |
Smoked during pregnancy 0.1 g/day EPA + DHA group: 79 (20.3%) 0.3 g/day EPA + DHA group: 78 (20.3%) 0.7 g/day EPA + DHA group: 78 (20.3%) 1.4 g/day EPA + DHA group: 79 (20.6%) 2.8 g/day EPA + DHA group: 78 (19.9%) 2.2g/day ALA group: 79 (20.3%) |
Smoked during pregnancy 160 (20.7%) |
|
| Krauss‐Etschmann 2007 |
Smoking at study entry Yes: 8 (12%) for DHA/EPA group; 9 (14%) for DHA/EPA + Folate group |
Smoking at study entry Yes: 5 (7%) for Folate group; 9 (13%) for placebo group |
|
| Krummel 2016 | "Current or previous use of tobacco" an exclusion criteria | ||
| Laivuori 1993 | Not reported | ||
| Makrides 2010 |
Smoking at trial entry or leading up to pregnancy 358 (29.9%) |
Smoking at trial entry or leading up to pregnancy 407 (33.9%) |
|
| Malcolm 2003 | Not reported | ||
| Mardones 2008 | Not reported | ||
| Martin‐Alvarez 2012 | Not reported | ||
| Miller 2016 | Not reported | ||
| Min 2014 |
Smoker 6 (13%) |
Smoker 0 (0%) |
|
| Min 2014 [diabetic women] |
Smoker 2 (4%) |
Smoker 0 (0%) |
|
| Min 2016 |
Smoker 2 (3%) |
Smoker 0 (0%) |
|
| Mozurkewich 2013 | Not reported | ||
| Mulder 2014 | Not reported | ||
| Noakes 2012 | Not reported | ||
| Ogundipe 2016 | Not reported | ||
| Oken 2013 |
Never smoker 14 (78%) in advice group; 12 (71%) in advice+gift card group |
Never smoker 14 (70%) in control group |
|
| Olsen 1992 |
Smokers Fish oil group: 33% |
Smokers Olive oil group: 29% No oil group: 33% |
|
| Olsen 2000 |
Smoker Prophylactic trials Earl‐PD trial 45% Earl‐IUGR trial 52% Earl‐PIH trial 19% Twins trial 33% Therapeutic trials Threat‐PE trial 18% Susp‐IUGR trial 31% |
Smoker Prophylactic trials Earl‐PD trial 41% Earl‐IUGR 52% Earl‐PIH trial 24% Twins trial 29% Therapeutic trials Threat‐PE trial 21% Susp‐IUGR trial 30% |
|
| Onwude 1995 |
Current smoker 42 (37%) |
Current smoker 32 (27%) |
|
| Otto 2000 | Not reported | ||
| Pietrantoni 2014 | Smokers were excluded | ||
| Ramakrishnan 2010 | Not reported | ||
| Ranjkesh 2011 | Not reported | ||
| Razavi 2017 | Smokers were excluded | ||
| Rees 2008 |
Smoker 0 (0%) |
Smoker 3 (23%) |
|
| Ribeiro 2012 | Not reported | ||
| Rivas‐Echeverria 2000 | Not reported | ||
| Samimi 2015 | Smokers were excluded | ||
| Sanjurjo 2004 |
Smoker 1 (13%) |
Smoker 2 (25%) |
|
| Smuts 2003a | Smoker before pregnancy: 46.8% Smoker during pregnancy: 27.0% |
Smoker before pregnancy: 38.2% Smoker during pregnancy: 21.5% |
|
| Smuts 2003b | Not reported | ||
| Su 2008 | Not reported | ||
| Taghizadeh 2016 | Smokers were excluded | ||
| Tofail 2006 | Not reported | ||
| Valenzuela 2015 | Not reported | ||
| Van Goor 2009 | Not reported | ||
| Van Winden 2017 | Not reported | ||
| Vaz 2017 | Not reported | ||
Women at risk
We defined increased/high risk as any factors which might increase the risk of adverse maternal and birth outcomes; these baseline risks included being at risk of pre‐eclampsia, having a previous preterm birth, gestational diabetes mellitus (GDM), being overweight/obese or underweight, or being at risk of poor mental health ‐ see Table 11.We classified trials into increased/high risk (34 trials); any or mixed risk (8 trials) and low risk (29 trials). One trial reported women with GDM and low risk women separately (Min 2014). We also performed a subgroup analysis based on risk (see Analysis 6 and results text).
7. Maternal risk.
| Study ID | All women included in the study |
| Ali 2017 | Increased/high‐risk (pregnancy complicated with asymmetrical IUGR) |
| Bergmann 2007 | Low‐risk (healthy women) |
| Bisgaard 2016 | Any/mixed risk (not reported) |
| Boris 2004 | Low‐risk (healthy women) |
| Bosaeus 2015 | Low‐risk (healthy women) |
| Bulstra‐Ramakers 1994 | Increased/high‐risk (women with a history of IUGR with or without PIH in the previous pregnancy) |
| Carlson 2013 | Low‐risk (healthy women) |
| Chase 2015 | Increased/high‐risk (Infants at risk of T1D (e.g. mothers with T1D) |
| D'Almedia 1992 | Mixed risk (21% of all included women had a history of PIH, and 4% a history of preterm birth) |
| de Groot 2004 | Low‐risk (healthy women) |
| Dilli 2018 | Increased/high risk (women with GDM) |
| Dunstan 2008 | Low‐risk (history of physician‐diagnosed allergic rhinitis and/or asthma and 1 or more positive skin prick test to common allergens, but who were otherwise healthy) |
| England 1989 | Increased/high‐risk (women with severe gestational proteinuric hypertension |
| Freeman 2008 | Increased/high‐risk (pregnant and postpartum women with a major depressive order) |
| Furuhjelm 2009 | Low‐risk (pregnant women affected by allergy themselves, of having a husband or previous child with allergies, otherwise healthy) |
| Giorlandino 2013 | Increased/high‐risk (pregnancy women with a history of IUGR, fetal demise or pre‐eclampsia) |
| Gustafson 2013 | Low‐risk (healthy women) |
| Haghiac 2015 | Increased/high‐risk: (overweight or obese (BMI ≥ 25) |
| Harper 2010 | Increased/high‐risk (women with at least 1 prior spontaneous preterm birth) |
| Harris 2015 | Low‐risk (healthy women) |
| Hauner 2012 | Low‐risk (healthy women) |
| Helland 2001 | Low‐risk (healthy women) |
| Horvaticek 2017 | Increased/high‐risk (pregnant women with T1D) |
| Hurtado 2015 | Low‐risk (healthy women) |
| Ismail 2016 | Increased/high‐risk (oligohydramnios at 30‐34 weeks GA) |
| Jamilian 2016 | Increased/high‐risk (women with GDM) |
| Jamilian 2017 | Increased/high‐risk (women with GDM) |
| Judge 2007 | Low‐risk (healthy women) |
| Judge 2014 | Low‐risk (healthy women) |
| Kaviani 2014 | Increased/high‐risk (women diagnosed with mild depression) |
| Keenan 2014 | Increased/high‐risk (women living in urban low‐income environments) |
| Khalili 2016 | Low‐risk (healthy women) |
| Knudsen 2006 | Any/mixed risk (not reported) |
| Krauss‐Etschmann 2007 | Low‐risk (healthy women) |
| Krummel 2016 | Increased/high‐risk (all women overweight or obese) |
| Laivuori 1993 | Increased/high‐risk (women with pre‐eclampsia) |
| Makrides 2010 | Any/mixed risk |
| Malcolm 2003 | Low‐risk (healthy women) for final outcomes (any/mixed risk for preterm birth outcome) |
| Mardones 2008 | Increased/high‐risk (all included women underweight (BMI ≤ 21.2kg/m 2 at 10 weeks GA)) |
| Martin‐Alvarez 2012 | Any/mixed risk (not reported) |
| Miller 2016 | Any/mixed risk |
| Min 2014 | Low‐risk (healthy women) |
| Min 2014 [diabetic women] | Increased/high‐risk (women diagnosed with Type 2 diabetes) |
| Min 2016 | Increased/high‐risk (women with GDM) |
| Mozurkewich 2013 | Increased/high‐risk (women with a history of depression) |
| Mulder 2014 | Low‐risk (healthy women) |
| Noakes 2012 | Low‐risk (women with a history of allergy, atopy or asthma) |
| Ogundipe 2016 | Increased/high‐risk: (women at risk of developing pre‐eclampsia, fetal growth restriction, gestational diabetes) |
| Oken 2013 | Any/mixed risk |
| Olsen 1992 | Low‐risk (healthy women) |
| Olsen 2000 | Increased/high‐risk (previous preterm birth or IUGR in previous pregnancy or pregnancy‐induced hypertension or twins in current pregnancy; threatening pre‐eclampsia or ultrasonically estimated fetal weight below the 10th centile) |
| Olsen 2000 [twins] | See Olsen 2000 |
| Onwude 1995 | Increased/high‐risk (primigravida with abnormal Doppler blood flow, previous birthweight < 3rd centile, PIH, previous unexplained stillbirth) |
| Otto 2000 | Low‐risk (healthy women) |
| Pietrantoni 2014 | Low‐risk (healthy women) |
| Ramakrishnan 2010 | Low‐risk (healthy women) |
| Ranjkesh 2011 | Increased/high‐risk (women at high risk for pre‐eclampsia) |
| Razavi 2017 | Increased/high‐risk (women diagnosed with GDM) |
| Rees 2008 | Increased/high‐risk (current episode of major depression or dysthymia) |
| Ribeiro 2012 | Any/mixed (not reported) |
| Rivas‐Echeverria 2000 | Increased/high‐risk (women at risk of pre‐eclampsia) |
| Samimi 2015 | Increased/high‐risk (women with GDM) |
| Sanjurjo 2004 | Low‐risk (healthy women) |
| Smuts 2003a | Low‐risk (healthy women) |
| Smuts 2003b | Low‐risk (healthy women) |
| Su 2008 | Increased/high‐risk (women diagnosed with major depressive disorder between 16 weeks and 32 weeks GA) |
| Taghizadeh 2016 | Increased/high‐risk (women with GDM) |
| Tofail 2006 | Increased/high‐risk (low income; 28% women undernourished) |
| Valenzuela 2015 | Low‐risk ("women free from any known diseases that could affect fetal growth") |
| Van Goor 2009 | Low‐risk (healthy women) |
| Van Winden 2017 | Increased/high‐risk (women with GDM) |
| Vaz 2017 | Increased/high‐risk (pregnant women classified at risk for postpartum depression) |
Abbreviations: ADA: American Diabetes Association; BMI: body mass index; GA: gestational age; GDM: gestational diabetes mellitus; IUGR: intrauterine growth restriction; OGTT: oral glucose tolerance test; PIH: pregnancy‐induced hypertension; PPD: postpartum depression
Interventions
Overall analysis (Analysis 1)
Each of the 70 included trials compared an omega‐3 fatty acid intervention (stand‐alone or with a co‐intervention); including 10 trials with a food or dietary advice component), with placebo or no omega‐3 fatty acids, with 60 trials contributing data for this review.
Intervention type subgroup (Analysis 2)
As there was considerable variation between trials, we have subgrouped results by four main types of intervention (in addition to the overall analysis):
Intervention type 1: Omega‐3 supplements only versus placebo or no omega‐3 fatty acids (50 trials) (Bisgaard 2016; Boris 2004; Bulstra‐Ramakers 1994; Carlson 2013; Chase 2015; Dilli 2018; Dunstan 2008; England 1989; Freeman 2008; Furuhjelm 2009; Giorlandino 2013; Gustafson 2013; Haghiac 2015; Harris 2015; Helland 2001; Horvaticek 2017; Ismail 2016; Jamilian 2016; Jamilian 2017*; Judge 2007; Judge 2014; Kaviani 2014; Keenan 2014; Khalili 2016; Knudsen 2006; Krummel 2016; Laivuori 1993; Makrides 2010; Malcolm 2003; Miller 2016; Min 2014; Min 2016; Mozurkewich 2013; Mulder 2014; Olsen 1992; Olsen 2000; Onwude 1995; Ramakrishnan 2010; Ranjkesh 2011; Razavi 2017*; Rees 2008; Ribeiro 2012; Samimi 2015; Sanjurjo 2004; Su 2008; Tofail 2006; Valenzuela 2015; Van Goor 2009; Van Winden 2017; Vaz 2017)
Most of these trials compared oral DHA and/or EPA (or mainly DHA/EPA) supplements with placebo or no omega‐3 treatment. Four trials compared unspecified or other oral omega‐3 fatty acid supplements with placebo or no omega‐3 (Laivuori 1993; Ribeiro 2012; Samimi 2015; Valenzuela 2015), and one trial compared vaginal omega‐3 supplementation with placebo (Giorlandino 2013). Some trials reported including small amounts of other agents in the intervention arm (e.g. vitamin E) but we judged these to have minimal effect on outcomes.
Intervention type 2: Omega‐3 supplements/enrichment plus food/dietary advice versus placebo or no omega‐3 fatty acids (7 trials) (de Groot 2004; Hauner 2012; Hurtado 2015; Martin‐Alvarez 2012; Pietrantoni 2014; Smuts 2003a; Smuts 2003b)
Intervention type 3: Omega‐3 food/dietary advice only versus placebo or no omega‐3 fatty acids (3 trials): (Bosaeus 2015; Noakes 2012; Oken 2013)
Intervention type 4: Omega‐3 supplements plus other agents versus placebo or no omega‐3 fatty acids (12 trials): the other agents used in these 12 trials were as follows.
arachidonic acid (AA) (Otto 2000; Van Goor 2009)
Aspirin (Ali 2017)
Aspirin + vitamins C + E (Rivas‐Echeverria 2000)
Folate (Krauss‐Etschmann 2007)
Gamma‐linolenic acid (GLA) (D'Almedia 1992)
multiple micronutrients (Mardones 2008)
Prebiotics (Bergmann 2007)
Progesterone (Harper 2010)
Vitamin D (Jamilian 2017*; Razavi 2017*)
Vitamin E (high amounts) Taghizadeh 2016.
Jamilian 2017* and Razavi 2017* are multi‐arm trials that span two of the above four intervention categories.
Multi‐arm trials
Ten trials had multi‐arm designs. We combined relevant groups in the multi‐arm trials to create appropriate single pair‐wise comparisons for inclusion in the main comparison, avoiding unit of analysis errors, specifically:
Bergmann 2007: three arms (DHA/EPA + prebiotic versus prebiotic + vitamin/mineral versus vitamin/mineral); analysed as DHA/EPA + prebiotic versus the other two arms combined (prebiotic/vitamin/mineral and vitamin/mineral) in the overall comparison (Analysis 1).
Harris 2015: three arms (300 g/day DHA versus 600 g/day DHA versus placebo); analysed as 300 g/day + 600 g/day combined versus placebo for the overall comparison (Analysis 1); we split doses in the dose subgroups (Analysis 3), and compared 300 g/day and 600 g/day directly in Analysis 8.
Krauss‐Etschmann 2007: four arms (DHA + EPA versus DHA + EPA + folate versus folate versus placebo, all using milk‐based sachets); analysed as DHA + EPA and DHA + EPA + folate groups combined, compared with placebo and folate only combined.
Jamilian 2017: four arms (DHA + EPA versus DHA + EPA + vitamin D versus vitamin D + placebo) ‐ data from this trial were not included (no review outcomes reported).
Knudsen 2006: seven arms (five different doses of DHA + EPA versus ALA versus no treatment/flax oil); analysed as six omega‐3 groups combined versus no treatment/flax oil for the overall comparison (Analysis 1); omega‐3 groups combined in two dose groups, < 1 g/day and ≥ 1 g/day in the direct dose comparison (Analysis 7); DHA + EPA versus ALA in the omega‐3 supplement type direct comparison (Analysis 8).
Laivuori 1993: three arms (DHA + EPA + other omega‐3 versus linoleic acid (LA)/GLA versus placebo) ‐ data from this trial were not included (no outcomes able to be used).
Mozurkewich 2013: three arms (mainly DPA versus mainly EPA versus placebo); DPA + EPA groups pooled in analysis 1; DPA versus mainly EPA groups included in omega‐3 supplement type comparison (Analysis 8).
Oken 2013: three arms (voucher to purchase fish plus advice on which fish to consume versus advice on fish consumption only versus generic dietary advice only); analysed as intervention arms pooled versus generic dietary advice only.
Razavi 2017 four arms (DHA + EPA versus DHA + EPA + vitamin D versus vitamin D versus placebo); two arms (DPA + EPA and DHA + EPA + vitamin D) pooled and compared with placebo in analysis.
Van Goor 2009: three arms (DHA + AA versus DHA versus placebo); intervention arms pooled and compared with placebo for overall comparison (Analysis 1) and other analyses except for DHA + AA versus DHA for direct omega‐3 supplement type comparison (Analysis 8).
For additional details on the omega‐3 fatty acid interventions and how they varied across the trials see Characteristics of included studies.
Comparisons
Most comparisons were between omega‐3 LCPUFA and placebo/no omega‐3. As well as contributing to the main omega‐3 versus no omega‐3 comparison in Analysis 1, five of the multi‐arm trials contributed outcomes from direct comparisons of omega‐3 supplement doses or omega‐3 supplements for inclusion in the meta‐analysis:
Omega‐3 supplement dose comparisons: two trials: Harris 2015 compared 600 mg versus 300 mg DHA/day; Knudsen 2006 compared six different doses which we collapsed into a comparison of < 1 g/day versus ≥ 1 g/day (see Analysis 7).
Omega‐3 supplements versus other omega‐3 supplements: three trials: Knudsen 2006 compared EPA/DHA (five doses combined) versus ALA; Mozurkewich 2013 compared DHA versus EPA; and Van Goor 2009 compared DHA versus DHA/AA combined (see Analysis 8).
Subgroup analyses
Dose subgroup ‐ DHA + EPA (Analysis 3)
Low (< 500 mg/day): 24 trials (Ali 2017; Bergmann 2007; D'Almedia 1992; Harris 2015*; Hurtado 2015; Ismail 2016; Jamilian 2016; Judge 2007; Judge 2014; Khalili 2016; Knudsen 2006*; Malcolm 2003; Martin‐Alvarez 2012; Miller 2016; Mulder 2014; Noakes 2012 (as fish); Ogundipe 2016; Pietrantoni 2014; Ramakrishnan 2010; Samimi 2015; Sanjurjo 2004; Smuts 2003a; Smuts 2003b; Van Goor 2009)
Mid (500 mg/day to 1 g/day): 21 trials (Carlson 2013; Chase 2015; Dilli 2018; Giorlandino 2013; Gustafson 2013; Harris 2015*; Horvaticek 2017; Kaviani 2014#; Keenan 2014; Krauss‐Etschmann 2007; Knudsen 2006*; Krummel 2016; Makrides 2010; Mardones 2008#; Min 2014; Min 2016; Otto 2000; Ranjkesh 2011; Razavi 2017; Rees 2008; Ribeiro 2012)
Of these 21 trials, 14 clearly reported doses of ≥ 500 mg DHA/day (Carlson 2013; Chase 2015; Giorlandino 2013; Gustafson 2013; Harris 2015 (one arm); Horvaticek 2017; Krauss‐Etschmann 2007; Krummel 2016; Makrides 2010; Min 2014; Min 2016; Otto 2000; Rees 2008; Ribeiro 2012).
High (> 1 g/day): 23 trials (Bisgaard 2016; Boris 2004; Bulstra‐Ramakers 1994; Dunstan 2008; England 1989; Freeman 2008; Furuhjelm 2009; Haghiac 2015; Harper 2010; Hauner 2012; Helland 2001; Jamilian 2017; Knudsen 2006*; Laivuori 1993; Mozurkewich 2013; Olsen 1992; Olsen 2000; Onwude 1995; Rivas‐Echeverria 2000; Su 2008; Tofail 2006; Van Winden 2017; Vaz 2017).
Other: in five trials it was not possible to estimate DHA/EPA dose, or the omega‐3 supplement was clearly not DHA or EPA (Bosaeus 2015; Oken 2013 (advice to consume fish); de Groot 2004 (margarine enriched to give 2.82 g/day ALA); Taghizadeh 2016 (ALA 400 mg/day (flax oil)); Valenzuela 2015 (10.1 g/day ALA).
*trials had more than one omega‐3 group with different doses
#only specified as omega‐3 and not DHA and/or EPA.
Timing subgroup ‐ gestational age when omega‐3 supplements commenced (Analysis 4)
> 20 weeks' gestation: 33 trials (Ali 2017; Bergmann 2007; Bisgaard 2016; Boris 2004; Furuhjelm 2009; Giorlandino 2013; Hurtado 2015; Ismail 2016; Jamilian 2016; Jamilian 2017; Judge 2007; Judge 2014; Kaviani 2014; Knudsen 2006; Krummel 2016; Laivuori 1993; Martin‐Alvarez 2012; Miller 2016; Min 2016; Olsen 1992; Onwude 1995; Ramakrishnan 2010; Razavi 2017; Rees 2008; Ribeiro 2012; Samimi 2015; Sanjurjo 2004; Smuts 2003a; Smuts 2003b; Taghizadeh 2016; Tofail 2006; Valenzuela 2015; Van Winden 2017)
≤ 20 weeks' gestation: 33 trials (Bosaeus 2015; Bulstra‐Ramakers 1994; Carlson 2013; Chase 2015; D'Almedia 1992; de Groot 2004; Dilli 2018; Dunstan 2008; Gustafson 2013; Haghiac 2015; Harper 2010; Harris 2015; Hauner 2012; Helland 2001; Horvaticek 2017; Keenan 2014; Khalili 2016; Krauss‐Etschmann 2007; Makrides 2010; Malcolm 2003; Mardones 2008; Min 2014; Mozurkewich 2013; Mulder 2014; Noakes 2012; Ogundipe 2016; Olsen 2000; Otto 2000; Pietrantoni 2014; Ranjkesh 2011; Su 2008; Van Goor 2009; Vaz 2017)
Mixed: two trials (Freeman 2008; Oken 2013)
Not reported: two trials (England 1989; Rivas‐Echeverria 2000)
DHA/mixed subgroup (Analysis 5)
DHA/largely DHA: 27 trials (Carlson 2013; Chase 2015; Dunstan 2008; Giorlandino 2013; Gustafson 2013; Harris 2015; Hauner 2012; Horvaticek 2017; Hurtado 2015; Judge 2007; Judge 2014; Keenan 2014; Krummel 2016; Makrides 2010; Malcolm 2003; Martin‐Alvarez 2012; Miller 2016; Min 2014; Min 2014 [diabetic women]; Min 2016; Mulder 2014; Ogundipe 2016; Pietrantoni 2014; Ramakrishnan 2010; Rees 2008; Sanjurjo 2004; Smuts 2003a; Smuts 2003b)
Mixed EPA + DHA: 25 trials (Bisgaard 2016; Boris 2004; Bulstra‐Ramakers 1994; Dilli 2018; England 1989; Freeman 2008; Furuhjelm 2009; Haghiac 2015; Harper 2010; Helland 2001; Ismail 2016; Jamilian 2016; Jamilian 2017; Khalili 2016; Knudsen 2006; Mozurkewich 2013; Noakes 2012; Olsen 1992; Olsen 2000; Olsen 2000 [twins]; Onwude 1995; Ranjkesh 2011; Su 2008; Tofail 2006; Van Winden 2017; Vaz 2017)
Mixed DHA + EPA + other: 18 trials: (Ali 2017; Bergmann 2007; Bosaeus 2015; D'Almedia 1992; de Groot 2004; Kaviani 2014; Krauss‐Etschmann 2007; Laivuori 1993; Mardones 2008; Oken 2013; Otto 2000; Razavi 2017; Ribeiro 2012; Rivas‐Echeverria 2000; Samimi 2015; Taghizadeh 2016; Valenzuela 2015; Van Goor 2009)
Risk subgroup: women at increased/high risk, any/mixed risk or low risk (Analysis 6)
Increased or high baseline risk of adverse maternal and birth outcomes included being at risk of pre‐eclampsia, having a previous preterm birth, GDM, being overweight/obese or underweight, or being at risk of poor mental health ‐ see Table 11.
Increased or high risk: 34 trials (Ali 2017; Bulstra‐Ramakers 1994; Chase 2015; Dilli 2018; England 1989; Freeman 2008; Giorlandino 2013; Haghiac 2015; Harper 2010; Horvaticek 2017; Ismail 2016; Jamilian 2016; Jamilian 2017; Kaviani 2014; Keenan 2014; Krummel 2016; Laivuori 1993; Mardones 2008; Min 2014 [diabetic women]*; Min 2016; Mozurkewich 2013; Ogundipe 2016; Olsen 2000; Onwude 1995; Ranjkesh 2011; Razavi 2017; Rees 2008; Rivas‐Echeverria 2000; Samimi 2015; Su 2008; Taghizadeh 2016; Tofail 2006; Van Winden 2017; Vaz 2017)
Any or mixed risk: eight trials (Bisgaard 2016; D'Almedia 1992; Knudsen 2006; Makrides 2010; Martin‐Alvarez 2012; Miller 2016; Oken 2013; Ribeiro 2012)
Low risk: 29 trials (Bergmann 2007; Boris 2004; Bosaeus 2015; Carlson 2013; de Groot 2004; Dunstan 2008; Furuhjelm 2009; Gustafson 2013; Harris 2015; Hauner 2012; Helland 2001; Hurtado 2015; Judge 2007; Judge 2014; Khalili 2016; Krauss‐Etschmann 2007; Malcolm 2003; Min 2014; Mulder 2014; Noakes 2012; Olsen 1992; Otto 2000; Pietrantoni 2014; Ramakrishnan 2010; Sanjurjo 2004; Smuts 2003a; Smuts 2003b; Valenzuela 2015; Van Goor 2009)
*Min 2014 reported diabetic women separately.
Outcomes
Primary outcomes were reported in a format suitable for meta‐analysis as follows:
preterm birth < 37 weeks reported by 26 trials;
preterm birth < 34 weeks reported by nine trials;
prolonged gestation > 42 weeks reported by six trials.
Most of our secondary outcomes were reported in at least some of the trials.
We were unable to include any outcomes from 10 trials in our meta‐analysis (Boris 2004; Bosaeus 2015; Chase 2015; Ismail 2016; Jamilian 2017; Laivuori 1993; Martin‐Alvarez 2012; Ogundipe 2016; Ribeiro 2012; Van Winden 2017). Of these, Boris 2004, Chase 2015, Ismail 2016, Jamilian 2017, Martin‐Alvarez 2012 and Ribeiro 2012 did not report on any of our prespecified review outcomes. Bosaeus 2015 and Laivuori 1993 reported review outcomes, however, the data were not suitable for inclusion in the meta‐analysis. Ogundipe 2016 only reported review outcomes overall, not separately by intervention and control group. Van Winden 2017 did report on maternal adverse effects, but narratively.
Sources of trial funding
Funding sources were reported by 56 of the 70 included trials (Bergmann 2007; Bisgaard 2016; Boris 2004; Bosaeus 2015; Carlson 2013; Chase 2015; D'Almedia 1992; de Groot 2004; Dilli 2018; Dunstan 2008; Freeman 2008; Furuhjelm 2009; Giorlandino 2013; Gustafson 2013; Haghiac 2015; Harper 2010; Harris 2015; Hauner 2012; Helland 2001; Hurtado 2015; Jamilian 2016; Jamilian 2017; Judge 2007; Judge 2014; Keenan 2014; Khalili 2016; Knudsen 2006; Krauss‐Etschmann 2007; Krummel 2016; Laivuori 1993; Makrides 2010; Malcolm 2003; Mardones 2008; Min 2014; Min 2016; Mozurkewich 2013; Mulder 2014; Ogundipe 2016; Oken 2013; Olsen 1992; Olsen 2000; Otto 2000; Pietrantoni 2014; Ramakrishnan 2010; Razavi 2017; Rees 2008; Rivas‐Echeverria 2000; Samimi 2015; Sanjurjo 2004; Smuts 2003a; Smuts 2003b; Su 2008; Taghizadeh 2016; Tofail 2006; Van Goor 2009; Vaz 2017). Funding bodies listed by the trials were mostly non‐commercial organisations (e.g. government funding bodies, universities, health services and other not‐for‐profit foundations, including the World Health Organization). However, commercial organisations ‐ mainly pharmaceutical companies ‐ were reported as the only or main funding sources in 11 trials (Bergmann 2007; de Groot 2004; Giorlandino 2013; Helland 2001; Laivuori 1993; Mardones 2008; Otto 2000; Sanjurjo 2004; Smuts 2003a; Smuts 2003b; Van Goor 2009). Thirteen trials did not report any funding (Ali 2017; Bulstra‐Ramakers 1994; England 1989; Horvaticek 2017; Ismail 2016; Kaviani 2014; Martin‐Alvarez 2012; Miller 2016; Ranjkesh 2011; Ribeiro 2012; Rivas‐Echeverria 2000; Valenzuela 2015; Van Winden 2017).
Trial authors' declarations of interest
Eleven trials of the 70 trials reported information related to potential conflicts of interests for the trial authors, primarily related to income received from pharmaceutical and other commercial organisations (Carlson 2013; Freeman 2008; Harper 2010; Hauner 2012; Helland 2001; Hurtado 2015; Krauss‐Etschmann 2007; Makrides 2010; Mozurkewich 2013; Noakes 2012; Olsen 1992). A further 31 trials reported having no interests to declare (Ali 2017; Bergmann 2007; Bosaeus 2015; de Groot 2004; Dilli 2018; Dunstan 2008; Furuhjelm 2009; Haghiac 2015; Horvaticek 2017; Ismail 2016; Jamilian 2016; Jamilian 2017; Judge 2014; Kaviani 2014; Khalili 2016; Krummel 2016; Malcolm 2003; Mardones 2008; Min 2014; Min 2016; Mulder 2014; Oken 2013; Pietrantoni 2014; Ramakrishnan 2010; Razavi 2017; Ribeiro 2012; Taghizadeh 2016; Valenzuela 2015; Van Goor 2009; Van Winden 2017; Vaz 2017).
The remaining 28 trials did not report any information regarding declarations of interest (Bisgaard 2016; Boris 2004; Bulstra‐Ramakers 1994; Chase 2015; D'Almedia 1992; England 1989; Giorlandino 2013; Gustafson 2013; Harris 2015; Judge 2007; Keenan 2014; Knudsen 2006; Laivuori 1993; Martin‐Alvarez 2012; Miller 2016; Ogundipe 2016; Olsen 2000; Onwude 1995; Otto 2000; Ranjkesh 2011; Rees 2008; Rivas‐Echeverria 2000; Samimi 2015; Sanjurjo 2004; Smuts 2003a; Smuts 2003b; Su 2008; Tofail 2006). For further details of the reported declarations, see Characteristics of included studies.
Excluded studies
We excluded 15 studies (Escobar 2008; Fievet 1985; Gholami 2017; Herrera 1993; Herrera 1998; Herrera 2004; Lauritzen 2004; Marangell 2004; Morrison 1984; Morrison 1986; Nishi 2016; Starling 1990; Valentine 2013; Velzing‐Aarts 2001; Yelland 2016). Four trials assessed the effects of an omega‐6 fatty acid intervention (linoleic acid) (Herrera 1993; Herrera 1998; Herrera 2004; Morrison 1984), and one trial assessed evening primrose oil (Fievet 1985). In Escobar 2008, participants were registered, but none were recruited. In five trials participants were not randomised (Gholami 2017; Marangell 2004; Nishi 2016; Starling 1990; Velzing‐Aarts 2001), and in another it did not appear as if participants were randomised (Morrison 1986). In Lauritzen 2004 and Valentine 2013 women were supplemented with omega‐3 during lactation only. The remaining trial was a methodological study that assessed aspects of several trials (Yelland 2016).
Risk of bias in included studies
For a summary of the risk of bias across the included trials, see Figure 2 and Figure 3.
2.
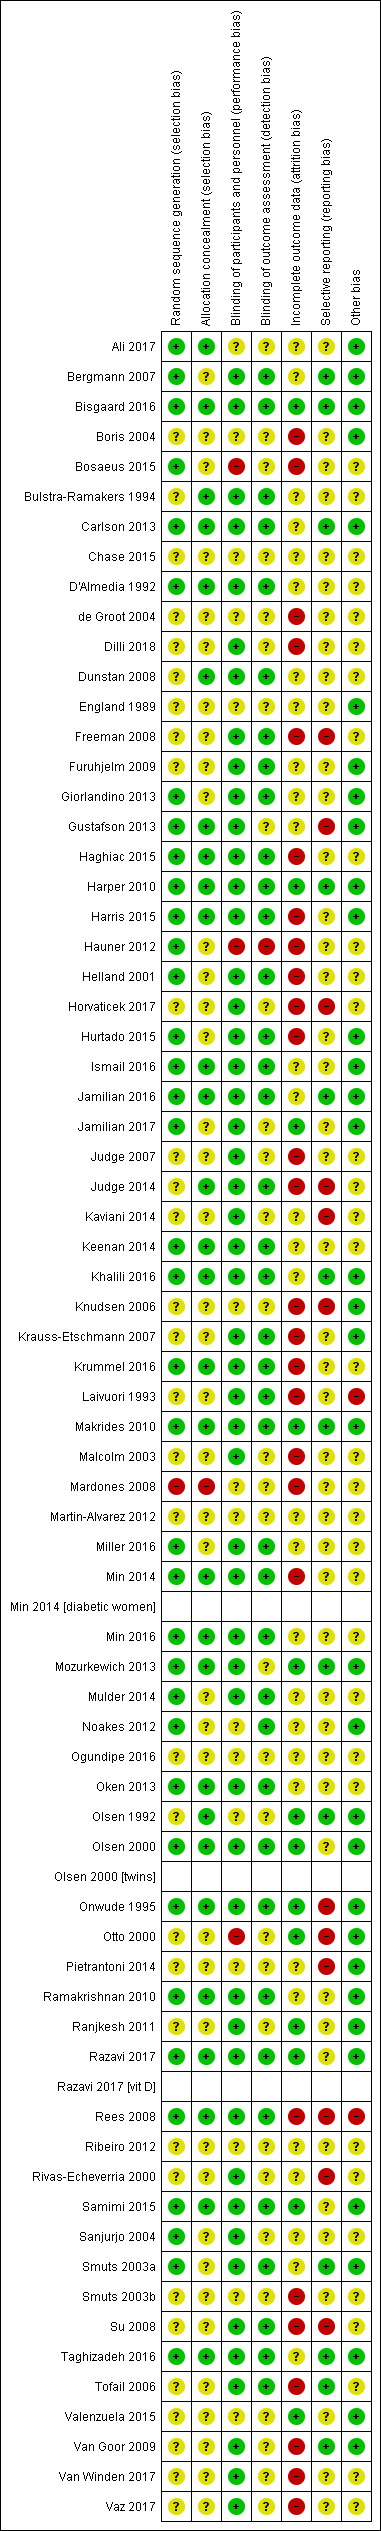
Risk of bias summary: review authors' judgements about each risk of bias item for each included study.
3.
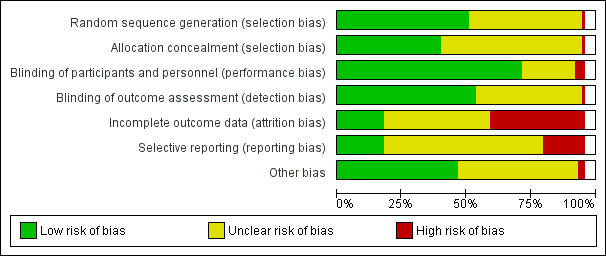
Risk of bias graph: review authors' judgements about each risk of bias item presented as percentages across all included studies.
Allocation
Random sequence generation
We judged the methods used to generate the random sequence to be adequate in 37 of the 70 included trials (Ali 2017; Bergmann 2007; Bisgaard 2016; Bosaeus 2015; Carlson 2013; D'Almedia 1992; Giorlandino 2013; Gustafson 2013; Haghiac 2015; Harper 2010; Harris 2015; Hauner 2012; Helland 2001; Hurtado 2015; Ismail 2016; Jamilian 2016; Jamilian 2017; Keenan 2014; Khalili 2016; Krummel 2016; Makrides 2010; Miller 2016; Min 2014; Min 2016; Mozurkewich 2013; Mulder 2014; Noakes 2012; Oken 2013; Olsen 2000; Onwude 1995; Ramakrishnan 2010; Razavi 2017; Rees 2008; Samimi 2015; Sanjurjo 2004; Smuts 2003a; Taghizadeh 2016), with all trials using computer‐generated methods or likely to have done so. We judged the risk of selection bias associated with sequence generation to be unclear in 32 trials, as many did not report how the random sequence was generated or provide sufficient information (Boris 2004; Bulstra‐Ramakers 1994; Chase 2015; de Groot 2004; Dilli 2018; Dunstan 2008; England 1989; Freeman 2008; Furuhjelm 2009; Horvaticek 2017; Judge 2007; Judge 2014; Kaviani 2014; Knudsen 2006; Krauss‐Etschmann 2007; Laivuori 1993; Malcolm 2003; Martin‐Alvarez 2012; Ogundipe 2016; Olsen 1992; Otto 2000; Pietrantoni 2014; Ranjkesh 2011; Ribeiro 2012; Rivas‐Echeverria 2000; Smuts 2003b; Su 2008; Tofail 2006; Valenzuela 2015; Van Goor 2009; Van Winden 2017; Vaz 2017). We judged one trial to be at high risk of selection bias, as alternation was used (odd and even numbers) (Mardones 2008).
Allocation concealment
We judged that 29 of the 70 trials had used adequate methods for allocation concealment (Ali 2017; Bisgaard 2016; Bulstra‐Ramakers 1994; Carlson 2013; D'Almedia 1992; Dunstan 2008; Gustafson 2013; Haghiac 2015; Harper 2010; Harris 2015; Ismail 2016; Jamilian 2016; Judge 2014; Keenan 2014; Khalili 2016; Krummel 2016; Makrides 2010; Min 2014; Min 2016; Mozurkewich 2013; Oken 2013; Olsen 1992; Olsen 2000; Onwude 1995; Ramakrishnan 2010; Razavi 2017; Rees 2008; Samimi 2015; Taghizadeh 2016). Four of these reported using sequentially numbered, opaque sealed envelopes (Ali 2017; Ismail 2016; Oken 2013; Olsen 1992). Three reported computer driven telephone or centre based randomisation (Harper 2010; Makrides 2010; Olsen 2000); 21 reported third party (pharmacy, health provider, supplement provider or external investigator) controlled randomisation (Bisgaard 2016; Bulstra‐Ramakers 1994; Carlson 2013; D'Almedia 1992; Dunstan 2008; Gustafson 2013; Haghiac 2015; Harris 2015; Jamilian 2016; Judge 2014; Keenan 2014; Khalili 2016; Krummel 2016; Min 2014; Min 2016; Mozurkewich 2013; Ramakrishnan 2010; Razavi 2017; Rees 2008; Samimi 2015; Taghizadeh 2016), and one used sequentially numbered opaque sealed envelopes and third party (pharmacy) controlled randomisation (Onwude 1995).
Selection bias
We judged that the risk of selection bias associated with allocation concealment was unclear for 40 trials (Bergmann 2007; Boris 2004; Bosaeus 2015; Chase 2015; de Groot 2004; Dilli 2018; England 1989; Freeman 2008; Furuhjelm 2009; Giorlandino 2013; Hauner 2012; Helland 2001; Horvaticek 2017; Hurtado 2015; Jamilian 2017; Judge 2007; Kaviani 2014; Knudsen 2006; Krauss‐Etschmann 2007; Laivuori 1993; Malcolm 2003; Martin‐Alvarez 2012; Miller 2016; Mulder 2014; Noakes 2012; Ogundipe 2016; Otto 2000; Pietrantoni 2014; Ranjkesh 2011; Ribeiro 2012; Rivas‐Echeverria 2000; Sanjurjo 2004; Smuts 2003a; Smuts 2003b; Su 2008; Tofail 2006; Valenzuela 2015; Van Goor 2009; Van Winden 2017; Vaz 2017), with either no methods of concealment detailed, or the methods described lacking sufficient detail. We judged one trial to be at high risk of selection bias, as alternation was used (odd and even numbers) (Mardones 2008).
Blinding
Blinding of participants and personnel
We judged blinding of participants and personnel to be adequate in 52 of the 70 included trials (Bergmann 2007; Bisgaard 2016; Bulstra‐Ramakers 1994; Carlson 2013; D'Almedia 1992; Dilli 2018; Dunstan 2008; Freeman 2008; Furuhjelm 2009; Giorlandino 2013; Gustafson 2013; Haghiac 2015; Harper 2010; Harris 2015; Helland 2001; Horvaticek 2017; Hurtado 2015; Ismail 2016; Jamilian 2016; Jamilian 2017; Judge 2007; Judge 2014; Kaviani 2014; Keenan 2014; Khalili 2016; Krauss‐Etschmann 2007; Krummel 2016; Laivuori 1993; Makrides 2010; Malcolm 2003; Miller 2016; Min 2014; Min 2016; Mozurkewich 2013; Mulder 2014; Oken 2013; Olsen 2000; Onwude 1995; Ramakrishnan 2010; Ranjkesh 2011; Razavi 2017; Rees 2008; Rivas‐Echeverria 2000; Samimi 2015; Sanjurjo 2004; Smuts 2003a; Su 2008; Taghizadeh 2016; Tofail 2006; Van Goor 2009; Van Winden 2017; Vaz 2017). We judged the risk of performance bias to be high in three trials, due to inadequate blinding of women and/or trial personnel (Bosaeus 2015; Hauner 2012; Otto 2000). For the remaining 15 trials, we judged the risk of performance bias to be unclear (Ali 2017; Boris 2004; Chase 2015; de Groot 2004; England 1989; Knudsen 2006; Mardones 2008; Martin‐Alvarez 2012; Noakes 2012; Ogundipe 2016; Olsen 1992; Pietrantoni 2014; Ribeiro 2012; Smuts 2003b; Valenzuela 2015). Eleven of these trials did not provide sufficient information to allow confident assessment of blinding (Ali 2017; Chase 2015; de Groot 2004; England 1989; Knudsen 2006; Martin‐Alvarez 2012; Noakes 2012; Ogundipe 2016; Pietrantoni 2014; Ribeiro 2012; Valenzuela 2015). Two trials reported that blinding of participants was partial (the no‐treatment groups were aware of this) (Boris 2004; Olsen 1992), and another two trials used food interventions which could not be fully blinded (Mardones 2008; Smuts 2003b).
Blinding of outcome assessors
Thirty‐nine trials clearly indicated that blinded trial personnel were involved in outcome assessment or data collection, and we judged them to be at low risk of detection bias (Bergmann 2007; Bisgaard 2016; Bulstra‐Ramakers 1994; Carlson 2013; D'Almedia 1992; Dunstan 2008; Freeman 2008; Furuhjelm 2009; Giorlandino 2013; Haghiac 2015; Harper 2010; Harris 2015; Helland 2001; Hurtado 2015; Ismail 2016; Jamilian 2016; Judge 2014; Keenan 2014; Khalili 2016; Krauss‐Etschmann 2007; Krummel 2016; Laivuori 1993; Makrides 2010; Miller 2016; Min 2014; Min 2016; Mulder 2014; Noakes 2012; Oken 2013; Olsen 2000; Onwude 1995; Ramakrishnan 2010; Razavi 2017; Rees 2008; Samimi 2015; Smuts 2003a; Su 2008; Taghizadeh 2016; Tofail 2006). One trial reported that, except for ultrasound measurements (e.g. for fat mass measurements), assessors were not blinded and we judged to be at high risk of detection bias (Hauner 2012). For the remaining trials, we judged the risk of detection bias to be unclear, as most of them provided insufficient details about whether assessors and/or data collectors were blinded (Ali 2017; Boris 2004; Bosaeus 2015; Chase 2015; de Groot 2004; Dilli 2018; England 1989; Gustafson 2013; Horvaticek 2017; Jamilian 2017; Judge 2007; Kaviani 2014; Knudsen 2006; Malcolm 2003; Mardones 2008; Martin‐Alvarez 2012; Mozurkewich 2013; Ogundipe 2016; Olsen 1992; Otto 2000; Pietrantoni 2014; Ranjkesh 2011; Ribeiro 2012; Rivas‐Echeverria 2000; Sanjurjo 2004; Valenzuela 2015; Van Goor 2009; Van Winden 2017; Vaz 2017).
Incomplete outcome data
We judged 13 trials to be at low risk of attrition bias, with minimal losses to follow‐up, and similar numbers/reasons for losses to follow‐up in each group (Bisgaard 2016; Harper 2010; Jamilian 2017; Makrides 2010; Mozurkewich 2013; Olsen 1992; Olsen 2000; Onwude 1995; Otto 2000; Ranjkesh 2011; Razavi 2017; Samimi 2015; Valenzuela 2015).
We judged 27 trials to be at a high risk of attrition bias (Boris 2004; Bosaeus 2015; de Groot 2004; Dilli 2018; Freeman 2008; Haghiac 2015; Harris 2015; Hauner 2012; Helland 2001; Horvaticek 2017; Hurtado 2015; Judge 2007; Judge 2014; Knudsen 2006; Krauss‐Etschmann 2007; Krummel 2016; Laivuori 1993; Malcolm 2003; Mardones 2008; Min 2014; Rees 2008; Smuts 2003b; Su 2008; Tofail 2006; Van Goor 2009; Van Winden 2017; Vaz 2017). See Characteristics of included studies for further details.
We judged the remaining 30 trials to be at an unclear risk of attrition bias, often due to incomplete or unclear reporting, and complexity in some of the trials with several periods of childhood follow‐up (Ali 2017; Bergmann 2007; Bulstra‐Ramakers 1994; Carlson 2013; Chase 2015; D'Almedia 1992; Dunstan 2008; England 1989; Furuhjelm 2009; Giorlandino 2013; Gustafson 2013; Ismail 2016; Jamilian 2016; Judge 2007; Kaviani 2014; Keenan 2014; Khalili 2016; Martin‐Alvarez 2012; Miller 2016; Min 2016; Mulder 2014; Noakes 2012; Ogundipe 2016; Oken 2013; Pietrantoni 2014; Ramakrishnan 2010; Rivas‐Echeverria 2000; Smuts 2003a; Taghizadeh 2016; Van Goor 2009).
Selective reporting
We judged 13 trials to be at a low risk of reporting bias, as they provided data for the prespecified and/or expected outcomes (including from the published protocols) (Bergmann 2007; Bisgaard 2016; Carlson 2013; Harper 2010; Khalili 2016; Jamilian 2016; Makrides 2010; Mozurkewich 2013; Olsen 1992; Smuts 2003a; Taghizadeh 2016; Tofail 2006; Van Goor 2009). We judged 45 trials to be at an unclear risk of reporting bias (Ali 2017; Boris 2004; Bosaeus 2015; Bulstra‐Ramakers 1994; Chase 2015; D'Almedia 1992; de Groot 2004; Dilli 2018; Dunstan 2008; England 1989; Furuhjelm 2009; Giorlandino 2013; Haghiac 2015; Harris 2015; Hauner 2012; Helland 2001; Hurtado 2015; Ismail 2016; Jamilian 2017; Judge 2007; Keenan 2014; Krauss‐Etschmann 2007; Krummel 2016; Laivuori 1993; Malcolm 2003; Mardones 2008; Martin‐Alvarez 2012; Miller 2016; Min 2014; Min 2016; Mulder 2014; Noakes 2012; Ogundipe 2016; Oken 2013; Olsen 2000; Ramakrishnan 2010; Ranjkesh 2011; Razavi 2017; Ribeiro 2012; Samimi 2015; Sanjurjo 2004; Smuts 2003b; Valenzuela 2015; Van Winden 2017; Vaz 2017). For the majority of these trials there was insufficient information to permit us to assess selective reporting confidently (i.e. no access to a published trial protocol). We judged the remaining 12 trials to be at a high risk of reporting bias (Freeman 2008; Gustafson 2013; Horvaticek 2017; Judge 2014; Kaviani 2014; Knudsen 2006; Onwude 1995; Otto 2000; Pietrantoni 2014; Rees 2008; Rivas‐Echeverria 2000; Su 2008).
Kaviani 2014; Knudsen 2006; Pietrantoni 2014 and Rivas‐Echeverria 2000 each reported only one of the expected or prespecified outcomes. Freeman 2008, Gustafson 2013; Judge 2014; Otto 2000; and Rees 2008 reported few of the prespecified or expected outcomes. Onwude 1995 reported a limited range of expected outcomes and incomplete data (no standard deviations) for two of the continuous outcomes (length of gestation and birthweight). Su 2008 reported few of the expected outcomes, and data were incomplete for birth outcomes.
Other potential sources of bias
We judged 34 trials to be at a low risk of other potential sources of bias (Ali 2017; Bergmann 2007; Bisgaard 2016; Boris 2004; Carlson 2013; England 1989; Furuhjelm 2009; Giorlandino 2013; Gustafson 2013; Harper 2010; Harris 2015; Hurtado 2015; Ismail 2016; Jamilian 2016; Jamilian 2017; Khalili 2016; Knudsen 2006; Krauss‐Etschmann 2007; Makrides 2010; Mozurkewich 2013; Noakes 2012; Olsen 1992; Olsen 2000; Onwude 1995; Otto 2000; Pietrantoni 2014; Ramakrishnan 2010; Ranjkesh 2011; Razavi 2017; Samimi 2015; Smuts 2003a; Taghizadeh 2016; Valenzuela 2015; Van Goor 2009). We judged another 34 trials to be at an unclear risk of other potential sources of bias (Bosaeus 2015; Bulstra‐Ramakers 1994; Chase 2015; D'Almedia 1992; de Groot 2004; Dilli 2018; Dunstan 2008; Freeman 2008; Haghiac 2015; Hauner 2012; Helland 2001; Horvaticek 2017; Judge 2007; Judge 2014; Kaviani 2014; Keenan 2014; Krummel 2016; Malcolm 2003; Mardones 2008; Martin‐Alvarez 2012; Miller 2016; Min 2014; Min 2016; Mulder 2014; Ogundipe 2016; Oken 2013; Ribeiro 2012; Rivas‐Echeverria 2000; Sanjurjo 2004; Smuts 2003b; Su 2008; Tofail 2006; Van Winden 2017; Vaz 2017). We judged the remaining two trials, Laivuori 1993 and Rees 2008, to be at a high risk of other bias. In Laivuori 1993 there were substantial differences in the median length of supplementation between the three groups, which was a significant source of other bias, while in Rees 2008 women in the placebo group were more likely to have a co‐morbid anxiety disorder (9/13 versus 3/13), which introduced significant baseline imbalance between groups that was relevant to all reported outcomes.
Effects of interventions
See: Table 1; Table 2; Table 3; Table 4
Omega‐3 supplementation versus no omega‐3
Primary outcomes
Preterm birth (< 37 weeks)
There was an 11% reduced risk of preterm birth (< 37 weeks) for omega‐3 LCPUFA compared with no omega‐3 (risk ratio (RR) 0.89, 95% confidence interval (CI) 0.81 to 0.97; 26 trials, 10,304 participants; high‐quality evidence; Analysis 1.1). Some asymmetry was observed on visual assessment of a funnel plot for this outcome, suggesting an absence of some small negative studies (Figure 4), with little likely impact on the overall result.
1.1. Analysis.
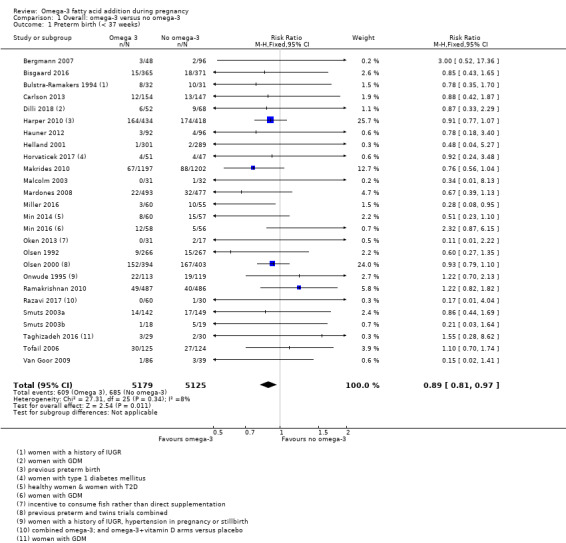
Comparison 1 Overall: omega‐3 versus no omega‐3, Outcome 1 Preterm birth (< 37 weeks).
4.
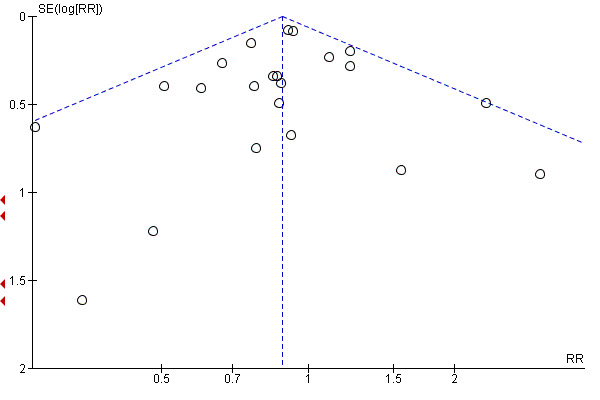
Funnel plot of comparison: 1 Omega‐3 versus placebo/no omega‐3: OVERALL, outcome: 1.7 Preterm birth (< 37 weeks).
Early preterm birth (< 34 weeks)
There was a 42% lower risk of early preterm birth (< 34 weeks) for omega‐3 LCPUFA compared with no omega‐3 (RR 0.58, 95% CI 0.44 to 0.77; 9 trials, 5204 participants; high‐quality evidence; Analysis 1.2).
1.2. Analysis.
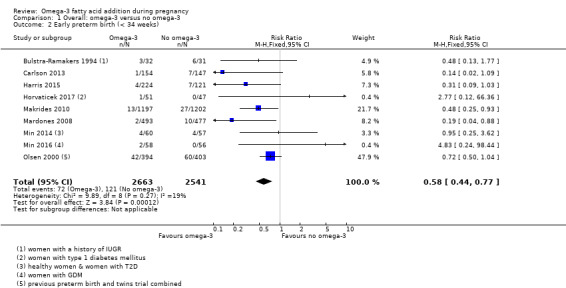
Comparison 1 Overall: omega‐3 versus no omega‐3, Outcome 2 Early preterm birth (< 34 weeks).
Mother: secondary outcomes
Maternal death
Only four trials reported on maternal death (Bisgaard 2016; Makrides 2010; Oken 2013; Olsen 2000), with one maternal death reported in the omega‐3 group in Oken 2013. There was no evidence of a difference in the risk of maternal death for omega‐3 compared with no omega‐3 (RR 1.69, 95% CI 0.07 to 39.30; 4 trials, 4830 participants; Analysis 1.4).
1.4. Analysis.
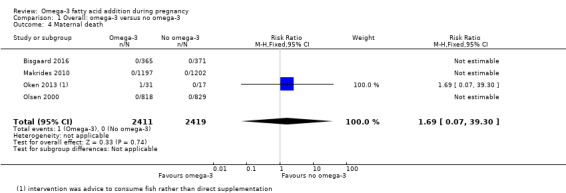
Comparison 1 Overall: omega‐3 versus no omega‐3, Outcome 4 Maternal death.
Pre‐eclampsia (hypertension with proteinuria)
Pre‐eclampsia (hypertension with proteinuria) may be reduced for omega‐3 LCPUFA compared with no omega‐3 group (RR 0.84, 95% CI 0.69 to 1.01, 20 trials, 8306 participants; low‐quality evidence; Analysis 1.5). No obvious asymmetry was observed on visual assessment of a funnel plot for this outcome (Figure 5).
1.5. Analysis.
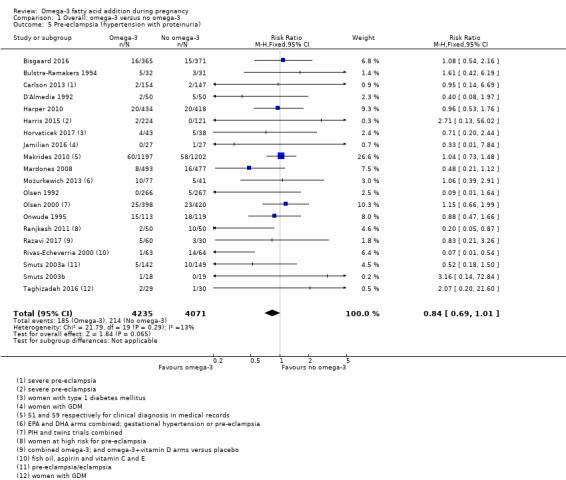
Comparison 1 Overall: omega‐3 versus no omega‐3, Outcome 5 Pre‐eclampsia (hypertension with proteinuria).
5.
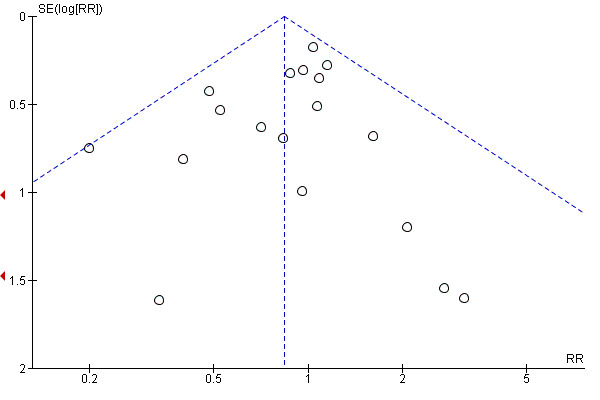
Funnel plot of comparison: 1 Omega‐3 versus placebo/no omega‐3: OVERALL, outcome: 1.4 Pre‐eclampsia (hypertension with proteinuria).
High blood pressure (without proteinuria)
There was no evidence of a difference in the risk of high blood pressure (without proteinuria) for omega‐3 LCPUFA compared with no omega‐3 (RR 1.03, 95% CI 0.89 to 1.20; 7 trials, 4531 participants; Analysis 1.6).
1.6. Analysis.
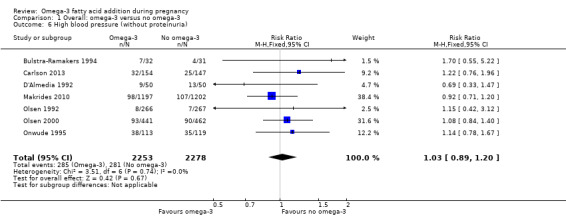
Comparison 1 Overall: omega‐3 versus no omega‐3, Outcome 6 High blood pressure (without proteinuria).
Eclampsia
Only one trial reported on eclampsia (D'Almedia 1992), and indicated no clear difference between omega‐3 LCPUFA and no omega‐3 (RR 0.14, 95% CI 0.01 to 2.70; 1 trial; 100 participants; Analysis 1.7).
1.7. Analysis.
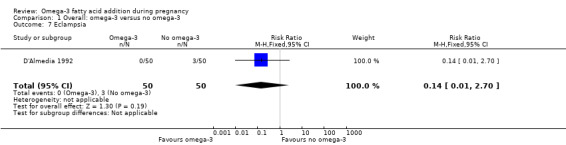
Comparison 1 Overall: omega‐3 versus no omega‐3, Outcome 7 Eclampsia.
Maternal antepartum hospitalisation
There was no evidence of a difference in risk of maternal antepartum hospitalisation between omega‐3 LCPUFA and no omega‐3 overall (RR 0.92, 95% CI 0.81 to 1.04; 5 trials, 2876 participants; Analysis 1.8).
1.8. Analysis.
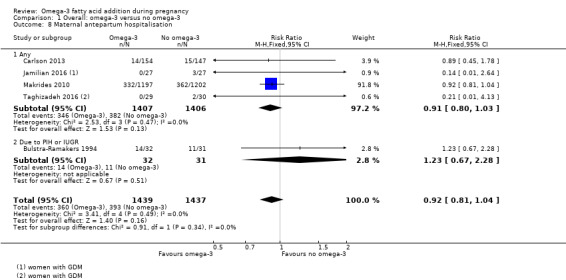
Comparison 1 Overall: omega‐3 versus no omega‐3, Outcome 8 Maternal antepartum hospitalisation.
Mother's length of stay in hospital (days)
Bisgaard 2016 and Olsen 2000 were the only trials to report data on the mother's length of stay in hospital, and showed no clear differences between omega‐3 LCPUFA and no omega‐3 (MD 0.18 days, 95% CI ‐0.20 to 0.57; 2 trials, 2290 participants; Analysis 1.9).
1.9. Analysis.
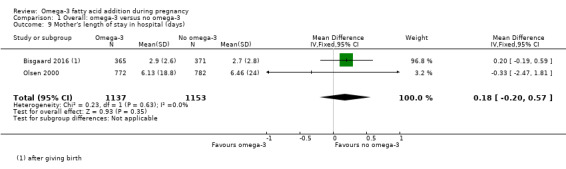
Comparison 1 Overall: omega‐3 versus no omega‐3, Outcome 9 Mother's length of stay in hospital (days).
Maternal anaemia
Only Olsen 2000 reported on maternal anaemia and no difference was seen between omega‐3 LCPUFA and no omega‐3 (RR 1.16, 95% CI 0.91 to 1.48; 846 participants; Analysis 1.10).
1.10. Analysis.

Comparison 1 Overall: omega‐3 versus no omega‐3, Outcome 10 Maternal anaemia.
Miscarriage (< 24 weeks)
There was no clear difference in miscarriage risk (< 24 weeks) for omega‐3 LCPUFA compared with no omega‐3 (RR 1.07, 95% CI 0.80 to 1.43; 9 trials, 4190 participants; Analysis 1.11).
1.11. Analysis.
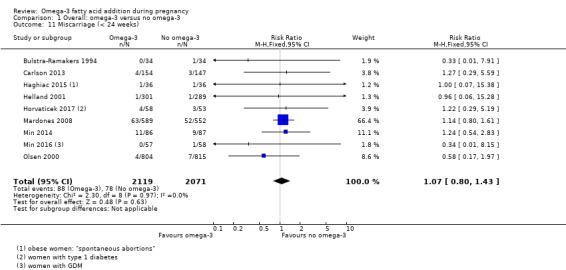
Comparison 1 Overall: omega‐3 versus no omega‐3, Outcome 11 Miscarriage (< 24 weeks).
Antepartum vaginal bleeding
There was no evidence of a difference in risk of antepartum vaginal bleeding for omega‐3 LCPUFA compared with no omega‐3 overall (RR 1.01, 95% CI 0.69 to 1.48; 2 trials, 2151 participants; Analysis 1.12).
1.12. Analysis.
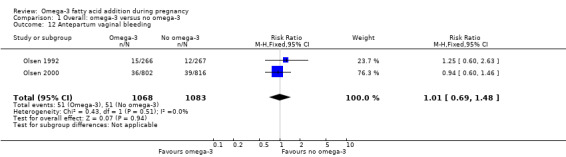
Comparison 1 Overall: omega‐3 versus no omega‐3, Outcome 12 Antepartum vaginal bleeding.
Rupture of membranes
Carlson 2013, Harris 2015, Pietrantoni 2014 and Smuts 2003a reported on rupture of membranes (prelabour and preterm prelabour), and showed a lower risk overall with omega‐3 LCPUFA compared with no omega‐3 (RR 0.46, 95% CI 0.28 to 0.76; 4 trials, 1281 participants. The separate results for prelabour and preterm prelabour rupture are shown in Analysis 1.13.
1.13. Analysis.
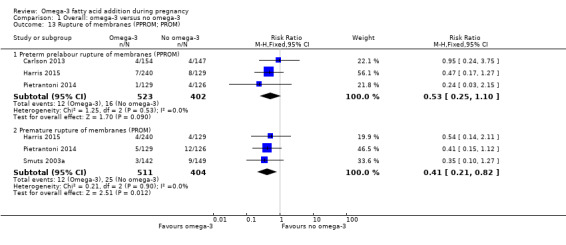
Comparison 1 Overall: omega‐3 versus no omega‐3, Outcome 13 Rupture of membranes (PPROM; PROM).
Maternal admission to intensive care
Two trials reported on maternal admission to intensive care (Makrides 2010; Taghizadeh 2016), and saw no evidence of a difference in risk between omega‐3 LCPUFA and no omega‐3 (RR 0.56, 95% CI 0.12 to 2.63; 2 trials, 2458 participants; low‐quality evidence; Analysis 1.14).
1.14. Analysis.
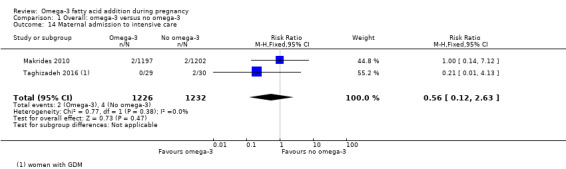
Comparison 1 Overall: omega‐3 versus no omega‐3, Outcome 14 Maternal admission to intensive care.
Maternal adverse events
Overall 16 trials reported on one or more maternal adverse effects. Using a random‐effects model, there was no evidence of a difference in the risk of: severe adverse events (RR 1.04, 95% CI 0.40 to 2.72; 2 trials, 2690 participants; low‐quality evidence), adverse events severe enough for cessation (RR 1.01, 95% CI 0.53 to 1.93; 6 trials, 1487 participants), any adverse effects (RR 1.38, 95% CI 1.16 to 1.65; I2 = 88%; 5 trials, 1480 participants), possibly due to higher reports of belching/burping in the omega‐3 LCPUFA group of Olsen 2000, and fewer reports of labour‐related complications in the omega‐3 LCPUFA group of Smuts 2003a (Analysis 1.15).
1.15. Analysis.
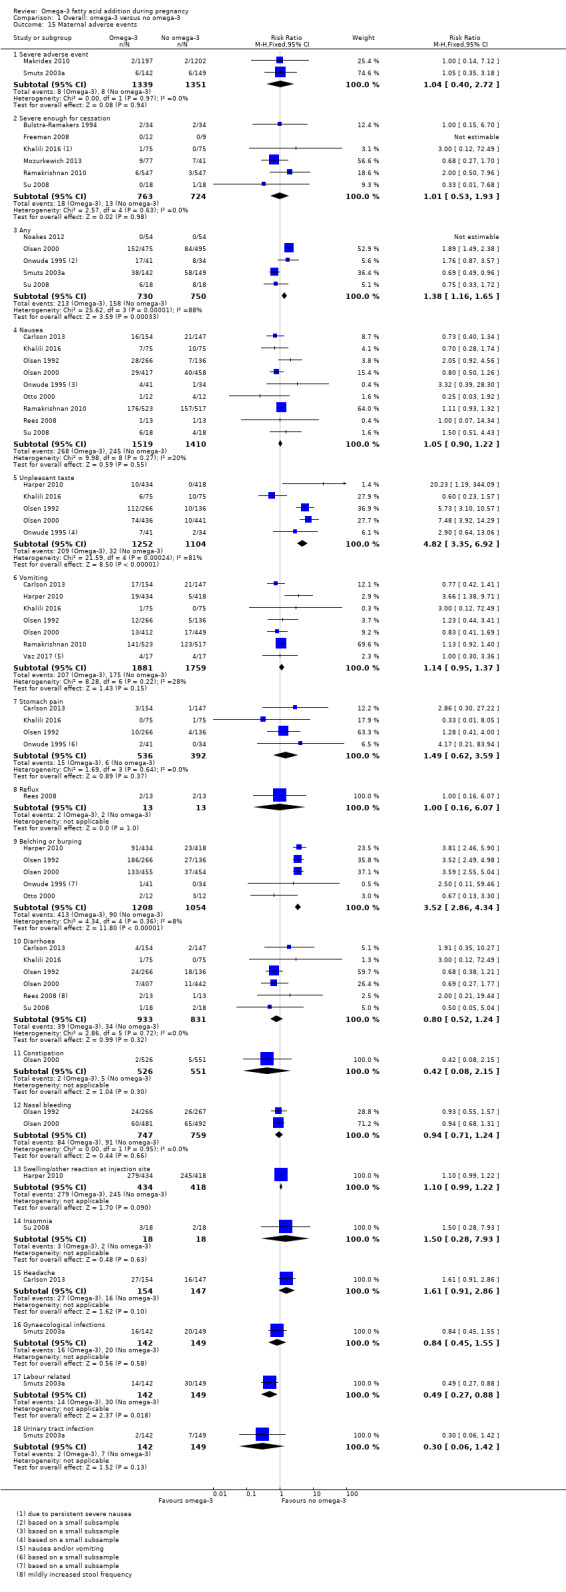
Comparison 1 Overall: omega‐3 versus no omega‐3, Outcome 15 Maternal adverse events.
Very few differences were seen for individual adverse events, although unpleasant taste and belching/burping were more likely to be reported with omega‐3 LCPUFA than with no omega‐3 (Analysis 1.15).
Caesarean section
There was no evidence of a difference in the risk of caesarean section in omega‐3 LCPUFA compared with no omega‐3 (RR 0.97, 95% CI 0.91 to 1.03; 28 trials, 8481 participants; Analysis 1.16). No clear asymmetry was observed on visual assessment of a funnel plot for this outcome, although there was some indication that small negative trials may be missing (Figure 6). However this would be unlikely to affect the null findings.
1.16. Analysis.
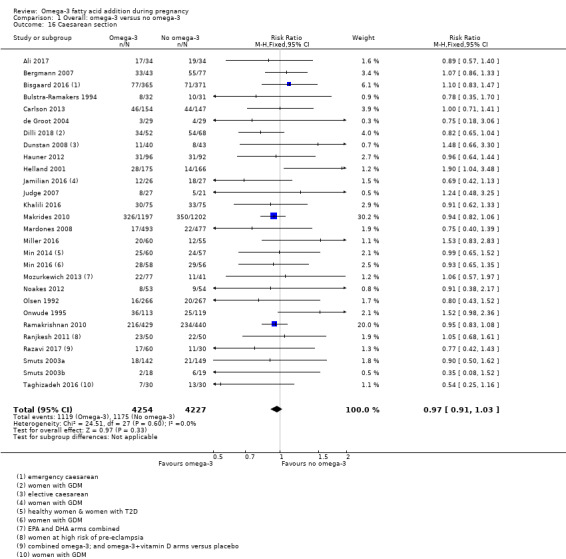
Comparison 1 Overall: omega‐3 versus no omega‐3, Outcome 16 Caesarean section.
6.
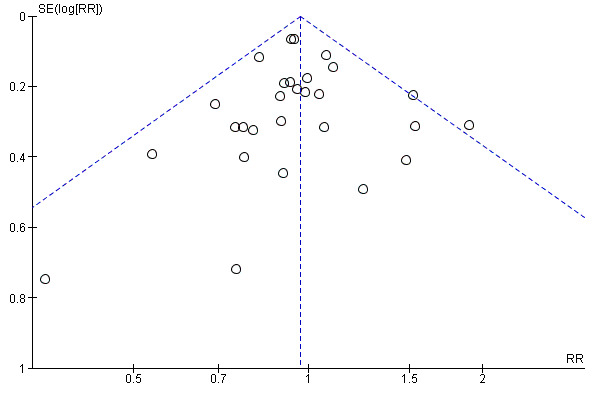
Funnel plot of comparison: 1 Omega‐3 versus placebo/no omega‐3: OVERALL, outcome: 1.16 Caesarean section.
Induction (post‐term)
Three trials reported on induction post‐term (Harris 2015; Hauner 2012; Makrides 2010). The effect of omega‐3 on post‐term induction is uncertain due to the wide confidence intervals and variation between the results of the studies (average RR 0.82, CI 0.22 to 2.98; 2900 participants, 3 trials; Tau2 = 0.70, P = 0.04, I2 = 77%; low‐quality evidence; Analysis 1.17).
1.17. Analysis.
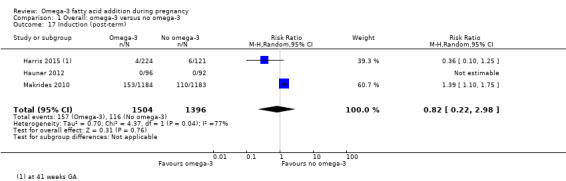
Comparison 1 Overall: omega‐3 versus no omega‐3, Outcome 17 Induction (post‐term).
Blood loss at birth (mL)
There was no evidence of a difference in maternal blood loss at birth between omega‐3 LCPUFA and no omega‐3 (MD 11.50 mL, 95% CI ‐6.75 to 29.76; 6 trials, 2776 participants; Analysis 1.18).
1.18. Analysis.
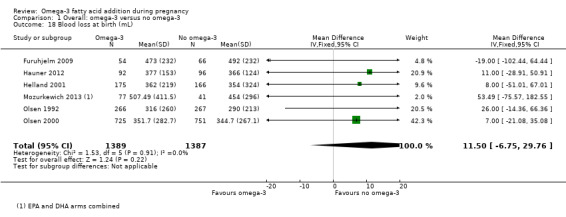
Comparison 1 Overall: omega‐3 versus no omega‐3, Outcome 18 Blood loss at birth (mL).
Postpartum haemorrhage
Four trials reported on postpartum haemorrhage (Carlson 2013;Harper 2010; Makrides 2010; Olsen 1992), and found no evidence of a difference between omega‐3 LCPUFA and no omega‐3 (RR 1.03, 95% CI 0.82 to 1.30; 4 trials, 4085 participants; Analysis 1.19).
1.19. Analysis.
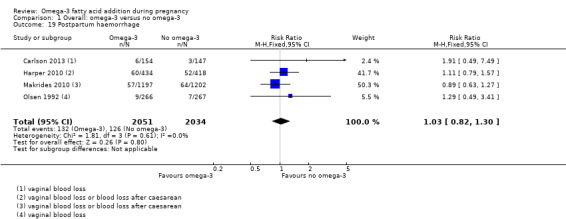
Comparison 1 Overall: omega‐3 versus no omega‐3, Outcome 19 Postpartum haemorrhage.
Gestational diabetes
There was no evidence of a difference in the risk of GDM for omega‐3 LCPUFA compared with no omega‐3 (RR 1.02, 95% CI 0.83 to 1.26; 12 trials, 5235 participants; Analysis 1.20). No obvious asymmetry was observed on visual assessment of a funnel plot for this outcome (Figure 7).
1.20. Analysis.
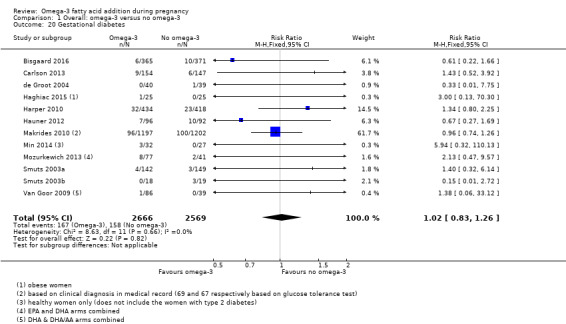
Comparison 1 Overall: omega‐3 versus no omega‐3, Outcome 20 Gestational diabetes.
7.
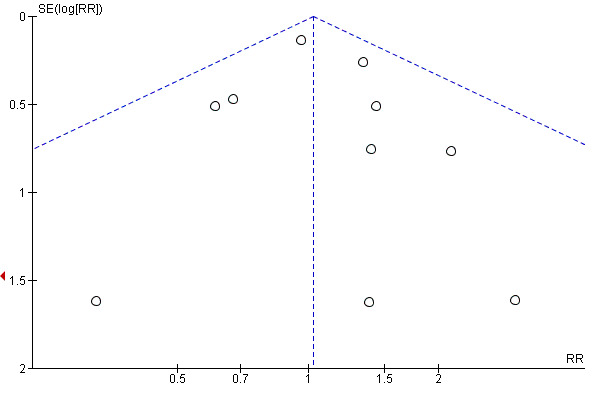
Funnel plot of comparison: 1 Omega‐3 versus placebo/no omega‐3: OVERALL, outcome: 1.20 Gestational diabetes.
Maternal insulin resistance (HOMA‐IR)
Only three trials reported on maternal insulin resistance (HOMA‐IR) (Krummel 2016; Samimi 2015; Taghizadeh 2016), and showed no clear differences overall for omega‐3 LCPUFA compared with no omega‐3 (average MD ‐0.85, 95% CI ‐2.50 to 0.80; Tau² = 1.82; P = 0.0008; I² = 86%; 176 participants; Analysis 1.21). The high statistical heterogeneity may be due to different populations (overweight/obese women in Krummel 2016 and women with GDM in the other two trials).
1.21. Analysis.
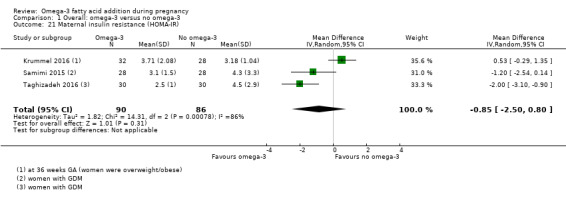
Comparison 1 Overall: omega‐3 versus no omega‐3, Outcome 21 Maternal insulin resistance (HOMA‐IR).
Excessive gestational weight gain
Only Carlson 2013 reported on excessive gestational weight gain, and observed no evidence of a difference in the risk between omega‐3 LCPUFA and no omega‐3 groups (RR 1.21, 95% CI 0.95 to 1.55; 350 participants; Analysis 1.22).
1.22. Analysis.
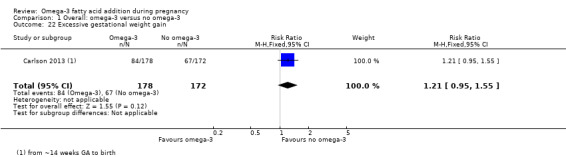
Comparison 1 Overall: omega‐3 versus no omega‐3, Outcome 22 Excessive gestational weight gain.
Gestational weight gain (kg)
There was no evidence of a difference in gestational weight gain for omega‐3 LCPUFA compared with no omega‐3 (MD ‐0.50 kg, 95% CI ‐0.68 to 0.59; 11 trials; random effects; Tau² = 0.60; P = 0.0006; I² = 59%; 2297 participants; Analysis 1.23). The funnel plot was not markedly asymmetric (Figure 8). Dilli 2018 contributed to the high statistical heterogeneity, with a 3 kg lower gain in the omega‐3 LCPUFA group compared with placebo.
1.23. Analysis.
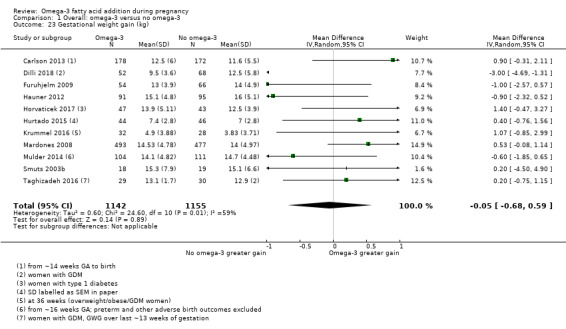
Comparison 1 Overall: omega‐3 versus no omega‐3, Outcome 23 Gestational weight gain (kg).
8.
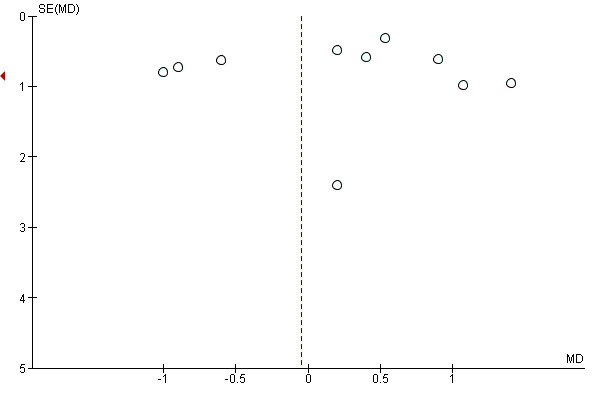
Funnel plot of comparison: 1 Overall: omega‐3 versus no omega‐3, outcome: 1.23 Gestational weight gain (kg).
Depression during pregnancy: thresholds
Carlson 2013, Su 2008 and Vaz 2017 reported on different thresholds for depression during pregnancy (using the Hamilton Rating Scale for Depression (HAM‐D), Edinburgh Postnatal Depression Scale (EPDS) and not specified), and showed no evidence of a difference between omega‐3 LCPUFA and no omega‐3 for each trial (Analysis 1.24).
1.24. Analysis.
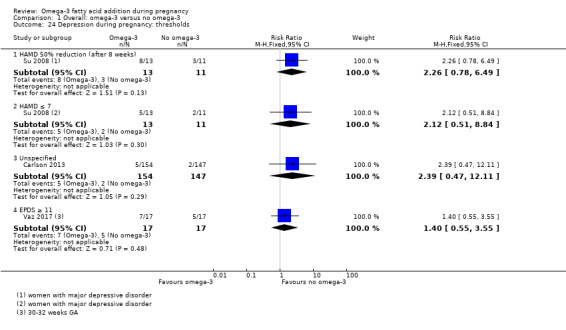
Comparison 1 Overall: omega‐3 versus no omega‐3, Outcome 24 Depression during pregnancy: thresholds.
Depression during pregnancy: scores
Depression scores during pregnancy were reported by five trials using four different methods (Beck Depression Inventory (BDI), HAM‐D, EPDS and the Montgomery–Åsberg Depression Rating Scale (MADRS)). Only BDI showed a result favouring omega‐3 LCPUFA over no omega‐3 (MD ‐5.86 points 95% CI ‐8.32 to ‐3.39; 2 trials, 104 participants) with the other three comparisons showing no evidence of an effect (Analysis 1.25).
1.25. Analysis.
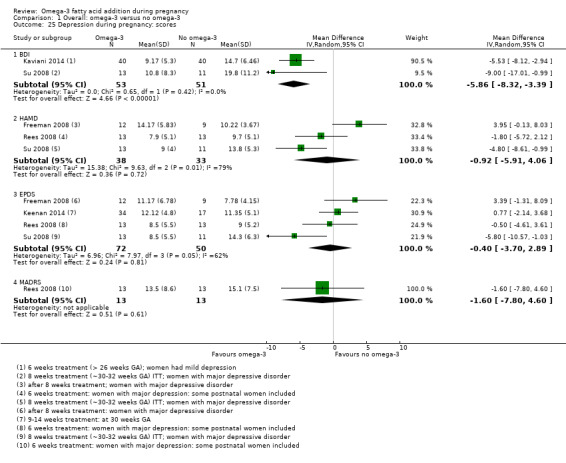
Comparison 1 Overall: omega‐3 versus no omega‐3, Outcome 25 Depression during pregnancy: scores.
Anxiety during pregnancy
Only Carlson 2013 reported on anxiety during pregnancy, and observed no evidence of a difference between omega‐3 LCPUFA and no omega‐3 (RR 0.95, 95% CI 0.06 to 15.12; 301 participants; Analysis 1.26).
1.26. Analysis.
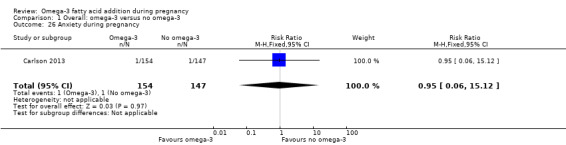
Comparison 1 Overall: omega‐3 versus no omega‐3, Outcome 26 Anxiety during pregnancy.
Difficult life circumstances (maternal)
Only Keenan 2014 reported on difficult life circumstances (maternal), indicating no evidence of a difference between omega‐3 LCPUFA and no omega‐3 (MD 0.32, 95% CI ‐0.15 to 0.79; 51 participants; Analysis 1.27).
1.27. Analysis.
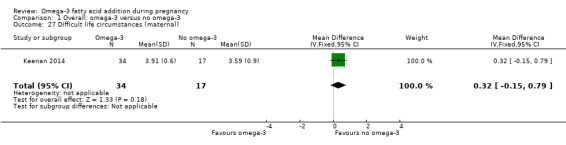
Comparison 1 Overall: omega‐3 versus no omega‐3, Outcome 27 Difficult life circumstances (maternal).
Stress (maternal)
Keenan 2014 was also the only trial to report on maternal stress, showing no important difference between omega‐3 LCPUFA and no omega‐3 as measured by the perceived stress scale (MD ‐1.82 points, 95% CI ‐3.68 to 0.04; 51 participants; Analysis 1.28).
1.28. Analysis.
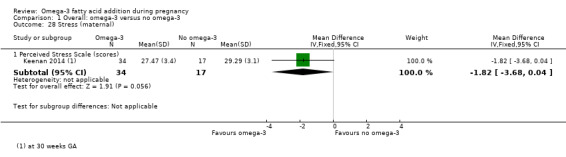
Comparison 1 Overall: omega‐3 versus no omega‐3, Outcome 28 Stress (maternal).
Depressive symptoms postpartum: thresholds
Postpartum depression scores were reported by four trials using three different methods (Postpartum Depression Screening Scale (PDSS) ≥ 80, EPDS, and major depressive disorder), with none of the trials showing clear differences between omega‐3 LCPUFA and no omega‐3 (Analysis 1.29).
1.29. Analysis.
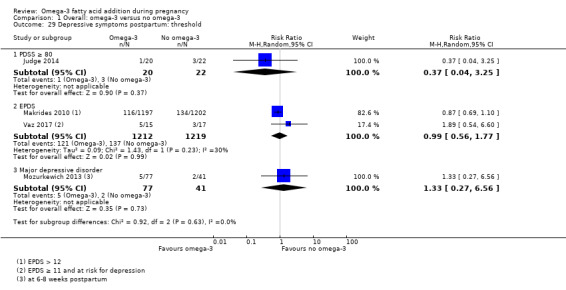
Comparison 1 Overall: omega‐3 versus no omega‐3, Outcome 29 Depressive symptoms postpartum: threshold.
Depressive symptoms postpartum: scores
Only two trials reported on scores for postpartum depressive symptoms (Judge 2014; Mozurkewich 2013), and found no clear differences between omega‐3 LCPUFA and no omega‐3 for either BDI, PDSS overall or components of PDSS up to six months postpartum (Analysis 1.30).
1.30. Analysis.
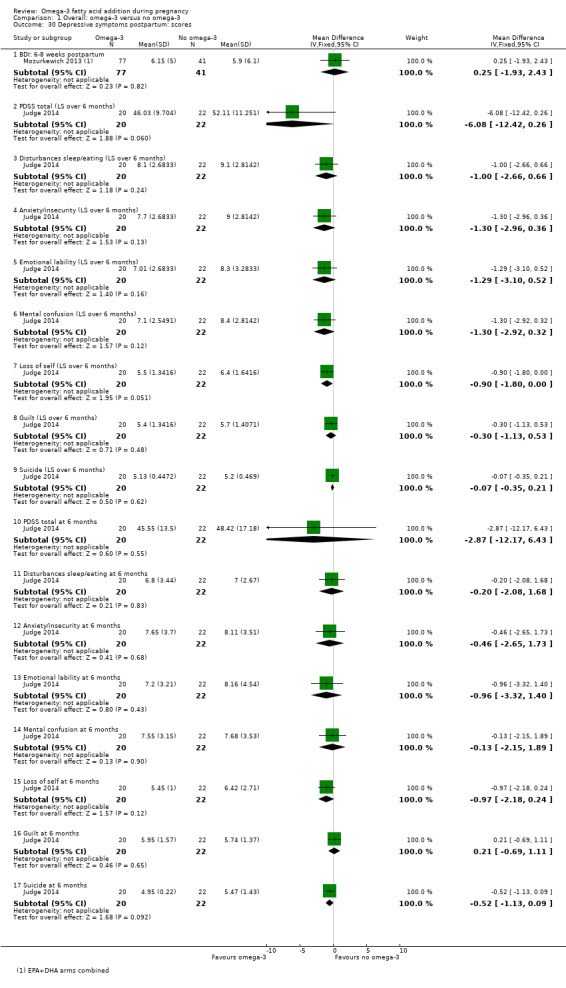
Comparison 1 Overall: omega‐3 versus no omega‐3, Outcome 30 Depressive symptoms postpartum: scores.
Length of gestation (days)
There was an increase in length of gestation with omega‐3 LCPUFA compared with no omega‐3 (average MD 1.67 days, 95% CI 0.95 to 2.39; Tau² = 2.33; P < 0.0001; I² = 52%; 41 trials, 12,517 participants; moderate‐quality evidence; Analysis 1.31). Reasons for the high statistical heterogeneity are not readily apparent, although there were wide variations in populations, inclusion criteria and doses of omega‐3. Additionally, it was not always clear how length of gestation was determined and this may have varied across studies. No obvious asymmetry was observed on visual assessment of a funnel plot for this outcome (Figure 9).
1.31. Analysis.
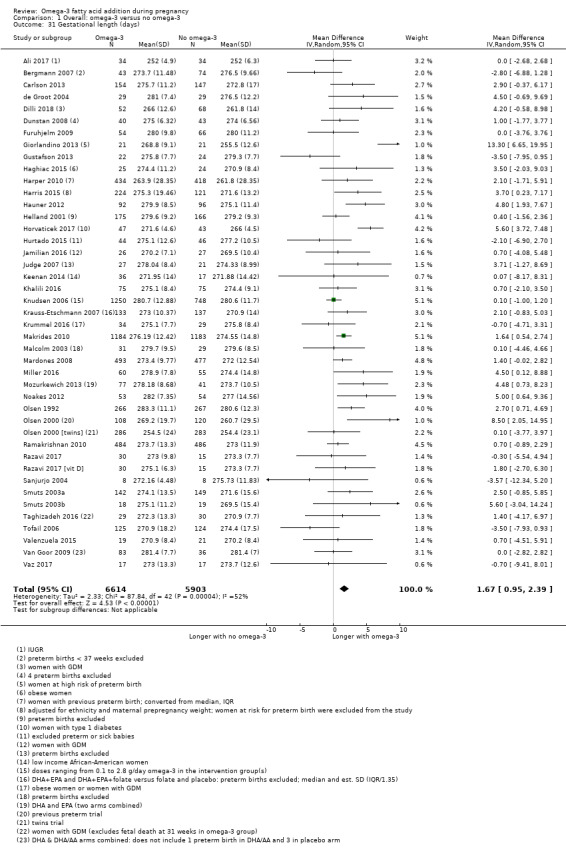
Comparison 1 Overall: omega‐3 versus no omega‐3, Outcome 31 Gestational length (days).
9.
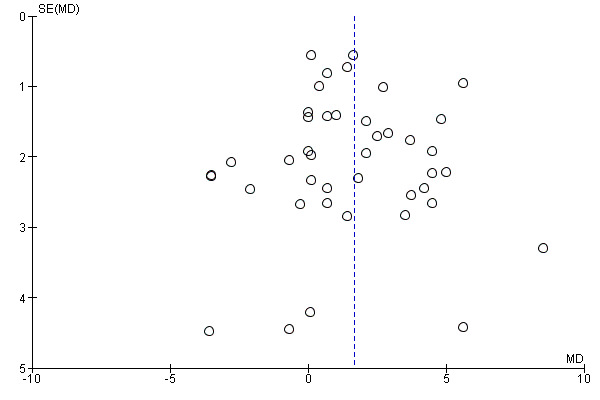
Funnel plot of comparison: 1 OVERALL omega‐3 versus placebo/no omega‐3, outcome: 1.31 Length of gestation (days).
Baby/infant/child
Perinatal death
There were fewer perinatal deaths in the omega‐3 LCPUFA groups than the no omega‐3 groups, though this did not reach conventional statistical significance (RR 0.75, 95% CI 0.54 to 1.03; 10 trials, 7416 participants; moderate‐quality evidence; Analysis 1.32). No obvious asymmetry was observed on visual assessment of a funnel plot for this outcome (Figure 10).
1.32. Analysis.
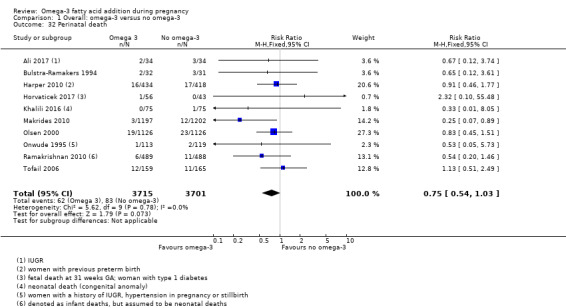
Comparison 1 Overall: omega‐3 versus no omega‐3, Outcome 32 Perinatal death.
10.
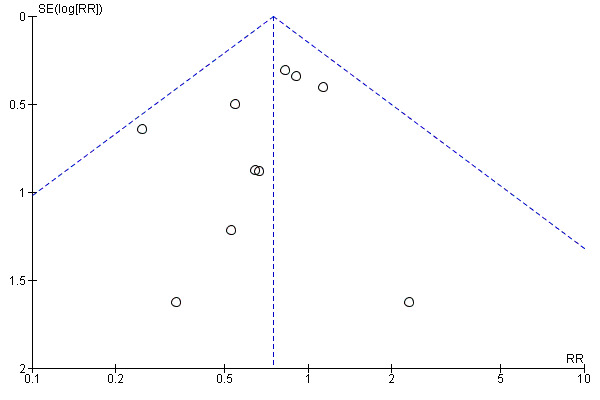
Funnel plot of comparison: 1 OVERALL omega‐3 versus no omega‐3, outcome: 1.32 Perinatal death.
Stillbirth
No clear differences in stillbirth were seen between omega‐3 LCPUFA and no omega‐3 (RR 0.94, 95% CI 0.62 to 1.42; 16 trials, 7880 participants; Analysis 1.33). No obvious asymmetry was observed on visual assessment of a funnel plot for this outcome (Figure 11).
1.33. Analysis.
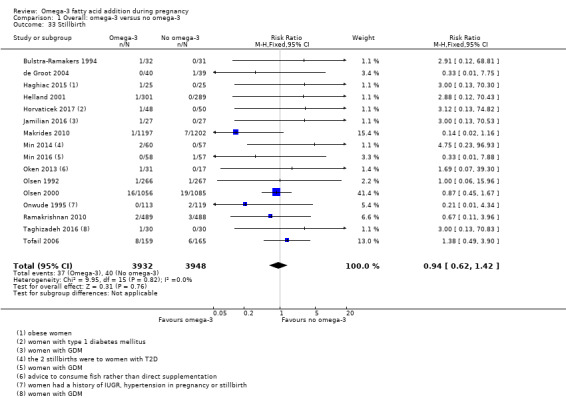
Comparison 1 Overall: omega‐3 versus no omega‐3, Outcome 33 Stillbirth.
11.
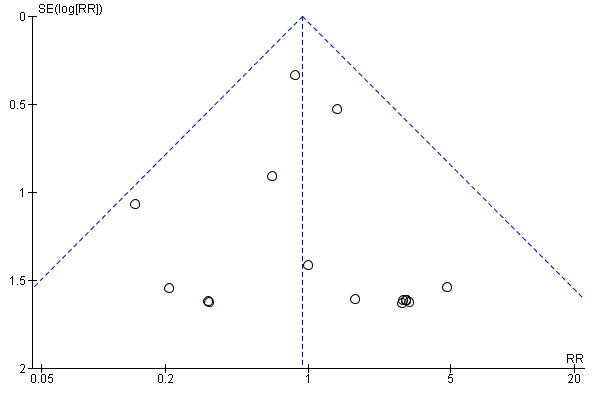
Funnel plot of comparison: 1 Omega‐3 versus placebo/no omega‐3: OVERALL, outcome: 1.32 Stillbirth.
Neonatal death
No clear difference between omega‐3 LCPUFA and no omega‐3 was seen for neonatal death (RR 0.61, 95% CI 0.34 to 1.11; 9 trials, 7448 participants; Analysis 1.34).
1.34. Analysis.
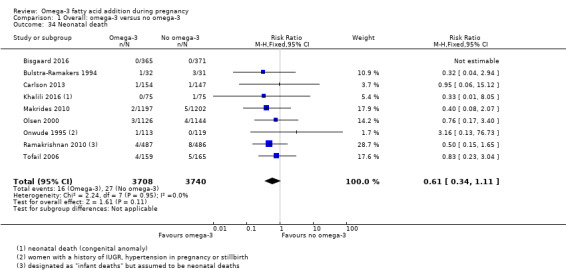
Comparison 1 Overall: omega‐3 versus no omega‐3, Outcome 34 Neonatal death.
Infant death
Four trials reported on infant death (Carlson 2013; Makrides 2010; Mulder 2014; Tofail 2006), and observed no evidence of a difference in risk between the omega‐3 LCPUFA and no omega‐3 groups (RR 0.74, 95% CI 0.25 to 2.19; 3239 participants; Analysis 1.35).
1.35. Analysis.
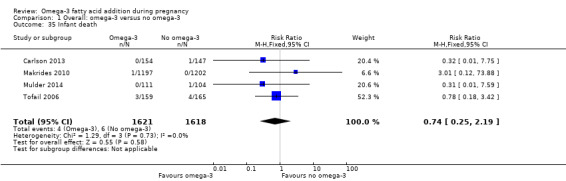
Comparison 1 Overall: omega‐3 versus no omega‐3, Outcome 35 Infant death.
Large‐for‐gestational age
Six trials reported on large‐for‐gestational age (generally defined as greater than the 90th percentile) (Dilli 2018; Harper 2010; Hauner 2012; Makrides 2010; Min 2014; Taghizadeh 2016), with a possible small increase in risk with omega‐3 LCPUFA than no omega‐3 (RR 1.15, 95% CI 0.97 to 1.03; 3722 participants; moderate‐quality evidence; Analysis 1.36). This outcome was not prespecified in the protocol.
1.36. Analysis.
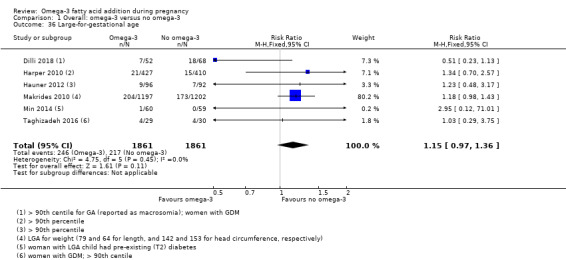
Comparison 1 Overall: omega‐3 versus no omega‐3, Outcome 36 Large‐for‐gestational age.
Macrosomia
For macrosomia (generally defined as birthweight < 4000 g), no clear differences were seen between omega‐3 LCPUFA and no omega‐3 (RR 0.69, 95% CI 0.43 to 1.13; 6 trials, 2008 participants; Analysis 1.37). This outcome was not prespecified in the protocol.
1.37. Analysis.
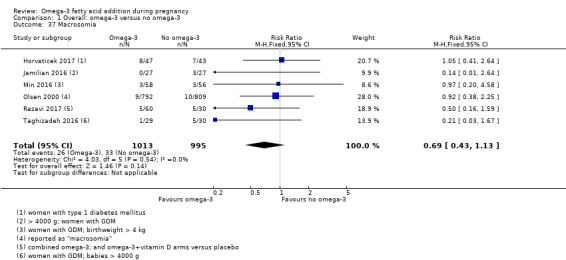
Comparison 1 Overall: omega‐3 versus no omega‐3, Outcome 37 Macrosomia.
Low birthweight (< 2500 g)
Rates of low birthweight (< 2500 g) showed a 10% relative risk reduction with omega‐3 LCPUFA compared with no omega‐3 (RR 0.90, 95% CI 0.82 to 0.99; 15 trials, 8449 participants; high‐quality evidence Analysis 1.38). No obvious asymmetry was observed on visual assessment of a funnel plot for this outcome (Figure 12).
1.38. Analysis.
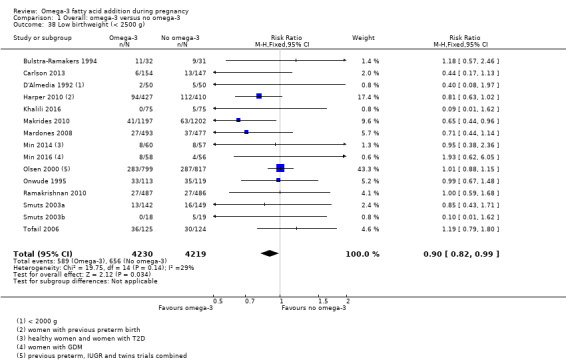
Comparison 1 Overall: omega‐3 versus no omega‐3, Outcome 38 Low birthweight (< 2500 g).
12.
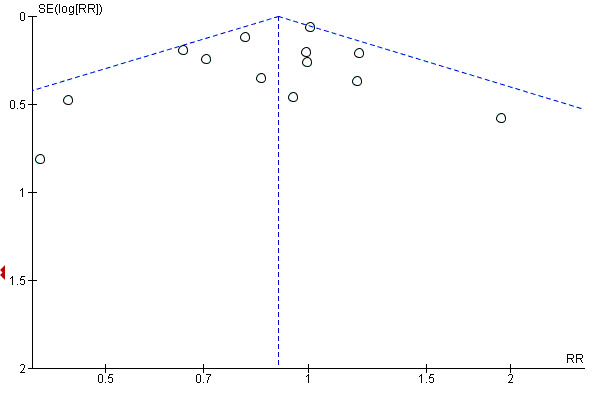
Funnel plot of comparison: 1 Omega‐3 versus placebo/no omega‐3: OVERALL, outcome: 1.38 Low birthweight (< 2500 g).
Small‐for‐gestational age or intrauterine growth restriction (IUGR)
There was little or no evidence of a difference in risk of small‐for‐gestational age or IUGR between omega‐3 LCPUFA and no omega‐3 (RR 1.01, 95% CI 0.90 to 1.13; 8 trials, 6907 participants; moderate‐quality evidence; Analysis 1.39).
1.39. Analysis.
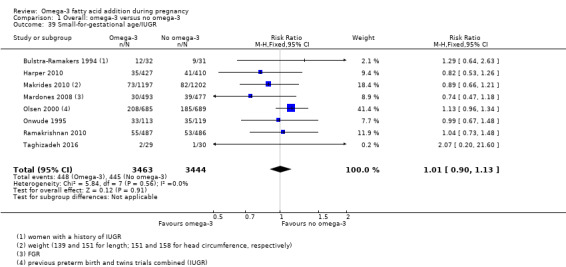
Comparison 1 Overall: omega‐3 versus no omega‐3, Outcome 39 Small‐for‐gestational age/IUGR.
Birthweight (g)
Birthweight was higher in the omega‐3 LCPUFA group than the no omega‐3 group (average MD 75.74 g, 95% CI 38.05 to 113.43; Tau² = 7943.10; P < 0.00001; I² = 66%; 42 trials, 11,584 participants; Analysis 1.40). Reasons for the high statistical heterogeneity were not readily apparent, although there was a wide variation in birthweights between studies and inclusion criteria. No obvious asymmetry was observed on visual assessment of a funnel plot for this outcome (Figure 13).
1.40. Analysis.
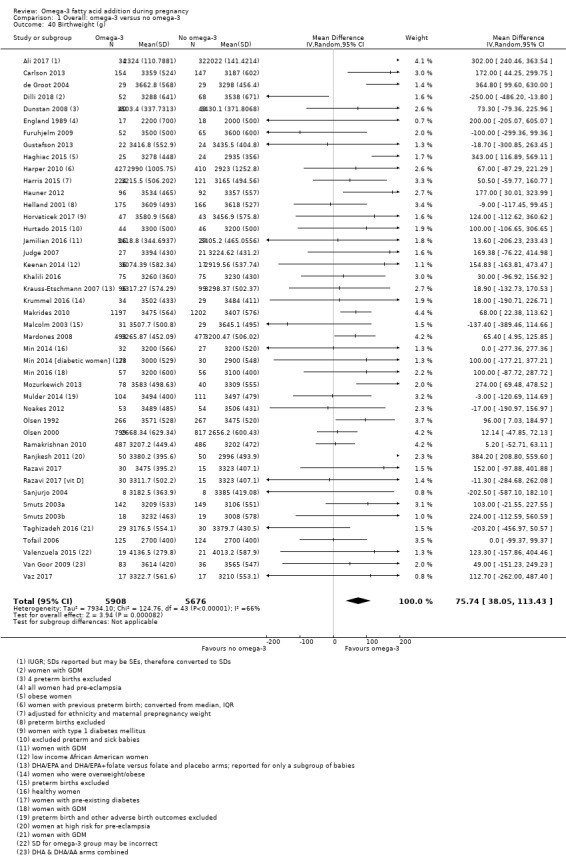
Comparison 1 Overall: omega‐3 versus no omega‐3, Outcome 40 Birthweight (g).
13.
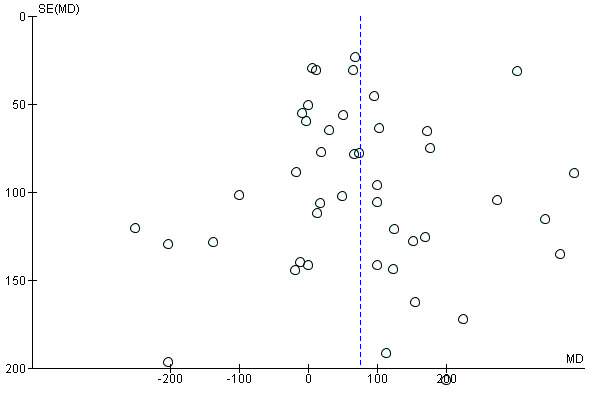
Funnel plot of comparison: 1 Omega‐3 versus placebo/no omega‐3: OVERALL, outcome: 1.41 Birthweight (g).
Birthweight Z score
Four trials reported on birthweight Z score (Bergmann 2007; Krummel 2016; Makrides 2010; Mulder 2014), and there was no evidence of a difference between omega‐3 LCPUFA and no omega‐3 (MD 0.06, 95% CI ‐0.02 to 0.13; 2792 participants; Analysis 1.41).
1.41. Analysis.
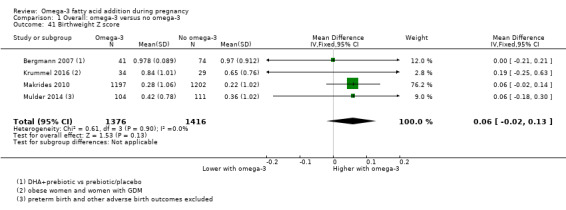
Comparison 1 Overall: omega‐3 versus no omega‐3, Outcome 41 Birthweight Z score.
Birth length (cm)
There was no evidence of a difference in birth length for omega‐3 LCPUFA compared with no omega‐3 (MD 0.11 cm, 95% CI ‐0.10 to 0.31; Tau² = 0.13; P = 0.0001, I² = 57%; 28 trials, 8128 participants; Analysis 1.42). No clear asymmetry was observed on visual assessment of a funnel plot for this outcome (Figure 14).
1.42. Analysis.
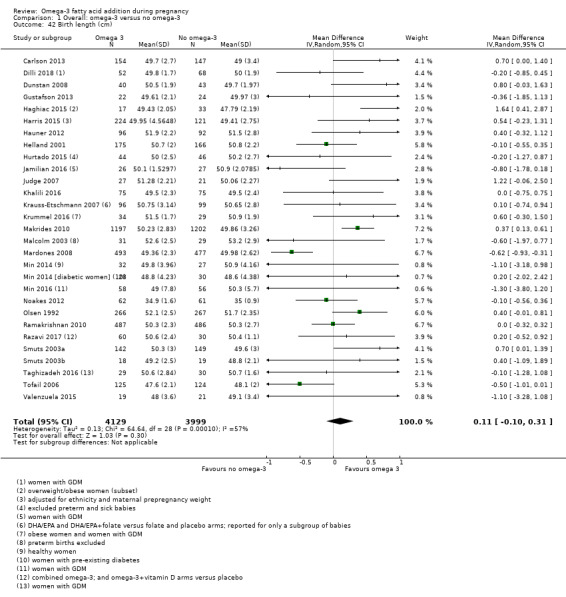
Comparison 1 Overall: omega‐3 versus no omega‐3, Outcome 42 Birth length (cm).
14.
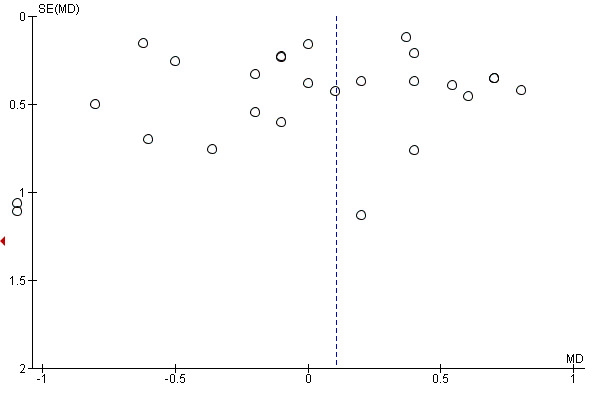
Funnel plot of comparison: 1 Omega‐3 versus placebo/no omega‐3: OVERALL, outcome: 1.43 Birth length (cm).
Head circumference at birth (cm)
There was no evidence of a difference in head circumference at birth for omega‐3 LCPUFA compared with no omega‐3 (average MD 0.07 cm, 95% CI ‐0.05 to 0.19; 22 trials, 7161 participants; Tau² 0.02, P = 0.06, I² = 33%, Analysis 1.43). No clear asymmetry was observed on visual assessment of a funnel plot for this outcome (Figure 15).
1.43. Analysis.
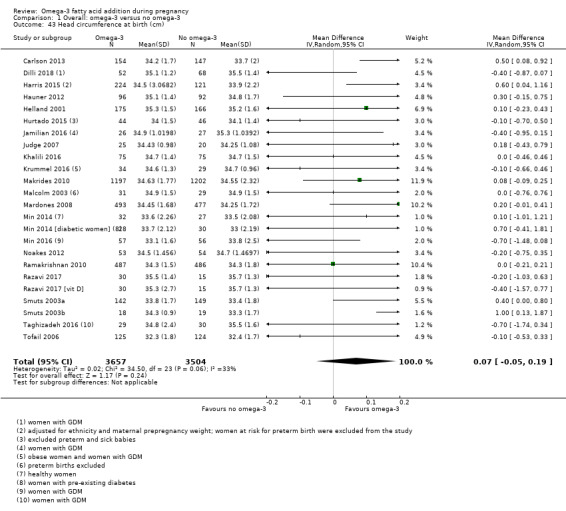
Comparison 1 Overall: omega‐3 versus no omega‐3, Outcome 43 Head circumference at birth (cm).
15.
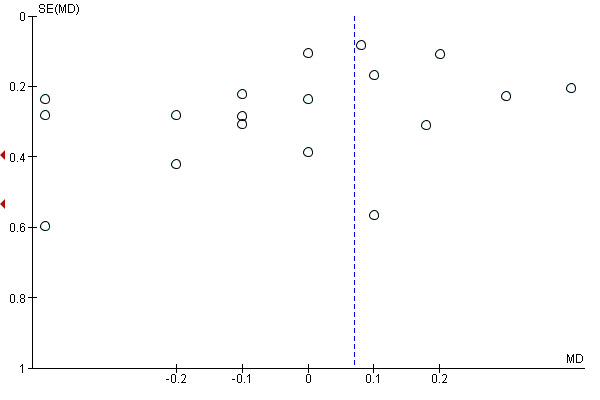
Funnel plot of comparison: 1 Omega‐3 versus placebo/no omega‐3: OVERALL, outcome: 1.45 Head circumference at birth (cm).
Head circumference at birth Z score
Only two trials reported on head circumference at birth Z score (Krummel 2016; Makrides 2010), and there was no evidence of a difference between the omega‐3 LCPUFA and no omega‐3 groups (MD ‐0.03, 95% CI ‐0.14 to 0.07; 2462 participants; Analysis 1.44).
1.44. Analysis.
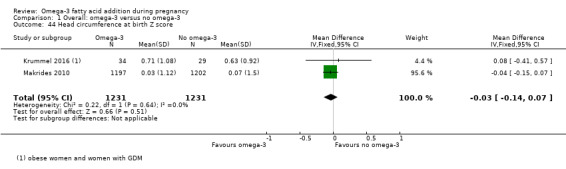
Comparison 1 Overall: omega‐3 versus no omega‐3, Outcome 44 Head circumference at birth Z score.
Length at birth Z score
Only two trials reported on length at birth Z score (Krummel 2016; Makrides 2010), and observed no clear difference between omega‐3 LCPUFA and no omega‐3 (average MD 0.18, 95% CI ‐0.18 to 0.54; Tau² = 0.05; P = 0.12; I² = 59%; 2462 participants; Analysis 1.45).
1.45. Analysis.
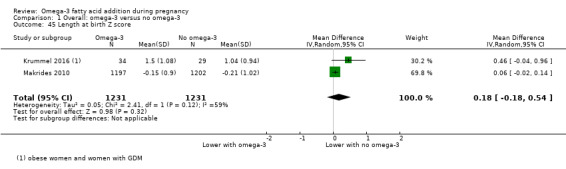
Comparison 1 Overall: omega‐3 versus no omega‐3, Outcome 45 Length at birth Z score.
Baby admitted to neonatal care
There was an 8% relative reduced risk of a baby being admitted to neonatal care with omega‐3 LCPUFA compared with no omega‐3, although this did not reach conventional statistical significance (RR 0.92, 95% CI 0.83 to 1.03; 9 trials, 6920 participants; Analysis 1.46).
1.46. Analysis.
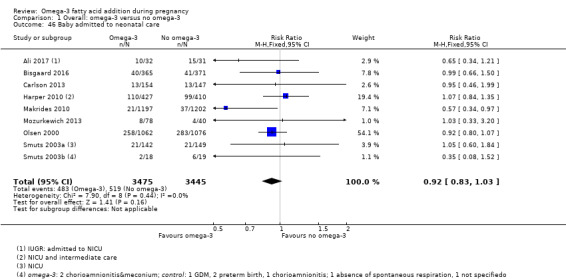
Comparison 1 Overall: omega‐3 versus no omega‐3, Outcome 46 Baby admitted to neonatal care.
Infant length of stay in hospital (days)
Only Olsen 2000 reported on infant length of stay in hospital and observed no evidence of a difference in length between the omega‐3 LCPUFA and no omega‐3 groups (MD 0.11 days, 95% CI ‐1.40 to 1.62; 2014 participants; Analysis 1.47).
1.47. Analysis.
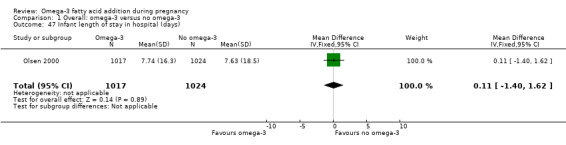
Comparison 1 Overall: omega‐3 versus no omega‐3, Outcome 47 Infant length of stay in hospital (days).
Congenital anomalies
Three trials reported on congenital anomalies (Carlson 2013; Olsen 1992; Ramakrishnan 2010), and observed no clear difference between the omega‐3 LCPUFA and no omega‐3 groups (RR 1.08, 95% CI 0.61 to 1.92; 1807 participants; Analysis 1.48).
1.48. Analysis.
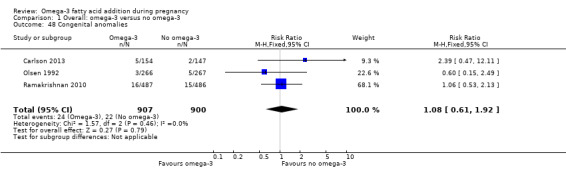
Comparison 1 Overall: omega‐3 versus no omega‐3, Outcome 48 Congenital anomalies.
Retinopathy of prematurity
Only one trial reported on retinopathy of prematurity (Harper 2010), and there was no clear difference between the omega‐3 LCPUFA and no omega‐3 groups (RR 1.20, 95% CI 0.32 to 4.44; 837 participants; Analysis 1.49).
1.49. Analysis.
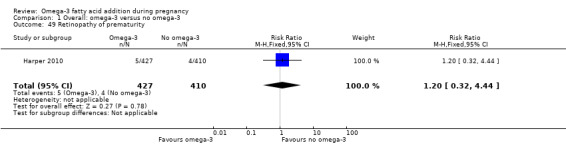
Comparison 1 Overall: omega‐3 versus no omega‐3, Outcome 49 Retinopathy of prematurity.
Bronchopulmonary dysplasia
Only Harper 2010 and Makrides 2010 reported on bronchopulmonary dysplasia, and there was no clear difference between the omega‐3 LCPUFA and no omega‐3 groups (RR 1.06, 95% CI 0.45 to 2.48; 3191 participants; Analysis 1.50).
1.50. Analysis.
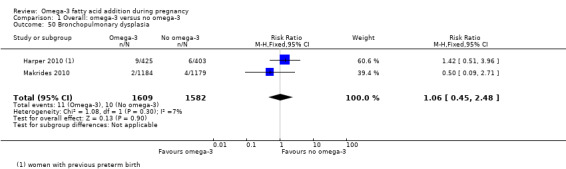
Comparison 1 Overall: omega‐3 versus no omega‐3, Outcome 50 Bronchopulmonary dysplasia.
Respiratory distress syndrome
Two trials reported on respiratory distress syndrome (Carlson 2013; Harper 2010), and found no clear difference between the omega‐3 LCPUFA and no omega‐3 groups (average RR 1.17, 95% CI 0.54 to 2.52; Tau² = 0.21; P = 0.09; I² = 66%; 1129 participants; Analysis 1.51). Reasons for the statistical heterogeneity were not readily apparent although all the women in Harper 2010 had experienced a previous preterm birth and were treated with weekly intramuscular progesterone injections.
1.51. Analysis.
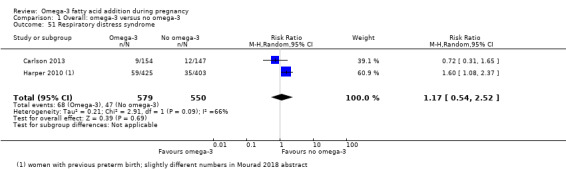
Comparison 1 Overall: omega‐3 versus no omega‐3, Outcome 51 Respiratory distress syndrome.
Necrotising enterocolitis (NEC)
Only Harper 2010 and Makrides 2010 reported on NEC, and found no clear difference between the omega‐3 LCPUFA and no omega‐3 groups (RR 0.97, 95% CI 0.26 to 3.55; 3198 participants; Analysis 1.52).
1.52. Analysis.
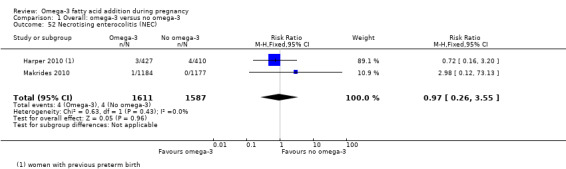
Comparison 1 Overall: omega‐3 versus no omega‐3, Outcome 52 Necrotising enterocolitis (NEC).
Neonatal sepsis (proven)
Harper 2010, Helland 2001 and Makrides 2010 reported on proven neonatal sepsis, and found no evidence of a difference in risk between the omega‐3 LCPUFA and no omega‐3 groups (RR 0.97, 95% CI 0.44 to 2.14; 3788 participants; Analysis 1.53).
1.53. Analysis.
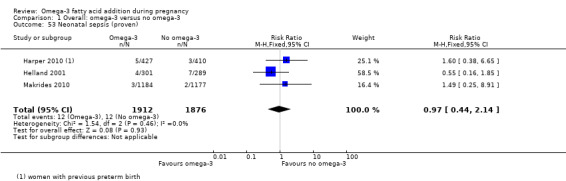
Comparison 1 Overall: omega‐3 versus no omega‐3, Outcome 53 Neonatal sepsis (proven).
Convulsion
Only Makrides 2010 reported on convulsion, and observed no clear difference between the omega‐3 LCPUFA and no omega‐3 groups (RR 0.09, 95% CI 0.01 to 1.63; 2361 participants; Analysis 1.54).
1.54. Analysis.
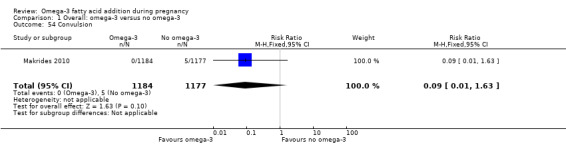
Comparison 1 Overall: omega‐3 versus no omega‐3, Outcome 54 Convulsion.
Intraventricular haemorrhage
Three trials reported on intraventricular haemorrhage (Harper 2010; Makrides 2010; Olsen 2000), and found no evidence of a difference in risk between the omega‐3 LCPUFA and no omega‐3 groups in any intraventricular haemorrhage (RR 1.00, 95% CI 0.29 to 3.49; random effects; Tau² = 0.63; P = 0.12, I² = 53%; 5423 participants). Although Makrides 2010 showed a marked reduction in intraventricular haemorrhage, reasons for the statistical heterogeneity were not clear. Harper 2010 also reported Grade 3 or 4 intraventricular haemorrhage, finding no clear differences between omega‐3 LCPUFA and no omega‐3 (RR 1.60, 95% CI 0.38 to 6.65; 837 participants; Analysis 1.55).
1.55. Analysis.
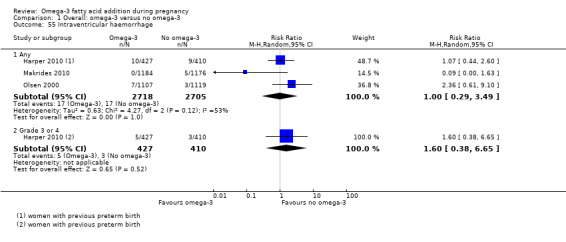
Comparison 1 Overall: omega‐3 versus no omega‐3, Outcome 55 Intraventricular haemorrhage.
Neonatal/infant adverse events
There was possibly a small decrease for any adverse events in neonates/infants with omega‐3 LCPUFA compared with no omega‐3 (RR 0.92, 95% CI 0.82 to 1.02; 2 trials, 592 participants; Analysis 1.56). For serious neonatal/infant adverse events, there was a reduced risk with omega‐3 LCPUFA compared with no omega‐3 (RR 0.72, 95% CI 0.53 to 0.99; 2 trials, 2690 participants; low‐quality evidence; Analysis 1.56).
1.56. Analysis.
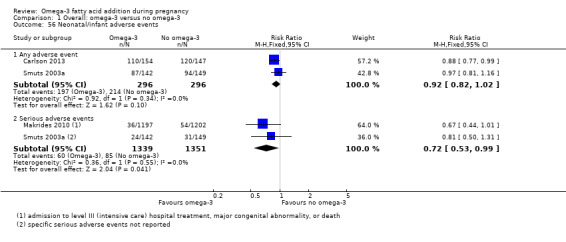
Comparison 1 Overall: omega‐3 versus no omega‐3, Outcome 56 Neonatal/infant adverse events.
Neonatal/infant morbidity
One trial of 291 infants reported on neonatal/infant cardiovascular, respiratory or morbidity caused by pregnancy/birth (Smuts 2003a), and found no evidence of difference between omega‐3 LCPUFA and no omega‐3 (Analysis 1.57; Analysis 1.58 and Analysis 1.59 respectively).
1.57. Analysis.
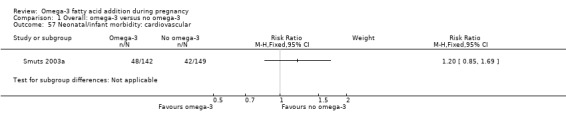
Comparison 1 Overall: omega‐3 versus no omega‐3, Outcome 57 Neonatal/infant morbidity: cardiovascular.
1.58. Analysis.

Comparison 1 Overall: omega‐3 versus no omega‐3, Outcome 58 Neonatal/infant morbidity: respiratory.
1.59. Analysis.
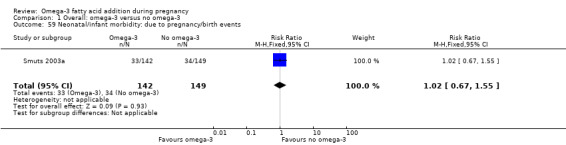
Comparison 1 Overall: omega‐3 versus no omega‐3, Outcome 59 Neonatal/infant morbidity: due to pregnancy/birth events.
Another trial with 834 participants reported on neonatal/infant morbidity (Ramakrishnan 2010), and found no important differences in rates between omega‐3 LCPUFA and no omega‐3 for colds, fevers, rash, respiratory illnesses, vomiting, diarrhoea or other illnesses up to six months of age (Analysis 1.60).
1.60. Analysis.
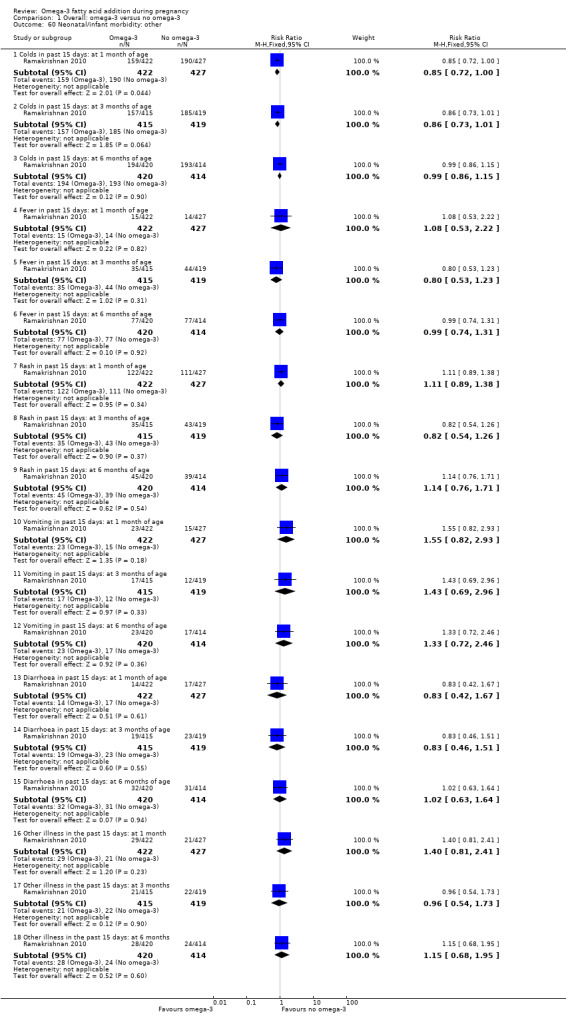
Comparison 1 Overall: omega‐3 versus no omega‐3, Outcome 60 Neonatal/infant morbidity: other.
Infant/child morbidity
Makrides 2010 reported on infant/child morbidity, and found a potentially reduced risk of ICU admissions for omega‐3 LCPUFA compared with no omega‐3 (RR 0.58, 95% CI 0.31 to 1.06; 1396 participants, but no clear differences for medical diagnosis of attention deficit hyperactivity disorder; autism spectrum disorder; other learning/behavioural disorders or other chronic health conditions; Analysis 1.61).
1.61. Analysis.
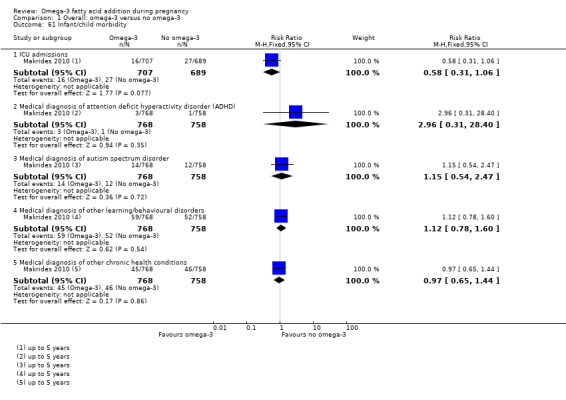
Comparison 1 Overall: omega‐3 versus no omega‐3, Outcome 61 Infant/child morbidity.
Ponderal index (g/m³ x 100)
There was no evidence of a difference in ponderal index between the omega‐3 LCPUFA and no omega‐3 groups (MD 0.05 g/m³ x 100, 95% CI ‐0.01 to 0.11; random effects, Tau² = 0.00, P = 0.07, I² = 50%, 6 trials, 887 participants; Analysis 1.62).
1.62. Analysis.
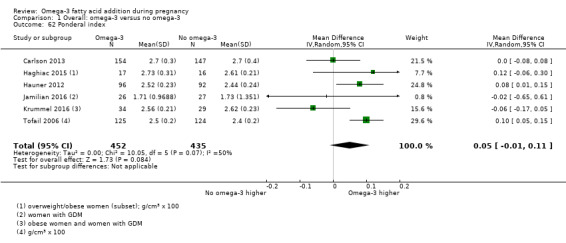
Comparison 1 Overall: omega‐3 versus no omega‐3, Outcome 62 Ponderal index.
Infant/child weight (kg)
A total of 10 trials reported on infant/child weight at various time points, and there was no evidence of a difference between the omega‐3 LCPUFA and no omega‐3 groups at any of the time points from six weeks to seven years of age (Analysis 1.63).
1.63. Analysis.
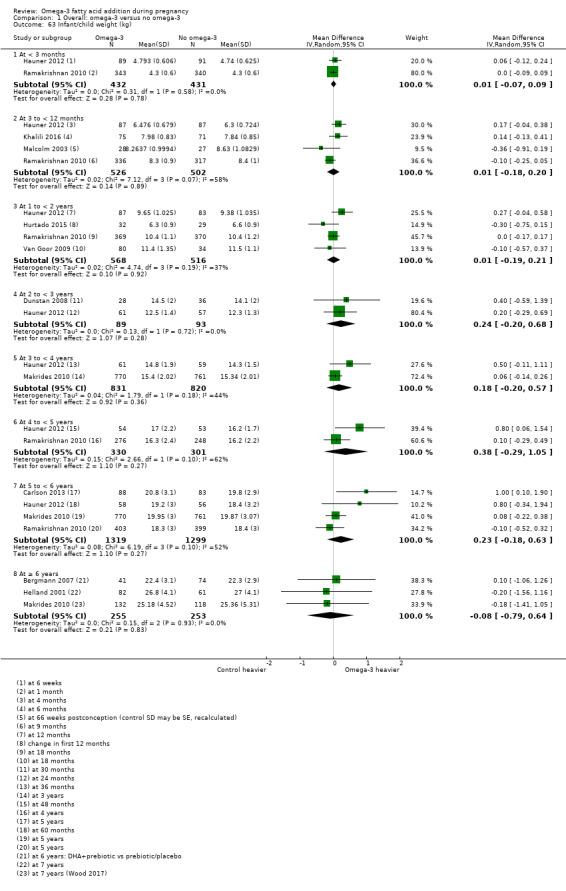
Comparison 1 Overall: omega‐3 versus no omega‐3, Outcome 63 Infant/child weight (kg).
Infant/child length/height (cm)
Ten trials reported on length/height at various time points, and there was no evidence of a difference between the omega‐3 and no omega‐3 groups from six weeks to five years. However there was evidence of child height being lower in the omega‐3 LCPUFA compared with no omega‐3 groups at seven years (MD ‐1.22 cm 95% CI ‐2.29 to ‐0.16; 2 trials, 393 participants; Analysis 1.64).
1.64. Analysis.
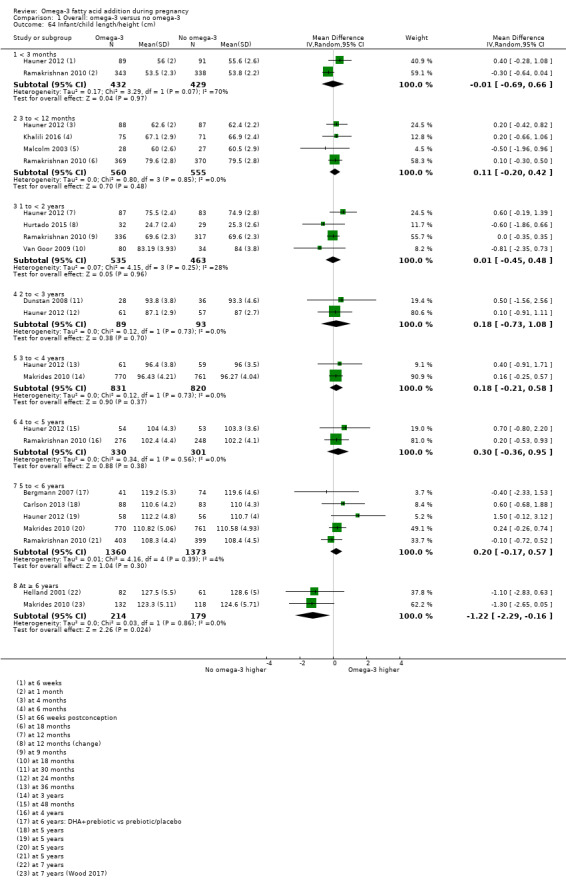
Comparison 1 Overall: omega‐3 versus no omega‐3, Outcome 64 Infant/child length/height (cm).
Infant/child head circumference (cm)
A total of 10 trials reported on infant/child head circumference at various time points, and there was no evidence of a difference between the omega‐3 LCPUFA and no omega‐3 groups at any of the time points from six weeks to six years of age (Analysis 1.65).
1.65. Analysis.
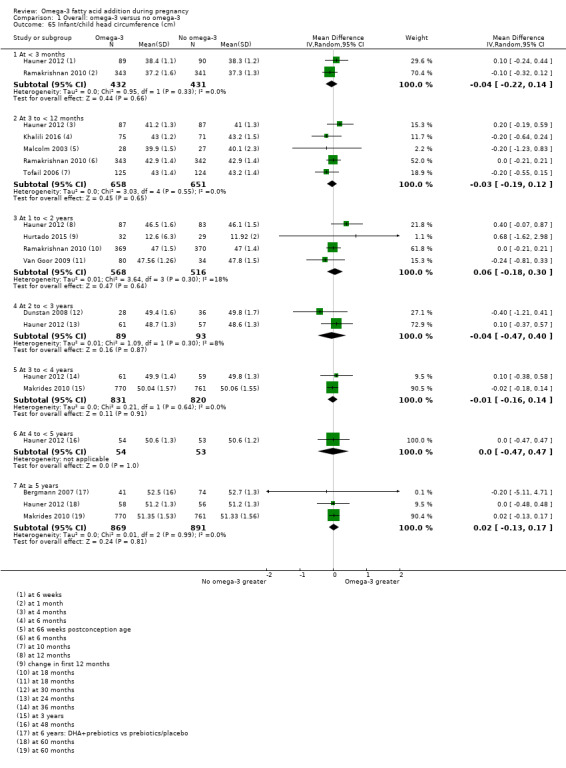
Comparison 1 Overall: omega‐3 versus no omega‐3, Outcome 65 Infant/child head circumference (cm).
Infant/child length/height for age Z score (LAZ/HAZ)
Three trials reported on infant/child length/height for age Z score (LAZ/HAZ) at various time points (Mulder 2014; Ramakrishnan 2010; Tofail 2006), and observed no evidence of a difference between the omega‐3 LCPUFA and no omega‐3 groups at any of the time points from two months to five years (Analysis 1.66).
1.66. Analysis.
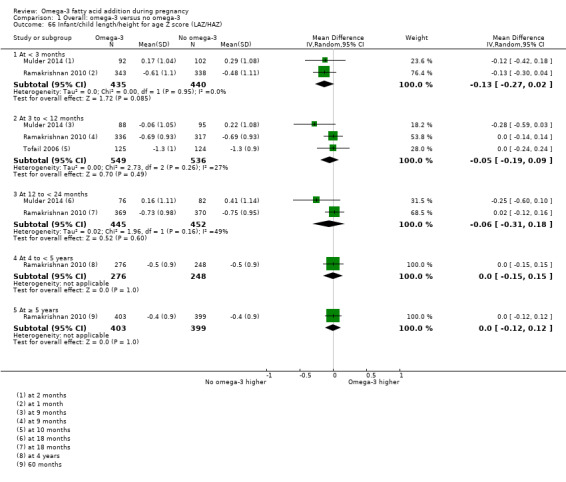
Comparison 1 Overall: omega‐3 versus no omega‐3, Outcome 66 Infant/child length/height for age Z score (LAZ/HAZ).
Infant/child waist circumference (cm)
Hauner 2012 and Makrides 2010 reported on infant/child waist circumference at various time points, and observed no evidence of a difference between the omega‐3 LCPUFA and no omega‐3 groups at any of the time points from two to five years (Analysis 1.67).
1.67. Analysis.
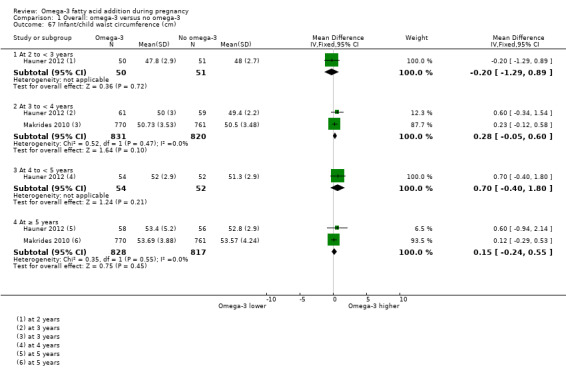
Comparison 1 Overall: omega‐3 versus no omega‐3, Outcome 67 Infant/child waist circumference (cm).
Infant/child weight‐for‐age Z score (WAZ)
Mulder 2014 and Ramakrishnan 2010 reported on infant/child weight‐for‐age Z score (WAZ) at various time points, and observed no evidence of a difference between the omega‐3 LCPUFA and no omega‐3 groups at any of the time points from one month to five years (Analysis 1.68).
1.68. Analysis.
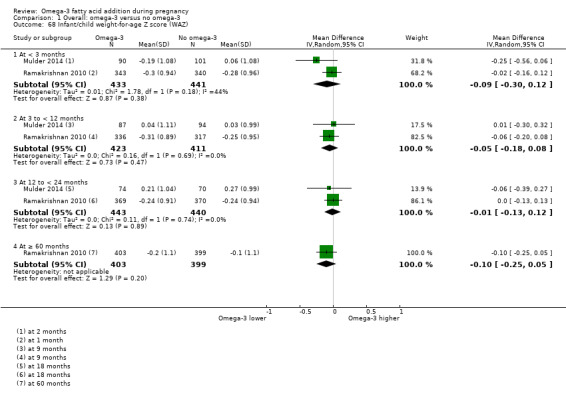
Comparison 1 Overall: omega‐3 versus no omega‐3, Outcome 68 Infant/child weight‐for‐age Z score (WAZ).
Infant/child BMI Z score
Five trials reported on infant/child BMI Z score at various time points (Bergmann 2007; Carlson 2013; Ramakrishnan 2010; Krummel 2016; Makrides 2010), and found no evidence of a difference between the omega‐3 LCPUFA and no omega‐3 groups between any of the time points from 18 months to seven years of age (Analysis 1.69).
1.69. Analysis.
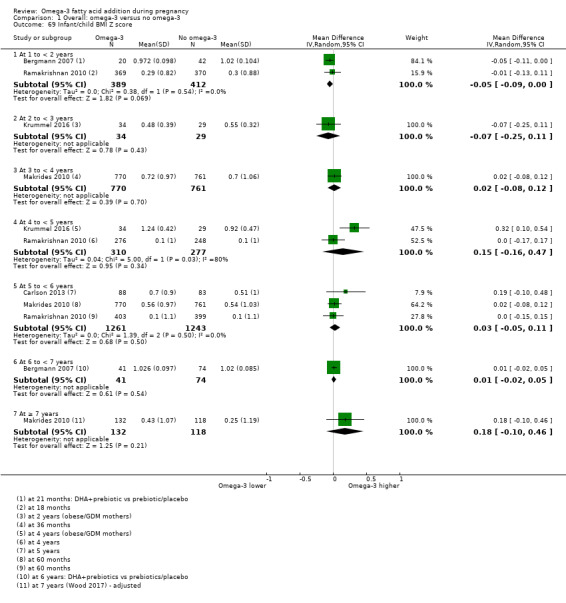
Comparison 1 Overall: omega‐3 versus no omega‐3, Outcome 69 Infant/child BMI Z score.
Infant/child weight for length/height Z score (WHZ)
Mulder 2014, Ramakrishnan 2010 and Tofail 2006 reported on infant/child weight for length/height Z score (WHZ) at various time points and there was no evidence of a difference between the omega‐3 LCPUFA and no omega‐3 groups at any of the time points from two months to 18 months old (Analysis 1.70).
1.70. Analysis.
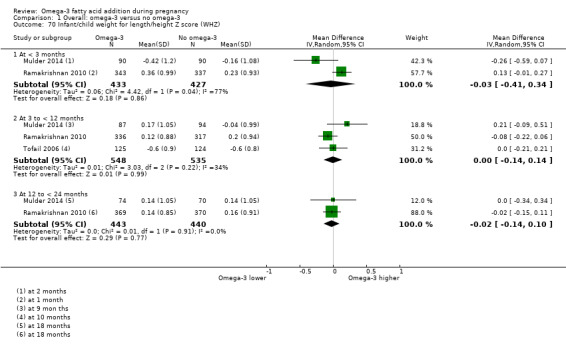
Comparison 1 Overall: omega‐3 versus no omega‐3, Outcome 70 Infant/child weight for length/height Z score (WHZ).
Infant/child BMI percentile
Only Hauner 2012 reported on infant/child BMI percentile and there was no evidence of a difference between the omega‐3 LCPUFA and no omega‐3 groups at two, three and five years of age. However a higher infant/child BMI percentile was observed in the omega‐3 LCPUFA compared with the no omega‐3 group at 48 months (MD 13.00%; 95% CI 3.19 to 22.81; 107 participants; Analysis 1.71).
1.71. Analysis.
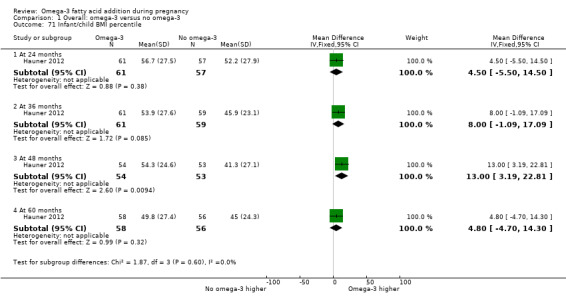
Comparison 1 Overall: omega‐3 versus no omega‐3, Outcome 71 Infant/child BMI percentile.
Child/adult BMI
Helland 2001, Makrides 2010; and Olsen 1992 reported on child/adult BMI at various time points and there was no evidence of a difference between the omega‐3 LCPUFA and no omega‐3 groups at any of the time points from three to 19 years of age (Analysis 1.72).
1.72. Analysis.
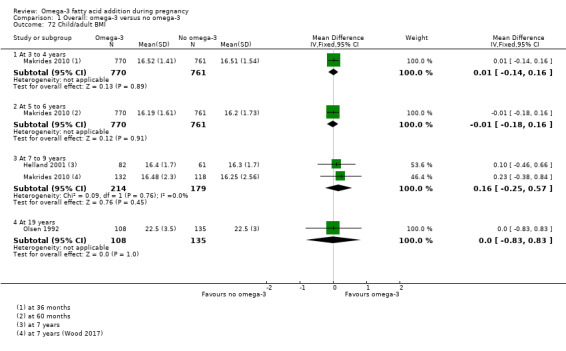
Comparison 1 Overall: omega‐3 versus no omega‐3, Outcome 72 Child/adult BMI.
Infant/child body fat (%)
Carlson 2013, Hauner 2012 and Makrides 2010 reported on infant/child body fat at various time points, and found no evidence of differences at any points from one to seven years of age between the omega‐3 LCPUFA and no omega‐3 groups (Analysis 1.73).
1.73. Analysis.
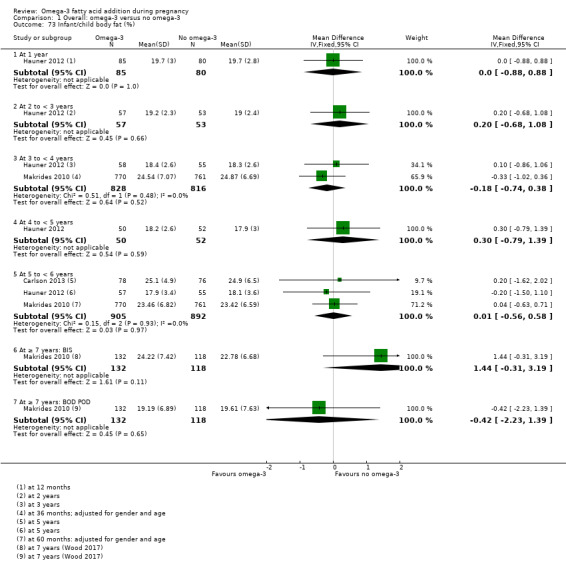
Comparison 1 Overall: omega‐3 versus no omega‐3, Outcome 73 Infant/child body fat (%).
Infant/child total fat mass (kg)
Hauner 2012 and Makrides 2010 reported on infant/child total fat mass at various time points, and found no evidence of differences at any points from one to seven years of age between the omega‐3 LCPUFA and no omega‐3 groups (Analysis 1.74).
1.74. Analysis.
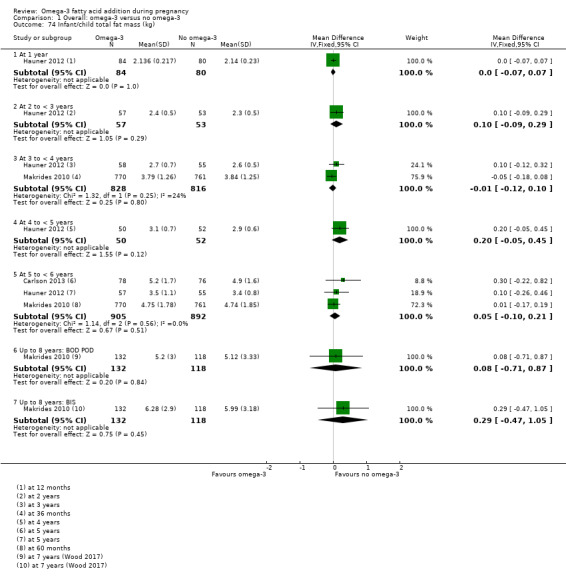
Comparison 1 Overall: omega‐3 versus no omega‐3, Outcome 74 Infant/child total fat mass (kg).
Cognition: thresholds
Makrides 2010, Mulder 2014 and Ramakrishnan 2010 reported Bayley Scales of Infant Development (BSID) II or III cognition thresholds at 18 months, and found no evidence of differences between the omega‐3 LCPUFA and no omega‐3 groups, except for BSID III < 85, which favoured omega‐3 LCPUFA, in Makrides 2010 (RR 0.49, 95% CI 0.24 to 0.98; 726 participants; Analysis 1.75).
1.75. Analysis.
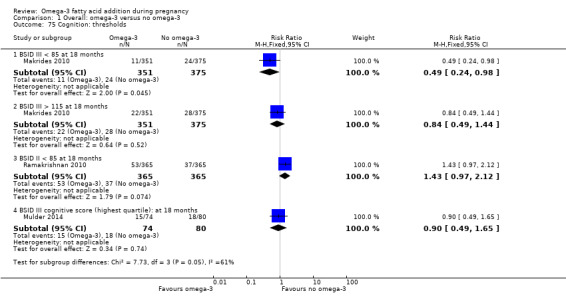
Comparison 1 Overall: omega‐3 versus no omega‐3, Outcome 75 Cognition: thresholds.
Cognition: scores
Nine trials reported cognition scores at various time points. There was no evidence of a difference in cognition scores between the omega‐3 LCPUFA and no omega‐3 groups at any time point from nine months to 12 years of age, as measured by BSID II or III, Fagan novelty preference, Kaufman Assessment Battery for Children (K‐ABC) mental processing composite, Griffith Mental Development Scale (GMDS) general quotient score, Differential Ability Scales (DAS) II, Wechsler Abbreviated Scale of Intelligence (WASI) full‐scale intelligence quotient (IQ) or Wechsler Intelligence Scale for Children (WISC) IV full scale IQ (Analysis 1.76).
1.76. Analysis.
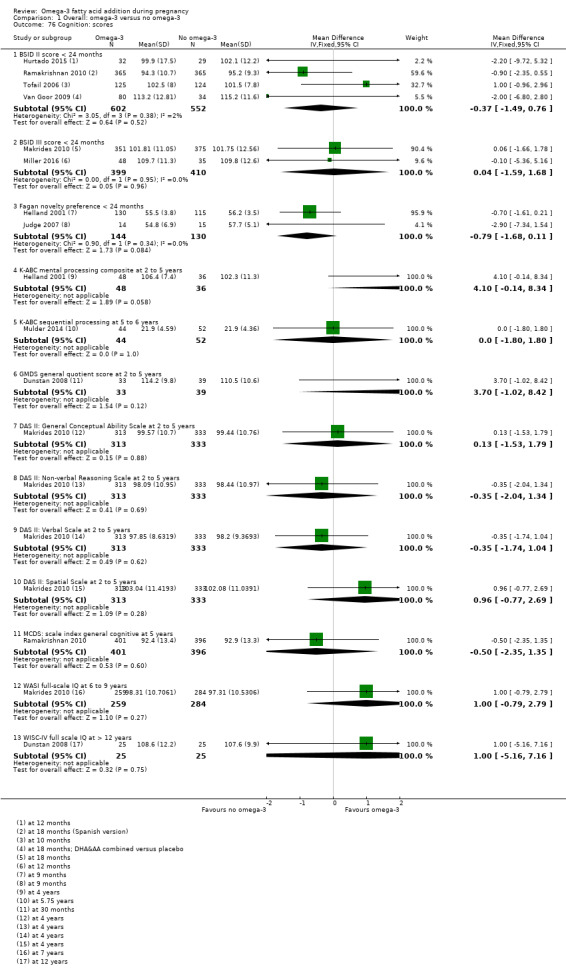
Comparison 1 Overall: omega‐3 versus no omega‐3, Outcome 76 Cognition: scores.
Attention: scores
Three trials reported on attention scores at various time points and used different assessment measures (Krauss‐Etschmann 2007, Makrides 2010; Ramakrishnan 2010). There was no evidence of a difference between omega‐3 LCPUFA and no omega‐3 groups at any time point or with any measure from 27 months to 8.5 years except in Ramakrishnan 2010, where lower attention scores were seen at five years as measured by K‐CPT omissions (MD ‐1.90, 95% CI ‐3.39 to ‐0.41; 797 participants; Analysis 1.77).
1.77. Analysis.
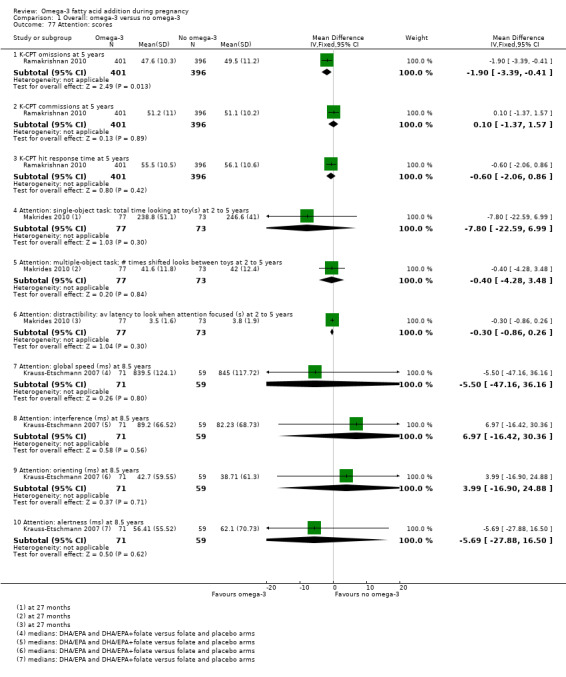
Comparison 1 Overall: omega‐3 versus no omega‐3, Outcome 77 Attention: scores.
Motor: thresholds
Two trials reported thresholds for motor scores (Mulder 2014; Ramakrishnan 2010), and observed no differences between omega‐3 LCPUFA and no omega‐3 groups at 18 months of age (Analysis 1.78).
1.78. Analysis.
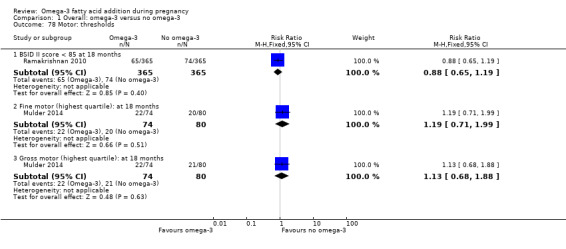
Comparison 1 Overall: omega‐3 versus no omega‐3, Outcome 78 Motor: thresholds.
Motor: scores
No difference was observed in motor scores between the omega‐3 LCPUFA and no omega‐3 groups, as measured by BSID III or II at 4 to 18 months of age across six trials (Analysis 1.79).
1.79. Analysis.
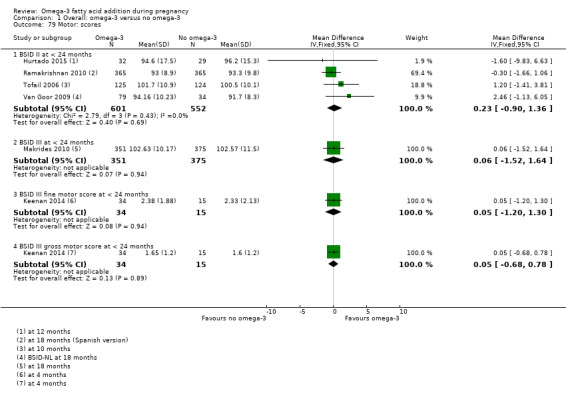
Comparison 1 Overall: omega‐3 versus no omega‐3, Outcome 79 Motor: scores.
Language: thresholds
In one trial with 726 participants there was no evidence of a difference in BSID III language score thresholds between the omega‐3 LCPUFA and no omega‐3 groups at 18 months (Makrides 2010). Howevever in Mulder 2014 (154 participants), most Communicative Development Inventories (CDI) language thresholds were higher with omega‐3 LCPUFA in children at 14 and 18 months (Analysis 1.80).
1.80. Analysis.
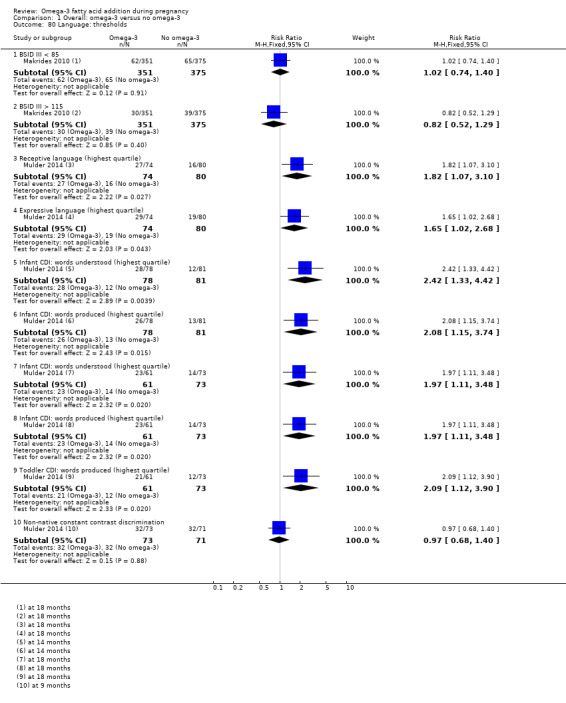
Comparison 1 Overall: omega‐3 versus no omega‐3, Outcome 80 Language: thresholds.
Language: scores
No differences between omega‐3 LCPUFA and no omega‐3 were seen in any communication or language scores in children from four months to seven years of age, across four trials (Analysis 1.81).
1.81. Analysis.
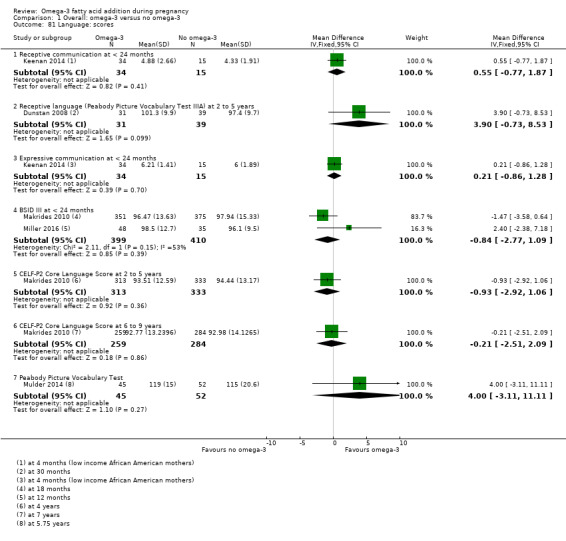
Comparison 1 Overall: omega‐3 versus no omega‐3, Outcome 81 Language: scores.
Behaviour: thresholds
In one trial with 730 participants no differences between omega‐3 LCPUFA and no omega‐3 were seen in behaviour thresholds for children at 18 months of age (Analysis 1.82) (Ramakrishnan 2010).
1.82. Analysis.
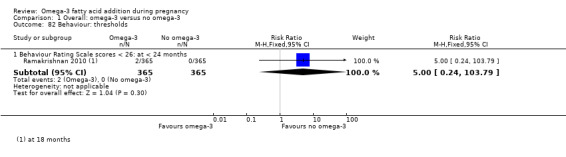
Comparison 1 Overall: omega‐3 versus no omega‐3, Outcome 82 Behaviour: thresholds.
Behaviour: scores
There were few differences between omega‐3 LCPUFA and no omega‐3 in behaviour scores in children measured with different tools and over different time points from birth to 12 years. However, there was evidence of less difficult behaviour in the placebo compared with the omega‐3 LCPUFA group as measured by the Strengths and Difficulties Questionnaire (SDQ) Total Difficulties at six to nine years in Makrides 2010 (MD 1.08, 95% CI 0.18 to 1.98; 543 participants; Analysis 1.83).
1.83. Analysis.
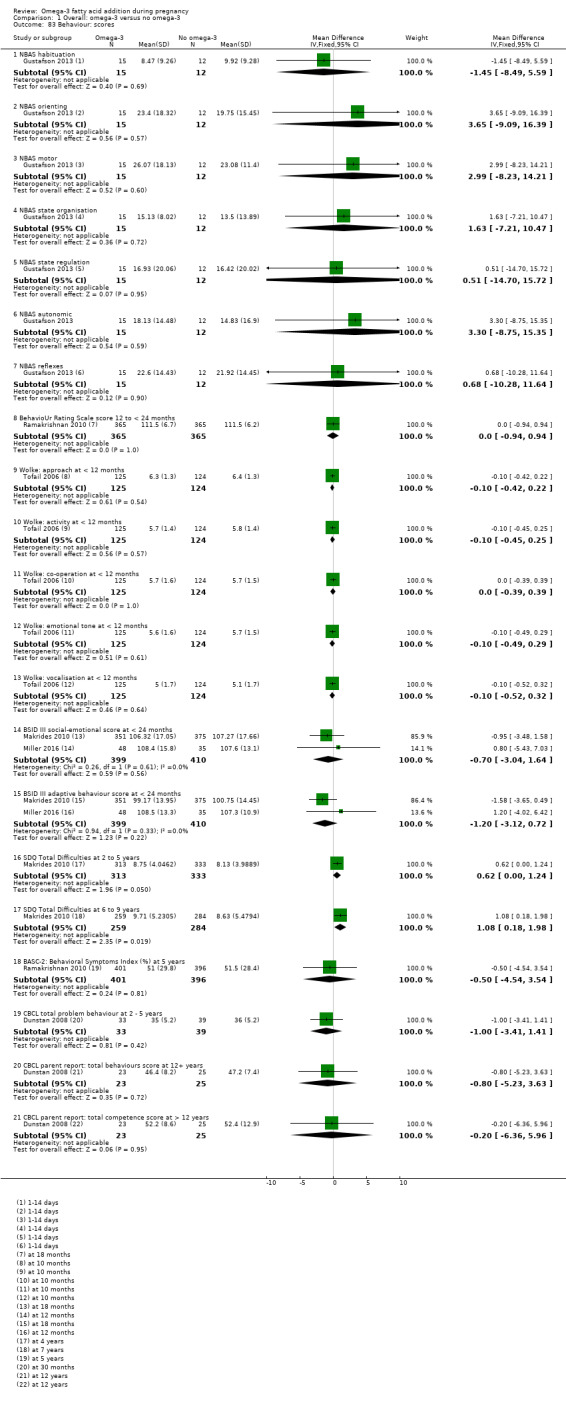
Comparison 1 Overall: omega‐3 versus no omega‐3, Outcome 83 Behaviour: scores.
Vision: visual acuity (cycles/degree)
Only Mulder 2014 and Judge 2007 reported on visual acuity, observing no evidence of a difference between groups at two, four or six months (Analysis 1.84).
1.84. Analysis.
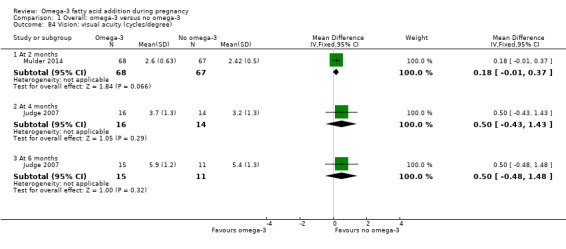
Comparison 1 Overall: omega‐3 versus no omega‐3, Outcome 84 Vision: visual acuity (cycles/degree).
Vision: visual evoked potential
Three trials reported visual evoked potential at various time points from birth to six months, with no important differences seen between omega‐3 and no omega‐3 (Analysis 1.85).
1.85. Analysis.
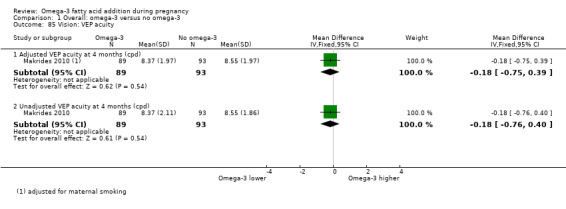
Comparison 1 Overall: omega‐3 versus no omega‐3, Outcome 85 Vision: VEP acuity.
Hearing: brainstem auditory‐evoked responses
Only one trial reported on various ways of measuring brainstem auditory‐evoked responses from one to three months (Ramakrishnan 2010), and found no evidence of differences between the omega‐3 LCPUFA and no omega‐3 groups (Analysis 1.87).
1.87. Analysis.
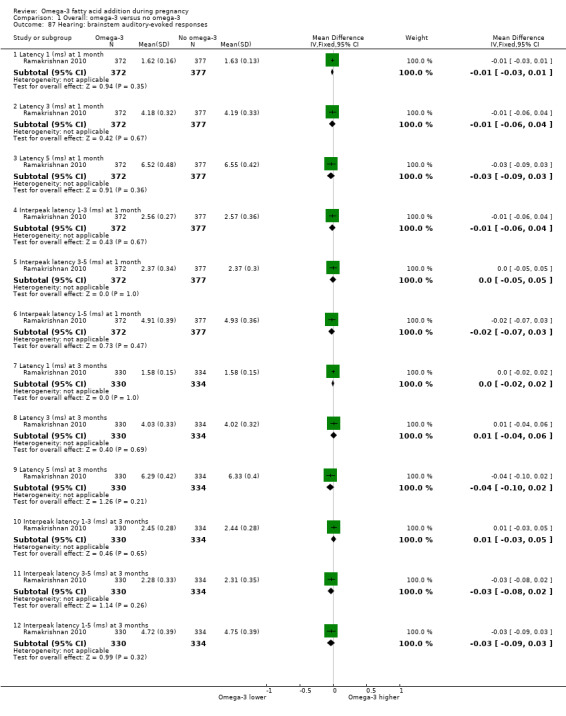
Comparison 1 Overall: omega‐3 versus no omega‐3, Outcome 87 Hearing: brainstem auditory‐evoked responses.
Neurodevelopment (overall): thresholds
Three trials reported various measures of overall neurodevelopment from six months to five years, and observed no clear differences between the omega‐3 LCPUFA and no omega‐3 groups (Analysis 1.88).
1.88. Analysis.
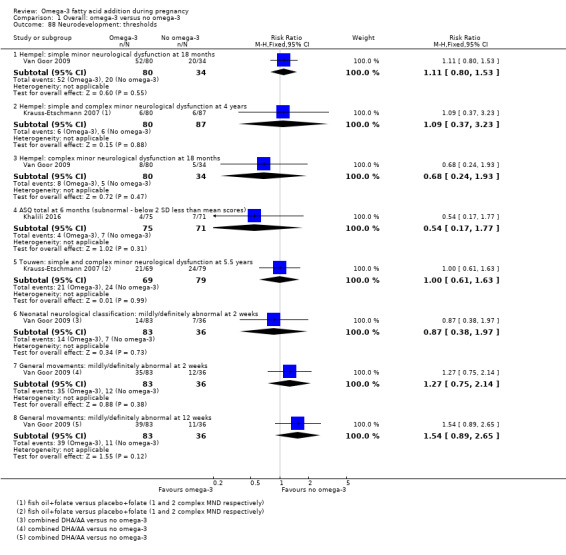
Comparison 1 Overall: omega‐3 versus no omega‐3, Outcome 88 Neurodevelopment: thresholds.
Neurodevelopment (overall): scores
One trial reported components of the Ages and Stages Questionnaire (ASQ) at four and six months (Khalili 2016), and found no clear differences except for improved communication with omega‐3 LCPUFA at four months (MD 2.70 95% CI 0.41 to 4.99; 148 participants; Analysis 1.89).
1.89. Analysis.
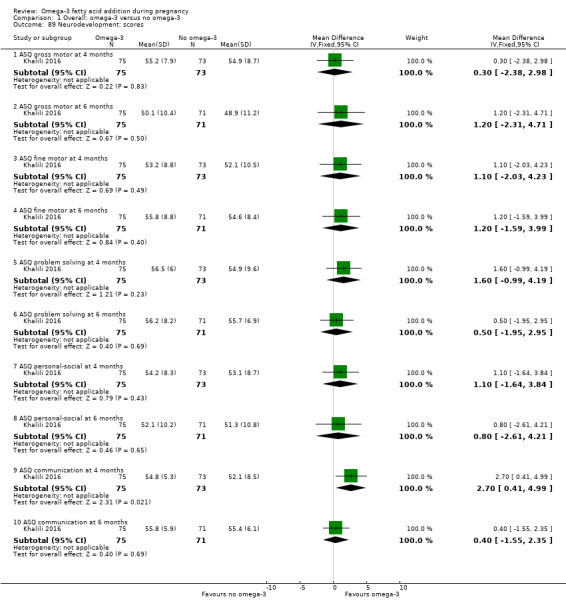
Comparison 1 Overall: omega‐3 versus no omega‐3, Outcome 89 Neurodevelopment: scores.
Child Development Inventory
Only Hauner 2012 reported on the child development inventory (parent‐reported), and observed no clear differences between the omega‐3 LCPUFA and no omega‐3 groups, across a range of measures when children were five years old (Analysis 1.90).
1.90. Analysis.
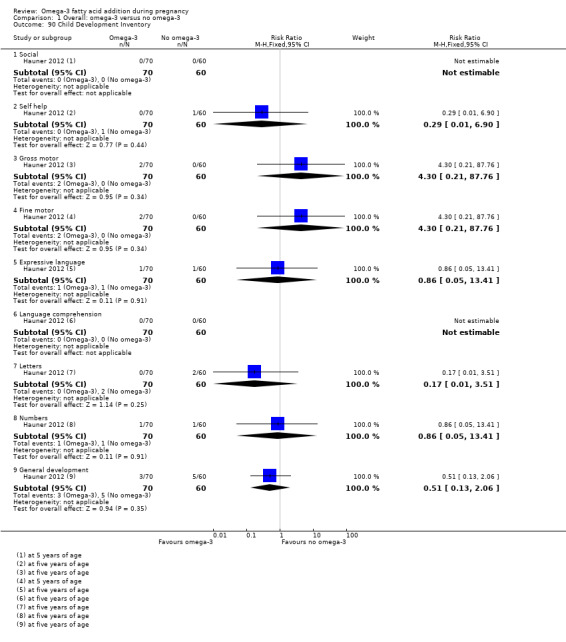
Comparison 1 Overall: omega‐3 versus no omega‐3, Outcome 90 Child Development Inventory.
Infant sleep behaviour
Only Judge 2007 reported on infant sleep behaviour, and found fewer arousals in quiet and active sleep with omega‐3 LCPUFA compared with no omega, but with no other differences between groups; 39 participants (Analysis 1.91).
1.91. Analysis.
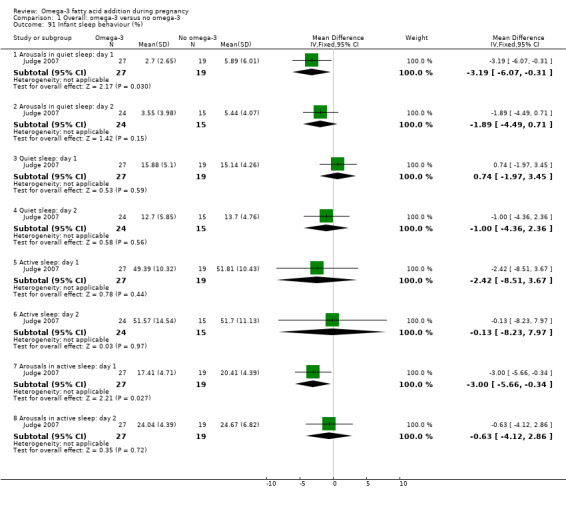
Comparison 1 Overall: omega‐3 versus no omega‐3, Outcome 91 Infant sleep behaviour (%).
Cerebral palsy
A single trial with 114 participants reported no cases of cerebral palsy in either the omega‐3 LCPUFA or the placebo group (Van Goor 2009) (Analysis 1.92).
1.92. Analysis.
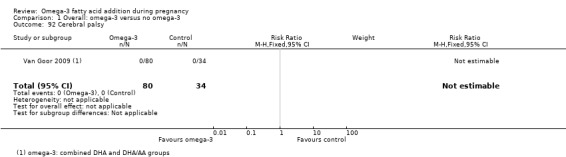
Comparison 1 Overall: omega‐3 versus no omega‐3, Outcome 92 Cerebral palsy.
None of the trials reported caesarean section (post‐term), jaundice, or use of community health services.
Subgroup analyses
By intervention type (Analysis 2)
Analyses were performed (where possible) based on type of omega‐3 intervention (omega‐3 LCPUFA supplements only; omega‐3 LCPUFA supplements, omega‐3 rich food and/or dietary advice; omega‐3 LCPUFA supplements and other agents; and omega‐3 supplements, omega‐3 LCPUFA rich food and other agents). No clear or important subgroup differences were revealed for any outcome except for:
birth length, where birth length was higher with omega‐3 LCPUFA supplements alone, or with omega‐3 rich food and/or diet advice; and lower when the intervention was omega‐3 LCPUFA combined with another non‐omega‐3 agent (Analysis 2.40).
2.40. Analysis.
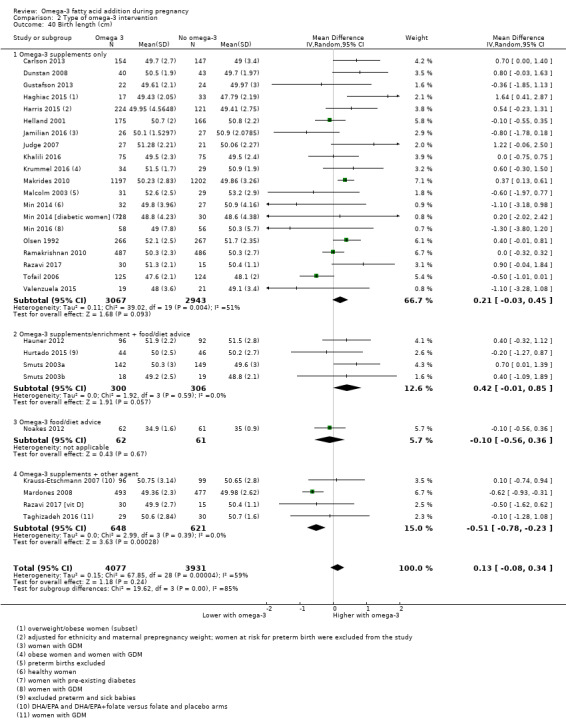
Comparison 2 Type of omega‐3 intervention, Outcome 40 Birth length (cm).
However the small increase is not likely to be clinically meaningful.
By dose of DHA and EPA supplements (Analysis 3)
Subgroup analysis based on dose of omega‐3 supplements for low dose (≤ 500 mg/day) versus mid dose (500 mg to 1 g/day) versus high dose (> 1 g/day) revealed no clear or important difference for any of the 12 prespecified outcomes except for:
low birthweight, where the effect of low and mid doses of omega‐3 LCPUFA (500 mg to 1 g/day) appeared more pronounced in reducing low birthweight than high dose (Analysis 3.10); Chi² 6.17, P = 0.05, I² 67.6%; and
birthweight (Analysis 3.12); Chi² 8.34, P = 0.04, I² 64%, which appears to be driven by a single trial of flaxseed oil. When this trial is omitted, the subgroup analysis is no longer statistically significant.
3.10. Analysis.
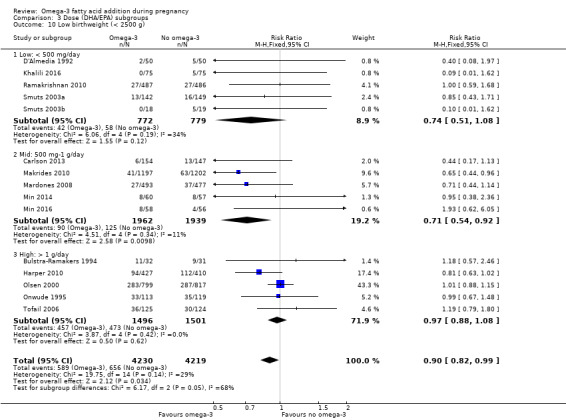
Comparison 3 Dose (DHA/EPA) subgroups, Outcome 10 Low birthweight (< 2500 g).
3.12. Analysis.
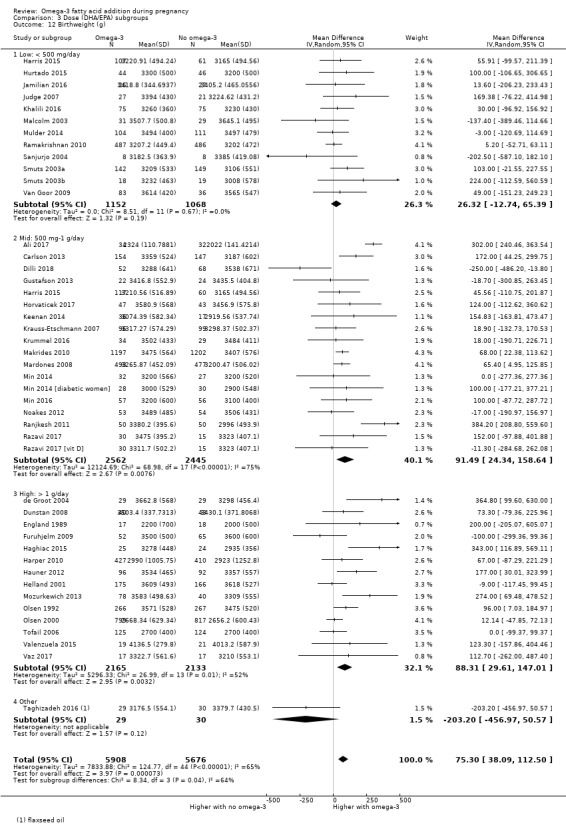
Comparison 3 Dose (DHA/EPA) subgroups, Outcome 12 Birthweight (g).
Timing of intervention: gestational age when omega‐3 supplements commenced (Analysis 4)
Subgroup analysis based on the time when omega‐3 LCPUFA supplements started (≤ 20 weeks' gestation or > 20 weeks' gestation) revealed no clear or important differences for any of the 12 prespecified outcomes except for pre‐eclampsia (Analysis 4.4). However as the single trial contributing to the heterogeneity did not report timing of intervention (Rivas‐Echeverria 2000), this does not help elucidate the influence of timing start of supplement on this outcome.
4.4. Analysis.
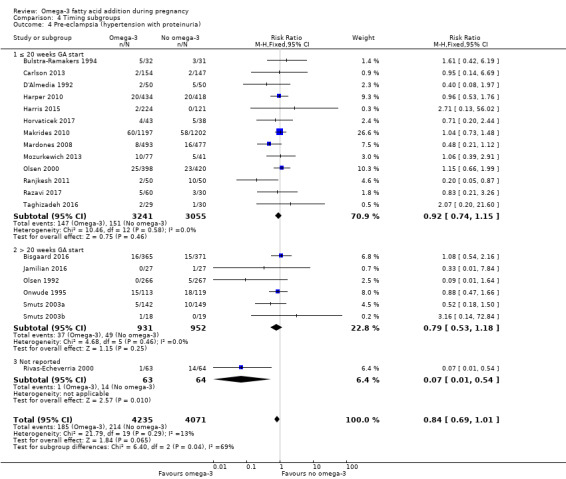
Comparison 4 Timing subgroups, Outcome 4 Pre‐eclampsia (hypertension with proteinuria).
Type of supplements (Analysis 5)
Subgroup analysis based on type of supplements (DHA/largely DHA versus mixed DHA/EPA versus mixed DHA/EPA/other) revealed no clear subgroup differences for the outcomes, except for:
pre‐eclampsia (likely due to the influence of a single study, Rivas‐Echeverria 2000), in the mixed DHA/EPA/other subgroup (Analysis 5.4); Chi² 7.58, P = 0.02, I² = 73.6%; and
caesarean section where incidence was higher in the mixed DHA/EPA subgroup (Analysis 5.5); Chi² 6.29, P = 0.04, I² = 68.2% than for the other DHA or EPA subgroups.
5.4. Analysis.
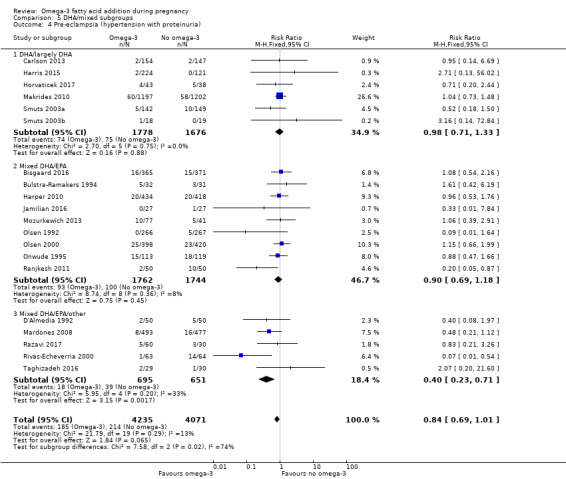
Comparison 5 DHA/mixed subgroups, Outcome 4 Pre‐eclampsia (hypertension with proteinuria).
5.5. Analysis.
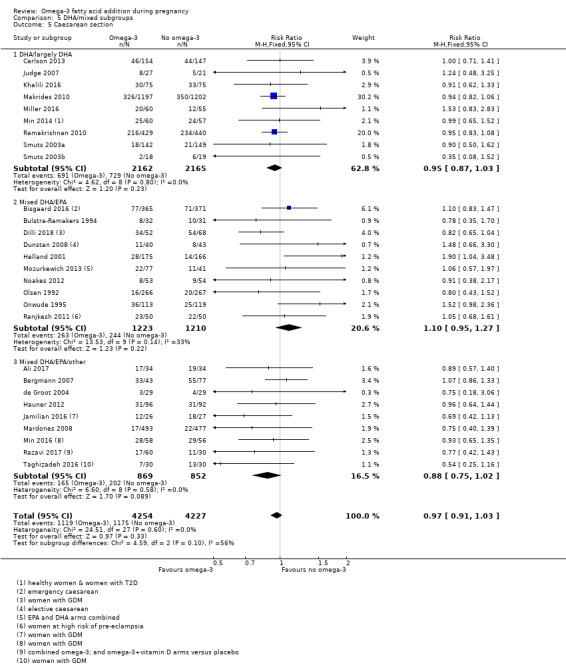
Comparison 5 DHA/mixed subgroups, Outcome 5 Caesarean section.
Risk (Analysis 6)
Analyses were performed based on risk of women ‐ low risk (healthy women or health condition unlikely to affect birth outcomes, e.g. allergy) versus increased/high risk (e.g. women with hypertension, gestational diabetes mellitus, depression, a history of preterm birth) versus mixed risk (no inclusion criteria related to maternal health risk, or health risk not reported). No clear or important subgroup differences were seen for any of the outcomes except low birthweight where studies with women at low or any risk showed a reduction compared with the studies involving women at increased or higher risk (Analysis 6.10); Chi² 6.24, P = 0.04, I² 67.9%.
6.10. Analysis.
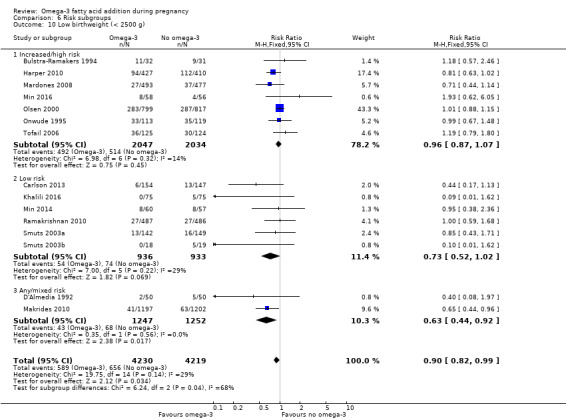
Comparison 6 Risk subgroups, Outcome 10 Low birthweight (< 2500 g).
Omega‐3 dose direct comparisons (Analysis 7)
One trial reported outcomes in 224 participants from a direct comparison of 600 mg and 300 mg DHA a day (Harris 2015); and another trial reported five different doses of DHA/EPA from 0.1 g/day to 2.8 g/day (which we collapsed into ≤ 1 g/day and > 1 g/day DHA/EPA) (Knudsen 2006). Knudsen 2006 only reported gestational length.
Primary outcomes
In one trial, no difference between doses was seen for:
early preterm birth (< 34 weeks) (RR 0.91, 95% CI 0.13 to 6.38; Analysis 7.1); or
prolonged gestation (> 42 weeks) (RR 0.91, 95% CI 0.06 to 14.44; Analysis 7.2) (Harris 2015).
7.1. Analysis.
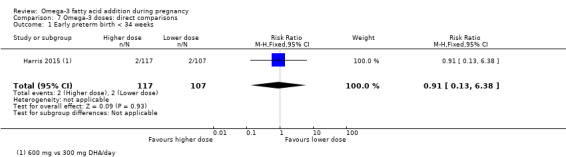
Comparison 7 Omega‐3 doses: direct comparisons, Outcome 1 Early preterm birth < 34 weeks.
7.2. Analysis.
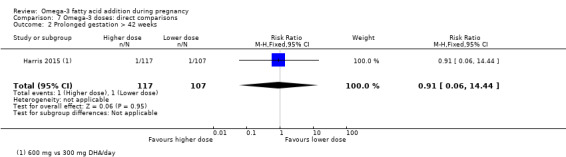
Comparison 7 Omega‐3 doses: direct comparisons, Outcome 2 Prolonged gestation > 42 weeks.
Mother: secondary outcomes
One trial (Harris 2015), observed no evidence of a difference between women who received 600 mg DHA/day compared with 300 mg DHA/day for:
pre‐eclampsia (RR 0.91, 95% CI 0.06 to 14.44; Analysis 7.3);
induction post term (RR 0.10; 95% CI 0.01 to 1.87; Analysis 7.4);
premature rupture of membranes (RR 0.30, 95% CI 0.03 to 2.89; Analysis 7.5); or
premature prelabour rupture of membranes (RR 1.22, 95% CI 0.28 to 5.32; Analysis 7.6).
7.3. Analysis.

Comparison 7 Omega‐3 doses: direct comparisons, Outcome 3 Pre‐eclampsia.
7.4. Analysis.
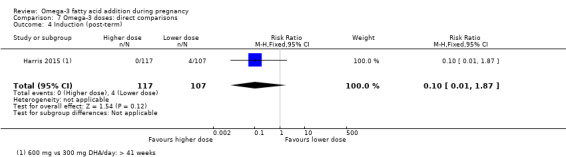
Comparison 7 Omega‐3 doses: direct comparisons, Outcome 4 Induction (post‐term).
7.5. Analysis.
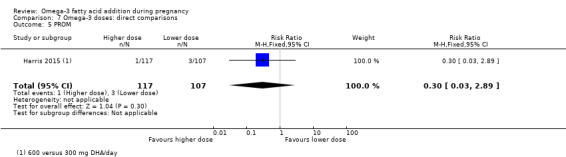
Comparison 7 Omega‐3 doses: direct comparisons, Outcome 5 PROM.
7.6. Analysis.
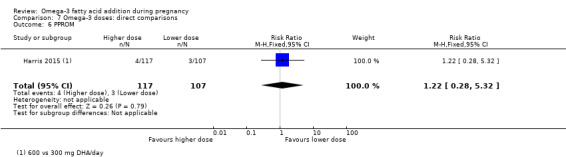
Comparison 7 Omega‐3 doses: direct comparisons, Outcome 6 PPROM.
Two trials (Harris 2015; Knudsen 2006), observed no difference in length of gestation between women who received higher and lower doses of omega‐3 LCPUFA daily (MD 0.24 days, 95% CI ‐1.16 to 1.64; 1475 participants; Analysis 7.7).
7.7. Analysis.
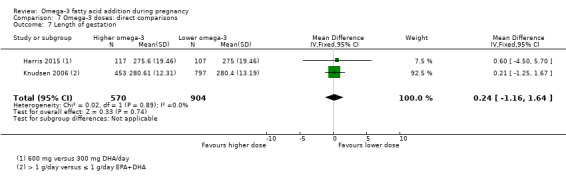
Comparison 7 Omega‐3 doses: direct comparisons, Outcome 7 Length of gestation.
Baby/infant/child
Harris 2015 observed no difference in women who received 600 mg DHA/day versus 300 mg DHA/day for:
birthweight (‐110.35 g, 95% CI ‐242.80 to 22.10; Analysis 7.8);
length at birth (MD 0.05 cm, 95% CI ‐0.80 to 0.90; Analysis 7.9); or
head circumference at birth (‐0.24 cm, 95% CI 0.87 to 0.39) (Analysis 7.10).
7.8. Analysis.
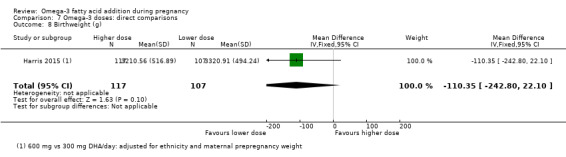
Comparison 7 Omega‐3 doses: direct comparisons, Outcome 8 Birthweight (g).
7.9. Analysis.
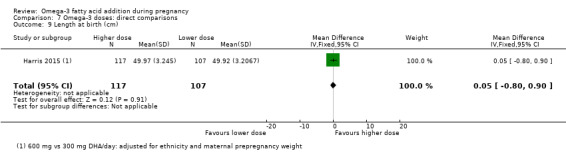
Comparison 7 Omega‐3 doses: direct comparisons, Outcome 9 Length at birth (cm).
7.10. Analysis.
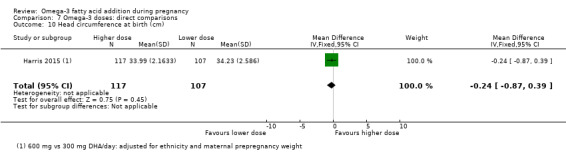
Comparison 7 Omega‐3 doses: direct comparisons, Outcome 10 Head circumference at birth (cm).
Omega‐3 type direct comparisons (Analysis 8)
Three trials reported direct comparisons of different types of omega‐3 supplements (Knudsen 2006; Mozurkewich 2013; Van Goor 2009).
Primary outcomes
None of the three trials reported any of the review's primary outcomes.
Mother: secondary outcomes
Mozurkewich 2013 observed no evidence of a difference between women who received DHA compared with EPA for:
caesarean section (RR 1.23, 95% CI 0.61 to 2.51; 77 participants; Analysis 8.2);
cessation due to adverse events (RR 0.82, 95% CI 0.24 to 2.83; 77 participants; Analysis 8.3).
blood loss at birth (MD 1.00 mL, 95% CI ‐181.94 to 183.94; 77 participants; Analysis 8.5);
major depressive disorder at six to eight weeks postpartum (RR 0.68, 95% CI 0.12 to 3.87; Analysis 8.6); or in
depressive symptoms postpartum as measured by the BDI at six to eight weeks (MD ‐1.40, 95% CI ‐3.75 to 0.95; Analysis 8.7).
8.2. Analysis.
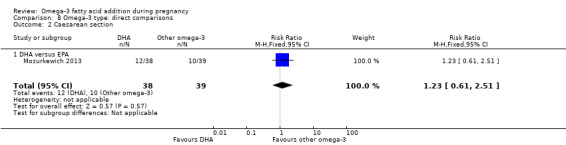
Comparison 8 Omega‐3 type: direct comparisons, Outcome 2 Caesarean section.
8.3. Analysis.
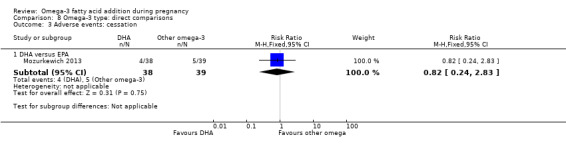
Comparison 8 Omega‐3 type: direct comparisons, Outcome 3 Adverse events: cessation.
8.5. Analysis.
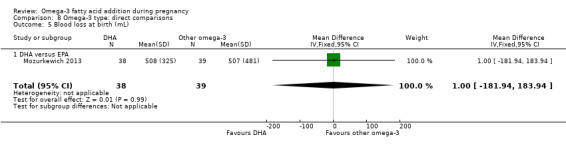
Comparison 8 Omega‐3 type: direct comparisons, Outcome 5 Blood loss at birth (mL).
8.6. Analysis.
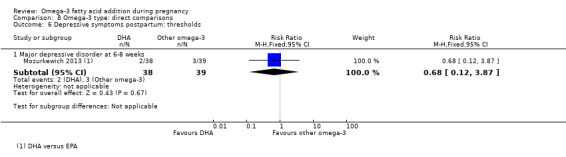
Comparison 8 Omega‐3 type: direct comparisons, Outcome 6 Depressive symptoms postpartum: thresholds.
8.7. Analysis.
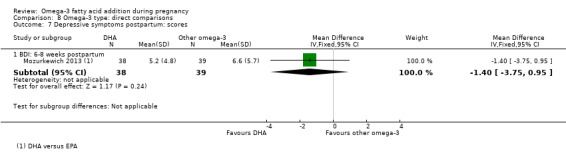
Comparison 8 Omega‐3 type: direct comparisons, Outcome 7 Depressive symptoms postpartum: scores.
In Mozurkewich 2013, there was a reduction in pre‐eclampsia in women who received DHA compared with EPA (RR 0.26, 95% CI 0.06 to 1.13; 77 participants; Analysis 8.4), though this did not reach statistical significance.
8.4. Analysis.
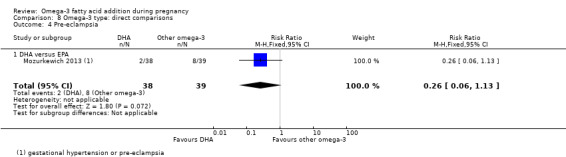
Comparison 8 Omega‐3 type: direct comparisons, Outcome 4 Pre‐eclampsia.
Two trials reported on gestational diabetes (Mozurkewich 2013; Van Goor 2009); in Mozurkewich 2013 there was a reduction in gestational diabetes when women received DHA compared with EPA (RR 0.15, 95% CI 0.02 to 1.14; 77 participants), though this did not reach statistical significance. Van Goor 2009 observed no evidence of difference between women who received DHA versus DHA/AA (RR 0.33, 95% CI 0.01 to 7.96; 86 participants; Analysis 8.1).
8.1. Analysis.
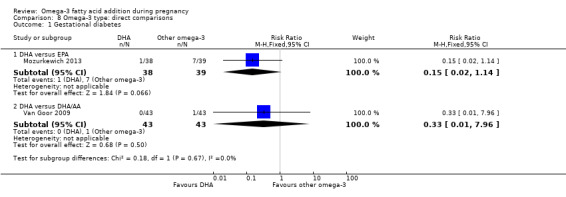
Comparison 8 Omega‐3 type: direct comparisons, Outcome 1 Gestational diabetes.
Length of gestation was reported by three trials, two of which found no difference between different types of omega‐3 supplements. Knudsen 2006 observed no evidence of a difference in length of gestation between women who received EPA/DHA compared with ALA (MD ‐0.29 days, 95% CI ‐2.33 to 1.75; 1250 participants). Van Goor 2009 found no evidence of a difference in this outcome between women who received DHA compared with DHA/AA (MD 0.00, 95% CI ‐3.31 to 3.31; 83 participants). However, Mozurkewich 2013 observed a greater length of gestation in women who received DHA compared with EPA (MD 9.10 days, 95% CI 5.24 to 12.96; 77 participants; Analysis 8.8).
8.8. Analysis.
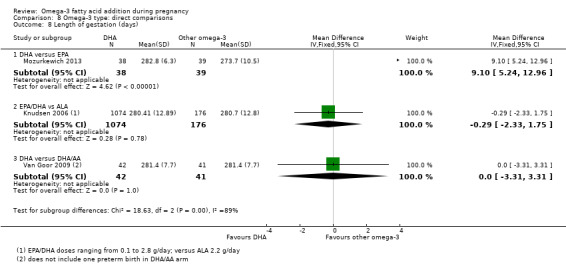
Comparison 8 Omega‐3 type: direct comparisons, Outcome 8 Length of gestation (days).
Baby/infant/child
Mozurkewich 2013 observed no evidence of a difference between infants of women who received DHA and EPA in admission to neonatal care (RR 0.35, 95% CI 0.08 to 1.63; 78 participants; Analysis 8.9).
8.9. Analysis.
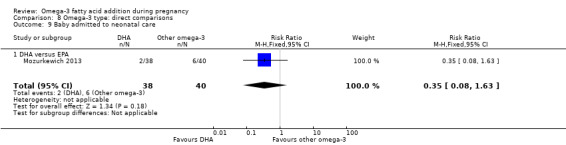
Comparison 8 Omega‐3 type: direct comparisons, Outcome 9 Baby admitted to neonatal care.
In Van Goor 2009, there was no evidence of a difference in birthweight between infants of women who received DHA compared with DHA/AA (MD ‐79.00 g, 95% CI ‐260.22 to 102.22; 83 participants). However, in Mozurkewich 2013 there was evidence of a higher birthweight in infants of mothers who received DHA compared with EPA (MD 372.00 g, 95% CI 151.90 to 592.10; 78 participants; Analysis 8.10).
8.10. Analysis.
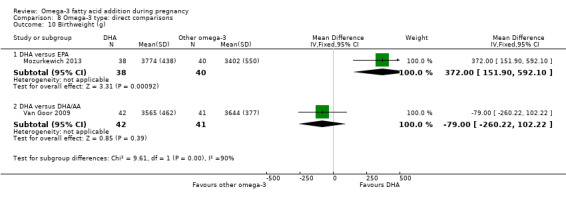
Comparison 8 Omega‐3 type: direct comparisons, Outcome 10 Birthweight (g).
Van Goor 2009 observed no evidence of a difference in infants of women who received DHA compared with infants of women who received DHA/AA for:
weight (MD ‐0.20 kg, 95% CI ‐0.79 to 0.39; 80 participants; Analysis 8.11);
height (MD ‐0.80 cm, 95% CI ‐2.50 to 0.90; 80 participants; Analysis 8.12);
infant head circumference (MD 0.10, 95% CI ‐0.45 to 0.65; 80 participants; Analysis 8.13).
cognition as measured by the BSID II (MD 0.90, 95% CI ‐4.71 to 6.51; 80 participants; Analysis 8.14); or
motor development as measured by the BSID II (MD 3.40, 95% CI ‐1.07 to 7.87; 79 participants; Analysis 8.15).
8.11. Analysis.
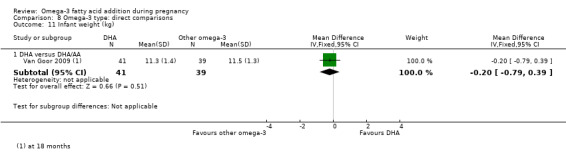
Comparison 8 Omega‐3 type: direct comparisons, Outcome 11 Infant weight (kg).
8.12. Analysis.
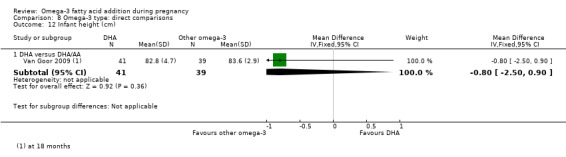
Comparison 8 Omega‐3 type: direct comparisons, Outcome 12 Infant height (cm).
8.13. Analysis.
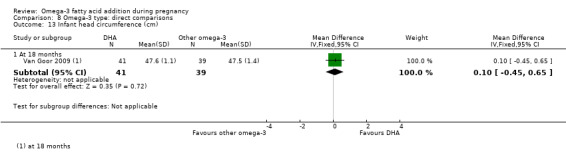
Comparison 8 Omega‐3 type: direct comparisons, Outcome 13 Infant head circumference (cm).
8.14. Analysis.
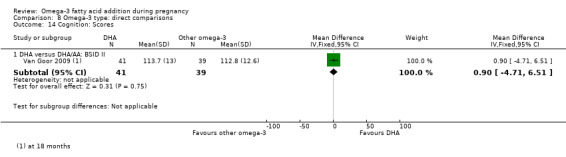
Comparison 8 Omega‐3 type: direct comparisons, Outcome 14 Cognition: Scores.
8.15. Analysis.
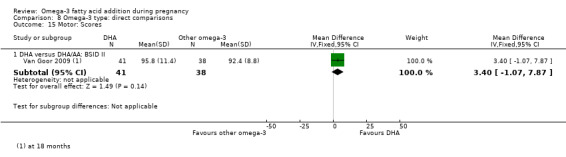
Comparison 8 Omega‐3 type: direct comparisons, Outcome 15 Motor: Scores.
One trial, Van Goor 2009, reported on neurodevelopment from a direct comparison of omega‐3 (DHA versus DHA/AA). No differences between infants of mothers assigned to the two groups were observed for the neonatal neurological classification of mildly/definitely abnormal at two weeks (RR 0.73 95% CI 0.28 to 1.87; 67 participants), or for general movement quality that was mildly/definitely abnormal at two weeks (RR 1.08 95% CI 0.68 to 1.72; 67 participants), However, there was a higher risk of general movement quality being mildly or definitely abnormal at 12 weeks in infants of mothers in the DHA group (RR 1.81 95% CI 1.11 to 2.95; 83 participants; Analysis 8.16).
8.16. Analysis.
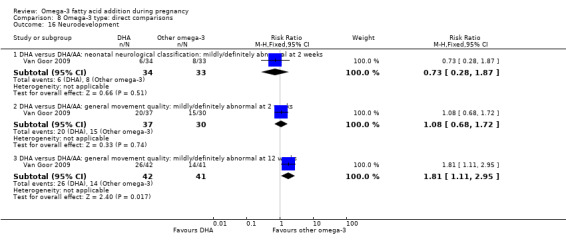
Comparison 8 Omega‐3 type: direct comparisons, Outcome 16 Neurodevelopment.
Van Goor 2009 observed no evidence of any difference between the infants of women who received DHA and infants of women who received DHA/AA in cerebral palsy (not estimable) (Analysis 8.17).
8.17. Analysis.
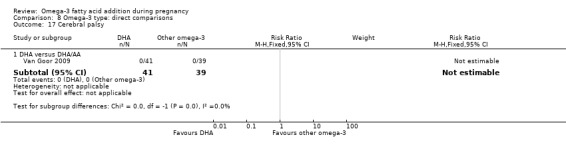
Comparison 8 Omega‐3 type: direct comparisons, Outcome 17 Cerebral palsy.
Sensitivity analyses (Analysis 9)
We included just over a third of the trials (24/70) that we considered to be at low risk of selection and performance bias in sensitivity analyses (Bisgaard 2016; Carlson 2013; D'Almedia 1992; Gustafson 2013; Haghiac 2015; Harper 2010; Harris 2015; Ismail 2016; Jamilian 2016; Keenan 2014; Khalili 2016; Krummel 2016; Makrides 2010; Min 2014; Min 2016; Mozurkewich 2013; Oken 2013; Olsen 2000; Onwude 1995; Ramakrishnan 2010; Razavi 2017; Rees 2008; Samimi 2015; Taghizadeh 2016). The 12 outcomes assessed in subgroup analyses 3 to 6 were included in these sensitivity analyses.
For preterm birth (< 37 weeks), the sensitivity analysis was similar to the overall analysis, although it lost conventional statistical significance (RR 0.92 95% CI 0.83 to 1.02; Analysis 9.1). Sensitivity analyses for early preterm birth (< 34 weeks) (RR 0.61 95% CI 0.46 to 0.82; Analysis 9.2) and prolonged pregnancy (> 42 weeks) (RR 2.32, 95% CI 1.26 to 4.28; Analysis 9.3) were very similar to the overall analyses.
9.1. Analysis.
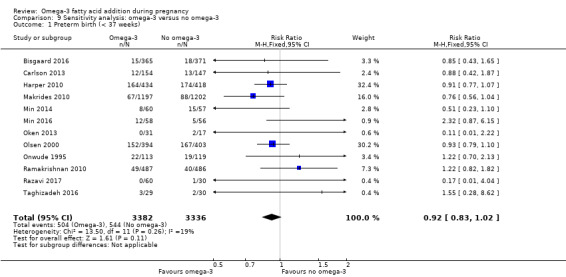
Comparison 9 Sensitivity analysis: omega‐3 versus no omega‐3, Outcome 1 Preterm birth (< 37 weeks).
9.2. Analysis.
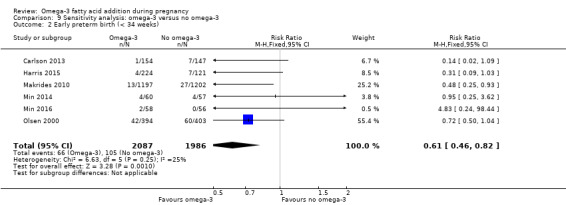
Comparison 9 Sensitivity analysis: omega‐3 versus no omega‐3, Outcome 2 Early preterm birth (< 34 weeks).
9.3. Analysis.
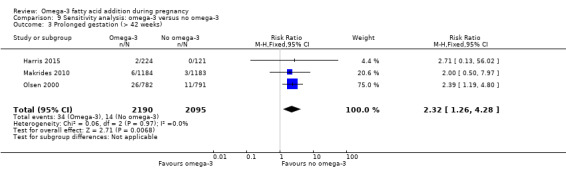
Comparison 9 Sensitivity analysis: omega‐3 versus no omega‐3, Outcome 3 Prolonged gestation (> 42 weeks).
The sensitivity analysis for pre‐eclampsia indicated a null result (RR 1.00 95% CI 0.81 to 1.25; Analysis 9.4), in contrast to a possible benefit seen with omega‐3 LCPUFA in the overall analysis.
9.4. Analysis.
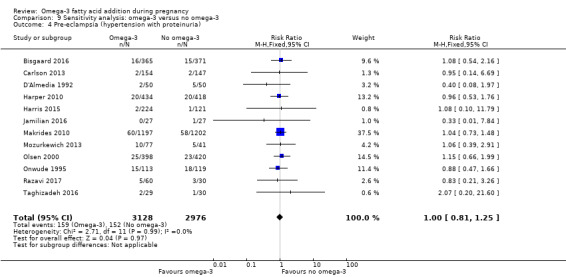
Comparison 9 Sensitivity analysis: omega‐3 versus no omega‐3, Outcome 4 Pre‐eclampsia (hypertension with proteinuria).
For caesarean section, there was very little difference between the sensitivity analysis (RR 0.96 95% CI 0.89 to 1.04; Analysis 9.5) and the overall analysis. Length of gestation also showed similar results in the sensitivity analysis (1.42 more days with omega‐3, 95% CI 0.73 to 2.11; Analysis 9.6, now as a fixed‐effect model due to much lower statistical heterogeneity) and the overall findings.
9.5. Analysis.
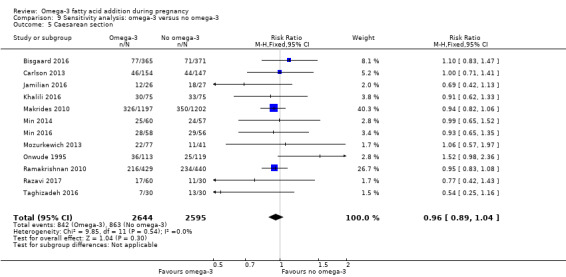
Comparison 9 Sensitivity analysis: omega‐3 versus no omega‐3, Outcome 5 Caesarean section.
9.6. Analysis.
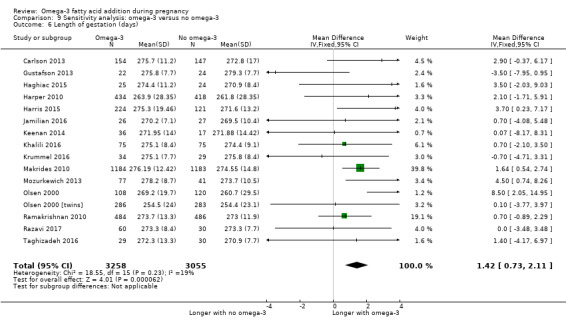
Comparison 9 Sensitivity analysis: omega‐3 versus no omega‐3, Outcome 6 Length of gestation (days).
The sensitivity analysis for perinatal death (RR 0.60, 95% CI 0.37 to 0.97; Analysis 9.7) now reached conventional statistical significance, but had a similar magnitude to the overall borderline analysis (Analysis 1.32).
9.7. Analysis.
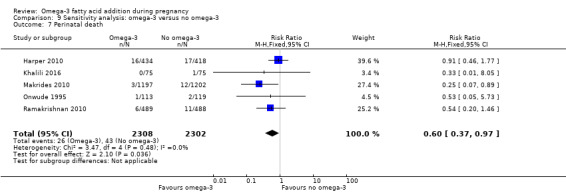
Comparison 9 Sensitivity analysis: omega‐3 versus no omega‐3, Outcome 7 Perinatal death.
In contrast, the sensitivity analysis for low birthweight lost statistical significance (RR 0.85 95% CI 0.68 to 1.06; Analysis 9.10) but was similar to the overall analysis which reached conventional statistical significance.
9.10. Analysis.
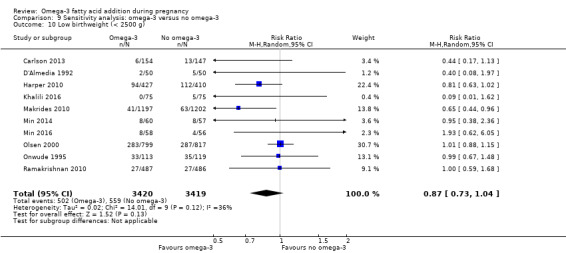
Comparison 9 Sensitivity analysis: omega‐3 versus no omega‐3, Outcome 10 Low birthweight (< 2500 g).
The sensitivity analyses for stillbirth (RR 0.72, 95% CI 0.35 to 1.52; Analysis 9.8), neonatal death (RR 0.56, 95% CI 0.25 to 1.27; Analysis 9.9), and small‐for‐gestational age (RR 0.94, 95% CI 0.78 to 1.12; Analysis 9.11) showed similar findings to their corresponding overall analyses (Analysis 1.33; Analysis 1.34; Analysis 1.39).
9.8. Analysis.
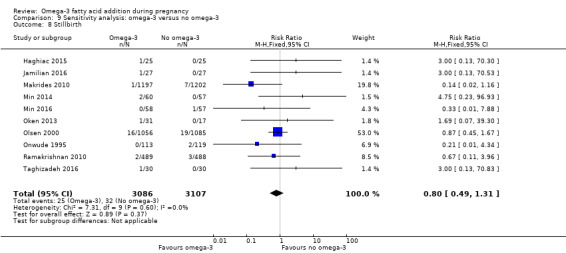
Comparison 9 Sensitivity analysis: omega‐3 versus no omega‐3, Outcome 8 Stillbirth.
9.9. Analysis.
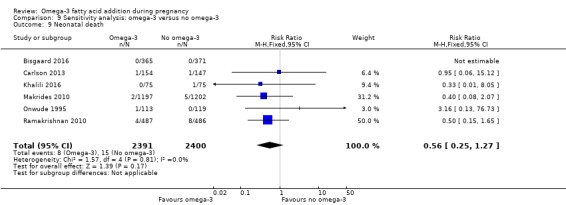
Comparison 9 Sensitivity analysis: omega‐3 versus no omega‐3, Outcome 9 Neonatal death.
9.11. Analysis.
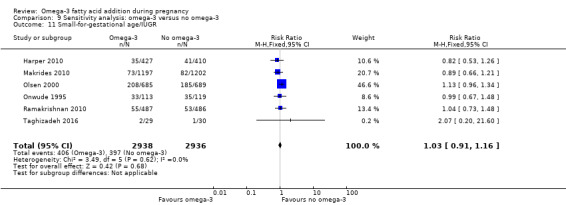
Comparison 9 Sensitivity analysis: omega‐3 versus no omega‐3, Outcome 11 Small‐for‐gestational age/IUGR.
The sensitivity analysis for birthweight (MD 48.84 g; 95% CI 22.93 to 74.76; 17 trials, 7382 participants; Analysis 9.12) also showed a similar (but lower) result to the overall analysis (Analysis 1.40) (and had lower statistical heterogeneity).
9.12. Analysis.
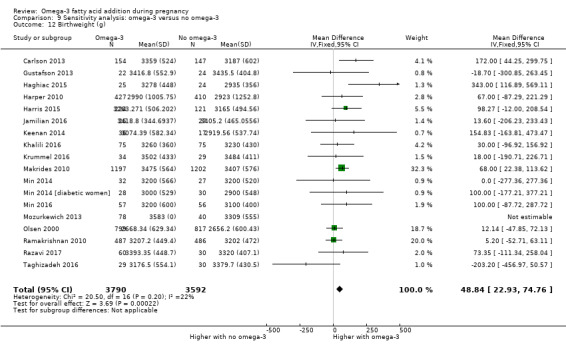
Comparison 9 Sensitivity analysis: omega‐3 versus no omega‐3, Outcome 12 Birthweight (g).
Discussion
Summary of main results
In this update we have included 70 trials with 19,927 women. Most of the trials evaluated omega‐3 long‐chain polyunsaturated fatty acids (LCPUFA) interventions compared with placebo or no omega‐3. We grouped these as: omega‐3 LCPUFA supplements (50 trials); omega‐3 LCPUFA supplements combined with food or dietary additions (seven trials); food/dietary additions (three trials); and omega‐3 fatty acid interventions combined with other agents (12 trials).
For our primary review outcomes, there was an 11% reduced risk (95% confidence interval (CI) 3% to 19%) of preterm birth < 37 weeks (high‐quality evidence) and a 42% reduced risk (95% CI 23% to 56%) of early preterm birth < 34 weeks (high‐quality evidence) for women receiving omega‐3 LCPUFA compared with no omega‐3. The number needed to treat for an additional beneficial outcome (NNTB) to prevent one preterm birth < 37 weeks is 68 (95% CI 39 to 238), and the NNTB to prevent a preterm birth < 34 weeks is 52 (95% CI 39 to 95). Conversely for prolonged gestation there was a probable 61% increase (95% CI 11% to 233%) with omega‐3 LCPUFA (moderate‐quality evidence) and the number needed to treat for an additional harmful outcome (NNTH) for an additional pregnancy prolonged beyond 42 weeks is 102 (95% CI 47 to 568). In the sensitivity analysis for preterm birth < 37 weeks, conventional statistical significance was lost, although results were similar. Sensitivity analyses for early preterm birth < 34 weeks and prolonged pregnancy > 42 weeks were very close to the overall analyses.
Omega‐3 LCPUFA probably reduces the risk of both perinatal death (moderate‐quality evidence) and neonatal care admission (moderate‐quality evidence); and reduces the risk of low birthweight babies (high‐quality evidence). Little or no difference in small for gestational age (SGA) or intrauterine growth restriction (moderate‐quality evidence) with a possible small increase in large for gestational age babies (moderate‐quality evidence) was seen. For most maternal outcomes, we observed no differences between groups. Mean gestational length was greater in women who received omega‐3 LCPUFA and pre‐eclampsia may also have been reduced (low‐quality evidence). For child/adult outcomes, very few differences between the antenatal omega‐3 LCPUFA and no omega‐3 groups were observed, indicating that there is uncertainty regarding the impact of omega‐3 LCPUFA on child development and growth.
Subgroup analyses (based on type of intervention (e.g. supplementation, food or advice), dose of docosahexaenoic acid (DHA) or eicosapentaenoic acid (EPA), timing, type of omega‐3 LCPUFA, and degree of risk for women) revealed few differences. In the subgroup analyses by intervention, omega‐3 LCPUFA supplements and/or omega‐3 rich food and dietary advice indicated a greater positive effect on birth length than for the other intervention types. In the dose subgroup analysis, there was a positive effect from the lower doses (< 1 g/day) for low birthweight. For the risk subgroup analysis, studies with low or any risk women showed a greater reduction in low birthweight compared with the studies involving women at increased or higher risk.
Direct comparisons of doses and types of omega‐3 LCPUFA showed longer gestation and higher birthweight for DHA compared with EPA. There were few other differences apart from a possible reduction in pre‐eclampsia and in gestational diabetes mellitus for DHA compared with EPA.
Sensitivity analysis (restricted to trials at low risk of selection and performance bias) largely supported the findings observed in the main analyses, except for pre‐eclampsia (which no longer showed a reduction for omega‐3 LCPUFA compared with no omega‐3).
Overall completeness and applicability of evidence
Of the 70 trials included in this update, our three primary outcomes (preterm birth, early preterm birth and prolonged pregnancy) were reported by only 26, nine and six trials respectively, even though these could have been reported by most trials (e.g. as part of routine perinatal data collection). Birthweight was the most comprehensively reported outcome (41 trials). Longer‐term childhood outcomes were sparsely reported and many different assessment measures were used, for example, in neurodevelopment.
Generally the larger trials reported most of the outcomes that we had prespecified as being important, and so the body of evidence in this review is reasonably complete. However, some trials were conducted for specific reasons, such as assessing the effects of omega‐3 LCPUFA supplementation on allergy outcomes, and these trials did not always report other perinatal outcomes extensively. (Allergy outcomes from these trials are included in a separate review (Gunaratne 2015).) Some trials even excluded preterm births altogether, which may have underestimated the differences seen in preterm birth in this review. For some of these trials we were able to deduce outcomes such as preterm birth from trial flow diagrams. Exclusion of preterm births may have also led to incomplete reporting of linked outcomes, such as gestational age.
In this update we broadened the scope of the review to ensure that we could track the evolution of the perceived benefits of omega‐3 and present a single comprehensive review of the effects of omega‐3 LCPUFA during pregnancy. For example, in the 2006 version of this review, the major benefit of omega‐3 LCPUFA was thought to be in preventing pre‐eclampsia and increasing the duration of gestation. In the next decade, there was an emphasis on assessing the role of omega‐3 LCPUFA supplementation on child cognition and growth. More recently, there has been renewed interest in the role of omega‐3 LCPUFA in preventing preterm birth.
We also included trials assessing omega‐3 LCPUFA from food sources and omega‐3 LCPUFA with co‐interventions, although most of the 63 trials we have added in this update compare omega‐3 supplementation (largely DHA and EPA) with placebo. We have presented overall analyses as well as analyses of the different comparisons. While trials were conducted in a broad range of countries, most were from high‐income settings (although some of these studies recruited only disadvantaged women). Reporting of characteristics of women was both limited and variable, for example for baseline omega‐3 LCPUFA concentrations, which may influence pregnancy and longer term outcomes.
Quality of the evidence
Overall study‐level risk of bias was mixed, with selection and performance bias mostly at low risk, but there was high risk of attrition bias in some trials at some time points.
Most of the important perinatal outcomes assessed using GRADE had a rating of high‐quality (e.g. preterm birth) or moderate‐quality evidence (e.g. perinatal death) (Table 1). For birth outcomes, we only downgraded for attrition bias if substantial losses happened around the time of birth, as later losses were not relevant here. For the other outcome domains GRADE ratings ranged from moderate to very low, with over half rated as low (maternal Table 2, child/adult Table 3, and health service Table 4, outcomes). Reasons for downgrading were mostly due to design limitations (largely due to high risk of attrition bias and selection bias; and unclear randomisation and blinding) and imprecision. Particularly for the longer‐term child outcomes (Table 3), there were often low numbers of studies and thus imprecision. Due to the large number of studies following up participants or subsets of participants, often for quite lengthy periods, attrition bias was commonly evident for these longer‐term outcomes.
Potential biases in the review process
Due to the rigorous methods we used (comprehensive searching, double screening and data extraction, and careful appraisal and analysis), biases are likely to be low. We were able to include 12 funnel plots, most of which did not indicate evidence of publication bias.
While we applied wide inclusion criteria at the review level, some studies had quite restrictive criteria (e.g. excluding preterm births, as discussed above) and some reported small numbers of outcomes although potentially more (e.g. perinatal death) would have been readily available and could have been reported by the trial authors.
Agreements and disagreements with other studies or reviews
A large systematic review from the US Agency for Healthcare Research and Quality (AHRQ) on the effects of omega‐3 fatty acids on child and maternal health concluded that, except for small beneficial effects on infant randomised controlled trials (RCTs) reporting preterm birth < 37 weeks and found no significant difference between omega‐3 and no omega‐3 (odds ratio (OR) 0.87 95% CI 0.66 to 1.15 for DHA and OR 0.86, 95% CI 0.65 to 1.15 for DHA/EPA, random‐effects). We included 26 RCTs for this outcome and found a clear result in favour of omega‐3 (risk ratio (RR) 0.89, 95% 0.81 to 0.97, fixed‐effect). For comparison, our result converts to OR 0.85 95% CI 0.74 to 0.99, random‐effects. The AHRQ review did not report on early preterm birth, which in our review showed a clear reduction with omega‐3 LCPUFA (RR 0.58, 95% CI 0.44 to 0.77).
Imhoff‐Kunsch 2012 reviewed 15 RCTs, finding like us, a clear reduction in early preterm birth, but only a suggestion of a reduction in preterm birth overall. In the Kar 2016 systematic review of nine included studies, a clear reduction was seen in both preterm and early preterm birth. Another systematic review of omega‐3 LCPUFA concentrating on birth outcomes was also largely consistent with our findings (e.g. reduced risk of early preterm birth and preterm birth (though the authors used a broader definition of early preterm birth and used a fixed‐effect model throughout the review) (Chen 2016). The same authors conducted a review of omega‐3 LCPUFA addressing gestational diabetes, pregnancy hypertension and pre‐eclampsia and found no evidence of differences (Chen 2015). Again their findings were largely consistent with ours, although we found a possible decrease in pre‐eclampsia with omega‐3 LCPUFA.
The Saccone 2016 systematic review included 34 studies, which comprised 17 omega‐3 LCPUFA trials. They found no clear differences in preterm birth in seven trials including 3493 asymptomatic singleton pregnancies (RR 0.90, 95% CI 0.72 to 1.11) whereas we found an 11% decrease in preterm birth < 37 weeks (RR 0.89, 95% CI 0.81 to 0.97; 24 trials, 10,121 participants). (Saccone 2016 excluded trials of women who had experienced previous preterm birth. When we omitted these two trials, it made minimal difference to our results.) For perinatal death, Saccone 2016 found no differences overall between omega‐3 LCPUFA and no omega‐3 LCPUFA in six trials (RR 0.61, 95% CI 0.30 to 1.24) whereas we found a possible reduction (RR 0.75, 95% CI 0.54 to 1.03; 10 trials, 7416 women). Saccone 2016 also stated that when omega‐3 LCPUFA supplementation started at 20 weeks' or less gestation this showed a large (73%) decrease in perinatal death with omega‐3 LCPUFA compared with placebo in singleton pregnancies, but the authors did not use accepted subgroup interaction methods to test this (Higgins 2011). Our subgroup interaction test for perinatal death did not show a difference in timing of gestation ‐ perinatal death was reduced at any time that supplementation started (≤ 20 weeks' gestation or later) (Analysis 4.7).
4.7. Analysis.
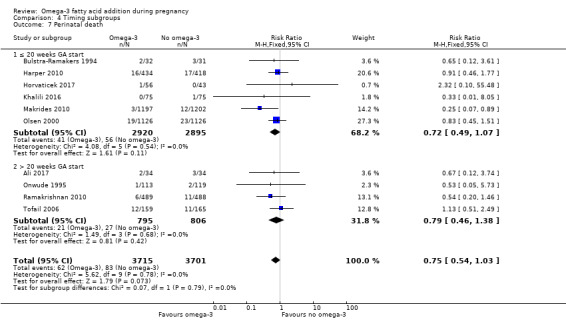
Comparison 4 Timing subgroups, Outcome 7 Perinatal death.
Saccone and colleagues have also published three prior systematic reviews focusing on specific outcomes: Saccone 2015a: recurrent intrauterine growth (three trials); Saccone 2015b: prior preterm birth (two trials); and Saccone 2015c: preterm birth prevention (nine trials). The Saccone 2016 review includes all studies from Saccone 2015a and Saccone 2015c, but not Saccone 2015b, which included two trials in women with prior preterm birth. All relevant studies in the four Saccone reviews are included in our review (Saccone 2015a; Saccone 2015b; Saccone 2015c; Saccone 2016).
Gould and colleagues reviewed 11 RCTs involving 5272 participants and concluded that this body of evidence did not conclusively support or refute the role of omega‐3 LCPUFA supplementation in pregnancy for improving cognitive or visual development (Gould 2013). Other recent reviews of child growth and development are consistent with our findings of little impact from omega‐3 LCPUFA supplementation during pregnancy (Campoy 2012; Li 2017; Rangel‐Huerta 2018).
Authors' conclusions
Implications for practice.
Omega‐3 long‐chain polyunsaturated fatty acids (LCPUFA), particularly docosahexaenoic acid (DHA), supplementation during pregnancy is a simple and effective way to reduce preterm, early preterm birth and low birthweight, with low cost and little indication of harm. The effect of omega‐3 LCPUFA on most child development and growth outcomes is minimal or remains uncertain. A universal strategy of supplementation may be reasonable, although ideally, with more knowledge, this would be targeted to women who would benefit the most. A further consideration is the present reliance on non‐sustainable sources of fish to manufacture omega‐3 LCPUFA supplements. Ideally, universal or targeted omega‐3 LCPUFA supplementation would be accompanied by other ways of improving women's overall nutrition during pregnancy.
Implications for research.
More studies comparing omega‐3 LCPUFA and placebo are not needed at this stage. In addition to the 70 trials included in this review, there are 23 ongoing trials, including the large ORIP trial of over 5000 women which is due to report in 2019 (Makrides 2013 (ORIP)). It is important for trials to assess longer‐term outcomes for mother and child, in order to improve understanding of metabolic, growth, and neurodevelopment pathways, in particular.
Using data from completed trials and other studies, we also need to establish if, and how, outcomes vary by different types of omega‐3 fatty acids, timing and doses; and by characteristics of women (such as baseline DHA status, body‐mass index and previous pregnancy outcomes). Future priority research questions include establishing the minimum effective (and optimal) dose(s) of omega‐3 LCPUFA, the optimal balance of DHA and eicosapentaenoic acid and effects of different forms of omega‐3 LCPUFA. The ORIP trial will provide evidence on whether stopping supplementation at 34 weeks' gestation, instead of continuing supplementation until birth, helps prevent prolonged pregnancies. A planned individual participant meta‐analysis will also address some of these questions. Further mechanistic studies are needed for a broader understanding of the anti‐inflammatory actions of omega‐3 LCPUFA and the circumstances under which these may prevent preterm birth and other adverse birth outcomes.
What's new
| Date | Event | Description |
|---|---|---|
| 16 August 2018 | New citation required and conclusions have changed | Preterm and early preterm birth now clearly reduced with omega‐3 LCPUFA. |
| 16 August 2018 | New search has been performed | Search updated and 64 new trials added |
History
Protocol first published: Issue 4, 2001 Review first published: Issue 3, 2006
| Date | Event | Description |
|---|---|---|
| 11 September 2012 | Amended | Contact details updated. |
| 17 September 2008 | Amended | Converted to new review format. |
Acknowledgements
Sjurdur Olsen and Marie Louise Osterdal provided unpublished data for the Olsen 2000 trial.
Maria Makrides provided unpublished data from the DOMInO trial (Makrides 2010).
We thank Lelia Duley for her contribution and authorship on the first version of this review (Makrides 2006).
We thank Zohra Lassi for contributing to data extraction.
This project was supported by the National Institute for Health Research, via Cochrane Infrastructure funding to Cochrane Pregnancy and Childbirth. The views and opinions expressed therein are those of the authors and do not necessarily reflect those of the Systematic Reviews Programme, NIHR, NHS or the Department of Health.
As part of the pre‐publication editorial process, this review has been commented on by three peers (an editor and two referees who are external to the editorial team), the Cochrane Pregnancy and Childbirth Consumer Editor, and the Cochrane Pregnancy and Childbirth's Statistical Adviser.
Appendices
Appendix 1. Search terms for ICTRP and ClinicalTrials.gov
ICTRP
omega AND pregnancy
fish oil* AND pregnancy
marine oil* AND pregnancy
EPA AND pregnancy
DHA AND pregnancy
docosahex(a)enoic AND pregnancy
eicosapent(a)enoic AND pregnancy
n3 AND pregnancy
n‐3 AND pregnancy
alpha‐linoleic acid AND pregnancy
(each line was run separately and manually de‐duplicated)
ClinicalTrials.gov
Advanced search
Intervention/treatment = alpha‐linoleic acid OR n3 OR n‐3 OR omega OR DHA OR EPA OR marine OR docosahexaenoic OR eicosapentaenoic
Condition = pregnancy
Data and analyses
Comparison 1. Overall: omega‐3 versus no omega‐3.
| Outcome or subgroup title | No. of studies | No. of participants | Statistical method | Effect size |
|---|---|---|---|---|
| 1 Preterm birth (< 37 weeks) | 26 | 10304 | Risk Ratio (M‐H, Fixed, 95% CI) | 0.89 [0.81, 0.97] |
| 2 Early preterm birth (< 34 weeks) | 9 | 5204 | Risk Ratio (M‐H, Fixed, 95% CI) | 0.58 [0.44, 0.77] |
| 3 Prolonged gestation (> 42 weeks) | 6 | 5141 | Risk Ratio (M‐H, Fixed, 95% CI) | 1.61 [1.11, 2.33] |
| 4 Maternal death | 4 | 4830 | Risk Ratio (M‐H, Fixed, 95% CI) | 1.69 [0.07, 39.30] |
| 5 Pre‐eclampsia (hypertension with proteinuria) | 20 | 8306 | Risk Ratio (M‐H, Fixed, 95% CI) | 0.84 [0.69, 1.01] |
| 6 High blood pressure (without proteinuria) | 7 | 4531 | Risk Ratio (M‐H, Fixed, 95% CI) | 1.03 [0.89, 1.20] |
| 7 Eclampsia | 1 | 100 | Risk Ratio (M‐H, Fixed, 95% CI) | 0.14 [0.01, 2.70] |
| 8 Maternal antepartum hospitalisation | 5 | 2876 | Risk Ratio (M‐H, Fixed, 95% CI) | 0.92 [0.81, 1.04] |
| 8.1 Any | 4 | 2813 | Risk Ratio (M‐H, Fixed, 95% CI) | 0.91 [0.80, 1.03] |
| 8.2 Due to PIH or IUGR | 1 | 63 | Risk Ratio (M‐H, Fixed, 95% CI) | 1.23 [0.67, 2.28] |
| 9 Mother's length of stay in hospital (days) | 2 | 2290 | Mean Difference (IV, Fixed, 95% CI) | 0.18 [‐0.20, 0.57] |
| 10 Maternal anaemia | 1 | 846 | Risk Ratio (M‐H, Fixed, 95% CI) | 1.16 [0.91, 1.48] |
| 11 Miscarriage (< 24 weeks) | 9 | 4190 | Risk Ratio (M‐H, Fixed, 95% CI) | 1.07 [0.80, 1.43] |
| 12 Antepartum vaginal bleeding | 2 | 2151 | Risk Ratio (M‐H, Fixed, 95% CI) | 1.01 [0.69, 1.48] |
| 13 Rupture of membranes (PPROM; PROM) | 4 | Risk Ratio (M‐H, Fixed, 95% CI) | Subtotals only | |
| 13.1 Preterm prelabour rupture of membranes (PPROM) | 3 | 925 | Risk Ratio (M‐H, Fixed, 95% CI) | 0.53 [0.25, 1.10] |
| 13.2 Premature rupture of membranes (PROM) | 3 | 915 | Risk Ratio (M‐H, Fixed, 95% CI) | 0.41 [0.21, 0.82] |
| 14 Maternal admission to intensive care | 2 | 2458 | Risk Ratio (M‐H, Fixed, 95% CI) | 0.56 [0.12, 2.63] |
| 15 Maternal adverse events | 17 | Risk Ratio (M‐H, Fixed, 95% CI) | Subtotals only | |
| 15.1 Severe adverse event | 2 | 2690 | Risk Ratio (M‐H, Fixed, 95% CI) | 1.04 [0.40, 2.72] |
| 15.2 Severe enough for cessation | 6 | 1487 | Risk Ratio (M‐H, Fixed, 95% CI) | 1.01 [0.53, 1.93] |
| 15.3 Any | 5 | 1480 | Risk Ratio (M‐H, Fixed, 95% CI) | 1.38 [1.16, 1.65] |
| 15.4 Nausea | 9 | 2929 | Risk Ratio (M‐H, Fixed, 95% CI) | 1.05 [0.90, 1.22] |
| 15.5 Unpleasant taste | 5 | 2356 | Risk Ratio (M‐H, Fixed, 95% CI) | 4.82 [3.35, 6.92] |
| 15.6 Vomiting | 7 | 3640 | Risk Ratio (M‐H, Fixed, 95% CI) | 1.14 [0.95, 1.37] |
| 15.7 Stomach pain | 4 | 928 | Risk Ratio (M‐H, Fixed, 95% CI) | 1.49 [0.62, 3.59] |
| 15.8 Reflux | 1 | 26 | Risk Ratio (M‐H, Fixed, 95% CI) | 1.0 [0.16, 6.07] |
| 15.9 Belching or burping | 5 | 2262 | Risk Ratio (M‐H, Fixed, 95% CI) | 3.52 [2.86, 4.34] |
| 15.10 Diarrhoea | 6 | 1764 | Risk Ratio (M‐H, Fixed, 95% CI) | 0.80 [0.52, 1.24] |
| 15.11 Constipation | 1 | 1077 | Risk Ratio (M‐H, Fixed, 95% CI) | 0.42 [0.08, 2.15] |
| 15.12 Nasal bleeding | 2 | 1506 | Risk Ratio (M‐H, Fixed, 95% CI) | 0.94 [0.71, 1.24] |
| 15.13 Swelling/other reaction at injection site | 1 | 852 | Risk Ratio (M‐H, Fixed, 95% CI) | 1.10 [0.99, 1.22] |
| 15.14 Insomnia | 1 | 36 | Risk Ratio (M‐H, Fixed, 95% CI) | 1.5 [0.28, 7.93] |
| 15.15 Headache | 1 | 301 | Risk Ratio (M‐H, Fixed, 95% CI) | 1.61 [0.91, 2.86] |
| 15.16 Gynaecological infections | 1 | 291 | Risk Ratio (M‐H, Fixed, 95% CI) | 0.84 [0.45, 1.55] |
| 15.17 Labour related | 1 | 291 | Risk Ratio (M‐H, Fixed, 95% CI) | 0.49 [0.27, 0.88] |
| 15.18 Urinary tract infection | 1 | 291 | Risk Ratio (M‐H, Fixed, 95% CI) | 0.30 [0.06, 1.42] |
| 16 Caesarean section | 28 | 8481 | Risk Ratio (M‐H, Fixed, 95% CI) | 0.97 [0.91, 1.03] |
| 17 Induction (post‐term) | 3 | 2900 | Risk Ratio (M‐H, Random, 95% CI) | 0.82 [0.22, 2.98] |
| 18 Blood loss at birth (mL) | 6 | 2776 | Mean Difference (IV, Fixed, 95% CI) | 11.50 [‐6.75, 29.76] |
| 19 Postpartum haemorrhage | 4 | 4085 | Risk Ratio (M‐H, Fixed, 95% CI) | 1.03 [0.82, 1.30] |
| 20 Gestational diabetes | 12 | 5235 | Risk Ratio (M‐H, Fixed, 95% CI) | 1.02 [0.83, 1.26] |
| 21 Maternal insulin resistance (HOMA‐IR) | 3 | 176 | Mean Difference (IV, Random, 95% CI) | ‐0.85 [‐2.50, 0.80] |
| 22 Excessive gestational weight gain | 1 | 350 | Risk Ratio (M‐H, Fixed, 95% CI) | 1.21 [0.95, 1.55] |
| 23 Gestational weight gain (kg) | 11 | 2297 | Mean Difference (IV, Random, 95% CI) | ‐0.05 [‐0.68, 0.59] |
| 24 Depression during pregnancy: thresholds | 3 | Risk Ratio (M‐H, Fixed, 95% CI) | Subtotals only | |
| 24.1 HAMD 50% reduction (after 8 weeks) | 1 | 24 | Risk Ratio (M‐H, Fixed, 95% CI) | 2.26 [0.78, 6.49] |
| 24.2 HAMD ≤ 7 | 1 | 24 | Risk Ratio (M‐H, Fixed, 95% CI) | 2.12 [0.51, 8.84] |
| 24.3 Unspecified | 1 | 301 | Risk Ratio (M‐H, Fixed, 95% CI) | 2.39 [0.47, 12.11] |
| 24.4 EPDS ≥ 11 | 1 | 34 | Risk Ratio (M‐H, Fixed, 95% CI) | 1.4 [0.55, 3.55] |
| 25 Depression during pregnancy: scores | 5 | Mean Difference (IV, Random, 95% CI) | Subtotals only | |
| 25.1 BDI | 2 | 104 | Mean Difference (IV, Random, 95% CI) | ‐5.86 [‐8.32, ‐3.39] |
| 25.2 HAMD | 3 | 71 | Mean Difference (IV, Random, 95% CI) | ‐0.92 [‐5.91, 4.06] |
| 25.3 EPDS | 4 | 122 | Mean Difference (IV, Random, 95% CI) | ‐0.40 [‐3.70, 2.89] |
| 25.4 MADRS | 1 | 26 | Mean Difference (IV, Random, 95% CI) | ‐1.60 [‐7.80, 4.60] |
| 26 Anxiety during pregnancy | 1 | 301 | Risk Ratio (M‐H, Fixed, 95% CI) | 0.95 [0.06, 15.12] |
| 27 Difficult life circumstances (maternal) | 1 | 51 | Mean Difference (IV, Fixed, 95% CI) | 0.32 [‐0.15, 0.79] |
| 28 Stress (maternal) | 1 | Mean Difference (IV, Fixed, 95% CI) | Subtotals only | |
| 28.1 Perceived Stress Scale (scores) | 1 | 51 | Mean Difference (IV, Fixed, 95% CI) | ‐1.82 [‐3.68, 0.04] |
| 29 Depressive symptoms postpartum: threshold | 4 | Risk Ratio (M‐H, Random, 95% CI) | Subtotals only | |
| 29.1 PDSS ≥ 80 | 1 | 42 | Risk Ratio (M‐H, Random, 95% CI) | 0.37 [0.04, 3.25] |
| 29.2 EPDS | 2 | 2431 | Risk Ratio (M‐H, Random, 95% CI) | 0.99 [0.56, 1.77] |
| 29.3 Major depressive disorder | 1 | 118 | Risk Ratio (M‐H, Random, 95% CI) | 1.33 [0.27, 6.56] |
| 30 Depressive symptoms postpartum: scores | 2 | Mean Difference (IV, Fixed, 95% CI) | Subtotals only | |
| 30.1 BDI: 6‐8 weeks postpartum | 1 | 118 | Mean Difference (IV, Fixed, 95% CI) | 0.25 [‐1.93, 2.43] |
| 30.2 PDSS total (LS over 6 months) | 1 | 42 | Mean Difference (IV, Fixed, 95% CI) | ‐6.08 [‐12.42, 0.26] |
| 30.3 Disturbances sleep/eating (LS over 6 months) | 1 | 42 | Mean Difference (IV, Fixed, 95% CI) | ‐1.0 [‐2.66, 0.66] |
| 30.4 Anxiety/insecurity (LS over 6 months) | 1 | 42 | Mean Difference (IV, Fixed, 95% CI) | ‐1.30 [‐2.96, 0.36] |
| 30.5 Emotional lability (LS over 6 months) | 1 | 42 | Mean Difference (IV, Fixed, 95% CI) | ‐1.29 [‐3.10, 0.52] |
| 30.6 Mental confusion (LS over 6 months) | 1 | 42 | Mean Difference (IV, Fixed, 95% CI) | ‐1.30 [‐2.92, 0.32] |
| 30.7 Loss of self (LS over 6 months) | 1 | 42 | Mean Difference (IV, Fixed, 95% CI) | ‐0.90 [‐1.80, 0.00] |
| 30.8 Guilt (LS over 6 months) | 1 | 42 | Mean Difference (IV, Fixed, 95% CI) | ‐0.30 [‐1.13, 0.53] |
| 30.9 Suicide (LS over 6 months) | 1 | 42 | Mean Difference (IV, Fixed, 95% CI) | ‐0.07 [‐0.35, 0.21] |
| 30.10 PDSS total at 6 months | 1 | 42 | Mean Difference (IV, Fixed, 95% CI) | ‐2.87 [‐12.17, 6.43] |
| 30.11 Disturbances sleep/eating at 6 months | 1 | 42 | Mean Difference (IV, Fixed, 95% CI) | ‐0.20 [‐2.08, 1.68] |
| 30.12 Anxiety/insecurity at 6 months | 1 | 42 | Mean Difference (IV, Fixed, 95% CI) | ‐0.46 [‐2.65, 1.73] |
| 30.13 Emotional lability at 6 months | 1 | 42 | Mean Difference (IV, Fixed, 95% CI) | ‐0.96 [‐3.32, 1.40] |
| 30.14 Mental confusion at 6 months | 1 | 42 | Mean Difference (IV, Fixed, 95% CI) | ‐0.13 [‐2.15, 1.89] |
| 30.15 Loss of self at 6 months | 1 | 42 | Mean Difference (IV, Fixed, 95% CI) | ‐0.97 [‐2.18, 0.24] |
| 30.16 Guilt at 6 months | 1 | 42 | Mean Difference (IV, Fixed, 95% CI) | 0.21 [‐0.69, 1.11] |
| 30.17 Suicide at 6 months | 1 | 42 | Mean Difference (IV, Fixed, 95% CI) | ‐0.52 [‐1.13, 0.09] |
| 31 Gestational length (days) | 43 | 12517 | Mean Difference (IV, Random, 95% CI) | 1.67 [0.95, 2.39] |
| 32 Perinatal death | 10 | 7416 | Risk Ratio (M‐H, Fixed, 95% CI) | 0.75 [0.54, 1.03] |
| 33 Stillbirth | 16 | 7880 | Risk Ratio (M‐H, Fixed, 95% CI) | 0.94 [0.62, 1.42] |
| 34 Neonatal death | 9 | 7448 | Risk Ratio (M‐H, Fixed, 95% CI) | 0.61 [0.34, 1.11] |
| 35 Infant death | 4 | 3239 | Risk Ratio (M‐H, Fixed, 95% CI) | 0.74 [0.25, 2.19] |
| 36 Large‐for‐gestational age | 6 | 3722 | Risk Ratio (M‐H, Fixed, 95% CI) | 1.15 [0.97, 1.36] |
| 37 Macrosomia | 6 | 2008 | Risk Ratio (M‐H, Fixed, 95% CI) | 0.69 [0.43, 1.13] |
| 38 Low birthweight (< 2500 g) | 15 | 8449 | Risk Ratio (M‐H, Fixed, 95% CI) | 0.90 [0.82, 0.99] |
| 39 Small‐for‐gestational age/IUGR | 8 | 6907 | Risk Ratio (M‐H, Fixed, 95% CI) | 1.01 [0.90, 1.13] |
| 40 Birthweight (g) | 44 | 11584 | Mean Difference (IV, Random, 95% CI) | 75.74 [38.05, 113.43] |
| 41 Birthweight Z score | 4 | 2792 | Mean Difference (IV, Fixed, 95% CI) | 0.06 [‐0.02, 0.13] |
| 42 Birth length (cm) | 29 | 8128 | Mean Difference (IV, Random, 95% CI) | 0.11 [‐0.10, 0.31] |
| 43 Head circumference at birth (cm) | 24 | 7161 | Mean Difference (IV, Random, 95% CI) | 0.07 [‐0.05, 0.19] |
| 44 Head circumference at birth Z score | 2 | 2462 | Mean Difference (IV, Fixed, 95% CI) | ‐0.03 [‐0.14, 0.07] |
| 45 Length at birth Z score | 2 | 2462 | Mean Difference (IV, Random, 95% CI) | 0.18 [‐0.18, 0.54] |
| 46 Baby admitted to neonatal care | 9 | 6920 | Risk Ratio (M‐H, Fixed, 95% CI) | 0.92 [0.83, 1.03] |
| 47 Infant length of stay in hospital (days) | 1 | 2041 | Mean Difference (IV, Fixed, 95% CI) | 0.11 [‐1.40, 1.62] |
| 48 Congenital anomalies | 3 | 1807 | Risk Ratio (M‐H, Fixed, 95% CI) | 1.08 [0.61, 1.92] |
| 49 Retinopathy of prematurity | 1 | 837 | Risk Ratio (M‐H, Fixed, 95% CI) | 1.20 [0.32, 4.44] |
| 50 Bronchopulmonary dysplasia | 2 | 3191 | Risk Ratio (M‐H, Fixed, 95% CI) | 1.06 [0.45, 2.48] |
| 51 Respiratory distress syndrome | 2 | 1129 | Risk Ratio (M‐H, Random, 95% CI) | 1.17 [0.54, 2.52] |
| 52 Necrotising enterocolitis (NEC) | 2 | 3198 | Risk Ratio (M‐H, Fixed, 95% CI) | 0.97 [0.26, 3.55] |
| 53 Neonatal sepsis (proven) | 3 | 3788 | Risk Ratio (M‐H, Fixed, 95% CI) | 0.97 [0.44, 2.14] |
| 54 Convulsion | 1 | 2361 | Risk Ratio (M‐H, Fixed, 95% CI) | 0.09 [0.01, 1.63] |
| 55 Intraventricular haemorrhage | 3 | Risk Ratio (M‐H, Random, 95% CI) | Subtotals only | |
| 55.1 Any | 3 | 5423 | Risk Ratio (M‐H, Random, 95% CI) | 1.00 [0.29, 3.49] |
| 55.2 Grade 3 or 4 | 1 | 837 | Risk Ratio (M‐H, Random, 95% CI) | 1.60 [0.38, 6.65] |
| 56 Neonatal/infant adverse events | 3 | Risk Ratio (M‐H, Fixed, 95% CI) | Subtotals only | |
| 56.1 Any adverse event | 2 | 592 | Risk Ratio (M‐H, Fixed, 95% CI) | 0.92 [0.82, 1.02] |
| 56.2 Serious adverse events | 2 | 2690 | Risk Ratio (M‐H, Fixed, 95% CI) | 0.72 [0.53, 0.99] |
| 57 Neonatal/infant morbidity: cardiovascular | 1 | Risk Ratio (M‐H, Fixed, 95% CI) | Subtotals only | |
| 58 Neonatal/infant morbidity: respiratory | 1 | 291 | Risk Ratio (M‐H, Fixed, 95% CI) | 1.02 [0.66, 1.57] |
| 59 Neonatal/infant morbidity: due to pregnancy/birth events | 1 | 291 | Risk Ratio (M‐H, Fixed, 95% CI) | 1.02 [0.67, 1.55] |
| 60 Neonatal/infant morbidity: other | 1 | Risk Ratio (M‐H, Fixed, 95% CI) | Subtotals only | |
| 60.1 Colds in past 15 days: at 1 month of age | 1 | 849 | Risk Ratio (M‐H, Fixed, 95% CI) | 0.85 [0.72, 1.00] |
| 60.2 Colds in past 15 days: at 3 months of age | 1 | 834 | Risk Ratio (M‐H, Fixed, 95% CI) | 0.86 [0.73, 1.01] |
| 60.3 Colds in past 15 days: at 6 months of age | 1 | 834 | Risk Ratio (M‐H, Fixed, 95% CI) | 0.99 [0.86, 1.15] |
| 60.4 Fever in past 15 days: at 1 month of age | 1 | 849 | Risk Ratio (M‐H, Fixed, 95% CI) | 1.08 [0.53, 2.22] |
| 60.5 Fever in past 15 days: at 3 months of age | 1 | 834 | Risk Ratio (M‐H, Fixed, 95% CI) | 0.80 [0.53, 1.23] |
| 60.6 Fever in past 15 days: at 6 months of age | 1 | 834 | Risk Ratio (M‐H, Fixed, 95% CI) | 0.99 [0.74, 1.31] |
| 60.7 Rash in past 15 days: at 1 month of age | 1 | 849 | Risk Ratio (M‐H, Fixed, 95% CI) | 1.11 [0.89, 1.38] |
| 60.8 Rash in past 15 days: at 3 months of age | 1 | 834 | Risk Ratio (M‐H, Fixed, 95% CI) | 0.82 [0.54, 1.26] |
| 60.9 Rash in past 15 days: at 6 months of age | 1 | 834 | Risk Ratio (M‐H, Fixed, 95% CI) | 1.14 [0.76, 1.71] |
| 60.10 Vomiting in past 15 days: at 1 month of age | 1 | 849 | Risk Ratio (M‐H, Fixed, 95% CI) | 1.55 [0.82, 2.93] |
| 60.11 Vomiting in past 15 days: at 3 months of age | 1 | 834 | Risk Ratio (M‐H, Fixed, 95% CI) | 1.43 [0.69, 2.96] |
| 60.12 Vomiting in past 15 days: at 6 months of age | 1 | 834 | Risk Ratio (M‐H, Fixed, 95% CI) | 1.33 [0.72, 2.46] |
| 60.13 Diarrhoea in past 15 days: at 1 month of age | 1 | 849 | Risk Ratio (M‐H, Fixed, 95% CI) | 0.83 [0.42, 1.67] |
| 60.14 Diarrhoea in past 15 days: at 3 months of age | 1 | 834 | Risk Ratio (M‐H, Fixed, 95% CI) | 0.83 [0.46, 1.51] |
| 60.15 Diarrhoea in past 15 days: at 6 months of age | 1 | 834 | Risk Ratio (M‐H, Fixed, 95% CI) | 1.02 [0.63, 1.64] |
| 60.16 Other illness in the past 15 days: at 1 month | 1 | 849 | Risk Ratio (M‐H, Fixed, 95% CI) | 1.40 [0.81, 2.41] |
| 60.17 Other illness in the past 15 days: at 3 months | 1 | 834 | Risk Ratio (M‐H, Fixed, 95% CI) | 0.96 [0.54, 1.73] |
| 60.18 Other illness in the past 15 days: at 6 months | 1 | 834 | Risk Ratio (M‐H, Fixed, 95% CI) | 1.15 [0.68, 1.95] |
| 61 Infant/child morbidity | 1 | Risk Ratio (M‐H, Fixed, 95% CI) | Subtotals only | |
| 61.1 ICU admissions | 1 | 1396 | Risk Ratio (M‐H, Fixed, 95% CI) | 0.58 [0.31, 1.06] |
| 61.2 Medical diagnosis of attention deficit hyperactivity disorder (ADHD) | 1 | 1526 | Risk Ratio (M‐H, Fixed, 95% CI) | 2.96 [0.31, 28.40] |
| 61.3 Medical diagnosis of autism spectrum disorder | 1 | 1526 | Risk Ratio (M‐H, Fixed, 95% CI) | 1.15 [0.54, 2.47] |
| 61.4 Medical diagnosis of other learning/behavioural disorders | 1 | 1526 | Risk Ratio (M‐H, Fixed, 95% CI) | 1.12 [0.78, 1.60] |
| 61.5 Medical diagnosis of other chronic health conditions | 1 | 1526 | Risk Ratio (M‐H, Fixed, 95% CI) | 0.97 [0.65, 1.44] |
| 62 Ponderal index | 6 | 887 | Mean Difference (IV, Random, 95% CI) | 0.05 [‐0.01, 0.11] |
| 63 Infant/child weight (kg) | 11 | Mean Difference (IV, Random, 95% CI) | Subtotals only | |
| 63.1 At < 3 months | 2 | 863 | Mean Difference (IV, Random, 95% CI) | 0.01 [‐0.07, 0.09] |
| 63.2 At 3 to < 12 months | 4 | 1028 | Mean Difference (IV, Random, 95% CI) | 0.01 [‐0.18, 0.20] |
| 63.3 At 1 to < 2 years | 4 | 1084 | Mean Difference (IV, Random, 95% CI) | 0.01 [‐0.19, 0.21] |
| 63.4 At 2 to < 3 years | 2 | 182 | Mean Difference (IV, Random, 95% CI) | 0.24 [‐0.20, 0.68] |
| 63.5 At 3 to < 4 years | 2 | 1651 | Mean Difference (IV, Random, 95% CI) | 0.18 [‐0.20, 0.57] |
| 63.6 At 4 to < 5 years | 2 | 631 | Mean Difference (IV, Random, 95% CI) | 0.38 [‐0.29, 1.05] |
| 63.7 At 5 to < 6 years | 4 | 2618 | Mean Difference (IV, Random, 95% CI) | 0.23 [‐0.18, 0.63] |
| 63.8 At ≥ 6 years | 3 | 508 | Mean Difference (IV, Random, 95% CI) | ‐0.08 [‐0.79, 0.64] |
| 64 Infant/child length/height (cm) | 11 | Mean Difference (IV, Random, 95% CI) | Subtotals only | |
| 64.1 < 3 months | 2 | 861 | Mean Difference (IV, Random, 95% CI) | ‐0.01 [‐0.69, 0.66] |
| 64.2 3 to < 12 months | 4 | 1115 | Mean Difference (IV, Random, 95% CI) | 0.11 [‐0.20, 0.42] |
| 64.3 1 to < 2 years | 4 | 998 | Mean Difference (IV, Random, 95% CI) | 0.01 [‐0.45, 0.48] |
| 64.4 2 to < 3 years | 2 | 182 | Mean Difference (IV, Random, 95% CI) | 0.18 [‐0.73, 1.08] |
| 64.5 3 to < 4 years | 2 | 1651 | Mean Difference (IV, Random, 95% CI) | 0.18 [‐0.21, 0.58] |
| 64.6 4 to < 5 years | 2 | 631 | Mean Difference (IV, Random, 95% CI) | 0.30 [‐0.36, 0.95] |
| 64.7 5 to < 6 years | 5 | 2733 | Mean Difference (IV, Random, 95% CI) | 0.20 [‐0.17, 0.57] |
| 64.8 At ≥ 6 years | 2 | 393 | Mean Difference (IV, Random, 95% CI) | ‐1.22 [‐2.29, ‐0.16] |
| 65 Infant/child head circumference (cm) | 10 | Mean Difference (IV, Random, 95% CI) | Subtotals only | |
| 65.1 At < 3 months | 2 | 863 | Mean Difference (IV, Random, 95% CI) | ‐0.04 [‐0.22, 0.14] |
| 65.2 At 3 to < 12 months | 5 | 1309 | Mean Difference (IV, Random, 95% CI) | ‐0.03 [‐0.19, 0.12] |
| 65.3 At 1 to < 2 years | 4 | 1084 | Mean Difference (IV, Random, 95% CI) | 0.06 [‐0.18, 0.30] |
| 65.4 At 2 to < 3 years | 2 | 182 | Mean Difference (IV, Random, 95% CI) | ‐0.04 [‐0.47, 0.40] |
| 65.5 At 3 to < 4 years | 2 | 1651 | Mean Difference (IV, Random, 95% CI) | ‐0.01 [‐0.16, 0.14] |
| 65.6 At 4 to < 5 years | 1 | 107 | Mean Difference (IV, Random, 95% CI) | 0.0 [‐0.47, 0.47] |
| 65.7 At ≥ 5 years | 3 | 1760 | Mean Difference (IV, Random, 95% CI) | 0.02 [‐0.13, 0.17] |
| 66 Infant/child length/height for age Z score (LAZ/HAZ) | 3 | Mean Difference (IV, Random, 95% CI) | Subtotals only | |
| 66.1 At < 3 months | 2 | 875 | Mean Difference (IV, Random, 95% CI) | ‐0.13 [‐0.27, 0.02] |
| 66.2 At 3 to < 12 months | 3 | 1085 | Mean Difference (IV, Random, 95% CI) | ‐0.05 [‐0.19, 0.09] |
| 66.3 At 12 to < 24 months | 2 | 897 | Mean Difference (IV, Random, 95% CI) | ‐0.06 [‐0.31, 0.18] |
| 66.4 At 4 to < 5 years | 1 | 524 | Mean Difference (IV, Random, 95% CI) | 0.0 [‐0.15, 0.15] |
| 66.5 At ≥ 5 years | 1 | 802 | Mean Difference (IV, Random, 95% CI) | 0.0 [‐0.12, 0.12] |
| 67 Infant/child waist circumference (cm) | 2 | Mean Difference (IV, Fixed, 95% CI) | Subtotals only | |
| 67.1 At 2 to < 3 years | 1 | 101 | Mean Difference (IV, Fixed, 95% CI) | ‐0.20 [‐1.29, 0.89] |
| 67.2 At 3 to < 4 years | 2 | 1651 | Mean Difference (IV, Fixed, 95% CI) | 0.28 [‐0.05, 0.60] |
| 67.3 At 4 to < 5 years | 1 | 106 | Mean Difference (IV, Fixed, 95% CI) | 0.70 [‐0.40, 1.80] |
| 67.4 At ≥ 5 years | 2 | 1645 | Mean Difference (IV, Fixed, 95% CI) | 0.15 [‐0.24, 0.55] |
| 68 Infant/child weight‐for‐age Z score (WAZ) | 2 | Mean Difference (IV, Random, 95% CI) | Subtotals only | |
| 68.1 At < 3 months | 2 | 874 | Mean Difference (IV, Random, 95% CI) | ‐0.09 [‐0.30, 0.12] |
| 68.2 At 3 to < 12 months | 2 | 834 | Mean Difference (IV, Random, 95% CI) | ‐0.05 [‐0.18, 0.08] |
| 68.3 At 12 to < 24 months | 2 | 883 | Mean Difference (IV, Random, 95% CI) | ‐0.01 [‐0.13, 0.12] |
| 68.4 At ≥ 60 months | 1 | 802 | Mean Difference (IV, Random, 95% CI) | ‐0.1 [‐0.25, 0.05] |
| 69 Infant/child BMI Z score | 5 | Mean Difference (IV, Random, 95% CI) | Subtotals only | |
| 69.1 At 1 to < 2 years | 2 | 801 | Mean Difference (IV, Random, 95% CI) | ‐0.05 [‐0.09, 0.00] |
| 69.2 At 2 to < 3 years | 1 | 63 | Mean Difference (IV, Random, 95% CI) | ‐0.07 [‐0.25, 0.11] |
| 69.3 At 3 to < 4 years | 1 | 1531 | Mean Difference (IV, Random, 95% CI) | 0.02 [‐0.08, 0.12] |
| 69.4 At 4 to < 5 years | 2 | 587 | Mean Difference (IV, Random, 95% CI) | 0.15 [‐0.16, 0.47] |
| 69.5 At 5 to < 6 years | 3 | 2504 | Mean Difference (IV, Random, 95% CI) | 0.03 [‐0.05, 0.11] |
| 69.6 At 6 to < 7 years | 1 | 115 | Mean Difference (IV, Random, 95% CI) | 0.01 [‐0.02, 0.05] |
| 69.7 At ≥ 7 years | 1 | 250 | Mean Difference (IV, Random, 95% CI) | 0.18 [‐0.10, 0.46] |
| 70 Infant/child weight for length/height Z score (WHZ) | 3 | Mean Difference (IV, Random, 95% CI) | Subtotals only | |
| 70.1 At < 3 months | 2 | 860 | Mean Difference (IV, Random, 95% CI) | ‐0.03 [‐0.41, 0.34] |
| 70.2 At 3 to < 12 months | 3 | 1083 | Mean Difference (IV, Random, 95% CI) | ‐0.00 [‐0.14, 0.14] |
| 70.3 At 12 to < 24 months | 2 | 883 | Mean Difference (IV, Random, 95% CI) | ‐0.02 [‐0.14, 0.10] |
| 71 Infant/child BMI percentile | 1 | Mean Difference (IV, Fixed, 95% CI) | Subtotals only | |
| 71.1 At 24 months | 1 | 118 | Mean Difference (IV, Fixed, 95% CI) | 4.5 [‐5.50, 14.50] |
| 71.2 At 36 months | 1 | 120 | Mean Difference (IV, Fixed, 95% CI) | 8.0 [‐1.09, 17.09] |
| 71.3 At 48 months | 1 | 107 | Mean Difference (IV, Fixed, 95% CI) | 13.0 [3.19, 22.81] |
| 71.4 At 60 months | 1 | 114 | Mean Difference (IV, Fixed, 95% CI) | 4.80 [‐4.70, 14.30] |
| 72 Child/adult BMI | 3 | Mean Difference (IV, Fixed, 95% CI) | Subtotals only | |
| 72.1 At 3 to 4 years | 1 | 1531 | Mean Difference (IV, Fixed, 95% CI) | 0.01 [‐0.14, 0.16] |
| 72.2 At 5 to 6 years | 1 | 1531 | Mean Difference (IV, Fixed, 95% CI) | ‐0.01 [‐0.18, 0.16] |
| 72.3 At 7 to 9 years | 2 | 393 | Mean Difference (IV, Fixed, 95% CI) | 0.16 [‐0.25, 0.57] |
| 72.4 At 19 years | 1 | 243 | Mean Difference (IV, Fixed, 95% CI) | 0.0 [‐0.83, 0.83] |
| 73 Infant/child body fat (%) | 3 | Mean Difference (IV, Fixed, 95% CI) | Subtotals only | |
| 73.1 At 1 year | 1 | 165 | Mean Difference (IV, Fixed, 95% CI) | 0.0 [‐0.88, 0.88] |
| 73.2 At 2 to < 3 years | 1 | 110 | Mean Difference (IV, Fixed, 95% CI) | 0.20 [‐0.68, 1.08] |
| 73.3 At 3 to < 4 years | 2 | 1644 | Mean Difference (IV, Fixed, 95% CI) | ‐0.18 [‐0.74, 0.38] |
| 73.4 At 4 to < 5 years | 1 | 102 | Mean Difference (IV, Fixed, 95% CI) | 0.30 [‐0.79, 1.39] |
| 73.5 At 5 to < 6 years | 3 | 1797 | Mean Difference (IV, Fixed, 95% CI) | 0.01 [‐0.56, 0.58] |
| 73.6 At ≥ 7 years: BIS | 1 | 250 | Mean Difference (IV, Fixed, 95% CI) | 1.44 [‐0.31, 3.19] |
| 73.7 At ≥ 7 years: BOD POD | 1 | 250 | Mean Difference (IV, Fixed, 95% CI) | ‐0.42 [‐2.23, 1.39] |
| 74 Infant/child total fat mass (kg) | 3 | Mean Difference (IV, Fixed, 95% CI) | Subtotals only | |
| 74.1 At 1 year | 1 | 164 | Mean Difference (IV, Fixed, 95% CI) | 0.0 [‐0.07, 0.07] |
| 74.2 At 2 to < 3 years | 1 | 110 | Mean Difference (IV, Fixed, 95% CI) | 0.10 [‐0.09, 0.29] |
| 74.3 At 3 to < 4 years | 2 | 1644 | Mean Difference (IV, Fixed, 95% CI) | ‐0.01 [‐0.12, 0.10] |
| 74.4 At 4 to < 5 years | 1 | 102 | Mean Difference (IV, Fixed, 95% CI) | 0.20 [‐0.05, 0.45] |
| 74.5 At 5 to < 6 years | 3 | 1797 | Mean Difference (IV, Fixed, 95% CI) | 0.05 [‐0.10, 0.21] |
| 74.6 Up to 8 years: BOD POD | 1 | 250 | Mean Difference (IV, Fixed, 95% CI) | 0.08 [‐0.71, 0.87] |
| 74.7 Up to 8 years: BIS | 1 | 250 | Mean Difference (IV, Fixed, 95% CI) | 0.29 [‐0.47, 1.05] |
| 75 Cognition: thresholds | 3 | Risk Ratio (M‐H, Fixed, 95% CI) | Subtotals only | |
| 75.1 BSID III < 85 at 18 months | 1 | 726 | Risk Ratio (M‐H, Fixed, 95% CI) | 0.49 [0.24, 0.98] |
| 75.2 BSID III > 115 at 18 months | 1 | 726 | Risk Ratio (M‐H, Fixed, 95% CI) | 0.84 [0.49, 1.44] |
| 75.3 BSID II < 85 at 18 months | 1 | 730 | Risk Ratio (M‐H, Fixed, 95% CI) | 1.43 [0.97, 2.12] |
| 75.4 BSID III cognitive score (highest quartile): at 18 months | 1 | 154 | Risk Ratio (M‐H, Fixed, 95% CI) | 0.90 [0.49, 1.65] |
| 76 Cognition: scores | 10 | Mean Difference (IV, Fixed, 95% CI) | Subtotals only | |
| 76.1 BSID II score < 24 months | 4 | 1154 | Mean Difference (IV, Fixed, 95% CI) | ‐0.37 [‐1.49, 0.76] |
| 76.2 BSID III score < 24 months | 2 | 809 | Mean Difference (IV, Fixed, 95% CI) | 0.04 [‐1.59, 1.68] |
| 76.3 Fagan novelty preference < 24 months | 2 | 274 | Mean Difference (IV, Fixed, 95% CI) | ‐0.79 [‐1.68, 0.11] |
| 76.4 K‐ABC mental processing composite at 2 to 5 years | 1 | 84 | Mean Difference (IV, Fixed, 95% CI) | 4.10 [‐0.14, 8.34] |
| 76.5 K‐ABC sequential processing at 5 to 6 years | 1 | 96 | Mean Difference (IV, Fixed, 95% CI) | 0.0 [‐1.80, 1.80] |
| 76.6 GMDS general quotient score at 2 to 5 years | 1 | 72 | Mean Difference (IV, Fixed, 95% CI) | 3.70 [‐1.02, 8.42] |
| 76.7 DAS II: General Conceptual Ability Scale at 2 to 5 years | 1 | 646 | Mean Difference (IV, Fixed, 95% CI) | 0.13 [‐1.53, 1.79] |
| 76.8 DAS II: Non‐verbal Reasoning Scale at 2 to 5 years | 1 | 646 | Mean Difference (IV, Fixed, 95% CI) | ‐0.35 [‐2.04, 1.34] |
| 76.9 DAS II: Verbal Scale at 2 to 5 years | 1 | 646 | Mean Difference (IV, Fixed, 95% CI) | ‐0.35 [‐1.74, 1.04] |
| 76.10 DAS II: Spatial Scale at 2 to 5 years | 1 | 646 | Mean Difference (IV, Fixed, 95% CI) | 0.96 [‐0.77, 2.69] |
| 76.11 MCDS: scale index general cognitive at 5 years | 1 | 797 | Mean Difference (IV, Fixed, 95% CI) | ‐0.5 [‐2.35, 1.35] |
| 76.12 WASI full‐scale IQ at 6 to 9 years | 1 | 543 | Mean Difference (IV, Fixed, 95% CI) | 1.0 [‐0.79, 2.79] |
| 76.13 WISC‐IV full scale IQ at > 12 years | 1 | 50 | Mean Difference (IV, Fixed, 95% CI) | 1.0 [‐5.16, 7.16] |
| 77 Attention: scores | 3 | Mean Difference (IV, Fixed, 95% CI) | Subtotals only | |
| 77.1 K‐CPT omissions at 5 years | 1 | 797 | Mean Difference (IV, Fixed, 95% CI) | ‐1.90 [‐3.39, ‐0.41] |
| 77.2 K‐CPT commissions at 5 years | 1 | 797 | Mean Difference (IV, Fixed, 95% CI) | 0.10 [‐1.37, 1.57] |
| 77.3 K‐CPT hit response time at 5 years | 1 | 797 | Mean Difference (IV, Fixed, 95% CI) | ‐0.60 [‐2.06, 0.86] |
| 77.4 Attention: single‐object task: total time looking at toy(s) at 2 to 5 years | 1 | 150 | Mean Difference (IV, Fixed, 95% CI) | ‐7.80 [‐22.59, 6.99] |
| 77.5 Attention: multiple‐object task; # times shifted looks between toys at 2 to 5 years | 1 | 150 | Mean Difference (IV, Fixed, 95% CI) | ‐0.40 [‐4.28, 3.48] |
| 77.6 Attention: distractibility: av latency to look when attention focused (s) at 2 to 5 years | 1 | 150 | Mean Difference (IV, Fixed, 95% CI) | ‐0.30 [‐0.86, 0.26] |
| 77.7 Attention: global speed (ms) at 8.5 years | 1 | 130 | Mean Difference (IV, Fixed, 95% CI) | ‐5.5 [‐47.16, 36.16] |
| 77.8 Attention: interference (ms) at 8.5 years | 1 | 130 | Mean Difference (IV, Fixed, 95% CI) | 6.97 [‐16.42, 30.36] |
| 77.9 Attention: orienting (ms) at 8.5 years | 1 | 130 | Mean Difference (IV, Fixed, 95% CI) | 3.99 [‐16.90, 24.88] |
| 77.10 Attention: alertness (ms) at 8.5 years | 1 | 130 | Mean Difference (IV, Fixed, 95% CI) | ‐5.69 [‐27.88, 16.50] |
| 78 Motor: thresholds | 2 | Risk Ratio (M‐H, Fixed, 95% CI) | Subtotals only | |
| 78.1 BSID II score < 85 at 18 months | 1 | 730 | Risk Ratio (M‐H, Fixed, 95% CI) | 0.88 [0.65, 1.19] |
| 78.2 Fine motor (highest quartile): at 18 months | 1 | 154 | Risk Ratio (M‐H, Fixed, 95% CI) | 1.19 [0.71, 1.99] |
| 78.3 Gross motor (highest quartile): at 18 months | 1 | 154 | Risk Ratio (M‐H, Fixed, 95% CI) | 1.13 [0.68, 1.88] |
| 79 Motor: scores | 6 | Mean Difference (IV, Fixed, 95% CI) | Subtotals only | |
| 79.1 BSID II at < 24 months | 4 | 1153 | Mean Difference (IV, Fixed, 95% CI) | 0.23 [‐0.90, 1.36] |
| 79.2 BSID III at < 24 months | 1 | 726 | Mean Difference (IV, Fixed, 95% CI) | 0.06 [‐1.52, 1.64] |
| 79.3 BSID III fine motor score at < 24 months | 1 | 49 | Mean Difference (IV, Fixed, 95% CI) | 0.05 [‐1.20, 1.30] |
| 79.4 BSID III gross motor score at < 24 months | 1 | 49 | Mean Difference (IV, Fixed, 95% CI) | 0.05 [‐0.68, 0.78] |
| 80 Language: thresholds | 2 | Risk Ratio (M‐H, Fixed, 95% CI) | Subtotals only | |
| 80.1 BSID III < 85 | 1 | 726 | Risk Ratio (M‐H, Fixed, 95% CI) | 1.02 [0.74, 1.40] |
| 80.2 BSID III > 115 | 1 | 726 | Risk Ratio (M‐H, Fixed, 95% CI) | 0.82 [0.52, 1.29] |
| 80.3 Receptive language (highest quartile) | 1 | 154 | Risk Ratio (M‐H, Fixed, 95% CI) | 1.82 [1.07, 3.10] |
| 80.4 Expressive language (highest quartile) | 1 | 154 | Risk Ratio (M‐H, Fixed, 95% CI) | 1.65 [1.02, 2.68] |
| 80.5 Infant CDI: words understood (highest quartile) | 1 | 159 | Risk Ratio (M‐H, Fixed, 95% CI) | 2.42 [1.33, 4.42] |
| 80.6 Infant CDI: words produced (highest quartile) | 1 | 159 | Risk Ratio (M‐H, Fixed, 95% CI) | 2.08 [1.15, 3.74] |
| 80.7 Infant CDI: words understood (highest quartile) | 1 | 134 | Risk Ratio (M‐H, Fixed, 95% CI) | 1.97 [1.11, 3.48] |
| 80.8 Infant CDI: words produced (highest quartile) | 1 | 134 | Risk Ratio (M‐H, Fixed, 95% CI) | 1.97 [1.11, 3.48] |
| 80.9 Toddler CDI: words produced (highest quartile) | 1 | 134 | Risk Ratio (M‐H, Fixed, 95% CI) | 2.09 [1.12, 3.90] |
| 80.10 Non‐native constant contrast discrimination | 1 | 144 | Risk Ratio (M‐H, Fixed, 95% CI) | 0.97 [0.68, 1.40] |
| 81 Language: scores | 5 | Mean Difference (IV, Fixed, 95% CI) | Subtotals only | |
| 81.1 Receptive communication at < 24 months | 1 | 49 | Mean Difference (IV, Fixed, 95% CI) | 0.55 [‐0.77, 1.87] |
| 81.2 Receptive language (Peabody Picture Vocabulary Test IIIA) at 2 to 5 years | 1 | 70 | Mean Difference (IV, Fixed, 95% CI) | 3.90 [‐0.73, 8.53] |
| 81.3 Expressive communication at < 24 months | 1 | 49 | Mean Difference (IV, Fixed, 95% CI) | 0.21 [‐0.86, 1.28] |
| 81.4 BSID III at < 24 months | 2 | 809 | Mean Difference (IV, Fixed, 95% CI) | ‐0.84 [‐2.77, 1.09] |
| 81.5 CELF‐P2 Core Language Score at 2 to 5 years | 1 | 646 | Mean Difference (IV, Fixed, 95% CI) | ‐0.93 [‐2.92, 1.06] |
| 81.6 CELF‐P2 Core Language Score at 6 to 9 years | 1 | 543 | Mean Difference (IV, Fixed, 95% CI) | ‐0.21 [‐2.51, 2.09] |
| 81.7 Peabody Picture Vocabulary Test | 1 | 97 | Mean Difference (IV, Fixed, 95% CI) | 4.0 [‐3.11, 11.11] |
| 82 Behaviour: thresholds | 1 | Risk Ratio (M‐H, Fixed, 95% CI) | Subtotals only | |
| 82.1 Behaviour Rating Scale scores < 26: at < 24 months | 1 | 730 | Risk Ratio (M‐H, Fixed, 95% CI) | 5.0 [0.24, 103.79] |
| 83 Behaviour: scores | 6 | Mean Difference (IV, Fixed, 95% CI) | Subtotals only | |
| 83.1 NBAS habituation | 1 | 27 | Mean Difference (IV, Fixed, 95% CI) | ‐1.45 [‐8.49, 5.59] |
| 83.2 NBAS orienting | 1 | 27 | Mean Difference (IV, Fixed, 95% CI) | 3.65 [‐9.09, 16.39] |
| 83.3 NBAS motor | 1 | 27 | Mean Difference (IV, Fixed, 95% CI) | 2.99 [‐8.23, 14.21] |
| 83.4 NBAS state organisation | 1 | 27 | Mean Difference (IV, Fixed, 95% CI) | 1.63 [‐7.21, 10.47] |
| 83.5 NBAS state regulation | 1 | 27 | Mean Difference (IV, Fixed, 95% CI) | 0.51 [‐14.70, 15.72] |
| 83.6 NBAS autonomic | 1 | 27 | Mean Difference (IV, Fixed, 95% CI) | 3.30 [‐8.75, 15.35] |
| 83.7 NBAS reflexes | 1 | 27 | Mean Difference (IV, Fixed, 95% CI) | 0.68 [‐10.28, 11.64] |
| 83.8 BehavioUr Rating Scale score 12 to < 24 months | 1 | 730 | Mean Difference (IV, Fixed, 95% CI) | 0.0 [‐0.94, 0.94] |
| 83.9 Wolke: approach at < 12 months | 1 | 249 | Mean Difference (IV, Fixed, 95% CI) | ‐0.10 [‐0.42, 0.22] |
| 83.10 Wolke: activity at < 12 months | 1 | 249 | Mean Difference (IV, Fixed, 95% CI) | ‐0.10 [‐0.45, 0.25] |
| 83.11 Wolke: co‐operation at < 12 months | 1 | 249 | Mean Difference (IV, Fixed, 95% CI) | 0.0 [‐0.39, 0.39] |
| 83.12 Wolke: emotional tone at < 12 months | 1 | 249 | Mean Difference (IV, Fixed, 95% CI) | ‐0.10 [‐0.49, 0.29] |
| 83.13 Wolke: vocalisation at < 12 months | 1 | 249 | Mean Difference (IV, Fixed, 95% CI) | ‐0.10 [‐0.52, 0.32] |
| 83.14 BSID III social‐emotional score at < 24 months | 2 | 809 | Mean Difference (IV, Fixed, 95% CI) | ‐0.70 [‐3.04, 1.64] |
| 83.15 BSID III adaptive behaviour score at < 24 months | 2 | 809 | Mean Difference (IV, Fixed, 95% CI) | ‐1.20 [‐3.12, 0.72] |
| 83.16 SDQ Total Difficulties at 2 to 5 years | 1 | 646 | Mean Difference (IV, Fixed, 95% CI) | 0.62 [‐0.00, 1.24] |
| 83.17 SDQ Total Difficulties at 6 to 9 years | 1 | 543 | Mean Difference (IV, Fixed, 95% CI) | 1.08 [0.18, 1.98] |
| 83.18 BASC‐2: Behavioral Symptoms Index (%) at 5 years | 1 | 797 | Mean Difference (IV, Fixed, 95% CI) | ‐0.5 [‐4.54, 3.54] |
| 83.19 CBCL total problem behaviour at 2 ‐ 5 years | 1 | 72 | Mean Difference (IV, Fixed, 95% CI) | ‐1.0 [‐3.41, 1.41] |
| 83.20 CBCL parent report: total behaviours score at 12+ years | 1 | 48 | Mean Difference (IV, Fixed, 95% CI) | ‐0.80 [‐5.23, 3.63] |
| 83.21 CBCL parent report: total competence score at > 12 years | 1 | 48 | Mean Difference (IV, Fixed, 95% CI) | ‐0.20 [‐6.36, 5.96] |
| 84 Vision: visual acuity (cycles/degree) | 2 | Mean Difference (IV, Fixed, 95% CI) | Subtotals only | |
| 84.1 At 2 months | 1 | 135 | Mean Difference (IV, Fixed, 95% CI) | 0.18 [‐0.01, 0.37] |
| 84.2 At 4 months | 1 | 30 | Mean Difference (IV, Fixed, 95% CI) | 0.5 [‐0.43, 1.43] |
| 84.3 At 6 months | 1 | 26 | Mean Difference (IV, Fixed, 95% CI) | 0.5 [‐0.48, 1.48] |
| 85 Vision: VEP acuity | 1 | Mean Difference (IV, Fixed, 95% CI) | Subtotals only | |
| 85.1 Adjusted VEP acuity at 4 months (cpd) | 1 | 182 | Mean Difference (IV, Fixed, 95% CI) | ‐0.18 [‐0.75, 0.39] |
| 85.2 Unadjusted VEP acuity at 4 months (cpd) | 1 | 182 | Mean Difference (IV, Fixed, 95% CI) | ‐0.18 [‐0.76, 0.40] |
| 86 Vision: VEP latency | 3 | Mean Difference (IV, Fixed, 95% CI) | Subtotals only | |
| 86.1 Peak latency N1 at birth | 1 | 9 | Mean Difference (IV, Fixed, 95% CI) | ‐12.60 [‐29.40, 4.20] |
| 86.2 Peak latency P1 at birth | 1 | 14 | Mean Difference (IV, Fixed, 95% CI) | ‐6.80 [‐20.44, 6.84] |
| 86.3 Peak latency N2 at birth | 1 | 49 | Mean Difference (IV, Fixed, 95% CI) | 3.60 [‐12.39, 19.59] |
| 86.4 Peak latency P2 at birth | 1 | 55 | Mean Difference (IV, Fixed, 95% CI) | 0.10 [‐16.28, 16.48] |
| 86.5 Peak latency N3 at birth | 1 | 53 | Mean Difference (IV, Fixed, 95% CI) | ‐6.20 [‐36.15, 23.75] |
| 86.6 Latency N1 (ms) at 3 months | 1 | 679 | Mean Difference (IV, Fixed, 95% CI) | 0.30 [‐2.21, 2.81] |
| 86.7 Latency P1 (ms) at 3 months | 1 | 679 | Mean Difference (IV, Fixed, 95% CI) | ‐0.5 [‐3.19, 2.19] |
| 86.8 Latency N3 (ms) at 3 months | 1 | 679 | Mean Difference (IV, Fixed, 95% CI) | ‐2.30 [‐5.91, 1.31] |
| 86.9 Latency (69 min of arc) at 4 months (ms) | 1 | 182 | Mean Difference (IV, Fixed, 95% CI) | ‐1.0 [‐3.47, 1.47] |
| 86.10 Latency (48 min of arc) at 4 months (ms) | 1 | 182 | Mean Difference (IV, Fixed, 95% CI) | 0.0 [‐3.20, 3.20] |
| 86.11 Latency (20 min of arc) at 4 months (ms) | 1 | 182 | Mean Difference (IV, Fixed, 95% CI) | 0.0 [‐4.22, 4.22] |
| 86.12 Latency N1 (ms) at 6 months | 1 | 817 | Mean Difference (IV, Fixed, 95% CI) | ‐1.40 [‐3.44, 0.64] |
| 86.13 Latency P1 (ms) at 6 months | 1 | 817 | Mean Difference (IV, Fixed, 95% CI) | ‐0.80 [‐2.78, 1.18] |
| 86.14 Latency N3 (ms) at 6 months | 1 | 817 | Mean Difference (IV, Fixed, 95% CI) | ‐0.70 [‐3.45, 2.05] |
| 87 Hearing: brainstem auditory‐evoked responses | 1 | Mean Difference (IV, Fixed, 95% CI) | Subtotals only | |
| 87.1 Latency 1 (ms) at 1 month | 1 | 749 | Mean Difference (IV, Fixed, 95% CI) | ‐0.01 [‐0.03, 0.01] |
| 87.2 Latency 3 (ms) at 1 month | 1 | 749 | Mean Difference (IV, Fixed, 95% CI) | ‐0.01 [‐0.06, 0.04] |
| 87.3 Latency 5 (ms) at 1 month | 1 | 749 | Mean Difference (IV, Fixed, 95% CI) | ‐0.03 [‐0.09, 0.03] |
| 87.4 Interpeak latency 1‐3 (ms) at 1 month | 1 | 749 | Mean Difference (IV, Fixed, 95% CI) | ‐0.01 [‐0.06, 0.04] |
| 87.5 Interpeak latency 3‐5 (ms) at 1 month | 1 | 749 | Mean Difference (IV, Fixed, 95% CI) | 0.0 [‐0.05, 0.05] |
| 87.6 Interpeak latency 1‐5 (ms) at 1 month | 1 | 749 | Mean Difference (IV, Fixed, 95% CI) | ‐0.02 [‐0.07, 0.03] |
| 87.7 Latency 1 (ms) at 3 months | 1 | 664 | Mean Difference (IV, Fixed, 95% CI) | 0.0 [‐0.02, 0.02] |
| 87.8 Latency 3 (ms) at 3 months | 1 | 664 | Mean Difference (IV, Fixed, 95% CI) | 0.01 [‐0.04, 0.06] |
| 87.9 Latency 5 (ms) at 3 months | 1 | 664 | Mean Difference (IV, Fixed, 95% CI) | ‐0.04 [‐0.10, 0.02] |
| 87.10 Interpeak latency 1‐3 (ms) at 3 months | 1 | 664 | Mean Difference (IV, Fixed, 95% CI) | 0.01 [‐0.03, 0.05] |
| 87.11 Interpeak latency 3‐5 (ms) at 3 months | 1 | 664 | Mean Difference (IV, Fixed, 95% CI) | ‐0.03 [‐0.08, 0.02] |
| 87.12 Interpeak latency 1‐5 (ms) at 3 months | 1 | 664 | Mean Difference (IV, Fixed, 95% CI) | ‐0.03 [‐0.09, 0.03] |
| 88 Neurodevelopment: thresholds | 3 | Risk Ratio (M‐H, Fixed, 95% CI) | Subtotals only | |
| 88.1 Hempel: simple minor neurological dysfunction at 18 months | 1 | 114 | Risk Ratio (M‐H, Fixed, 95% CI) | 1.11 [0.80, 1.53] |
| 88.2 Hempel: simple and complex minor neurological dysfunction at 4 years | 1 | 167 | Risk Ratio (M‐H, Fixed, 95% CI) | 1.09 [0.37, 3.23] |
| 88.3 Hempel: complex minor neurological dysfunction at 18 months | 1 | 114 | Risk Ratio (M‐H, Fixed, 95% CI) | 0.68 [0.24, 1.93] |
| 88.4 ASQ total at 6 months (subnormal ‐ below 2 SD less than mean scores) | 1 | 146 | Risk Ratio (M‐H, Fixed, 95% CI) | 0.54 [0.17, 1.77] |
| 88.5 Touwen: simple and complex minor neurological dysfunction at 5.5 years | 1 | 148 | Risk Ratio (M‐H, Fixed, 95% CI) | 1.00 [0.61, 1.63] |
| 88.6 Neonatal neurological classification: mildly/definitely abnormal at 2 weeks | 1 | 119 | Risk Ratio (M‐H, Fixed, 95% CI) | 0.87 [0.38, 1.97] |
| 88.7 General movements: mildly/definitely abnormal at 2 weeks | 1 | 119 | Risk Ratio (M‐H, Fixed, 95% CI) | 1.27 [0.75, 2.14] |
| 88.8 General movements: mildly/definitely abnormal at 12 weeks | 1 | 119 | Risk Ratio (M‐H, Fixed, 95% CI) | 1.54 [0.89, 2.65] |
| 89 Neurodevelopment: scores | 1 | Mean Difference (IV, Fixed, 95% CI) | Subtotals only | |
| 89.1 ASQ gross motor at 4 months | 1 | 148 | Mean Difference (IV, Fixed, 95% CI) | 0.30 [‐2.38, 2.98] |
| 89.2 ASQ gross motor at 6 months | 1 | 146 | Mean Difference (IV, Fixed, 95% CI) | 1.20 [‐2.31, 4.71] |
| 89.3 ASQ fine motor at 4 months | 1 | 148 | Mean Difference (IV, Fixed, 95% CI) | 1.10 [‐2.03, 4.23] |
| 89.4 ASQ fine motor at 6 months | 1 | 146 | Mean Difference (IV, Fixed, 95% CI) | 1.20 [‐1.59, 3.99] |
| 89.5 ASQ problem solving at 4 months | 1 | 148 | Mean Difference (IV, Fixed, 95% CI) | 1.60 [‐0.99, 4.19] |
| 89.6 ASQ problem solving at 6 months | 1 | 146 | Mean Difference (IV, Fixed, 95% CI) | 0.5 [‐1.95, 2.95] |
| 89.7 ASQ personal‐social at 4 months | 1 | 148 | Mean Difference (IV, Fixed, 95% CI) | 1.10 [‐1.64, 3.84] |
| 89.8 ASQ personal‐social at 6 months | 1 | 146 | Mean Difference (IV, Fixed, 95% CI) | 0.80 [‐2.61, 4.21] |
| 89.9 ASQ communication at 4 months | 1 | 148 | Mean Difference (IV, Fixed, 95% CI) | 2.70 [0.41, 4.99] |
| 89.10 ASQ communication at 6 months | 1 | 146 | Mean Difference (IV, Fixed, 95% CI) | 0.40 [‐1.55, 2.35] |
| 90 Child Development Inventory | 1 | Risk Ratio (M‐H, Fixed, 95% CI) | Subtotals only | |
| 90.1 Social | 1 | 130 | Risk Ratio (M‐H, Fixed, 95% CI) | 0.0 [0.0, 0.0] |
| 90.2 Self help | 1 | 130 | Risk Ratio (M‐H, Fixed, 95% CI) | 0.29 [0.01, 6.90] |
| 90.3 Gross motor | 1 | 130 | Risk Ratio (M‐H, Fixed, 95% CI) | 4.30 [0.21, 87.76] |
| 90.4 Fine motor | 1 | 130 | Risk Ratio (M‐H, Fixed, 95% CI) | 4.30 [0.21, 87.76] |
| 90.5 Expressive language | 1 | 130 | Risk Ratio (M‐H, Fixed, 95% CI) | 0.86 [0.05, 13.41] |
| 90.6 Language comprehension | 1 | 130 | Risk Ratio (M‐H, Fixed, 95% CI) | 0.0 [0.0, 0.0] |
| 90.7 Letters | 1 | 130 | Risk Ratio (M‐H, Fixed, 95% CI) | 0.17 [0.01, 3.51] |
| 90.8 Numbers | 1 | 130 | Risk Ratio (M‐H, Fixed, 95% CI) | 0.86 [0.05, 13.41] |
| 90.9 General development | 1 | 130 | Risk Ratio (M‐H, Fixed, 95% CI) | 0.51 [0.13, 2.06] |
| 91 Infant sleep behaviour (%) | 1 | Mean Difference (IV, Fixed, 95% CI) | Subtotals only | |
| 91.1 Arousals in quiet sleep: day 1 | 1 | 46 | Mean Difference (IV, Fixed, 95% CI) | ‐3.19 [‐6.07, ‐0.31] |
| 91.2 Arousals in quiet sleep: day 2 | 1 | 39 | Mean Difference (IV, Fixed, 95% CI) | ‐1.89 [‐4.49, 0.71] |
| 91.3 Quiet sleep: day 1 | 1 | 46 | Mean Difference (IV, Fixed, 95% CI) | 0.74 [‐1.97, 3.45] |
| 91.4 Quiet sleep: day 2 | 1 | 39 | Mean Difference (IV, Fixed, 95% CI) | ‐1.0 [‐4.36, 2.36] |
| 91.5 Active sleep: day 1 | 1 | 46 | Mean Difference (IV, Fixed, 95% CI) | ‐2.42 [‐8.51, 3.67] |
| 91.6 Active sleep: day 2 | 1 | 39 | Mean Difference (IV, Fixed, 95% CI) | ‐0.13 [‐8.23, 7.97] |
| 91.7 Arousals in active sleep: day 1 | 1 | 46 | Mean Difference (IV, Fixed, 95% CI) | ‐3.0 [‐5.66, ‐0.34] |
| 91.8 Arousals in active sleep: day 2 | 1 | 46 | Mean Difference (IV, Fixed, 95% CI) | ‐0.63 [‐4.12, 2.86] |
| 92 Cerebral palsy | 1 | 114 | Risk Ratio (M‐H, Fixed, 95% CI) | 0.0 [0.0, 0.0] |
1.3. Analysis.
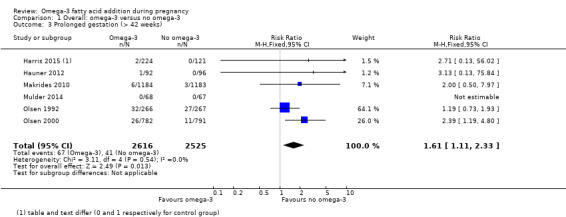
Comparison 1 Overall: omega‐3 versus no omega‐3, Outcome 3 Prolonged gestation (> 42 weeks).
1.86. Analysis.
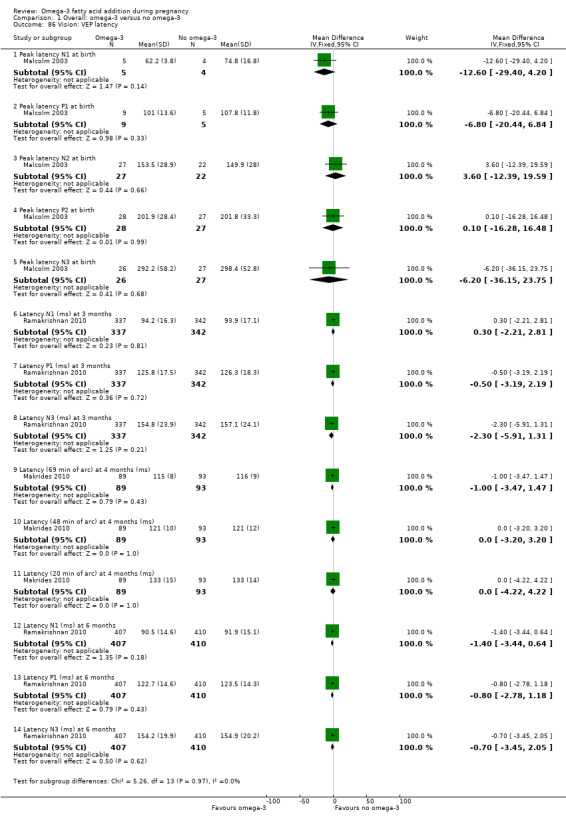
Comparison 1 Overall: omega‐3 versus no omega‐3, Outcome 86 Vision: VEP latency.
Comparison 2. Type of omega‐3 intervention.
| Outcome or subgroup title | No. of studies | No. of participants | Statistical method | Effect size |
|---|---|---|---|---|
| 1 Preterm birth (< 37 weeks) | 27 | 10304 | Risk Ratio (M‐H, Fixed, 95% CI) | 0.88 [0.81, 0.97] |
| 1.1 Omega‐3 supplements only | 18 | 7608 | Risk Ratio (M‐H, Fixed, 95% CI) | 0.90 [0.80, 1.01] |
| 1.2 Omega‐3 supplements/enrichment + food/diet advice | 3 | 516 | Risk Ratio (M‐H, Fixed, 95% CI) | 0.73 [0.41, 1.29] |
| 1.3 Omega‐3 food/diet advice | 1 | 48 | Risk Ratio (M‐H, Fixed, 95% CI) | 0.11 [0.01, 2.22] |
| 1.4 Omega‐3 supplements + other agents | 6 | 2132 | Risk Ratio (M‐H, Fixed, 95% CI) | 0.89 [0.76, 1.04] |
| 2 Early preterm birth (< 34 weeks) | 9 | 5204 | Risk Ratio (M‐H, Fixed, 95% CI) | 0.58 [0.44, 0.77] |
| 2.1 Omega‐3 supplements only | 8 | 4234 | Risk Ratio (M‐H, Fixed, 95% CI) | 0.62 [0.46, 0.82] |
| 2.2 Omega‐3 supplements + other agents | 1 | 970 | Risk Ratio (M‐H, Fixed, 95% CI) | 0.19 [0.04, 0.88] |
| 3 Prolonged gestation (> 42 weeks) | 6 | 5141 | Risk Ratio (M‐H, Fixed, 95% CI) | 1.61 [1.11, 2.33] |
| 3.1 Omega‐3 supplements only | 5 | 4953 | Risk Ratio (M‐H, Fixed, 95% CI) | 1.59 [1.09, 2.31] |
| 3.2 Omega‐3 supplements + food/diet advice | 1 | 188 | Risk Ratio (M‐H, Fixed, 95% CI) | 3.13 [0.13, 75.84] |
| 4 Maternal death | 4 | 4830 | Risk Ratio (M‐H, Fixed, 95% CI) | 1.69 [0.07, 39.30] |
| 4.1 Omega‐3 supplements only | 3 | 4782 | Risk Ratio (M‐H, Fixed, 95% CI) | 0.0 [0.0, 0.0] |
| 4.2 Omega‐3 food/diet advice | 1 | 48 | Risk Ratio (M‐H, Fixed, 95% CI) | 1.69 [0.07, 39.30] |
| 5 Pre‐eclampsia (hypertension with proteinuria) | 21 | 8306 | Risk Ratio (M‐H, Fixed, 95% CI) | 0.84 [0.69, 1.01] |
| 5.1 Omega‐3 supplements only | 13 | 5825 | Risk Ratio (M‐H, Fixed, 95% CI) | 0.95 [0.76, 1.19] |
| 5.2 Omega‐3 supplements/enrichment + food/dietary advice | 2 | 328 | Risk Ratio (M‐H, Fixed, 95% CI) | 0.65 [0.25, 1.69] |
| 5.3 Omega‐3 supplements + other agents | 6 | 2153 | Risk Ratio (M‐H, Fixed, 95% CI) | 0.58 [0.39, 0.88] |
| 6 High blood pressure (without proteinuria) | 7 | 4531 | Risk Ratio (M‐H, Fixed, 95% CI) | 1.03 [0.89, 1.20] |
| 6.1 Omega‐3 supplements only | 6 | 4431 | Risk Ratio (M‐H, Fixed, 95% CI) | 1.05 [0.90, 1.22] |
| 6.2 Omega‐3 supplements + other agents | 1 | 100 | Risk Ratio (M‐H, Fixed, 95% CI) | 0.69 [0.33, 1.47] |
| 7 Eclampsia | 1 | 100 | Risk Ratio (M‐H, Fixed, 95% CI) | 0.14 [0.01, 2.70] |
| 7.1 Omega‐3 supplements + other agents | 1 | 100 | Risk Ratio (M‐H, Fixed, 95% CI) | 0.14 [0.01, 2.70] |
| 8 Maternal antepartum hospitalisation | 5 | 2876 | Risk Ratio (M‐H, Fixed, 95% CI) | 0.92 [0.81, 1.04] |
| 8.1 Omega‐3 supplements only | 4 | 2817 | Risk Ratio (M‐H, Fixed, 95% CI) | 0.92 [0.82, 1.04] |
| 8.2 Omega‐3 supplementation + other agents | 1 | 59 | Risk Ratio (M‐H, Fixed, 95% CI) | 0.21 [0.01, 4.13] |
| 9 Mother's length of stay in hospital (days) | 2 | 2290 | Mean Difference (IV, Fixed, 95% CI) | 0.18 [‐0.20, 0.57] |
| 9.1 Omega‐3 supplements only | 2 | 2290 | Mean Difference (IV, Fixed, 95% CI) | 0.18 [‐0.20, 0.57] |
| 10 Maternal anaemia | 1 | 846 | Risk Ratio (M‐H, Fixed, 95% CI) | 1.16 [0.91, 1.48] |
| 10.1 Omega‐3 supplements only | 1 | 846 | Risk Ratio (M‐H, Fixed, 95% CI) | 1.16 [0.91, 1.48] |
| 11 Miscarriage (< 24 weeks) | 9 | 4190 | Risk Ratio (M‐H, Fixed, 95% CI) | 1.07 [0.80, 1.43] |
| 11.1 Omega‐3 supplements only | 8 | 3049 | Risk Ratio (M‐H, Fixed, 95% CI) | 0.95 [0.56, 1.60] |
| 11.2 Omega‐3 supplements + other agents | 1 | 1141 | Risk Ratio (M‐H, Fixed, 95% CI) | 1.14 [0.80, 1.61] |
| 12 Antepartum vaginal bleeding | 2 | 2151 | Risk Ratio (M‐H, Fixed, 95% CI) | 1.01 [0.69, 1.48] |
| 12.1 Omega‐3 supplements only | 2 | 2151 | Risk Ratio (M‐H, Fixed, 95% CI) | 1.01 [0.69, 1.48] |
| 13 Preterm prelabour rupture of membranes | 3 | 925 | Risk Ratio (M‐H, Fixed, 95% CI) | 0.53 [0.25, 1.10] |
| 13.1 Omega‐3 supplements only | 2 | 670 | Risk Ratio (M‐H, Fixed, 95% CI) | 0.61 [0.28, 1.34] |
| 13.2 Omega‐3 supplementation/enrichment + food/diet advice | 1 | 255 | Risk Ratio (M‐H, Fixed, 95% CI) | 0.24 [0.03, 2.15] |
| 14 Prelabour rupture of membranes | 3 | 915 | Risk Ratio (M‐H, Fixed, 95% CI) | 0.41 [0.21, 0.82] |
| 14.1 Omega‐3 supplements only | 1 | 369 | Risk Ratio (M‐H, Fixed, 95% CI) | 0.54 [0.14, 2.11] |
| 14.2 Omega‐3 supplementation/enrichment + food/diet advice | 2 | 546 | Risk Ratio (M‐H, Fixed, 95% CI) | 0.38 [0.17, 0.85] |
| 15 Maternal admission to intensive care | 2 | 2458 | Risk Ratio (M‐H, Fixed, 95% CI) | 0.56 [0.12, 2.63] |
| 15.1 Omega‐3 supplements only | 1 | 2399 | Risk Ratio (M‐H, Fixed, 95% CI) | 1.00 [0.14, 7.12] |
| 15.2 Omega‐3 supplements + other agent | 1 | 59 | Risk Ratio (M‐H, Fixed, 95% CI) | 0.21 [0.01, 4.13] |
| 16 Maternal severe adverse effects (including cessation) | 8 | 4177 | Risk Ratio (M‐H, Fixed, 95% CI) | 1.02 [0.59, 1.75] |
| 16.1 Omega‐3 supplements only | 7 | 3886 | Risk Ratio (M‐H, Fixed, 95% CI) | 1.01 [0.54, 1.87] |
| 16.2 Omega‐3 supplementation/enrichment + food/diet advice | 1 | 291 | Risk Ratio (M‐H, Fixed, 95% CI) | 1.05 [0.35, 3.18] |
| 17 Caesarean section | 29 | 8481 | Risk Ratio (M‐H, Fixed, 95% CI) | 0.97 [0.91, 1.03] |
| 17.1 Omega‐3 supplements only | 19 | 6537 | Risk Ratio (M‐H, Fixed, 95% CI) | 0.98 [0.92, 1.06] |
| 17.2 Omega‐3 supplements/enrichment +food/diet advice | 4 | 574 | Risk Ratio (M‐H, Fixed, 95% CI) | 0.87 [0.63, 1.19] |
| 17.3 Omega‐3 food/diet advice | 1 | 107 | Risk Ratio (M‐H, Fixed, 95% CI) | 0.91 [0.38, 2.17] |
| 17.4 Omega‐3 supplements + other agents | 5 | 1263 | Risk Ratio (M‐H, Fixed, 95% CI) | 0.88 [0.72, 1.08] |
| 18 Induction (post‐term) | 3 | 2900 | Risk Ratio (M‐H, Random, 95% CI) | 0.82 [0.22, 2.98] |
| 18.1 Omega‐3 supplements only | 2 | 2712 | Risk Ratio (M‐H, Random, 95% CI) | 0.82 [0.22, 2.98] |
| 18.2 Omega‐3 supplements + food/diet advice | 1 | 188 | Risk Ratio (M‐H, Random, 95% CI) | 0.0 [0.0, 0.0] |
| 19 Blood loss at birth (mL) | 6 | 2776 | Mean Difference (IV, Fixed, 95% CI) | 11.50 [‐6.75, 29.76] |
| 19.1 Omega‐3 supplements only | 5 | 2588 | Mean Difference (IV, Fixed, 95% CI) | 11.64 [‐8.89, 32.17] |
| 19.2 Omega‐3 supplements + food/diet advice | 1 | 188 | Mean Difference (IV, Fixed, 95% CI) | 11.0 [‐28.91, 50.91] |
| 20 Postpartum haemorrhage | 4 | 4085 | Risk Ratio (M‐H, Fixed, 95% CI) | 1.03 [0.82, 1.30] |
| 20.1 Omega‐3 supplements only | 3 | 3233 | Risk Ratio (M‐H, Fixed, 95% CI) | 0.97 [0.71, 1.34] |
| 20.2 Omega‐3 supplements + other agent | 1 | 852 | Risk Ratio (M‐H, Fixed, 95% CI) | 1.11 [0.79, 1.57] |
| 21 Gestational diabetes | 12 | 5235 | Risk Ratio (M‐H, Fixed, 95% CI) | 1.02 [0.83, 1.26] |
| 21.1 Omega‐3 supplements only | 7 | 3726 | Risk Ratio (M‐H, Fixed, 95% CI) | 1.02 [0.80, 1.30] |
| 21.2 Omega‐3 supplements/enrichment + food/diet advice | 4 | 595 | Risk Ratio (M‐H, Fixed, 95% CI) | 0.66 [0.33, 1.34] |
| 21.3 Omega‐3 supplements + other agents | 2 | 914 | Risk Ratio (M‐H, Fixed, 95% CI) | 1.34 [0.80, 2.24] |
| 22 Maternal insulin resistance (HOMA‐IR) | 3 | 176 | Mean Difference (IV, Random, 95% CI) | ‐0.85 [‐2.50, 0.80] |
| 22.1 Omega‐3 supplements only | 2 | 116 | Mean Difference (IV, Random, 95% CI) | ‐0.25 [‐1.94, 1.44] |
| 22.2 Omega‐3 supplements + other agents | 1 | 60 | Mean Difference (IV, Random, 95% CI) | ‐2.0 [‐3.10, ‐0.90] |
| 23 Excessive gestational weight gain | 1 | 350 | Risk Ratio (M‐H, Fixed, 95% CI) | 1.21 [0.95, 1.55] |
| 23.1 Omega‐3 supplements only | 1 | 350 | Risk Ratio (M‐H, Fixed, 95% CI) | 1.21 [0.95, 1.55] |
| 24 Gestational weight gain (kg) | 11 | 2297 | Mean Difference (IV, Random, 95% CI) | ‐0.05 [‐0.68, 0.59] |
| 24.1 Omega‐3 supplements only | 6 | 955 | Mean Difference (IV, Random, 95% CI) | ‐0.22 [‐1.47, 1.03] |
| 24.2 Omega‐3 supplements/enrichment + food/diet advice | 3 | 313 | Mean Difference (IV, Random, 95% CI) | ‐0.11 [‐0.99, 0.78] |
| 24.3 Omega‐3 supplements + other agents | 2 | 1029 | Mean Difference (IV, Random, 95% CI) | 0.43 [‐0.08, 0.95] |
| 25 Depression during pregnancy: scores | 5 | Mean Difference (IV, Fixed, 95% CI) | Subtotals only | |
| 25.1 Omega‐3 supplements only: BDI | 2 | 104 | Mean Difference (IV, Fixed, 95% CI) | ‐5.86 [‐8.32, ‐3.39] |
| 25.2 Omega‐3 supplements only: HAMD | 3 | 71 | Mean Difference (IV, Fixed, 95% CI) | ‐1.08 [‐3.35, 1.19] |
| 25.3 Omega‐3 supplements only: EPDS | 4 | 122 | Mean Difference (IV, Fixed, 95% CI) | ‐0.15 [‐2.09, 1.79] |
| 25.4 Omega‐3 supplements only: MADRS | 1 | 26 | Mean Difference (IV, Fixed, 95% CI) | ‐1.60 [‐7.80, 4.60] |
| 26 Depression during pregnancy: thresholds | 3 | Risk Ratio (M‐H, Fixed, 95% CI) | Subtotals only | |
| 26.1 Omega‐3 supplements only: HAMD 50% reduction (after 8 weeks) | 1 | 24 | Risk Ratio (M‐H, Fixed, 95% CI) | 2.26 [0.78, 6.49] |
| 26.2 Omega‐3 supplements only: HAMD ≤ 7 | 1 | 24 | Risk Ratio (M‐H, Fixed, 95% CI) | 2.12 [0.51, 8.84] |
| 26.3 Omega‐3 supplements only: unspecified | 1 | 301 | Risk Ratio (M‐H, Fixed, 95% CI) | 2.39 [0.47, 12.11] |
| 26.4 Omega‐3 supplements only: EPDS ≥ 11 | 1 | 34 | Risk Ratio (M‐H, Fixed, 95% CI) | 1.4 [0.55, 3.55] |
| 27 Depressive symptoms postpartum: thresholds | 4 | Risk Ratio (M‐H, Fixed, 95% CI) | Subtotals only | |
| 27.1 Omega‐3 supplements only: PDSS ≥80 | 1 | 42 | Risk Ratio (M‐H, Fixed, 95% CI) | 0.37 [0.04, 3.25] |
| 27.2 Omega‐3 supplements only: EPDS | 2 | 2431 | Risk Ratio (M‐H, Fixed, 95% CI) | 0.89 [0.71, 1.12] |
| 27.3 Omega‐3 supplements only: major depressive disorder | 1 | 118 | Risk Ratio (M‐H, Fixed, 95% CI) | 1.33 [0.27, 6.56] |
| 28 Depressive symptoms postpartum: scores | 2 | Mean Difference (IV, Fixed, 95% CI) | Subtotals only | |
| 28.1 Omega‐3 supplements only: BD: 6‐8 weeks postpartum | 1 | 118 | Mean Difference (IV, Fixed, 95% CI) | 0.25 [‐1.93, 2.43] |
| 28.2 Omega‐3 supplements only: PDSS total (LS over 6 months) | 1 | 42 | Mean Difference (IV, Fixed, 95% CI) | ‐6.08 [‐12.42, 0.26] |
| 29 Length of gestation (days) | 43 | 12517 | Mean Difference (IV, Random, 95% CI) | 1.65 [0.94, 2.37] |
| 29.1 Omega‐3 supplements only | 29 | 9290 | Mean Difference (IV, Random, 95% CI) | 1.67 [0.76, 2.59] |
| 29.2 Omega‐3 supplements/enrichment + food/diet advice | 6 | 680 | Mean Difference (IV, Random, 95% CI) | 2.45 [‐0.14, 5.04] |
| 29.3 Omega‐3 food/diet advice | 1 | 107 | Mean Difference (IV, Random, 95% CI) | 5.00 [0.64, 9.36] |
| 29.4 Omega‐3 supplements + other agents | 8 | 2440 | Mean Difference (IV, Random, 95% CI) | 1.04 [0.05, 2.03] |
| 30 Perinatal death | 10 | 7416 | Risk Ratio (M‐H, Fixed, 95% CI) | 0.75 [0.54, 1.03] |
| 30.1 Omega‐3 supplements only | 8 | 6496 | Risk Ratio (M‐H, Fixed, 95% CI) | 0.71 [0.48, 1.03] |
| 30.2 Omega‐3 supplements + other agents | 2 | 920 | Risk Ratio (M‐H, Fixed, 95% CI) | 0.87 [0.47, 1.62] |
| 31 Stillbirth | 16 | 7880 | Risk Ratio (M‐H, Fixed, 95% CI) | 0.94 [0.62, 1.42] |
| 31.1 Omega‐3 supplements only | 13 | 7693 | Risk Ratio (M‐H, Fixed, 95% CI) | 0.92 [0.60, 1.42] |
| 31.2 Omega‐3 supplements + food/diet advice | 1 | 79 | Risk Ratio (M‐H, Fixed, 95% CI) | 0.33 [0.01, 7.75] |
| 31.3 Omega‐3 food/diet advice | 1 | 48 | Risk Ratio (M‐H, Fixed, 95% CI) | 1.69 [0.07, 39.30] |
| 31.4 Omega‐3 supplements + other agents | 1 | 60 | Risk Ratio (M‐H, Fixed, 95% CI) | 3.0 [0.13, 70.83] |
| 32 Neonatal death | 9 | 7448 | Risk Ratio (M‐H, Fixed, 95% CI) | 0.61 [0.34, 1.11] |
| 32.1 Omega‐3 supplements only | 9 | 7448 | Risk Ratio (M‐H, Fixed, 95% CI) | 0.61 [0.34, 1.11] |
| 33 Infant death | 4 | 3239 | Risk Ratio (M‐H, Fixed, 95% CI) | 0.74 [0.25, 2.19] |
| 33.1 Omega‐3 supplements only | 4 | 3239 | Risk Ratio (M‐H, Fixed, 95% CI) | 0.74 [0.25, 2.19] |
| 34 Large‐for‐gestational age | 5 | 3602 | Risk Ratio (M‐H, Fixed, 95% CI) | 1.20 [1.01, 1.43] |
| 34.1 Omega‐3 supplements only | 2 | 2518 | Risk Ratio (M‐H, Fixed, 95% CI) | 1.19 [0.99, 1.43] |
| 34.2 Omega‐3 supplements + food/diet advice | 1 | 188 | Risk Ratio (M‐H, Fixed, 95% CI) | 1.23 [0.48, 3.17] |
| 34.3 Omega‐3 supplements + other agent | 2 | 896 | Risk Ratio (M‐H, Fixed, 95% CI) | 1.28 [0.72, 2.29] |
| 35 Macrosomia | 7 | 2008 | Risk Ratio (M‐H, Fixed, 95% CI) | 0.69 [0.43, 1.13] |
| 35.1 Omega‐3 supplements only | 5 | 1904 | Risk Ratio (M‐H, Fixed, 95% CI) | 0.80 [0.47, 1.36] |
| 35.2 Omega‐3 supplements + other agent | 2 | 104 | Risk Ratio (M‐H, Fixed, 95% CI) | 0.31 [0.08, 1.23] |
| 36 Low birthweight (< 2500 g) | 15 | 8449 | Risk Ratio (M‐H, Fixed, 95% CI) | 0.90 [0.82, 0.99] |
| 36.1 Omega‐3 supplements only | 10 | 6214 | Risk Ratio (M‐H, Fixed, 95% CI) | 0.96 [0.86, 1.07] |
| 36.2 Omega‐3 supplements/enrichment + food/diet advice | 2 | 328 | Risk Ratio (M‐H, Fixed, 95% CI) | 0.66 [0.34, 1.26] |
| 36.3 Omega‐3 supplements + other agents | 3 | 1907 | Risk Ratio (M‐H, Fixed, 95% CI) | 0.77 [0.62, 0.95] |
| 37 Small‐for‐gestational age/IUGR | 8 | 6907 | Risk Ratio (M‐H, Fixed, 95% CI) | 1.01 [0.90, 1.13] |
| 37.1 Omega‐3 supplements only | 5 | 5041 | Risk Ratio (M‐H, Fixed, 95% CI) | 1.05 [0.93, 1.20] |
| 37.2 Omega‐3 supplements + other agents | 3 | 1866 | Risk Ratio (M‐H, Fixed, 95% CI) | 0.80 [0.59, 1.09] |
| 38 Birthweight (g) | 44 | 11584 | Mean Difference (IV, Random, 95% CI) | 75.74 [38.05, 113.43] |
| 38.1 Omega‐3 supplements only | 31 | 8522 | Mean Difference (IV, Random, 95% CI) | 59.41 [23.23, 95.59] |
| 38.2 Omega‐3 supplements/enrichment + food/diet advice | 6 | 859 | Mean Difference (IV, Random, 95% CI) | 129.42 [49.52, 209.31] |
| 38.3 Omega‐3 food/diet advice | 1 | 107 | Mean Difference (IV, Random, 95% CI) | ‐17.0 [‐190.97, 156.97] |
| 38.4 Omega‐3 supplements + other agents | 6 | 2096 | Mean Difference (IV, Random, 95% CI) | 69.14 [‐72.81, 211.10] |
| 39 Birthweight Z score | 4 | 2792 | Mean Difference (IV, Fixed, 95% CI) | 0.06 [‐0.02, 0.13] |
| 39.1 Omega‐3 supplements only | 3 | 2677 | Mean Difference (IV, Fixed, 95% CI) | 0.06 [‐0.01, 0.14] |
| 39.2 Omega‐3 supplements + other agent | 1 | 115 | Mean Difference (IV, Fixed, 95% CI) | 0.00 [‐0.21, 0.21] |
| 40 Birth length (cm) | 29 | 8008 | Mean Difference (IV, Random, 95% CI) | 0.13 [‐0.08, 0.34] |
| 40.1 Omega‐3 supplements only | 20 | 6010 | Mean Difference (IV, Random, 95% CI) | 0.21 [‐0.03, 0.45] |
| 40.2 Omega‐3 supplements/enrichment + food/diet advice | 4 | 606 | Mean Difference (IV, Random, 95% CI) | 0.42 [‐0.01, 0.85] |
| 40.3 Omega‐3 food/diet advice | 1 | 123 | Mean Difference (IV, Random, 95% CI) | ‐0.10 [‐0.56, 0.36] |
| 40.4 Omega‐3 supplements + other agent | 4 | 1269 | Mean Difference (IV, Random, 95% CI) | ‐0.51 [‐0.78, ‐0.23] |
| 41 Length at birth Z score | 2 | 2462 | Mean Difference (IV, Random, 95% CI) | 0.18 [‐0.18, 0.54] |
| 41.1 Omega‐3 supplements only | 2 | 2462 | Mean Difference (IV, Random, 95% CI) | 0.18 [‐0.18, 0.54] |
| 42 Head circumference at birth (cm) | 23 | 7041 | Mean Difference (IV, Fixed, 95% CI) | 0.10 [0.01, 0.18] |
| 42.1 Omega‐3 supplements only | 16 | 5442 | Mean Difference (IV, Fixed, 95% CI) | 0.07 [‐0.03, 0.17] |
| 42.2 Omega‐3 supplements/enrichment + food/diet advice | 3 | 418 | Mean Difference (IV, Fixed, 95% CI) | 0.34 [0.03, 0.65] |
| 42.3 Omega‐3 food/diet advice only | 1 | 107 | Mean Difference (IV, Fixed, 95% CI) | ‐0.20 [‐0.75, 0.35] |
| 42.4 Omega‐3 supplements + other agent | 3 | 1074 | Mean Difference (IV, Fixed, 95% CI) | 0.15 [‐0.06, 0.35] |
| 43 Head circumference at birth Z score | 2 | 2462 | Mean Difference (IV, Fixed, 95% CI) | ‐0.03 [‐0.14, 0.07] |
| 43.1 Omega‐3 supplementation only | 2 | 2462 | Mean Difference (IV, Fixed, 95% CI) | ‐0.03 [‐0.14, 0.07] |
| 44 Baby admitted to neonatal care | 9 | 6920 | Risk Ratio (M‐H, Fixed, 95% CI) | 0.92 [0.83, 1.03] |
| 44.1 Omega‐3 supplements only | 5 | 5692 | Risk Ratio (M‐H, Fixed, 95% CI) | 0.90 [0.79, 1.02] |
| 44.2 Omega‐3 supplements/enrichment + food/diet advice | 2 | 328 | Risk Ratio (M‐H, Fixed, 95% CI) | 0.89 [0.54, 1.50] |
| 44.3 Omega‐3 supplements + other agents | 2 | 900 | Risk Ratio (M‐H, Fixed, 95% CI) | 1.01 [0.81, 1.26] |
| 45 Infant length of stay in hospital (days) | 1 | 2041 | Mean Difference (IV, Fixed, 95% CI) | 0.11 [‐1.40, 1.62] |
| 45.1 Omega‐3 supplementation only | 1 | 2041 | Mean Difference (IV, Fixed, 95% CI) | 0.11 [‐1.40, 1.62] |
| 46 Congenital anomalies | 3 | 1807 | Risk Ratio (M‐H, Fixed, 95% CI) | 1.08 [0.61, 1.92] |
| 46.1 Omega‐3 supplements only | 3 | 1807 | Risk Ratio (M‐H, Fixed, 95% CI) | 1.08 [0.61, 1.92] |
| 47 Retinopathy of prematurity | 1 | 837 | Risk Ratio (M‐H, Fixed, 95% CI) | 1.20 [0.32, 4.44] |
| 47.1 Omega‐3 supplementation + other agent only | 1 | 837 | Risk Ratio (M‐H, Fixed, 95% CI) | 1.20 [0.32, 4.44] |
| 48 Bronchopulmonary dysplasia | 2 | 3191 | Risk Ratio (M‐H, Fixed, 95% CI) | 1.06 [0.45, 2.48] |
| 48.1 Omega‐3 supplementation only | 1 | 2363 | Risk Ratio (M‐H, Fixed, 95% CI) | 0.50 [0.09, 2.71] |
| 48.2 Omega‐3 supplementation + other agent | 1 | 828 | Risk Ratio (M‐H, Fixed, 95% CI) | 1.42 [0.51, 3.96] |
| 49 Respiratory distress syndrome | 2 | 1129 | Risk Ratio (M‐H, Random, 95% CI) | 1.17 [0.54, 2.52] |
| 49.1 Omega‐3 supplementation only | 1 | 301 | Risk Ratio (M‐H, Random, 95% CI) | 0.72 [0.31, 1.65] |
| 49.2 Omega‐3 supplementation + other agent | 1 | 828 | Risk Ratio (M‐H, Random, 95% CI) | 1.60 [1.08, 2.37] |
| 50 Necrotising enterocolitis (NEC) | 2 | 3198 | Risk Ratio (M‐H, Fixed, 95% CI) | 0.97 [0.26, 3.55] |
| 50.1 Omega‐3 supplementation only | 1 | 2361 | Risk Ratio (M‐H, Fixed, 95% CI) | 2.98 [0.12, 73.13] |
| 50.2 Omega‐3 supplementation + other agent | 1 | 837 | Risk Ratio (M‐H, Fixed, 95% CI) | 0.72 [0.16, 3.20] |
| 51 Neonatal sepsis (proven) | 3 | 3788 | Risk Ratio (M‐H, Fixed, 95% CI) | 0.97 [0.44, 2.14] |
| 51.1 Omega‐3 supplements only | 3 | 3788 | Risk Ratio (M‐H, Fixed, 95% CI) | 0.97 [0.44, 2.14] |
| 52 Convulsion | 1 | 2361 | Risk Ratio (M‐H, Fixed, 95% CI) | 0.09 [0.01, 1.63] |
| 52.1 Omega‐3 supplementation only | 1 | 2361 | Risk Ratio (M‐H, Fixed, 95% CI) | 0.09 [0.01, 1.63] |
| 53 Intraventricular haemorrhage | 3 | 5423 | Risk Ratio (M‐H, Random, 95% CI) | 1.00 [0.29, 3.49] |
| 53.1 Omega‐3 supplements only | 2 | 4586 | Risk Ratio (M‐H, Random, 95% CI) | 0.59 [0.02, 16.16] |
| 53.2 Omega‐3 supplementation + other agent | 1 | 837 | Risk Ratio (M‐H, Random, 95% CI) | 1.07 [0.44, 2.60] |
| 54 Neonatal/infant serious adverse events | 2 | 2690 | Risk Ratio (M‐H, Fixed, 95% CI) | 0.72 [0.53, 0.99] |
| 54.1 Omega‐3 supplementation | 1 | 2399 | Risk Ratio (M‐H, Fixed, 95% CI) | 0.67 [0.44, 1.01] |
| 54.2 Omega‐3 supplements/enrichment + food/diet advice | 1 | 291 | Risk Ratio (M‐H, Fixed, 95% CI) | 0.81 [0.50, 1.31] |
| 55 Neonatal/infant morbidity: cardiovascular | 1 | 291 | Risk Ratio (M‐H, Fixed, 95% CI) | 1.20 [0.85, 1.69] |
| 55.1 Omega‐3 supplements/enrichment + food/diet advice | 1 | 291 | Risk Ratio (M‐H, Fixed, 95% CI) | 1.20 [0.85, 1.69] |
| 56 Neonatal/infant morbidity: respiratory | 1 | 291 | Risk Ratio (M‐H, Fixed, 95% CI) | 1.02 [0.66, 1.57] |
| 56.1 Omega‐3 supplements/enrichment + food/diet advice | 1 | 291 | Risk Ratio (M‐H, Fixed, 95% CI) | 1.02 [0.66, 1.57] |
| 57 Neonatal/infant morbidity: caused by pregnancy/birth | 1 | 291 | Risk Ratio (M‐H, Fixed, 95% CI) | 1.02 [0.67, 1.55] |
| 57.1 Omega‐3 supplements/enrichment + food/diet advice | 1 | 291 | Risk Ratio (M‐H, Fixed, 95% CI) | 1.02 [0.67, 1.55] |
| 58 Ponderal index | 6 | 887 | Mean Difference (IV, Random, 95% CI) | 0.05 [‐0.01, 0.11] |
| 58.1 Omega‐3 supplements only | 5 | 699 | Mean Difference (IV, Random, 95% CI) | 0.04 [‐0.04, 0.11] |
| 58.2 Omega‐3 supplements + food/diet advice | 1 | 188 | Mean Difference (IV, Random, 95% CI) | 0.08 [0.01, 0.15] |
2.1. Analysis.
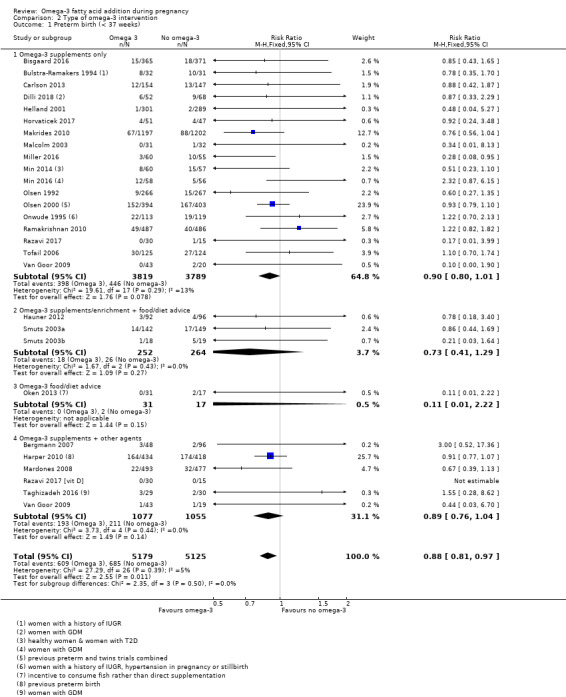
Comparison 2 Type of omega‐3 intervention, Outcome 1 Preterm birth (< 37 weeks).
2.2. Analysis.
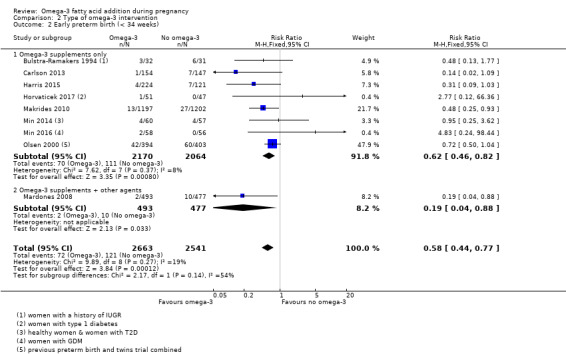
Comparison 2 Type of omega‐3 intervention, Outcome 2 Early preterm birth (< 34 weeks).
2.3. Analysis.
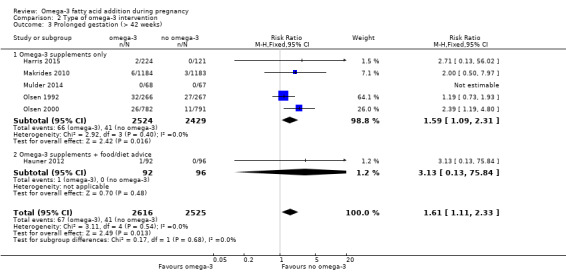
Comparison 2 Type of omega‐3 intervention, Outcome 3 Prolonged gestation (> 42 weeks).
2.4. Analysis.
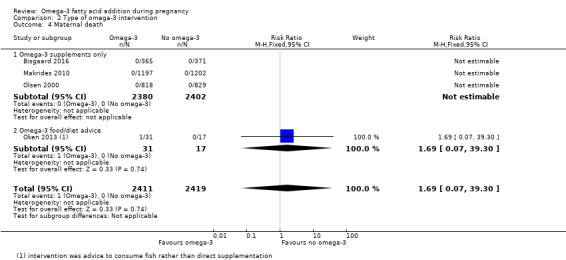
Comparison 2 Type of omega‐3 intervention, Outcome 4 Maternal death.
2.5. Analysis.
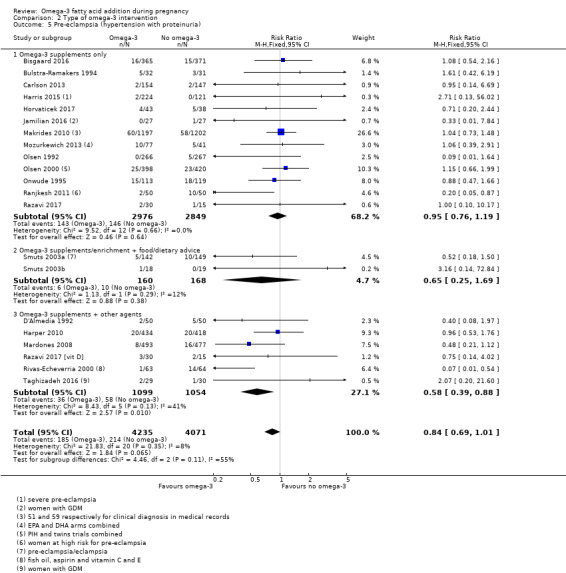
Comparison 2 Type of omega‐3 intervention, Outcome 5 Pre‐eclampsia (hypertension with proteinuria).
2.6. Analysis.
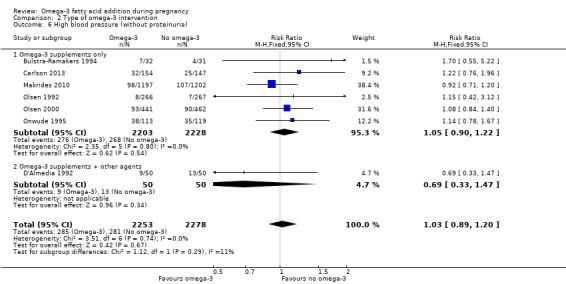
Comparison 2 Type of omega‐3 intervention, Outcome 6 High blood pressure (without proteinuria).
2.7. Analysis.
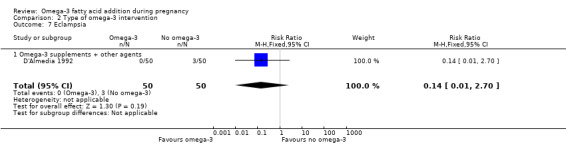
Comparison 2 Type of omega‐3 intervention, Outcome 7 Eclampsia.
2.8. Analysis.
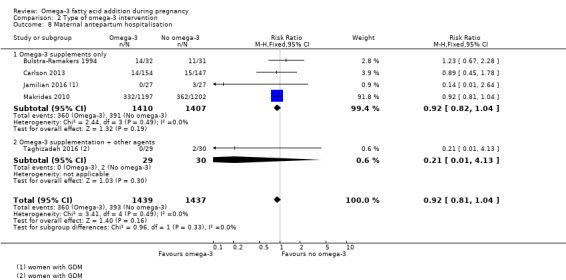
Comparison 2 Type of omega‐3 intervention, Outcome 8 Maternal antepartum hospitalisation.
2.9. Analysis.
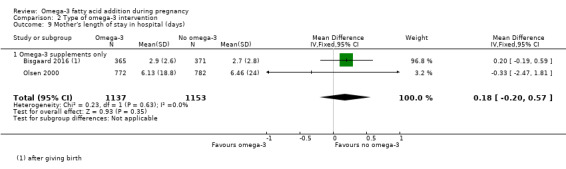
Comparison 2 Type of omega‐3 intervention, Outcome 9 Mother's length of stay in hospital (days).
2.10. Analysis.
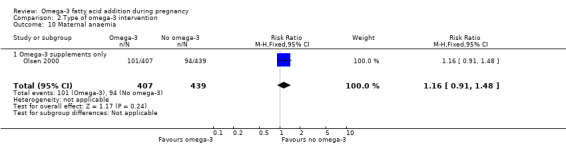
Comparison 2 Type of omega‐3 intervention, Outcome 10 Maternal anaemia.
2.11. Analysis.
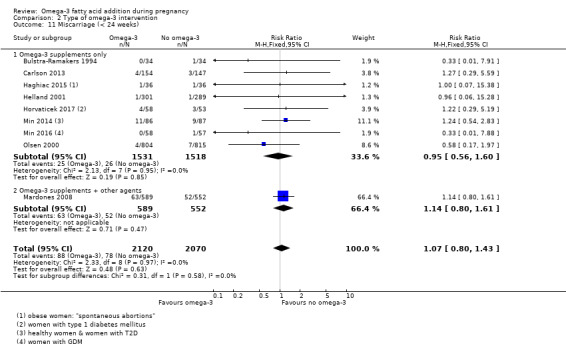
Comparison 2 Type of omega‐3 intervention, Outcome 11 Miscarriage (< 24 weeks).
2.12. Analysis.
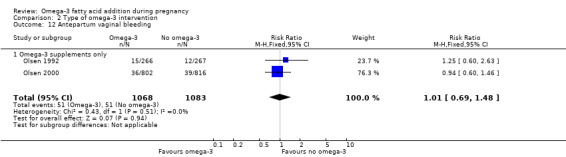
Comparison 2 Type of omega‐3 intervention, Outcome 12 Antepartum vaginal bleeding.
2.13. Analysis.
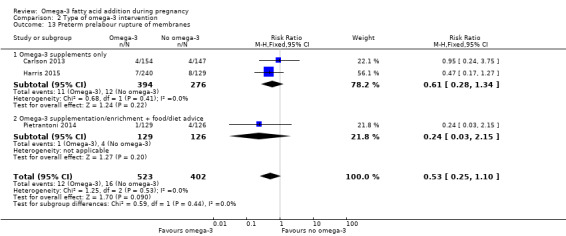
Comparison 2 Type of omega‐3 intervention, Outcome 13 Preterm prelabour rupture of membranes.
2.14. Analysis.
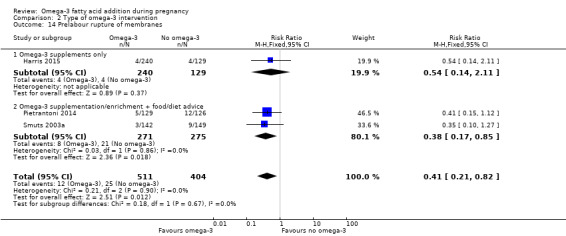
Comparison 2 Type of omega‐3 intervention, Outcome 14 Prelabour rupture of membranes.
2.15. Analysis.
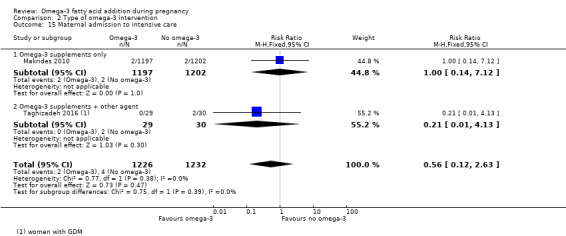
Comparison 2 Type of omega‐3 intervention, Outcome 15 Maternal admission to intensive care.
2.16. Analysis.
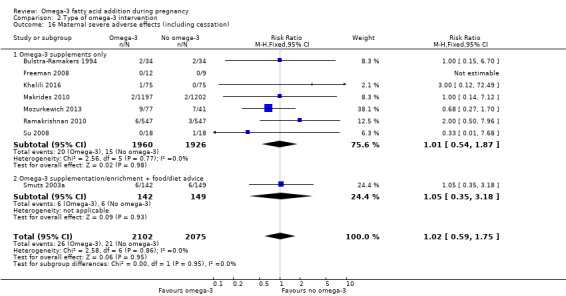
Comparison 2 Type of omega‐3 intervention, Outcome 16 Maternal severe adverse effects (including cessation).
2.17. Analysis.
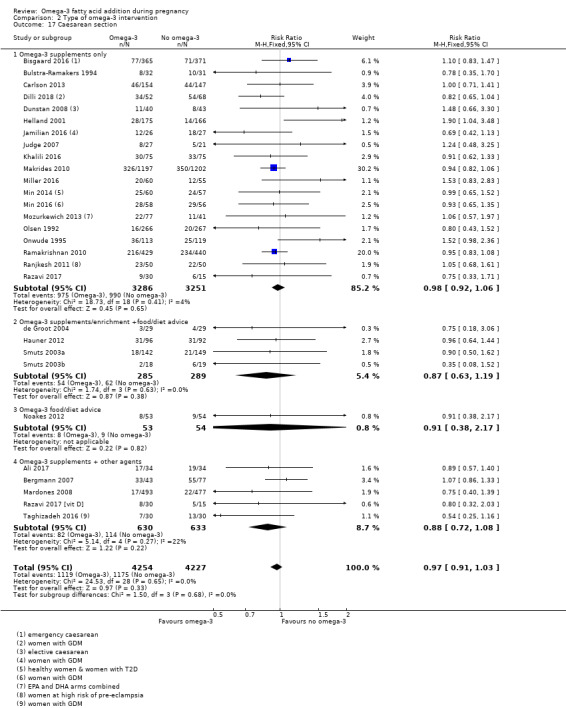
Comparison 2 Type of omega‐3 intervention, Outcome 17 Caesarean section.
2.18. Analysis.
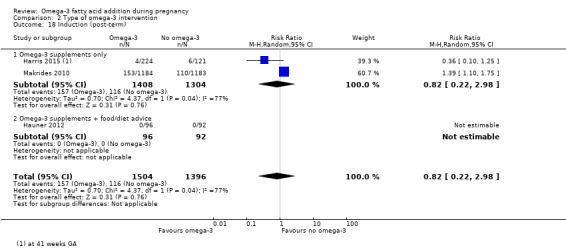
Comparison 2 Type of omega‐3 intervention, Outcome 18 Induction (post‐term).
2.19. Analysis.
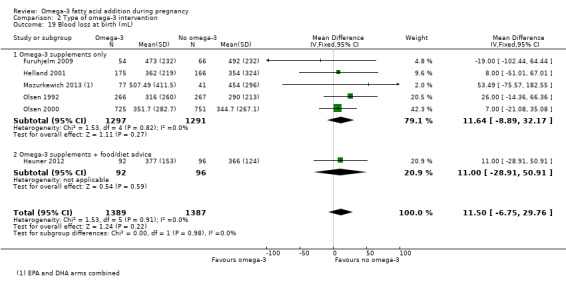
Comparison 2 Type of omega‐3 intervention, Outcome 19 Blood loss at birth (mL).
2.20. Analysis.
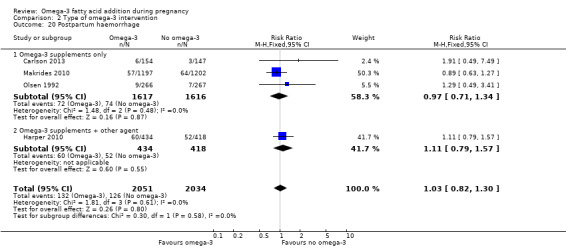
Comparison 2 Type of omega‐3 intervention, Outcome 20 Postpartum haemorrhage.
2.21. Analysis.
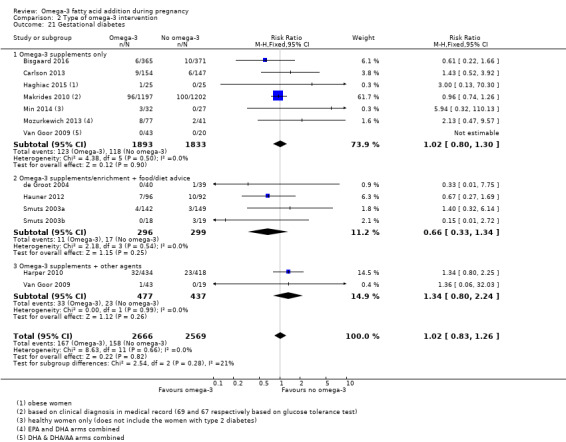
Comparison 2 Type of omega‐3 intervention, Outcome 21 Gestational diabetes.
2.22. Analysis.
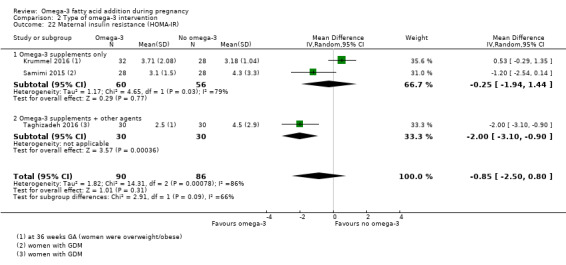
Comparison 2 Type of omega‐3 intervention, Outcome 22 Maternal insulin resistance (HOMA‐IR).
2.23. Analysis.
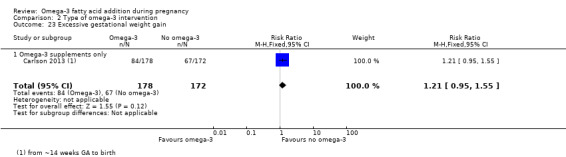
Comparison 2 Type of omega‐3 intervention, Outcome 23 Excessive gestational weight gain.
2.24. Analysis.
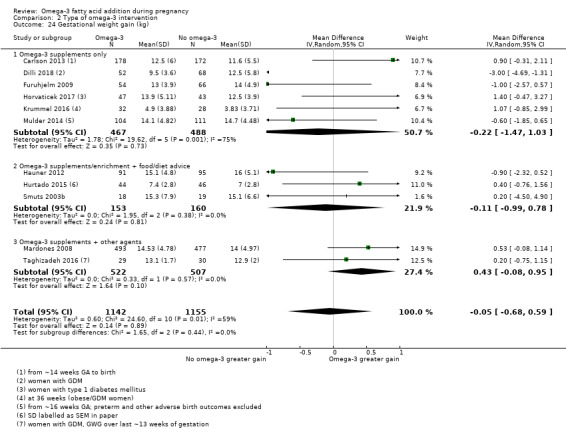
Comparison 2 Type of omega‐3 intervention, Outcome 24 Gestational weight gain (kg).
2.25. Analysis.
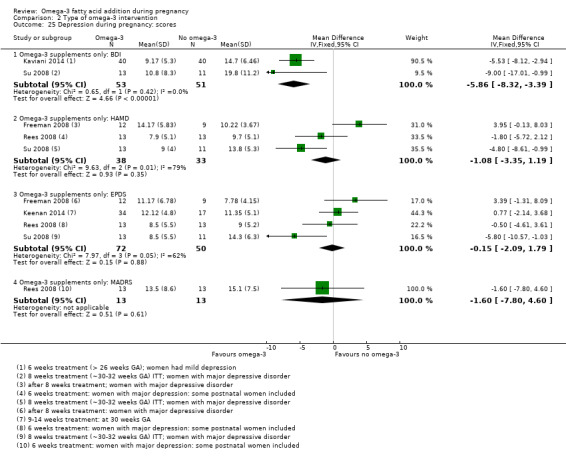
Comparison 2 Type of omega‐3 intervention, Outcome 25 Depression during pregnancy: scores.
2.26. Analysis.
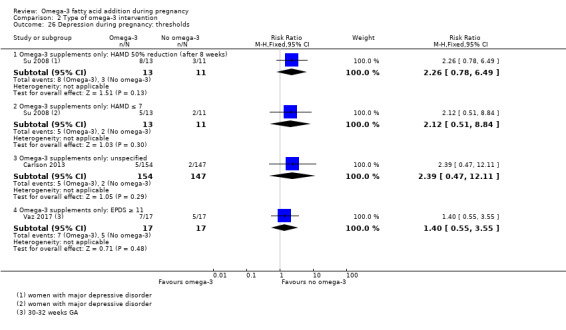
Comparison 2 Type of omega‐3 intervention, Outcome 26 Depression during pregnancy: thresholds.
2.27. Analysis.
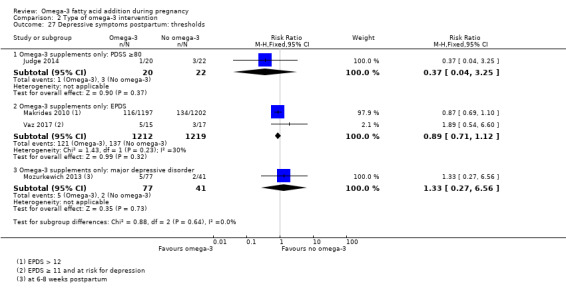
Comparison 2 Type of omega‐3 intervention, Outcome 27 Depressive symptoms postpartum: thresholds.
2.28. Analysis.
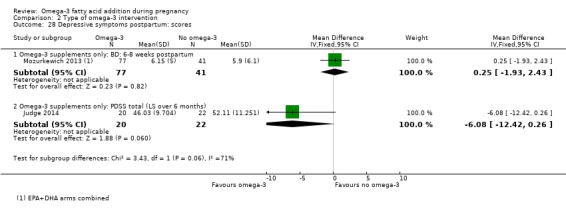
Comparison 2 Type of omega‐3 intervention, Outcome 28 Depressive symptoms postpartum: scores.
2.29. Analysis.
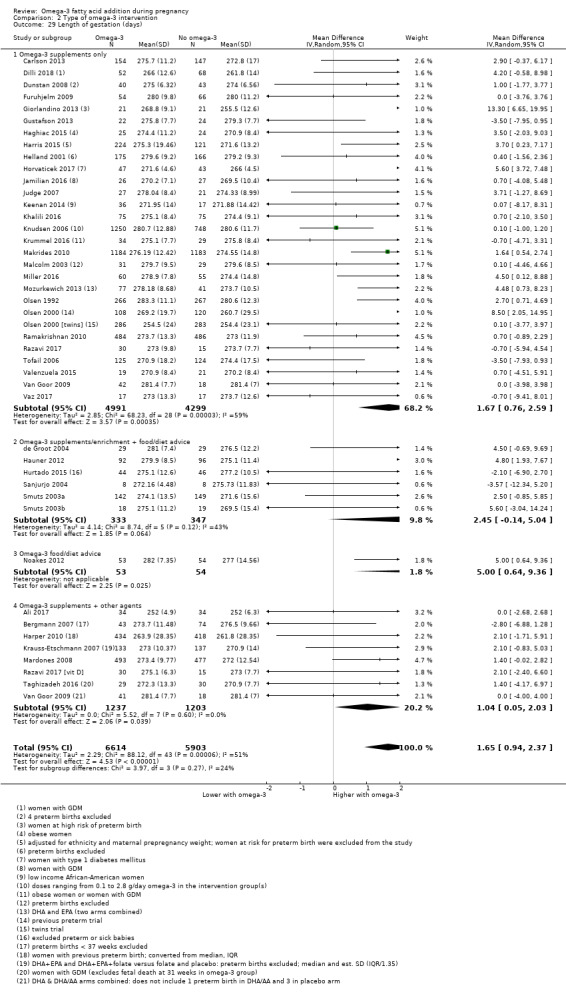
Comparison 2 Type of omega‐3 intervention, Outcome 29 Length of gestation (days).
2.30. Analysis.
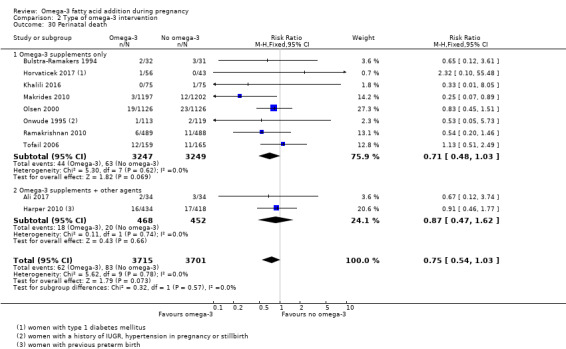
Comparison 2 Type of omega‐3 intervention, Outcome 30 Perinatal death.
2.31. Analysis.
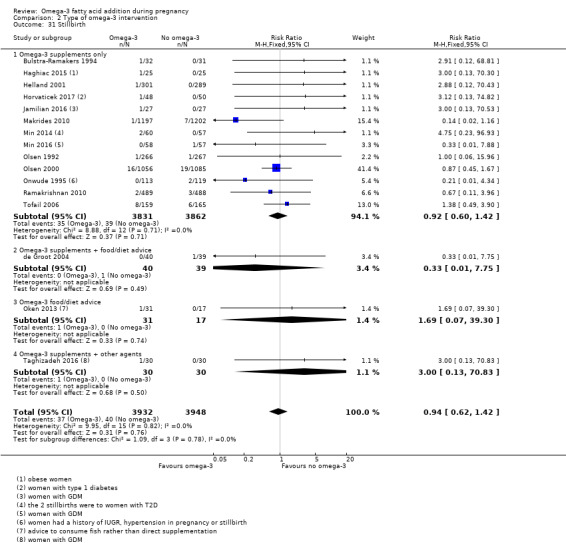
Comparison 2 Type of omega‐3 intervention, Outcome 31 Stillbirth.
2.32. Analysis.
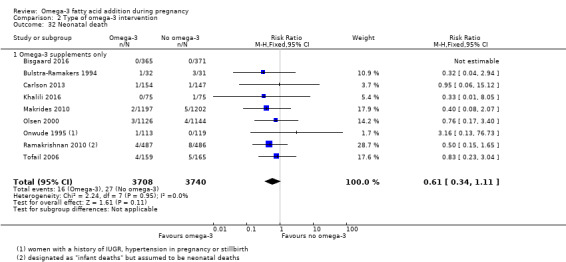
Comparison 2 Type of omega‐3 intervention, Outcome 32 Neonatal death.
2.33. Analysis.
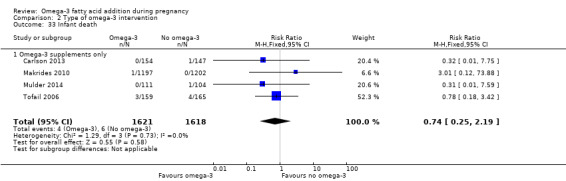
Comparison 2 Type of omega‐3 intervention, Outcome 33 Infant death.
2.34. Analysis.
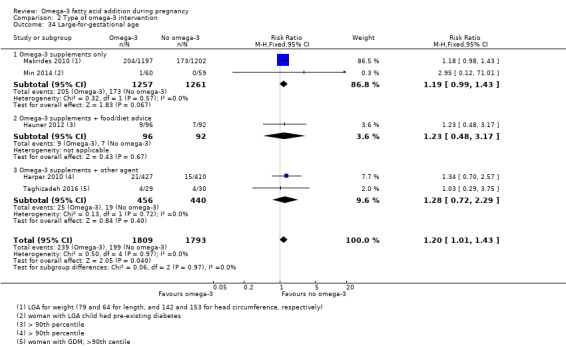
Comparison 2 Type of omega‐3 intervention, Outcome 34 Large‐for‐gestational age.
2.35. Analysis.
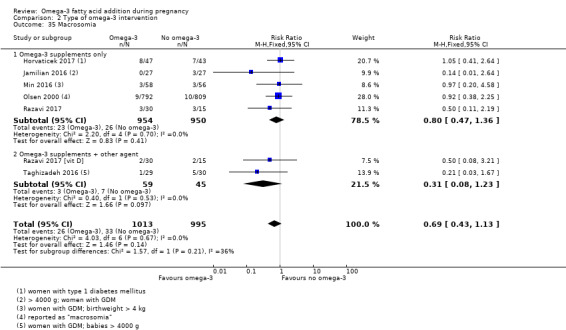
Comparison 2 Type of omega‐3 intervention, Outcome 35 Macrosomia.
2.36. Analysis.
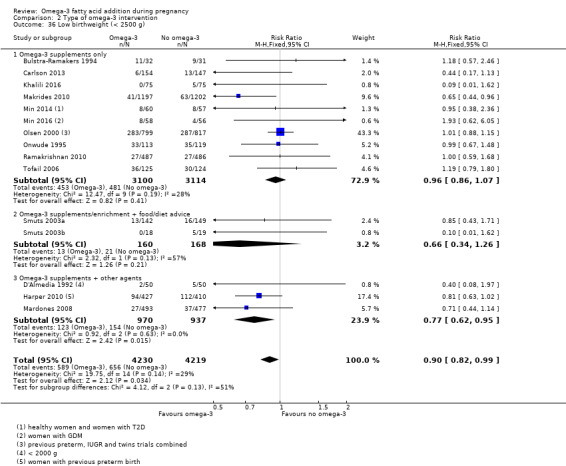
Comparison 2 Type of omega‐3 intervention, Outcome 36 Low birthweight (< 2500 g).
2.37. Analysis.
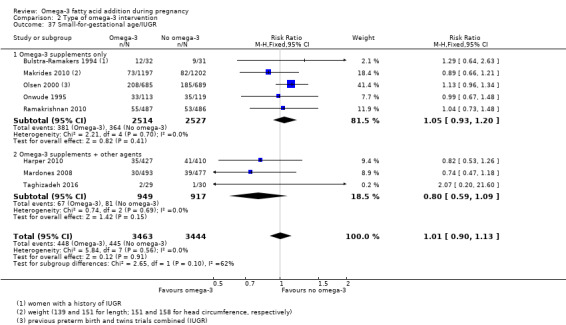
Comparison 2 Type of omega‐3 intervention, Outcome 37 Small‐for‐gestational age/IUGR.
2.38. Analysis.
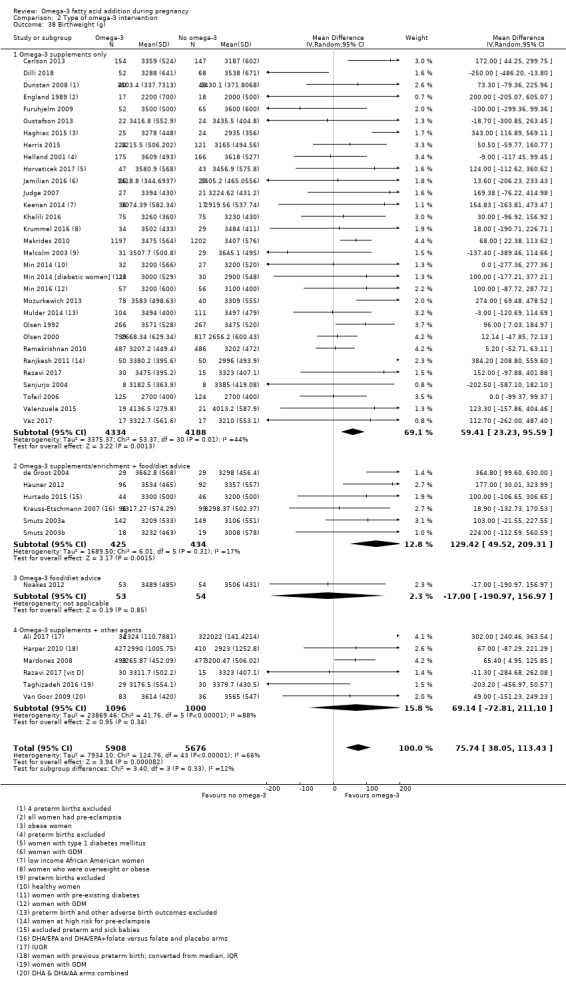
Comparison 2 Type of omega‐3 intervention, Outcome 38 Birthweight (g).
2.39. Analysis.
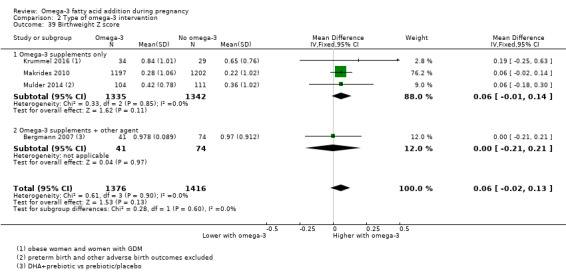
Comparison 2 Type of omega‐3 intervention, Outcome 39 Birthweight Z score.
2.41. Analysis.
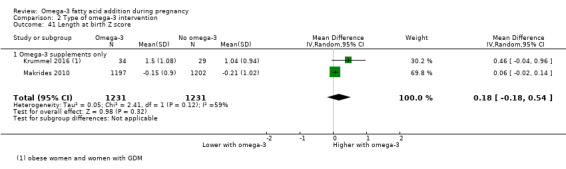
Comparison 2 Type of omega‐3 intervention, Outcome 41 Length at birth Z score.
2.42. Analysis.
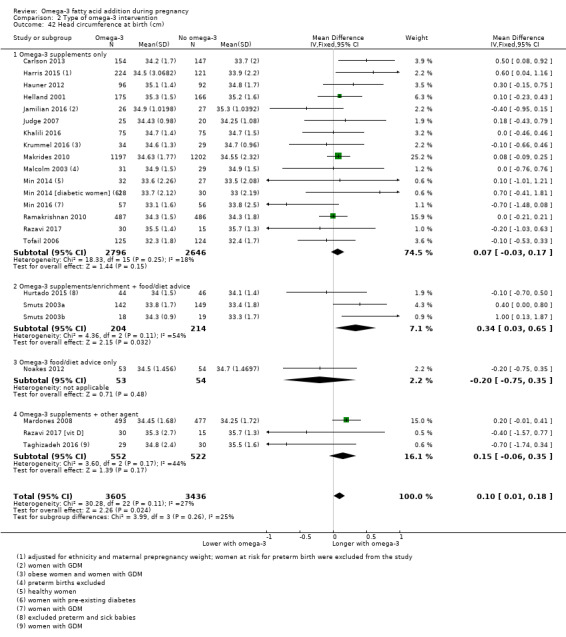
Comparison 2 Type of omega‐3 intervention, Outcome 42 Head circumference at birth (cm).
2.43. Analysis.
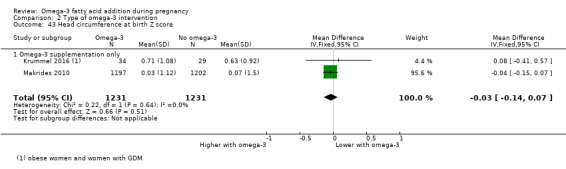
Comparison 2 Type of omega‐3 intervention, Outcome 43 Head circumference at birth Z score.
2.44. Analysis.
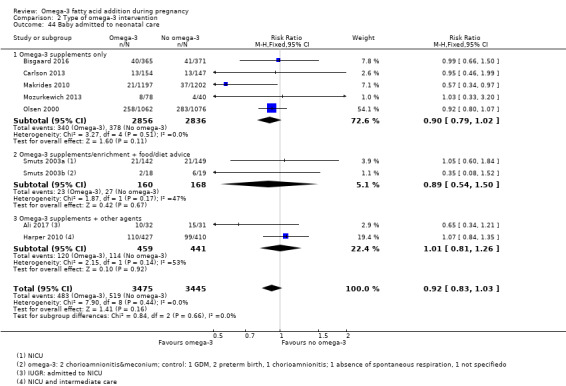
Comparison 2 Type of omega‐3 intervention, Outcome 44 Baby admitted to neonatal care.
2.45. Analysis.
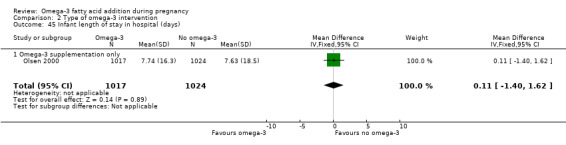
Comparison 2 Type of omega‐3 intervention, Outcome 45 Infant length of stay in hospital (days).
2.46. Analysis.
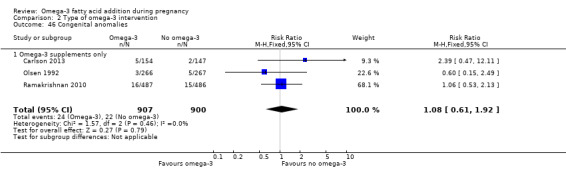
Comparison 2 Type of omega‐3 intervention, Outcome 46 Congenital anomalies.
2.47. Analysis.
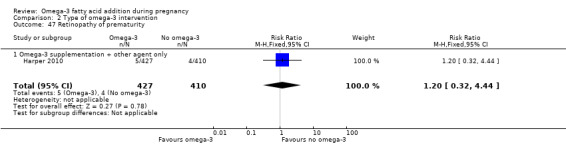
Comparison 2 Type of omega‐3 intervention, Outcome 47 Retinopathy of prematurity.
2.48. Analysis.
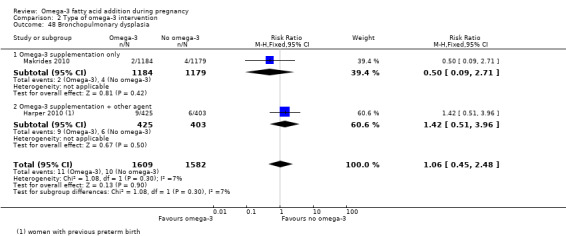
Comparison 2 Type of omega‐3 intervention, Outcome 48 Bronchopulmonary dysplasia.
2.49. Analysis.
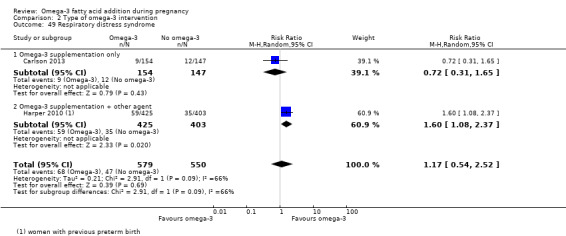
Comparison 2 Type of omega‐3 intervention, Outcome 49 Respiratory distress syndrome.
2.50. Analysis.
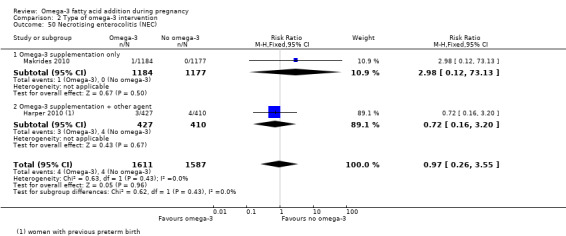
Comparison 2 Type of omega‐3 intervention, Outcome 50 Necrotising enterocolitis (NEC).
2.51. Analysis.
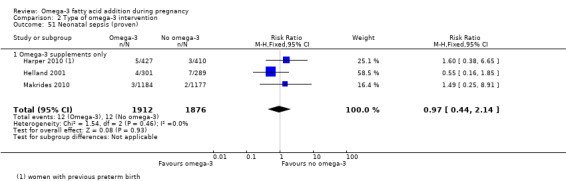
Comparison 2 Type of omega‐3 intervention, Outcome 51 Neonatal sepsis (proven).
2.52. Analysis.
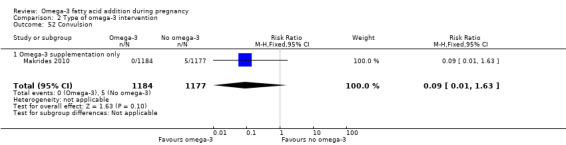
Comparison 2 Type of omega‐3 intervention, Outcome 52 Convulsion.
2.53. Analysis.
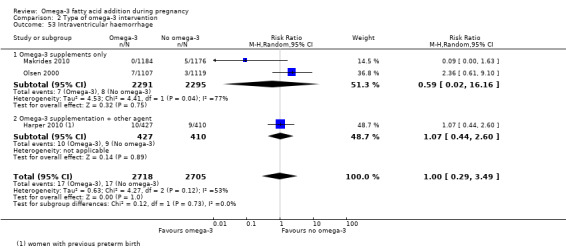
Comparison 2 Type of omega‐3 intervention, Outcome 53 Intraventricular haemorrhage.
2.54. Analysis.
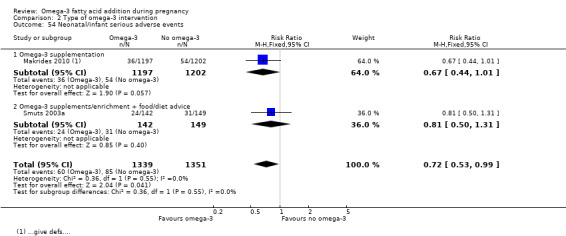
Comparison 2 Type of omega‐3 intervention, Outcome 54 Neonatal/infant serious adverse events.
2.55. Analysis.
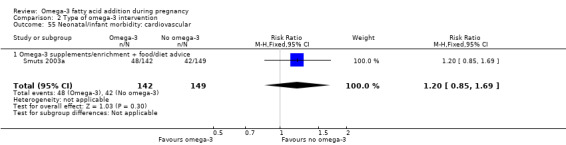
Comparison 2 Type of omega‐3 intervention, Outcome 55 Neonatal/infant morbidity: cardiovascular.
2.56. Analysis.
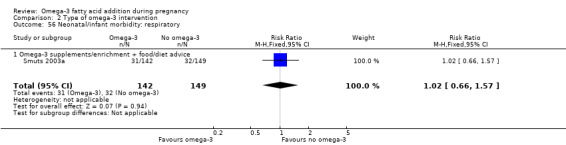
Comparison 2 Type of omega‐3 intervention, Outcome 56 Neonatal/infant morbidity: respiratory.
2.57. Analysis.
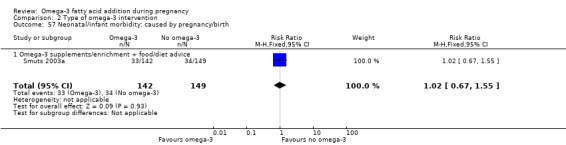
Comparison 2 Type of omega‐3 intervention, Outcome 57 Neonatal/infant morbidity: caused by pregnancy/birth.
2.58. Analysis.
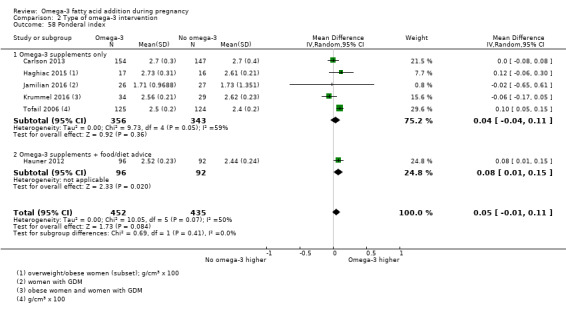
Comparison 2 Type of omega‐3 intervention, Outcome 58 Ponderal index.
Comparison 3. Dose (DHA/EPA) subgroups.
| Outcome or subgroup title | No. of studies | No. of participants | Statistical method | Effect size |
|---|---|---|---|---|
| 1 Preterm birth (< 37 weeks) | 26 | 10294 | Risk Ratio (M‐H, Fixed, 95% CI) | 0.88 [0.80, 0.97] |
| 1.1 Low: < 500 mg/day | 6 | 1604 | Risk Ratio (M‐H, Fixed, 95% CI) | 0.88 [0.65, 1.20] |
| 1.2 Mid: 500 mg‐1 g/day | 9 | 4343 | Risk Ratio (M‐H, Fixed, 95% CI) | 0.79 [0.64, 0.98] |
| 1.3 High: > 1 g/day | 9 | 4240 | Risk Ratio (M‐H, Fixed, 95% CI) | 0.92 [0.83, 1.03] |
| 1.4 Other | 2 | 107 | Risk Ratio (M‐H, Fixed, 95% CI) | 0.66 [0.19, 2.32] |
| 2 Early preterm birth (< 34 weeks) | 9 | 5204 | Risk Ratio (M‐H, Fixed, 95% CI) | 0.58 [0.44, 0.77] |
| 2.1 Low: < 500 mg/day | 1 | 168 | Risk Ratio (M‐H, Fixed, 95% CI) | 0.29 [0.05, 1.51] |
| 2.2 Mid: 500 mg‐1 g/day | 7 | 4176 | Risk Ratio (M‐H, Fixed, 95% CI) | 0.47 [0.30, 0.75] |
| 2.3 High: > 1 g/day | 2 | 860 | Risk Ratio (M‐H, Fixed, 95% CI) | 0.69 [0.49, 0.99] |
| 3 Prolonged gestation (> 42 weeks) | 6 | 5141 | Risk Ratio (M‐H, Fixed, 95% CI) | 1.59 [1.10, 2.30] |
| 3.1 Low: < 500 mg/day | 2 | 303 | Risk Ratio (M‐H, Fixed, 95% CI) | 1.72 [0.07, 41.64] |
| 3.2 Mid: 500 mg‐1 g/day | 2 | 2544 | Risk Ratio (M‐H, Fixed, 95% CI) | 1.92 [0.54, 6.81] |
| 3.3 High: > 1 g/day | 3 | 2294 | Risk Ratio (M‐H, Fixed, 95% CI) | 1.56 [1.05, 2.30] |
| 4 Pre‐eclampsia (hypertension with proteinuria) | 20 | 8306 | Risk Ratio (M‐H, Fixed, 95% CI) | 0.83 [0.69, 1.01] |
| 4.1 Low: < 500 mg/day | 5 | 650 | Risk Ratio (M‐H, Fixed, 95% CI) | 0.59 [0.28, 1.26] |
| 4.2 Mid: 500 mg‐1 g/day | 7 | 4118 | Risk Ratio (M‐H, Fixed, 95% CI) | 0.83 [0.62, 1.11] |
| 4.3 High: > 1 g/day | 8 | 3479 | Risk Ratio (M‐H, Fixed, 95% CI) | 0.87 [0.66, 1.14] |
| 4.4 Other | 1 | 59 | Risk Ratio (M‐H, Fixed, 95% CI) | 2.07 [0.20, 21.60] |
| 5 Caesarean section | 28 | 8481 | Risk Ratio (M‐H, Fixed, 95% CI) | 0.97 [0.91, 1.03] |
| 5.1 Low: < 500 g/day | 8 | 1670 | Risk Ratio (M‐H, Fixed, 95% CI) | 0.94 [0.84, 1.06] |
| 5.2 Mid: 500 mg‐1 g/day | 10 | 4399 | Risk Ratio (M‐H, Fixed, 95% CI) | 0.93 [0.85, 1.02] |
| 5.3 High: > 1 g/day | 8 | 2294 | Risk Ratio (M‐H, Fixed, 95% CI) | 1.15 [0.97, 1.37] |
| 5.4 Other | 2 | 118 | Risk Ratio (M‐H, Fixed, 95% CI) | 0.59 [0.30, 1.15] |
| 6 Length of gestation (days) | 42 | 12517 | Mean Difference (IV, Random, 95% CI) | 1.67 [0.95, 2.39] |
| 6.1 Low: < 500 mg/day | 12 | 2117 | Mean Difference (IV, Random, 95% CI) | 1.05 [0.07, 2.03] |
| 6.2 Mid: 500 mg‐1 g/day | 15 | 4881 | Mean Difference (IV, Random, 95% CI) | 1.97 [0.56, 3.38] |
| 6.3 High: > 1 g/day | 12 | 3364 | Mean Difference (IV, Random, 95% CI) | 1.86 [0.45, 3.27] |
| 6.4 Mixed | 1 | 1998 | Mean Difference (IV, Random, 95% CI) | 0.10 [‐1.00, 1.20] |
| 6.5 Other | 3 | 157 | Mean Difference (IV, Random, 95% CI) | 2.24 [‐0.83, 5.31] |
| 7 Perinatal death | 10 | 7416 | Risk Ratio (M‐H, Fixed, 95% CI) | 0.75 [0.54, 1.03] |
| 7.1 Low: < 500 mg/day | 2 | 1127 | Risk Ratio (M‐H, Fixed, 95% CI) | 0.52 [0.20, 1.33] |
| 7.2 Mid: 500 mg‐1 g/day | 3 | 2566 | Risk Ratio (M‐H, Fixed, 95% CI) | 0.41 [0.16, 1.02] |
| 7.3 High: > 1 g/day | 5 | 3723 | Risk Ratio (M‐H, Fixed, 95% CI) | 0.89 [0.61, 1.29] |
| 8 Stillbirth | 16 | 7880 | Risk Ratio (M‐H, Fixed, 95% CI) | 0.94 [0.62, 1.42] |
| 8.1 Low: < 500 mg/day | 1 | 977 | Risk Ratio (M‐H, Fixed, 95% CI) | 0.67 [0.11, 3.96] |
| 8.2 Mid: 500 mg/day‐1 g/day | 5 | 2783 | Risk Ratio (M‐H, Fixed, 95% CI) | 0.70 [0.27, 1.83] |
| 8.3 High: > 1 g/day | 7 | 3933 | Risk Ratio (M‐H, Fixed, 95% CI) | 1.03 [0.62, 1.69] |
| 8.4 Other | 3 | 187 | Risk Ratio (M‐H, Fixed, 95% CI) | 1.16 [0.23, 5.94] |
| 9 Neonatal death | 9 | 7448 | Risk Ratio (M‐H, Fixed, 95% CI) | 0.61 [0.34, 1.11] |
| 9.1 Low: < 500 mg/day | 2 | 1123 | Risk Ratio (M‐H, Fixed, 95% CI) | 0.47 [0.15, 1.44] |
| 9.2 Mid: 500 mg/day‐1 g/day | 2 | 2700 | Risk Ratio (M‐H, Fixed, 95% CI) | 0.50 [0.12, 1.98] |
| 9.3 High: > 1 g/day | 5 | 3625 | Risk Ratio (M‐H, Fixed, 95% CI) | 0.78 [0.34, 1.78] |
| 10 Low birthweight (< 2500 g) | 15 | 8449 | Risk Ratio (M‐H, Fixed, 95% CI) | 0.90 [0.82, 0.99] |
| 10.1 Low: < 500 mg/day | 5 | 1551 | Risk Ratio (M‐H, Fixed, 95% CI) | 0.74 [0.51, 1.08] |
| 10.2 Mid: 500 mg‐1 g/day | 5 | 3901 | Risk Ratio (M‐H, Fixed, 95% CI) | 0.71 [0.54, 0.92] |
| 10.3 High: > 1 g/day | 5 | 2997 | Risk Ratio (M‐H, Fixed, 95% CI) | 0.97 [0.88, 1.08] |
| 11 Small‐for‐gestational age/IUGR | 8 | 6907 | Risk Ratio (M‐H, Fixed, 95% CI) | 1.01 [0.90, 1.13] |
| 11.1 Low: < 500 mg/day | 1 | 973 | Risk Ratio (M‐H, Fixed, 95% CI) | 1.04 [0.73, 1.48] |
| 11.2 Mid: 500 mg‐1 g/day | 2 | 3369 | Risk Ratio (M‐H, Fixed, 95% CI) | 0.85 [0.66, 1.09] |
| 11.3 High: > 1 g/day | 4 | 2506 | Risk Ratio (M‐H, Fixed, 95% CI) | 1.07 [0.93, 1.23] |
| 11.4 Other | 1 | 59 | Risk Ratio (M‐H, Fixed, 95% CI) | 2.07 [0.20, 21.60] |
| 12 Birthweight (g) | 44 | 11584 | Mean Difference (IV, Random, 95% CI) | 75.30 [38.09, 112.50] |
| 12.1 Low: < 500 mg/day | 12 | 2220 | Mean Difference (IV, Random, 95% CI) | 26.32 [‐12.74, 65.39] |
| 12.2 Mid: 500 mg‐1 g/day | 18 | 5007 | Mean Difference (IV, Random, 95% CI) | 91.49 [24.34, 158.64] |
| 12.3 High: > 1 g/day | 14 | 4298 | Mean Difference (IV, Random, 95% CI) | 88.31 [29.61, 147.01] |
| 12.4 Other | 1 | 59 | Mean Difference (IV, Random, 95% CI) | ‐203.20 [‐456.97, 50.57] |
3.1. Analysis.
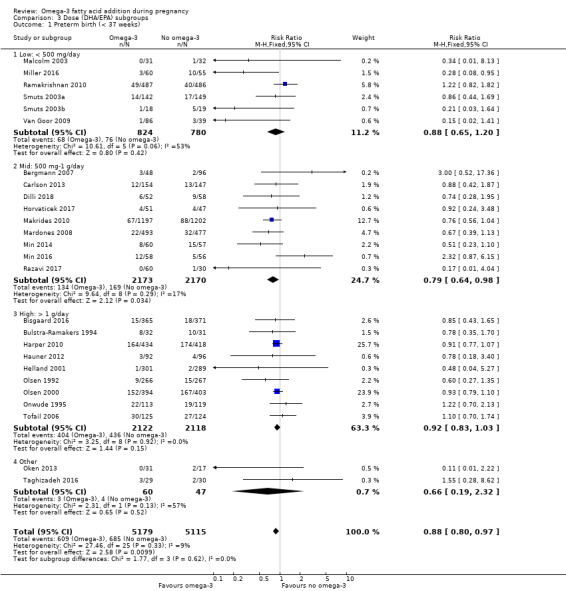
Comparison 3 Dose (DHA/EPA) subgroups, Outcome 1 Preterm birth (< 37 weeks).
3.2. Analysis.
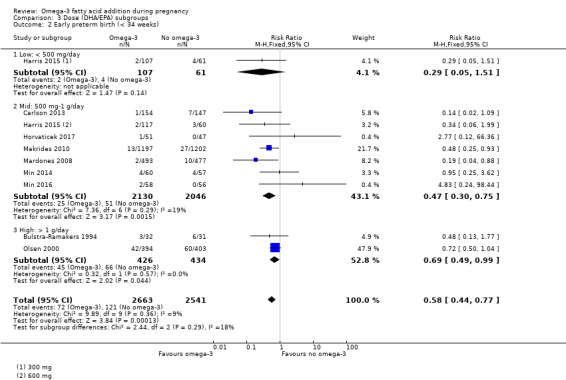
Comparison 3 Dose (DHA/EPA) subgroups, Outcome 2 Early preterm birth (< 34 weeks).
3.3. Analysis.
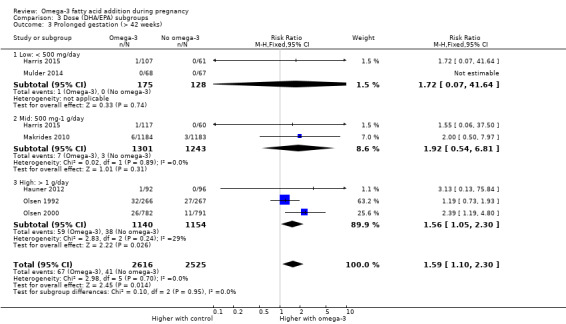
Comparison 3 Dose (DHA/EPA) subgroups, Outcome 3 Prolonged gestation (> 42 weeks).
3.4. Analysis.
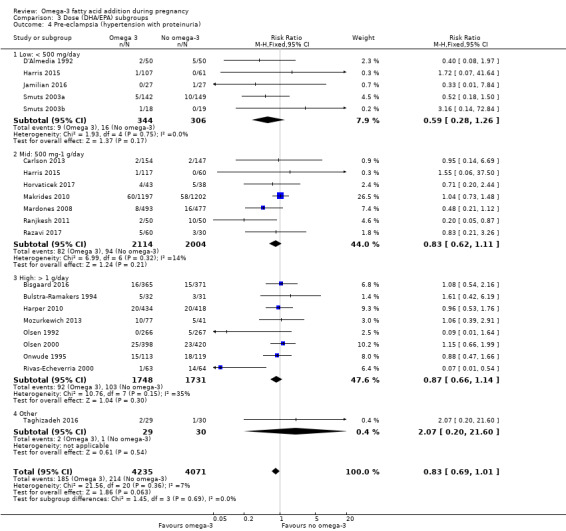
Comparison 3 Dose (DHA/EPA) subgroups, Outcome 4 Pre‐eclampsia (hypertension with proteinuria).
3.5. Analysis.
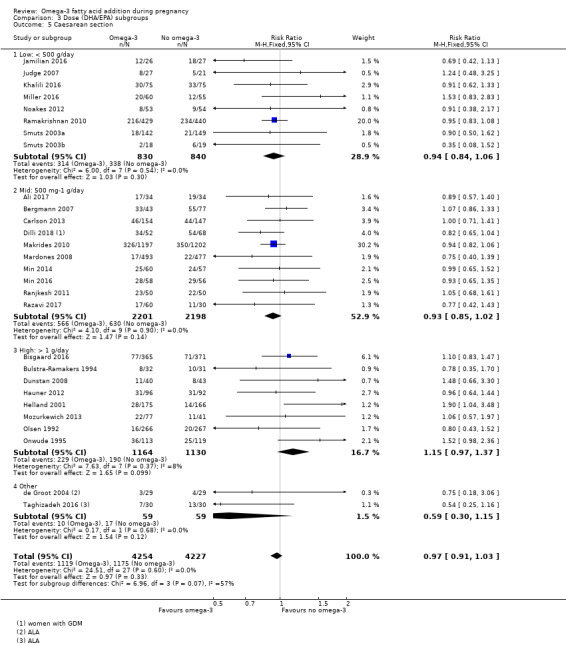
Comparison 3 Dose (DHA/EPA) subgroups, Outcome 5 Caesarean section.
3.6. Analysis.
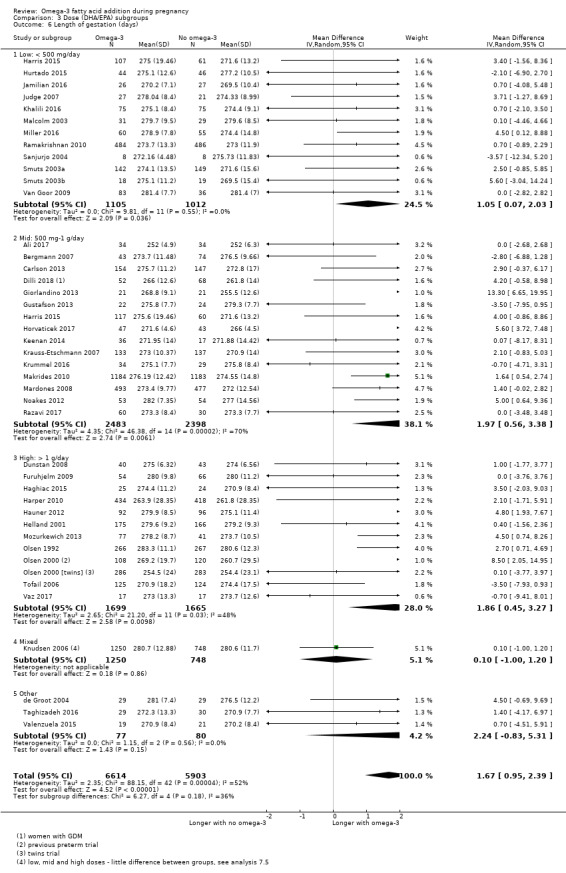
Comparison 3 Dose (DHA/EPA) subgroups, Outcome 6 Length of gestation (days).
3.7. Analysis.
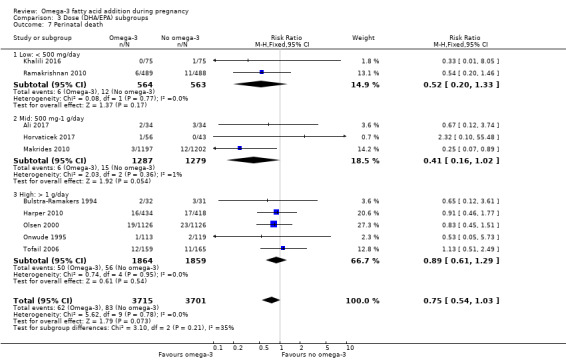
Comparison 3 Dose (DHA/EPA) subgroups, Outcome 7 Perinatal death.
3.8. Analysis.
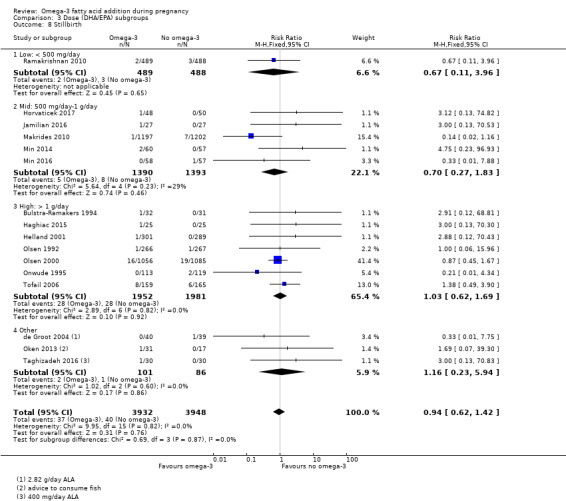
Comparison 3 Dose (DHA/EPA) subgroups, Outcome 8 Stillbirth.
3.9. Analysis.
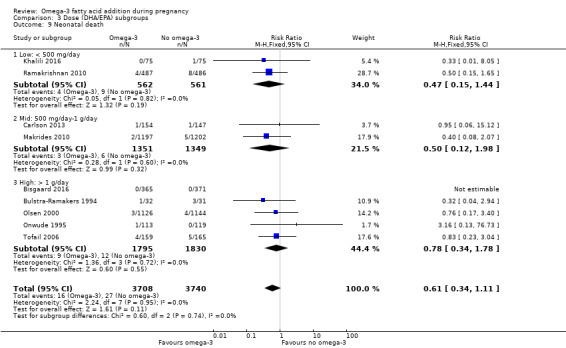
Comparison 3 Dose (DHA/EPA) subgroups, Outcome 9 Neonatal death.
3.11. Analysis.
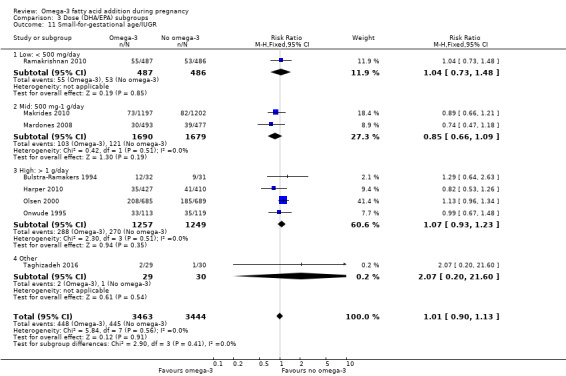
Comparison 3 Dose (DHA/EPA) subgroups, Outcome 11 Small‐for‐gestational age/IUGR.
Comparison 4. Timing subgroups.
| Outcome or subgroup title | No. of studies | No. of participants | Statistical method | Effect size |
|---|---|---|---|---|
| 1 Preterm birth (< 37 weeks) | 26 | 10304 | Risk Ratio (M‐H, Fixed, 95% CI) | 0.89 [0.81, 0.97] |
| 1.1 ≤ 20 weeks GA start | 12 | 6563 | Risk Ratio (M‐H, Fixed, 95% CI) | 0.85 [0.76, 0.95] |
| 1.2 > 20 weeks GA start | 13 | 3693 | Risk Ratio (M‐H, Fixed, 95% CI) | 1.01 [0.82, 1.23] |
| 1.3 Mixed | 1 | 48 | Risk Ratio (M‐H, Fixed, 95% CI) | 0.11 [0.01, 2.22] |
| 2 Early preterm birth (< 34 weeks) | 9 | 5204 | Risk Ratio (M‐H, Fixed, 95% CI) | 0.58 [0.44, 0.77] |
| 2.1 ≤ 20 weeks GA start | 8 | 5090 | Risk Ratio (M‐H, Fixed, 95% CI) | 0.56 [0.43, 0.75] |
| 2.2 > 20 weeks GA start | 1 | 114 | Risk Ratio (M‐H, Fixed, 95% CI) | 4.83 [0.24, 98.44] |
| 3 Prolonged gestation (> 42 weeks) | 6 | 5141 | Risk Ratio (M‐H, Fixed, 95% CI) | 1.61 [1.11, 2.33] |
| 3.1 ≤ 20 weeks GA start | 5 | 4608 | Risk Ratio (M‐H, Fixed, 95% CI) | 2.35 [1.29, 4.28] |
| 3.2 > 20 weeks GA start | 1 | 533 | Risk Ratio (M‐H, Fixed, 95% CI) | 1.19 [0.73, 1.93] |
| 4 Pre‐eclampsia (hypertension with proteinuria) | 20 | 8306 | Risk Ratio (M‐H, Fixed, 95% CI) | 0.84 [0.69, 1.01] |
| 4.1 ≤ 20 weeks GA start | 13 | 6296 | Risk Ratio (M‐H, Fixed, 95% CI) | 0.92 [0.74, 1.15] |
| 4.2 > 20 weeks GA start | 6 | 1883 | Risk Ratio (M‐H, Fixed, 95% CI) | 0.79 [0.53, 1.18] |
| 4.3 Not reported | 1 | 127 | Risk Ratio (M‐H, Fixed, 95% CI) | 0.07 [0.01, 0.54] |
| 5 Caesarean section | 28 | 8481 | Risk Ratio (M‐H, Fixed, 95% CI) | 0.97 [0.91, 1.03] |
| 5.1 ≤ 20 weeks GA start | 13 | 4995 | Risk Ratio (M‐H, Fixed, 95% CI) | 0.97 [0.88, 1.07] |
| 5.2 > 20 weeks GA start | 14 | 2617 | Risk Ratio (M‐H, Fixed, 95% CI) | 0.98 [0.87, 1.10] |
| 5.3 Mixed | 1 | 869 | Risk Ratio (M‐H, Fixed, 95% CI) | 0.95 [0.83, 1.08] |
| 6 Length of gestation (days) | 43 | 12517 | Mean Difference (IV, Random, 95% CI) | 1.67 [0.95, 2.39] |
| 6.1 ≤ 20 weeks GA start | 23 | 9396 | Mean Difference (IV, Random, 95% CI) | 1.99 [1.08, 2.90] |
| 6.2 > 20 weeks GA start | 20 | 3121 | Mean Difference (IV, Random, 95% CI) | 1.18 [‐0.05, 2.40] |
| 7 Perinatal death | 10 | 7416 | Risk Ratio (M‐H, Fixed, 95% CI) | 0.75 [0.54, 1.03] |
| 7.1 ≤ 20 weeks GA start | 6 | 5815 | Risk Ratio (M‐H, Fixed, 95% CI) | 0.72 [0.49, 1.07] |
| 7.2 > 20 weeks GA start | 4 | 1601 | Risk Ratio (M‐H, Fixed, 95% CI) | 0.79 [0.46, 1.38] |
| 8 Stillbirth | 16 | 7880 | Risk Ratio (M‐H, Fixed, 95% CI) | 0.94 [0.62, 1.42] |
| 8.1 ≤ 20 weeks GA start | 8 | 5537 | Risk Ratio (M‐H, Fixed, 95% CI) | 0.88 [0.52, 1.48] |
| 8.2 > 20 weeks GA start | 7 | 2295 | Risk Ratio (M‐H, Fixed, 95% CI) | 1.02 [0.50, 2.07] |
| 8.3 Mixed | 1 | 48 | Risk Ratio (M‐H, Fixed, 95% CI) | 1.69 [0.07, 39.30] |
| 9 Neonatal death | 9 | 7448 | Risk Ratio (M‐H, Fixed, 95% CI) | 0.61 [0.34, 1.11] |
| 9.1 ≤ 20 weeks GA start | 6 | 5415 | Risk Ratio (M‐H, Fixed, 95% CI) | 0.60 [0.26, 1.36] |
| 9.2 > 20 weeks GA start | 3 | 2033 | Risk Ratio (M‐H, Fixed, 95% CI) | 0.62 [0.26, 1.49] |
| 10 Low birthweight (< 2500 g) | 15 | 8449 | Risk Ratio (M‐H, Fixed, 95% CI) | 0.90 [0.82, 0.99] |
| 10.1 ≤ 20 weeks GA start | 9 | 6553 | Risk Ratio (M‐H, Fixed, 95% CI) | 0.88 [0.79, 0.97] |
| 10.2 > 20 weeks GA start | 6 | 1896 | Risk Ratio (M‐H, Fixed, 95% CI) | 1.02 [0.81, 1.28] |
| 11 Small‐for‐gestational age/IUGR | 8 | 6907 | Risk Ratio (M‐H, Fixed, 95% CI) | 1.01 [0.90, 1.13] |
| 11.1 ≤ 20 weeks GA start | 5 | 5643 | Risk Ratio (M‐H, Fixed, 95% CI) | 1.00 [0.88, 1.14] |
| 11.2 > 20 weeks GA start | 3 | 1264 | Risk Ratio (M‐H, Fixed, 95% CI) | 1.03 [0.79, 1.34] |
| 12 Birthweight (g) | 43 | 11584 | Mean Difference (IV, Random, 95% CI) | 75.69 [37.84, 113.55] |
| 12.1 ≤ 20 weeks GA start | 25 | 7802 | Mean Difference (IV, Random, 95% CI) | 83.26 [44.09, 122.43] |
| 12.2 > 20 weeks GA start | 17 | 3747 | Mean Difference (IV, Random, 95% CI) | 42.96 [‐34.14, 120.06] |
| 12.3 Not reported | 1 | 35 | Mean Difference (IV, Random, 95% CI) | 200.0 [‐205.07, 605.07] |
4.1. Analysis.
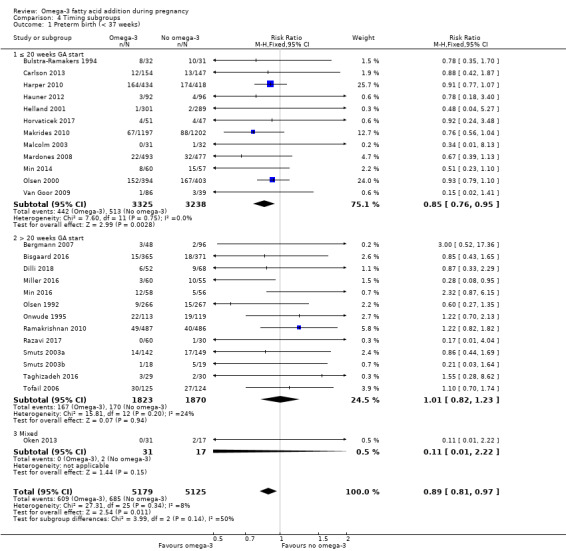
Comparison 4 Timing subgroups, Outcome 1 Preterm birth (< 37 weeks).
4.2. Analysis.
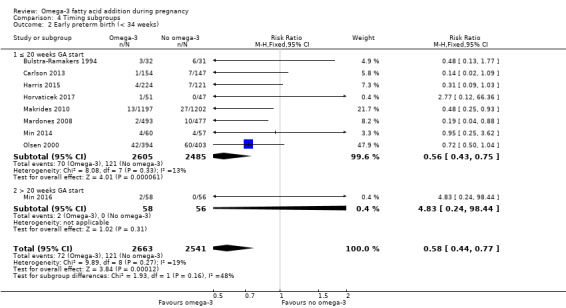
Comparison 4 Timing subgroups, Outcome 2 Early preterm birth (< 34 weeks).
4.3. Analysis.
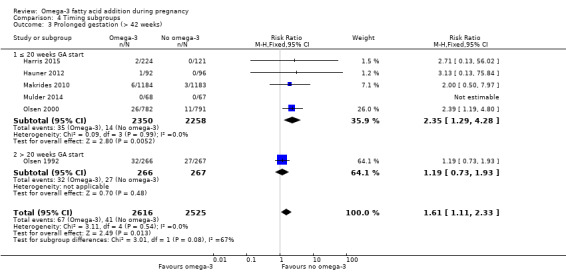
Comparison 4 Timing subgroups, Outcome 3 Prolonged gestation (> 42 weeks).
4.5. Analysis.
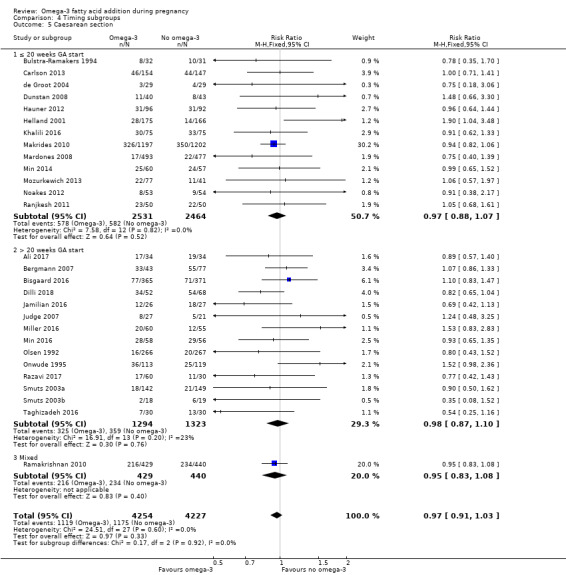
Comparison 4 Timing subgroups, Outcome 5 Caesarean section.
4.6. Analysis.
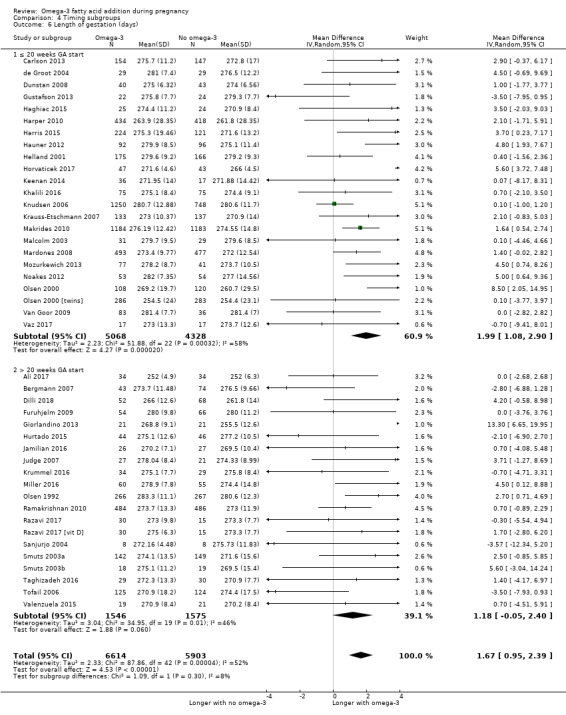
Comparison 4 Timing subgroups, Outcome 6 Length of gestation (days).
4.8. Analysis.
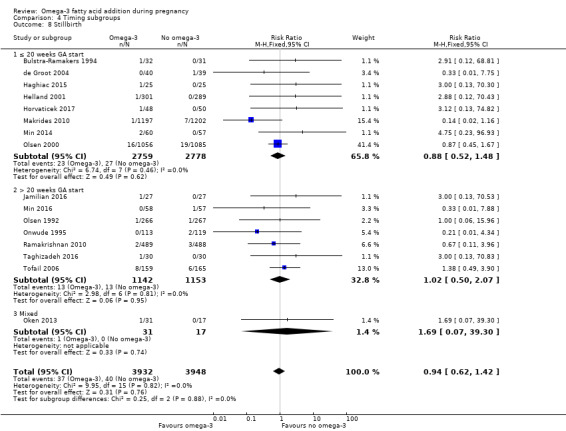
Comparison 4 Timing subgroups, Outcome 8 Stillbirth.
4.9. Analysis.
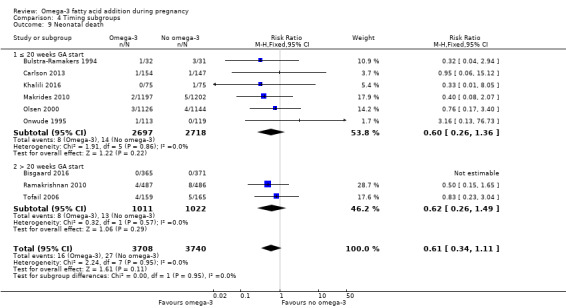
Comparison 4 Timing subgroups, Outcome 9 Neonatal death.
4.10. Analysis.
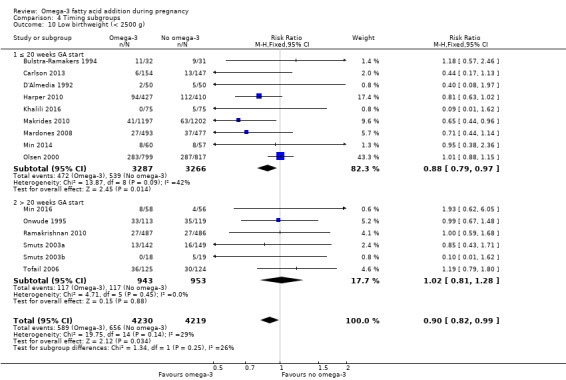
Comparison 4 Timing subgroups, Outcome 10 Low birthweight (< 2500 g).
4.11. Analysis.
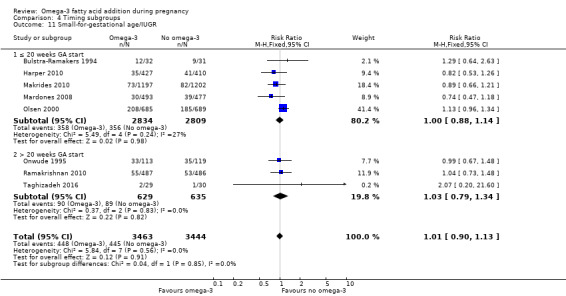
Comparison 4 Timing subgroups, Outcome 11 Small‐for‐gestational age/IUGR.
4.12. Analysis.
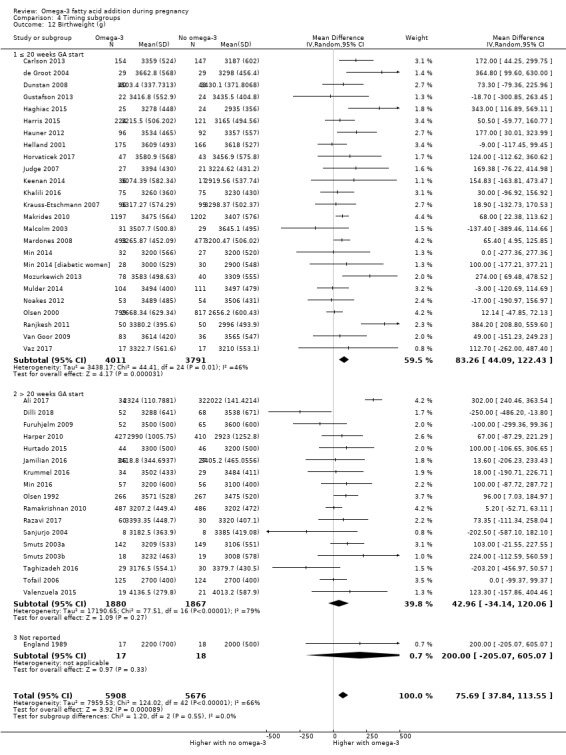
Comparison 4 Timing subgroups, Outcome 12 Birthweight (g).
Comparison 5. DHA/mixed subgroups.
| Outcome or subgroup title | No. of studies | No. of participants | Statistical method | Effect size |
|---|---|---|---|---|
| 1 Preterm birth (< 37 weeks) | 26 | 10304 | Risk Ratio (M‐H, Fixed, 95% CI) | 0.89 [0.81, 0.97] |
| 1.1 DHA/largely DHA | 12 | 4744 | Risk Ratio (M‐H, Fixed, 95% CI) | 0.84 [0.69, 1.02] |
| 1.2 Mixed DHA/EPA | 9 | 4172 | Risk Ratio (M‐H, Fixed, 95% CI) | 0.92 [0.83, 1.03] |
| 1.3 Mixed DHA/EPA/other | 5 | 1388 | Risk Ratio (M‐H, Fixed, 95% CI) | 0.71 [0.45, 1.11] |
| 2 Early preterm birth (< 34 weeks) | 9 | 5204 | Risk Ratio (M‐H, Fixed, 95% CI) | 0.58 [0.44, 0.77] |
| 2.1 DHA/largely DHA | 5 | 3260 | Risk Ratio (M‐H, Fixed, 95% CI) | 0.46 [0.28, 0.76] |
| 2.2 Mixed DHA/EPA | 2 | 860 | Risk Ratio (M‐H, Fixed, 95% CI) | 0.69 [0.49, 0.99] |
| 2.3 Mixed DHA/EPA/other | 2 | 1084 | Risk Ratio (M‐H, Fixed, 95% CI) | 0.41 [0.14, 1.25] |
| 3 Prolonged gestation (> 42 weeks) | 6 | 5141 | Risk Ratio (M‐H, Fixed, 95% CI) | 1.61 [1.11, 2.33] |
| 3.1 DHA/largely DHA | 3 | 2847 | Risk Ratio (M‐H, Fixed, 95% CI) | 2.12 [0.60, 7.49] |
| 3.2 Mixed DHA/EPA | 2 | 2106 | Risk Ratio (M‐H, Fixed, 95% CI) | 1.54 [1.04, 2.28] |
| 3.3 Mixed DHA/EPA/other | 1 | 188 | Risk Ratio (M‐H, Fixed, 95% CI) | 3.13 [0.13, 75.84] |
| 4 Pre‐eclampsia (hypertension with proteinuria) | 20 | 8306 | Risk Ratio (M‐H, Fixed, 95% CI) | 0.84 [0.69, 1.01] |
| 4.1 DHA/largely DHA | 6 | 3454 | Risk Ratio (M‐H, Fixed, 95% CI) | 0.98 [0.71, 1.33] |
| 4.2 Mixed DHA/EPA | 9 | 3506 | Risk Ratio (M‐H, Fixed, 95% CI) | 0.90 [0.69, 1.18] |
| 4.3 Mixed DHA/EPA/other | 5 | 1346 | Risk Ratio (M‐H, Fixed, 95% CI) | 0.40 [0.23, 0.71] |
| 5 Caesarean section | 28 | 8481 | Risk Ratio (M‐H, Fixed, 95% CI) | 0.97 [0.91, 1.03] |
| 5.1 DHA/largely DHA | 9 | 4327 | Risk Ratio (M‐H, Fixed, 95% CI) | 0.95 [0.87, 1.03] |
| 5.2 Mixed DHA/EPA | 10 | 2433 | Risk Ratio (M‐H, Fixed, 95% CI) | 1.10 [0.95, 1.27] |
| 5.3 Mixed DHA/EPA/other | 9 | 1721 | Risk Ratio (M‐H, Fixed, 95% CI) | 0.88 [0.75, 1.02] |
| 6 Gestational length (days) | 43 | 12517 | Mean Difference (IV, Random, 95% CI) | 1.67 [0.95, 2.39] |
| 6.1 DHA/largely DHA | 14 | 4791 | Mean Difference (IV, Random, 95% CI) | 2.44 [0.91, 3.98] |
| 6.2 Mixed DHA/EPA | 17 | 5760 | Mean Difference (IV, Random, 95% CI) | 1.23 [0.21, 2.24] |
| 6.3 Mixed DHA/EPA/other | 12 | 1966 | Mean Difference (IV, Random, 95% CI) | 1.42 [0.33, 2.50] |
| 7 Perinatal death | 10 | 7416 | Risk Ratio (M‐H, Fixed, 95% CI) | 0.75 [0.54, 1.03] |
| 7.1 DHA/largely DHA | 3 | 3475 | Risk Ratio (M‐H, Fixed, 95% CI) | 0.44 [0.21, 0.91] |
| 7.2 Mixed DHA/EPA | 6 | 3873 | Risk Ratio (M‐H, Fixed, 95% CI) | 0.88 [0.60, 1.27] |
| 7.3 Mixed DHA/EPA/other | 1 | 68 | Risk Ratio (M‐H, Fixed, 95% CI) | 0.67 [0.12, 3.74] |
| 8 Stillbirth | 16 | 7880 | Risk Ratio (M‐H, Fixed, 95% CI) | 0.94 [0.62, 1.42] |
| 8.1 DHA/largely DHA | 5 | 3639 | Risk Ratio (M‐H, Fixed, 95% CI) | 0.69 [0.28, 1.70] |
| 8.2 Mixed DHA/EPA | 8 | 3987 | Risk Ratio (M‐H, Fixed, 95% CI) | 1.06 [0.65, 1.73] |
| 8.3 Mixed DHA/EPA/other | 3 | 254 | Risk Ratio (M‐H, Fixed, 95% CI) | 0.70 [0.14, 3.51] |
| 9 Neonatal death | 9 | 7448 | Risk Ratio (M‐H, Fixed, 95% CI) | 0.61 [0.34, 1.11] |
| 9.1 DHA/largely DHA | 3 | 3673 | Risk Ratio (M‐H, Fixed, 95% CI) | 0.50 [0.20, 1.23] |
| 9.2 Mixed DHA/EPA | 6 | 3775 | Risk Ratio (M‐H, Fixed, 95% CI) | 0.73 [0.33, 1.62] |
| 10 Low birthweight (< 2500 g) | 15 | 8449 | Risk Ratio (M‐H, Fixed, 95% CI) | 0.90 [0.82, 0.99] |
| 10.1 DHA/largely DHA | 6 | 4118 | Risk Ratio (M‐H, Fixed, 95% CI) | 0.72 [0.56, 0.93] |
| 10.2 Mixed DHA/EPA | 6 | 3147 | Risk Ratio (M‐H, Fixed, 95% CI) | 0.96 [0.87, 1.07] |
| 10.3 Mixed DHA/EPA/other | 3 | 1184 | Risk Ratio (M‐H, Fixed, 95% CI) | 0.78 [0.51, 1.18] |
| 11 Small‐for‐gestational age/IUGR | 8 | 6907 | Risk Ratio (M‐H, Fixed, 95% CI) | 1.01 [0.90, 1.13] |
| 11.1 DHA/largely DHA | 2 | 3372 | Risk Ratio (M‐H, Fixed, 95% CI) | 0.95 [0.75, 1.20] |
| 11.2 Mixed DHA/EPA | 4 | 2506 | Risk Ratio (M‐H, Fixed, 95% CI) | 1.07 [0.93, 1.23] |
| 11.3 Mixed EPA/DHA/other | 2 | 1029 | Risk Ratio (M‐H, Fixed, 95% CI) | 0.78 [0.50, 1.22] |
| 12 Birthweight (g) | 43 | 11584 | Mean Difference (IV, Random, 95% CI) | 75.69 [37.84, 113.55] |
| 12.1 DHA/largely DHA | 17 | 6121 | Mean Difference (IV, Random, 95% CI) | 52.60 [26.96, 78.23] |
| 12.2 Mixed DHA/EPA | 15 | 4429 | Mean Difference (IV, Random, 95% CI) | 72.72 [6.67, 138.78] |
| 12.3 Mixed DHA/EPA/other | 11 | 1034 | Mean Difference (IV, Random, 95% CI) | 113.65 [12.54, 214.75] |
5.1. Analysis.
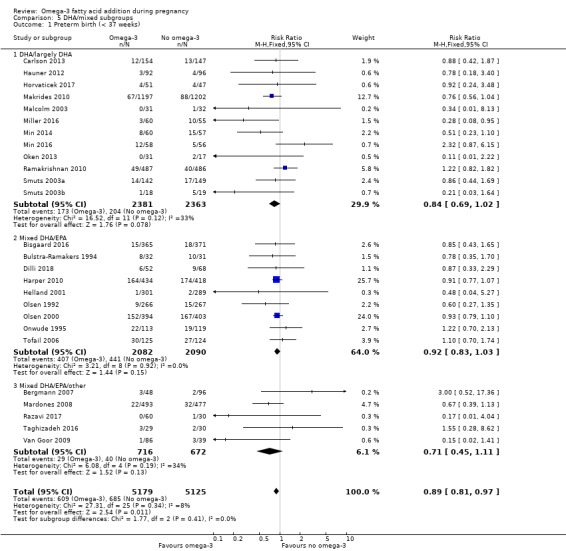
Comparison 5 DHA/mixed subgroups, Outcome 1 Preterm birth (< 37 weeks).
5.2. Analysis.
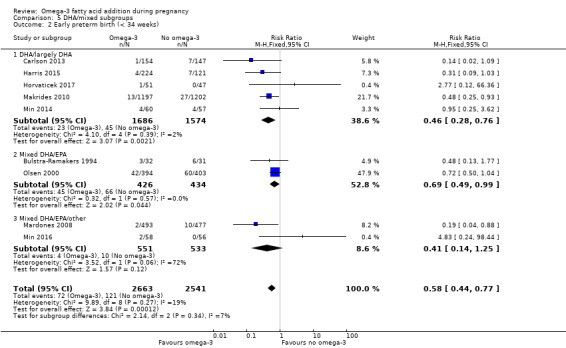
Comparison 5 DHA/mixed subgroups, Outcome 2 Early preterm birth (< 34 weeks).
5.3. Analysis.
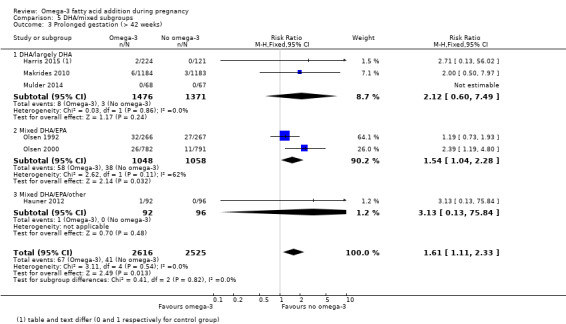
Comparison 5 DHA/mixed subgroups, Outcome 3 Prolonged gestation (> 42 weeks).
5.6. Analysis.
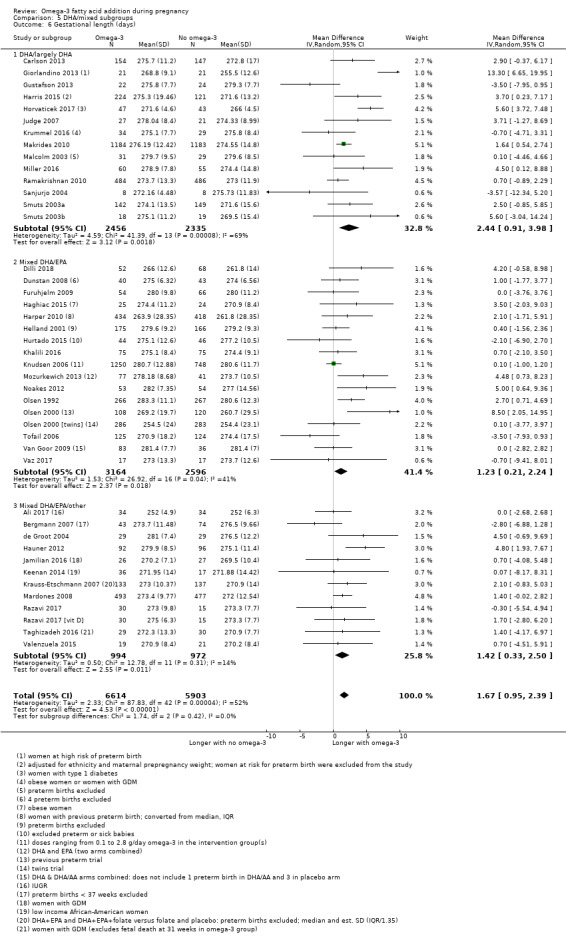
Comparison 5 DHA/mixed subgroups, Outcome 6 Gestational length (days).
5.7. Analysis.
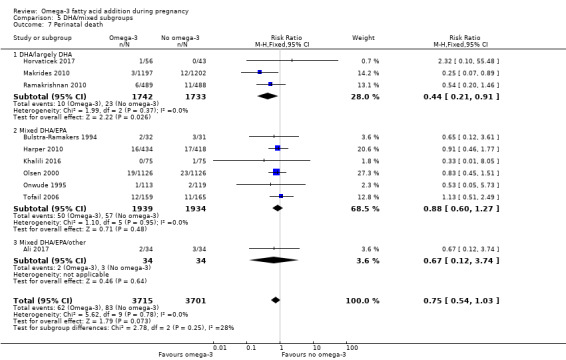
Comparison 5 DHA/mixed subgroups, Outcome 7 Perinatal death.
5.8. Analysis.
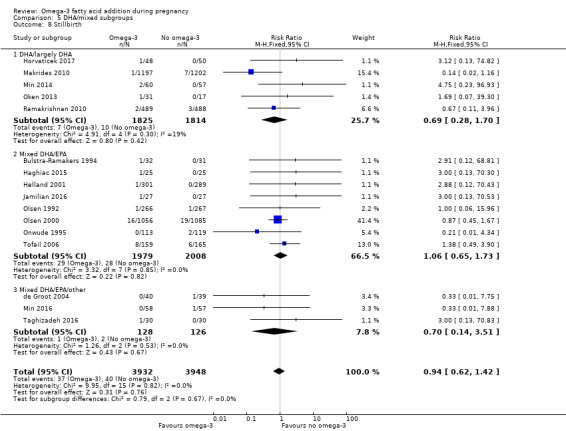
Comparison 5 DHA/mixed subgroups, Outcome 8 Stillbirth.
5.9. Analysis.
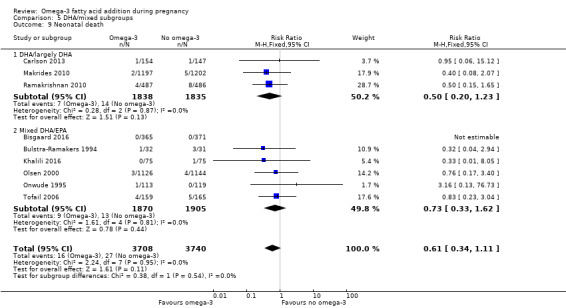
Comparison 5 DHA/mixed subgroups, Outcome 9 Neonatal death.
5.10. Analysis.
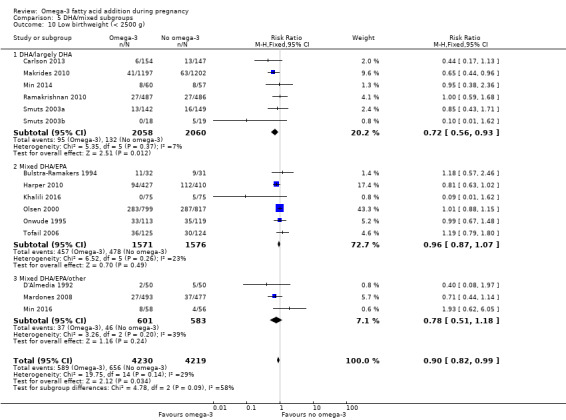
Comparison 5 DHA/mixed subgroups, Outcome 10 Low birthweight (< 2500 g).
5.11. Analysis.
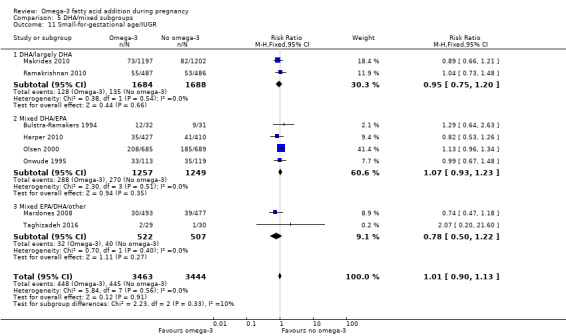
Comparison 5 DHA/mixed subgroups, Outcome 11 Small‐for‐gestational age/IUGR.
5.12. Analysis.
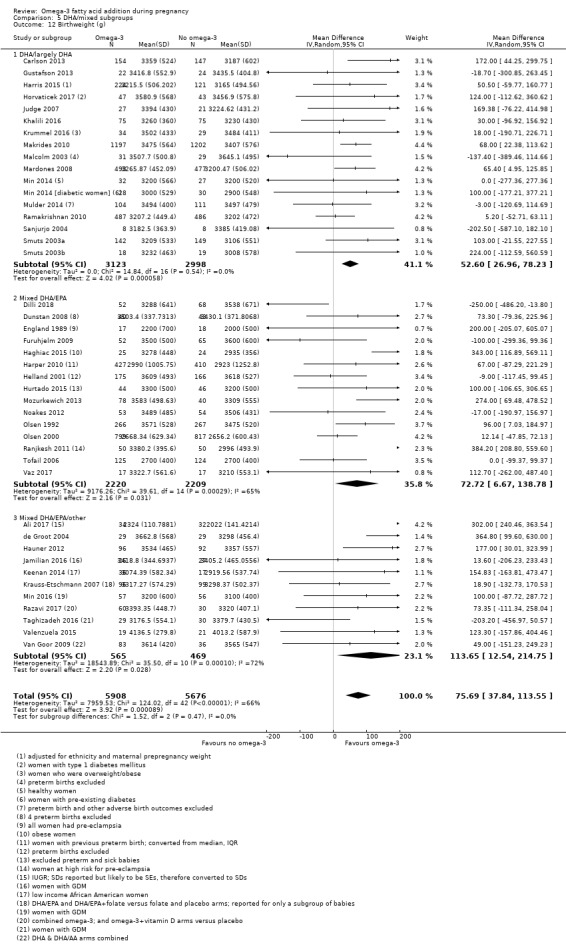
Comparison 5 DHA/mixed subgroups, Outcome 12 Birthweight (g).
Comparison 6. Risk subgroups.
| Outcome or subgroup title | No. of studies | No. of participants | Statistical method | Effect size |
|---|---|---|---|---|
| 1 Preterm birth (< 37 weeks) | 27 | 10304 | Risk Ratio (M‐H, Fixed, 95% CI) | 0.89 [0.81, 0.97] |
| 1.1 Increased/high risk | 12 | 3702 | Risk Ratio (M‐H, Fixed, 95% CI) | 0.92 [0.83, 1.03] |
| 1.2 Low risk | 10 | 3241 | Risk Ratio (M‐H, Fixed, 95% CI) | 0.92 [0.71, 1.20] |
| 1.3 Any/mixed risk | 5 | 3361 | Risk Ratio (M‐H, Fixed, 95% CI) | 0.71 [0.54, 0.93] |
| 2 Early preterm birth (< 34 weeks) | 10 | 5204 | Risk Ratio (M‐H, Fixed, 95% CI) | 0.58 [0.44, 0.77] |
| 2.1 Increased/high risk | 6 | 2104 | Risk Ratio (M‐H, Fixed, 95% CI) | 0.67 [0.49, 0.93] |
| 2.2 Low risk | 3 | 701 | Risk Ratio (M‐H, Fixed, 95% CI) | 0.31 [0.12, 0.79] |
| 2.3 Any/mixed risk | 1 | 2399 | Risk Ratio (M‐H, Fixed, 95% CI) | 0.48 [0.25, 0.93] |
| 3 Prolonged gestation (> 42 weeks) | 6 | 5141 | Risk Ratio (M‐H, Fixed, 95% CI) | 1.61 [1.11, 2.33] |
| 3.1 Increased/high risk | 1 | 1573 | Risk Ratio (M‐H, Fixed, 95% CI) | 2.39 [1.19, 4.80] |
| 3.2 Low risk | 4 | 1201 | Risk Ratio (M‐H, Fixed, 95% CI) | 1.26 [0.79, 2.01] |
| 3.3 Any/mixed risk | 1 | 2367 | Risk Ratio (M‐H, Fixed, 95% CI) | 2.00 [0.50, 7.97] |
| 4 Pre‐eclampsia (hypertension with proteinuria) | 20 | 8306 | Risk Ratio (M‐H, Fixed, 95% CI) | 0.84 [0.69, 1.01] |
| 4.1 Increased/high risk | 12 | 3564 | Risk Ratio (M‐H, Fixed, 95% CI) | 0.76 [0.59, 0.99] |
| 4.2 Low risk | 5 | 1507 | Risk Ratio (M‐H, Fixed, 95% CI) | 0.59 [0.28, 1.24] |
| 4.3 Any/mixed risk | 3 | 3235 | Risk Ratio (M‐H, Fixed, 95% CI) | 1.01 [0.74, 1.37] |
| 5 Caesarean section | 29 | 8481 | Risk Ratio (M‐H, Fixed, 95% CI) | 0.97 [0.91, 1.03] |
| 5.1 Increased/high risk | 12 | 2046 | Risk Ratio (M‐H, Fixed, 95% CI) | 0.92 [0.80, 1.05] |
| 5.2 Low risk | 14 | 3185 | Risk Ratio (M‐H, Fixed, 95% CI) | 0.99 [0.89, 1.09] |
| 5.3 Any/mixed risk | 3 | 3250 | Risk Ratio (M‐H, Fixed, 95% CI) | 0.98 [0.87, 1.10] |
| 6 Length of gestation (days) | 43 | 12517 | Mean Difference (IV, Random, 95% CI) | 1.67 [0.95, 2.39] |
| 6.1 Increased/high risk | 18 | 3707 | Mean Difference (IV, Random, 95% CI) | 2.17 [0.65, 3.68] |
| 6.2 Low risk | 22 | 4330 | Mean Difference (IV, Random, 95% CI) | 1.41 [0.52, 2.29] |
| 6.3 Any/mixed group | 3 | 4480 | Mean Difference (IV, Random, 95% CI) | 1.27 [‐0.36, 2.91] |
| 7 Perinatal death | 10 | 7416 | Risk Ratio (M‐H, Fixed, 95% CI) | 0.75 [0.54, 1.03] |
| 7.1 Increased/high risk | 6 | 3566 | Risk Ratio (M‐H, Fixed, 95% CI) | 0.84 [0.56, 1.26] |
| 7.2 Low risk | 2 | 1127 | Risk Ratio (M‐H, Fixed, 95% CI) | 0.52 [0.20, 1.33] |
| 7.3 Any/mixed risk | 2 | 2723 | Risk Ratio (M‐H, Fixed, 95% CI) | 0.67 [0.35, 1.26] |
| 8 Stillbirth | 16 | 7880 | Risk Ratio (M‐H, Fixed, 95% CI) | 0.94 [0.62, 1.42] |
| 8.1 Increased/high risk | 9 | 3137 | Risk Ratio (M‐H, Fixed, 95% CI) | 1.06 [0.65, 1.72] |
| 8.2 Low risk | 5 | 2296 | Risk Ratio (M‐H, Fixed, 95% CI) | 1.13 [0.40, 3.23] |
| 8.3 Any/mixed risk | 2 | 2447 | Risk Ratio (M‐H, Fixed, 95% CI) | 0.27 [0.06, 1.27] |
| 9 Neonatal death | 9 | 7448 | Risk Ratio (M‐H, Fixed, 95% CI) | 0.61 [0.34, 1.11] |
| 9.1 Increased/high risk | 4 | 2889 | Risk Ratio (M‐H, Fixed, 95% CI) | 0.78 [0.34, 1.78] |
| 9.2 Low risk | 3 | 1424 | Risk Ratio (M‐H, Fixed, 95% CI) | 0.52 [0.19, 1.45] |
| 9.3 Any/mixed risk | 2 | 3135 | Risk Ratio (M‐H, Fixed, 95% CI) | 0.40 [0.08, 2.07] |
| 10 Low birthweight (< 2500 g) | 15 | 8449 | Risk Ratio (M‐H, Fixed, 95% CI) | 0.90 [0.82, 0.99] |
| 10.1 Increased/high risk | 7 | 4081 | Risk Ratio (M‐H, Fixed, 95% CI) | 0.96 [0.87, 1.07] |
| 10.2 Low risk | 6 | 1869 | Risk Ratio (M‐H, Fixed, 95% CI) | 0.73 [0.52, 1.02] |
| 10.3 Any/mixed risk | 2 | 2499 | Risk Ratio (M‐H, Fixed, 95% CI) | 0.63 [0.44, 0.92] |
| 11 Small‐for‐gestational age/IUGR | 8 | 6907 | Risk Ratio (M‐H, Fixed, 95% CI) | 1.01 [0.90, 1.13] |
| 11.1 Increased/high risk | 6 | 3535 | Risk Ratio (M‐H, Fixed, 95% CI) | 1.03 [0.90, 1.18] |
| 11.2 Low risk | 1 | 973 | Risk Ratio (M‐H, Fixed, 95% CI) | 1.04 [0.73, 1.48] |
| 11.3 Any/mixed risk | 1 | 2399 | Risk Ratio (M‐H, Fixed, 95% CI) | 0.89 [0.66, 1.21] |
| 12 Birthweight (g) | 43 | 11584 | Mean Difference (IV, Random, 95% CI) | 75.69 [37.84, 113.55] |
| 12.1 Increased/high risk | 19 | 4848 | Mean Difference (IV, Random, 95% CI) | 105.52 [30.84, 180.21] |
| 12.2 Low risk | 23 | 4337 | Mean Difference (IV, Random, 95% CI) | 46.63 [13.90, 79.36] |
| 12.3 Any/mixed group | 1 | 2399 | Mean Difference (IV, Random, 95% CI) | 68.0 [22.38, 113.62] |
6.1. Analysis.
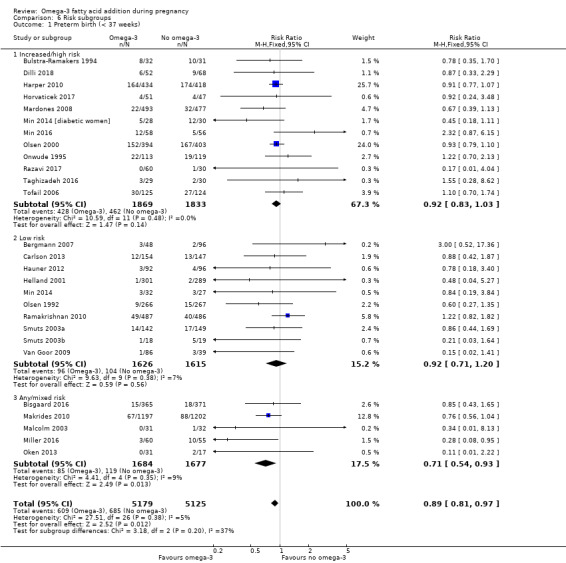
Comparison 6 Risk subgroups, Outcome 1 Preterm birth (< 37 weeks).
6.2. Analysis.
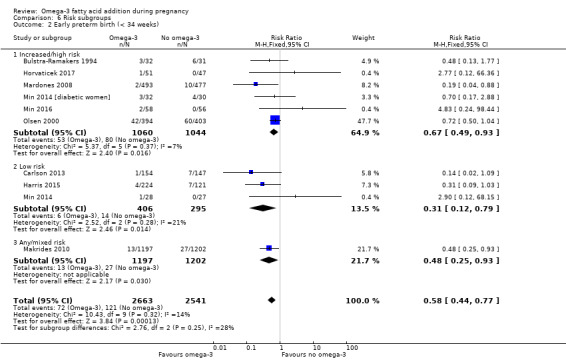
Comparison 6 Risk subgroups, Outcome 2 Early preterm birth (< 34 weeks).
6.3. Analysis.
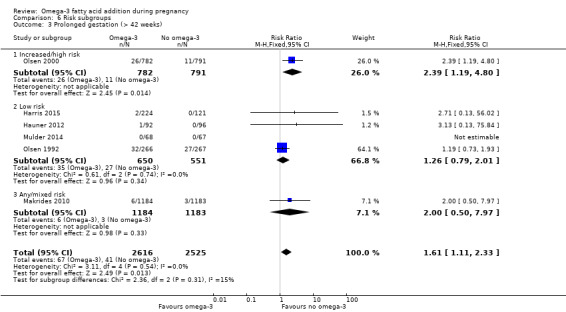
Comparison 6 Risk subgroups, Outcome 3 Prolonged gestation (> 42 weeks).
6.4. Analysis.
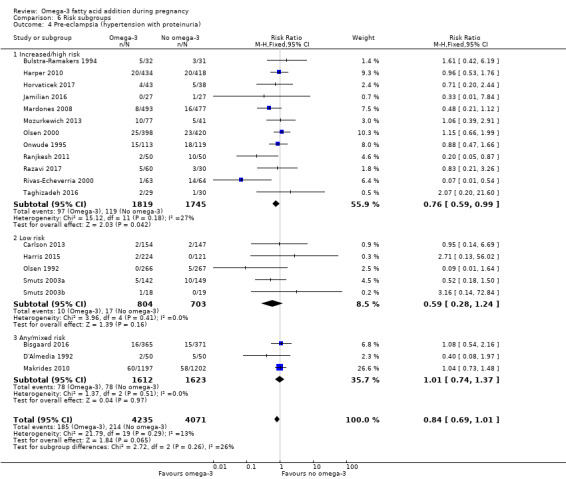
Comparison 6 Risk subgroups, Outcome 4 Pre‐eclampsia (hypertension with proteinuria).
6.5. Analysis.

Comparison 6 Risk subgroups, Outcome 5 Caesarean section.
6.6. Analysis.
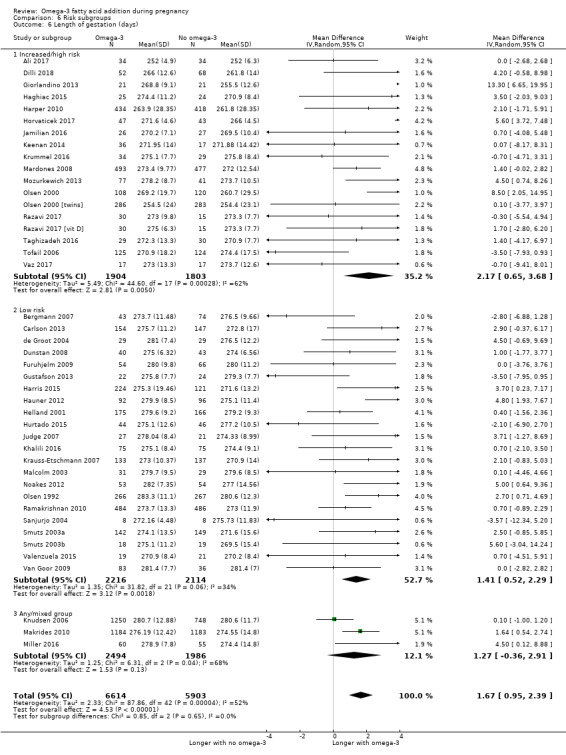
Comparison 6 Risk subgroups, Outcome 6 Length of gestation (days).
6.7. Analysis.
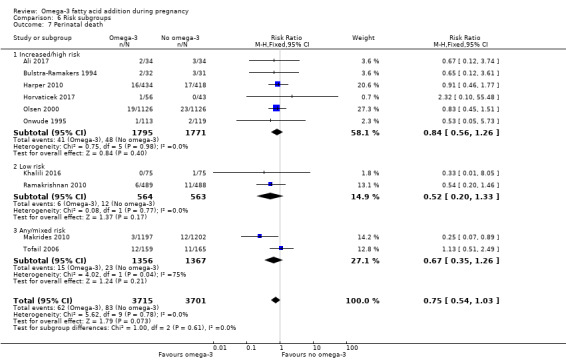
Comparison 6 Risk subgroups, Outcome 7 Perinatal death.
6.8. Analysis.
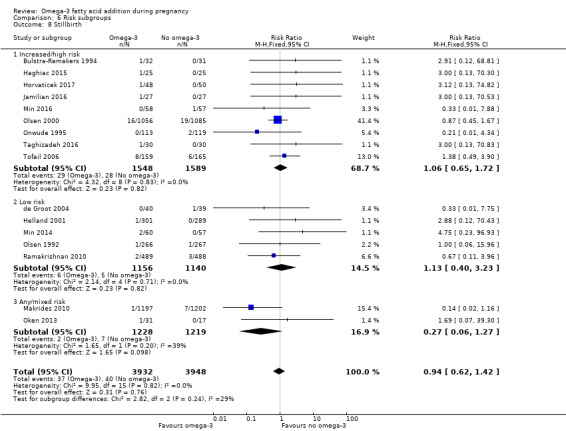
Comparison 6 Risk subgroups, Outcome 8 Stillbirth.
6.9. Analysis.
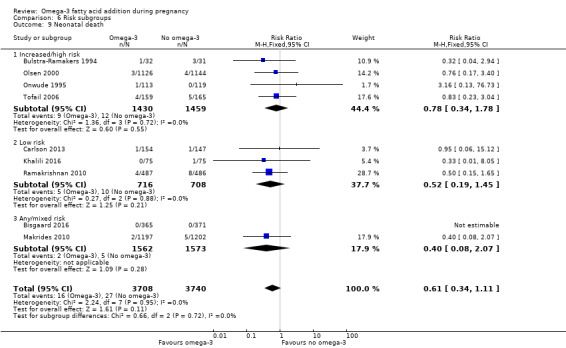
Comparison 6 Risk subgroups, Outcome 9 Neonatal death.
6.11. Analysis.
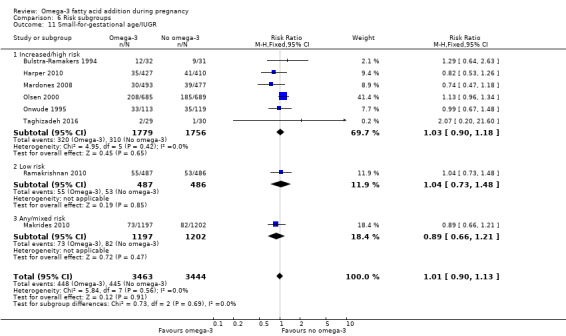
Comparison 6 Risk subgroups, Outcome 11 Small‐for‐gestational age/IUGR.
6.12. Analysis.
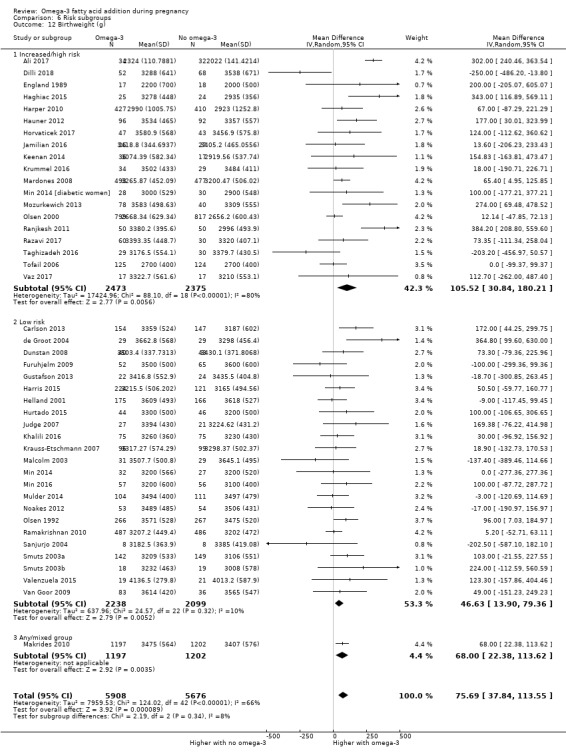
Comparison 6 Risk subgroups, Outcome 12 Birthweight (g).
Comparison 7. Omega‐3 doses: direct comparisons.
| Outcome or subgroup title | No. of studies | No. of participants | Statistical method | Effect size |
|---|---|---|---|---|
| 1 Early preterm birth < 34 weeks | 1 | 224 | Risk Ratio (M‐H, Fixed, 95% CI) | 0.91 [0.13, 6.38] |
| 2 Prolonged gestation > 42 weeks | 1 | 224 | Risk Ratio (M‐H, Fixed, 95% CI) | 0.91 [0.06, 14.44] |
| 3 Pre‐eclampsia | 1 | 224 | Risk Ratio (M‐H, Fixed, 95% CI) | 0.91 [0.06, 14.44] |
| 4 Induction (post‐term) | 1 | 224 | Risk Ratio (M‐H, Fixed, 95% CI) | 0.10 [0.01, 1.87] |
| 5 PROM | 1 | 224 | Risk Ratio (M‐H, Fixed, 95% CI) | 0.30 [0.03, 2.89] |
| 6 PPROM | 1 | 224 | Risk Ratio (M‐H, Fixed, 95% CI) | 1.22 [0.28, 5.32] |
| 7 Length of gestation | 2 | 1474 | Mean Difference (IV, Fixed, 95% CI) | 0.24 [‐1.16, 1.64] |
| 8 Birthweight (g) | 1 | 224 | Mean Difference (IV, Fixed, 95% CI) | ‐110.35 [‐242.80, 22.10] |
| 9 Length at birth (cm) | 1 | 224 | Mean Difference (IV, Fixed, 95% CI) | 0.05 [‐0.80, 0.90] |
| 10 Head circumference at birth (cm) | 1 | 224 | Mean Difference (IV, Fixed, 95% CI) | ‐0.24 [‐0.87, 0.39] |
Comparison 8. Omega‐3 type: direct comparisons.
| Outcome or subgroup title | No. of studies | No. of participants | Statistical method | Effect size |
|---|---|---|---|---|
| 1 Gestational diabetes | 2 | Risk Ratio (M‐H, Fixed, 95% CI) | Subtotals only | |
| 1.1 DHA versus EPA | 1 | 77 | Risk Ratio (M‐H, Fixed, 95% CI) | 0.15 [0.02, 1.14] |
| 1.2 DHA versus DHA/AA | 1 | 86 | Risk Ratio (M‐H, Fixed, 95% CI) | 0.33 [0.01, 7.96] |
| 2 Caesarean section | 1 | 77 | Risk Ratio (M‐H, Fixed, 95% CI) | 1.23 [0.61, 2.51] |
| 2.1 DHA versus EPA | 1 | 77 | Risk Ratio (M‐H, Fixed, 95% CI) | 1.23 [0.61, 2.51] |
| 3 Adverse events: cessation | 1 | Risk Ratio (M‐H, Fixed, 95% CI) | Subtotals only | |
| 3.1 DHA versus EPA | 1 | 77 | Risk Ratio (M‐H, Fixed, 95% CI) | 0.82 [0.24, 2.83] |
| 4 Pre‐eclampsia | 1 | 77 | Risk Ratio (M‐H, Fixed, 95% CI) | 0.26 [0.06, 1.13] |
| 4.1 DHA versus EPA | 1 | 77 | Risk Ratio (M‐H, Fixed, 95% CI) | 0.26 [0.06, 1.13] |
| 5 Blood loss at birth (mL) | 1 | 77 | Mean Difference (IV, Fixed, 95% CI) | 1.0 [‐181.94, 183.94] |
| 5.1 DHA versus EPA | 1 | 77 | Mean Difference (IV, Fixed, 95% CI) | 1.0 [‐181.94, 183.94] |
| 6 Depressive symptoms postpartum: thresholds | 1 | Risk Ratio (M‐H, Fixed, 95% CI) | Subtotals only | |
| 6.1 Major depressive disorder at 6‐8 weeks | 1 | 77 | Risk Ratio (M‐H, Fixed, 95% CI) | 0.68 [0.12, 3.87] |
| 7 Depressive symptoms postpartum: scores | 1 | Mean Difference (IV, Fixed, 95% CI) | Subtotals only | |
| 7.1 BDI: 6‐8 weeks postpartum | 1 | 77 | Mean Difference (IV, Fixed, 95% CI) | ‐1.40 [‐3.75, 0.95] |
| 8 Length of gestation (days) | 3 | Mean Difference (IV, Fixed, 95% CI) | Subtotals only | |
| 8.1 DHA versus EPA | 1 | 77 | Mean Difference (IV, Fixed, 95% CI) | 9.10 [5.24, 12.96] |
| 8.2 EPA/DHA vs ALA | 1 | 1250 | Mean Difference (IV, Fixed, 95% CI) | ‐0.29 [‐2.33, 1.75] |
| 8.3 DHA versus DHA/AA | 1 | 83 | Mean Difference (IV, Fixed, 95% CI) | 0.0 [‐3.31, 3.31] |
| 9 Baby admitted to neonatal care | 1 | 78 | Risk Ratio (M‐H, Fixed, 95% CI) | 0.35 [0.08, 1.63] |
| 9.1 DHA versus EPA | 1 | 78 | Risk Ratio (M‐H, Fixed, 95% CI) | 0.35 [0.08, 1.63] |
| 10 Birthweight (g) | 2 | Mean Difference (IV, Fixed, 95% CI) | Subtotals only | |
| 10.1 DHA versus EPA | 1 | 78 | Mean Difference (IV, Fixed, 95% CI) | 372.0 [151.90, 592.10] |
| 10.2 DHA versus DHA/AA | 1 | 83 | Mean Difference (IV, Fixed, 95% CI) | ‐79.0 [‐260.22, 102.22] |
| 11 Infant weight (kg) | 1 | Mean Difference (IV, Fixed, 95% CI) | Subtotals only | |
| 11.1 DHA versus DHA/AA | 1 | 80 | Mean Difference (IV, Fixed, 95% CI) | ‐0.20 [‐0.79, 0.39] |
| 12 Infant height (cm) | 1 | Mean Difference (IV, Fixed, 95% CI) | Subtotals only | |
| 12.1 DHA versus DHA/AA | 1 | 80 | Mean Difference (IV, Fixed, 95% CI) | ‐0.80 [‐2.50, 0.90] |
| 13 Infant head circumference (cm) | 1 | Mean Difference (IV, Fixed, 95% CI) | Subtotals only | |
| 13.1 At 18 months | 1 | 80 | Mean Difference (IV, Fixed, 95% CI) | 0.10 [‐0.45, 0.65] |
| 14 Cognition: Scores | 1 | Mean Difference (IV, Fixed, 95% CI) | Subtotals only | |
| 14.1 DHA versus DHA/AA: BSID II | 1 | 80 | Mean Difference (IV, Fixed, 95% CI) | 0.90 [‐4.71, 6.51] |
| 15 Motor: Scores | 1 | Mean Difference (IV, Fixed, 95% CI) | Subtotals only | |
| 15.1 DHA versus DHA/AA: BSID II | 1 | 79 | Mean Difference (IV, Fixed, 95% CI) | 3.40 [‐1.07, 7.87] |
| 16 Neurodevelopment | 1 | Risk Ratio (M‐H, Fixed, 95% CI) | Subtotals only | |
| 16.1 DHA versus DHA/AA: neonatal neurological classification: mildly/definitely abnormal at 2 weeks | 1 | 67 | Risk Ratio (M‐H, Fixed, 95% CI) | 0.73 [0.28, 1.87] |
| 16.2 DHA versus DHA/AA: general movement quality: mildly/definitely abnormal at 2 weeks | 1 | 67 | Risk Ratio (M‐H, Fixed, 95% CI) | 1.08 [0.68, 1.72] |
| 16.3 DHA versus DHA/AA: general movement quality: mildly/definitely abnormal at 12 weeks | 1 | 83 | Risk Ratio (M‐H, Fixed, 95% CI) | 1.81 [1.11, 2.95] |
| 17 Cerebral palsy | 1 | Risk Ratio (M‐H, Fixed, 95% CI) | Subtotals only | |
| 17.1 DHA versus DHA/AA | 1 | 80 | Risk Ratio (M‐H, Fixed, 95% CI) | 0.0 [0.0, 0.0] |
Comparison 9. Sensitivity analysis: omega‐3 versus no omega‐3.
| Outcome or subgroup title | No. of studies | No. of participants | Statistical method | Effect size |
|---|---|---|---|---|
| 1 Preterm birth (< 37 weeks) | 12 | 6718 | Risk Ratio (M‐H, Fixed, 95% CI) | 0.92 [0.83, 1.02] |
| 2 Early preterm birth (< 34 weeks) | 6 | 4073 | Risk Ratio (M‐H, Fixed, 95% CI) | 0.61 [0.46, 0.82] |
| 3 Prolonged gestation (> 42 weeks) | 3 | 4285 | Risk Ratio (M‐H, Fixed, 95% CI) | 2.32 [1.26, 4.28] |
| 4 Pre‐eclampsia (hypertension with proteinuria) | 12 | 6104 | Risk Ratio (M‐H, Fixed, 95% CI) | 1.00 [0.81, 1.25] |
| 5 Caesarean section | 12 | 5239 | Risk Ratio (M‐H, Fixed, 95% CI) | 0.96 [0.89, 1.04] |
| 6 Length of gestation (days) | 16 | 6313 | Mean Difference (IV, Fixed, 95% CI) | 1.42 [0.73, 2.11] |
| 7 Perinatal death | 5 | 4610 | Risk Ratio (M‐H, Fixed, 95% CI) | 0.60 [0.37, 0.97] |
| 8 Stillbirth | 10 | 6193 | Risk Ratio (M‐H, Fixed, 95% CI) | 0.80 [0.49, 1.31] |
| 9 Neonatal death | 6 | 4791 | Risk Ratio (M‐H, Fixed, 95% CI) | 0.56 [0.25, 1.27] |
| 10 Low birthweight (< 2500 g) | 10 | 6839 | Risk Ratio (M‐H, Random, 95% CI) | 0.87 [0.73, 1.04] |
| 11 Small‐for‐gestational age/IUGR | 6 | 5874 | Risk Ratio (M‐H, Fixed, 95% CI) | 1.03 [0.91, 1.16] |
| 12 Birthweight (g) | 18 | 7382 | Mean Difference (IV, Fixed, 95% CI) | 48.84 [22.93, 74.76] |
Characteristics of studies
Characteristics of included studies [ordered by study ID]
Ali 2017.
| Methods | RCT: NCT02696577 | |
| Participants | 80 women randomised Inclusion criteria: 20–35 years; 28‐30 weeks' gestation; pregnancy complicated with asymmetrical IUGR (diagnosed by 2D trans‐abdominal US when the abdominal circumference was reduced out of proportion to other fetal biometric parameters and was below the 10th percentile so there was an increased HC:AC ratio); with normal Doppler indices in uterine and umbilical arteries at time of recruitment (the normal value of S/D ratio was from 2.5 to 3.5; RI was from 0.60 to 0.75 and PI was from 0.96 to 1.270, respectively). Exclusion criteria: ≤ 20 and ≥ 35 years; any hypertensive disorder; diabetes mellitus; smokers; multiple gestations, low amniotic fluid volume; premature prelabour rupture of membranes; antepartum haemorrhage and fetal congenital anomalies; women with abnormal Doppler indices, absent diastolic flow or reversed flow. Setting: Assiut Woman’s Health Hospital, Egypt |
|
| Interventions |
SUPPLEMENTATION + OTHER AGENT: DHA + EPA + wheat‐germ oil + aspirin versus aspirin Group 1: fish oil (1000 mg = DHA 9%, EPA 13%) plus 100 mg wheat‐germ oil (LA 52%‐59%) as a source of vitamin E, and aspirin 81 once daily: n = 40 Group 2: aspirin 81 once daily: n = 40 Timing of supplementation: 6 weeks (from ˜28‐30 weeks GA) DHA + EPA dose/day: low: 90 mg DHA + 130 mg EPA |
|
| Outcomes |
Women/birth: gestational length; caesarean section; Doppler blood flow in uterine and umbilical arteries Babies/infants/children: birthweight; perinatal mortality; admission to NICU |
|
| Notes |
Funding: not reported Declarations of interest: none declared |
|
| Risk of bias | ||
| Bias | Authors' judgement | Support for judgement |
| Random sequence generation (selection bias) | Low risk | Computer‐generated random number table |
| Allocation concealment (selection bias) | Low risk | Quote: "Allocation concealment was done using serially numbered closed opaque envelopes. Each envelope was labelled with a serial number and had a card noting the intervention type. Allocation never changed after opening the closed envelopes" |
| Blinding of participants and personnel (performance bias) All outcomes | Unclear risk | Not reported |
| Blinding of outcome assessment (detection bias) All outcomes | Unclear risk | Not reported |
| Incomplete outcome data (attrition bias) All outcomes | Unclear risk | 12/80 (15%) participants lost to follow‐up (6/40 in both intervention (2 failure of treatment and 4 lost to follow‐up) and control group (3 failure of treatment and 3 lost to follow‐up). |
| Selective reporting (reporting bias) | Unclear risk | With no access to a trial protocol it was not possible to assess selective reporting confidently. |
| Other bias | Low risk | Baseline characteristics appeared similar, no obvious source of other bias identified. |
Bergmann 2007.
| Methods | RCT (3 arms) | |
| Participants | 144 women randomised Inclusion criteria: healthy pregnant Caucasian women at least 18 years of age and willing to breast feed for at least 3 months Exclusion criteria: increased risk of preterm birth or multiple pregnancy, allergy to cow milk protein, lactose intolerance, smoking, diabetes, consumption of alcohol > 20 g/week, or participation in another study Exclusions: infants born < 37 weeks GA, had major malformations or were hospitalised for > 1 week Setting: Virchow‐Klinikum of the Charité and other gynaecological practices in Berlin, Germany |
|
| Interventions |
SUPPLEMENTATION + OTHER AGENT: omega‐3 + prebiotic versus vitamin/mineral + prebiotic versus vitamin/mineral Group 1: 600 mg fish oil (with 200 mg DHA and low EPA) plus prebiotic (fructo‐oligosaccharide (4.5 g)) daily; delivered in a tetrabox containing 200 mL milk‐based supplement: n = 48 (40) Group 2: control/comparison intervention: vitamin and mineral supplementation with or without additional prebiotic (fructo‐oligosaccharide); delivered in a tetrabox containing 200 mL milk‐based supplement: n = 96 (48 in each group) (74) Timing of supplementation: supplementation from 22 weeks GA to 37 weeks GA, resuming at 2 weeks postpartum until 3 months DHA + EPA dose/day: low: 200 mg DHA; low EPA |
|
| Outcomes |
Women/birth: maternal weight gain (from 22 weeks GA to birth); GA; caesarean birth; breast milk composition; DHA RBC concentrations; preterm birth < 37 weeks; Babies/infants/children: birthweight, birth length and head circumference at birth, 1, 3 and 21 months; Apgar score at 5 minutes; cord blood pH; chemokines; vaccine antibody responses 6‐year follow‐up: child weight, height, head circumference, skinfold thickness |
|
| Notes |
Funding: Nestec Ltd, Switzerland; Charité University Hospitals. Supplements were prepared and donated by Nestlé Declarations of interest: none declared |
|
| Risk of bias | ||
| Bias | Authors' judgement | Support for judgement |
| Random sequence generation (selection bias) | Low risk | Quote: “randomized by a computer program” |
| Allocation concealment (selection bias) | Unclear risk | Quote: “allocated to one of three groups”; no further detail reported |
| Blinding of participants and personnel (performance bias) All outcomes | Low risk | Quote: “The identity of supplements was blinded to the subjects, support staff and investigators” |
| Blinding of outcome assessment (detection bias) All outcomes | Low risk | Not reported but probably done |
| Incomplete outcome data (attrition bias) All outcomes | Unclear risk |
|
| Selective reporting (reporting bias) | Low risk | No apparent selective outcome reporting (although reasons for exclusions differed between different follow‐up periods) |
| Other bias | Low risk | Baseline characteristics similar between groups |
Bisgaard 2016.
| Methods | RCT: NCT00798226 Children of the mothers enrolled in this RCT formed the Copenhagen Prospective Studies on Asthma in Childhood (COPSAC). |
|
| Participants | 736 women randomised Inclusion criteria: pregnant women, at least 18 years, between 22 and 26 weeks' gestation. Exclusion criteria: women taking more than 600 IU of vitamin D per day, and women with any endocrine, heart or kidney disorder. Setting: Copenhagen, Denmark (women recruited between November 2008 and November 2010). |
|
| Interventions |
SUPPLEMENTATION: EPA + DHA versus placebo Group 1: 2.4 g per day of omega‐3 LCPUFA (55% EPA and 37% DHA) in triacylglycerol form (Incromega TG33/22, Croda Health Care). The omega‐3 LCPUFA was administered in 4 identical 1 g capsules; n = 365 Group 2: placebo: olive oil, containing 72% omega‐9 oleic acid and 12% omega‐6 LA (Pharma‐Tech A/S), administered in 4 identical 1 g capsules; n = 371 Timing of supplementation: intervention was given to women during the last 3 months (third trimester) of pregnancy and continued for 1 week after giving birth. DHA + EPA dose/day: high: 890 mg DHA + 1320 mg EPA |
|
| Outcomes |
Women/birth: preterm birth (< 37 weeks); caesarean section; PE; death/serious maternal morbidity/mortality; length of maternal hospital stay Babies/infants/children: admission to NICU; neonatal death; growth, development (not yet reported) |
|
| Notes | Allergy outcomes from this trial will be reported in another Cochrane Review when it is updated (Gunaratne 2015). Funding: “No funding agency played any role in the design or conduct of the trial, the collection, management, or interpretation of the data, the preparation, review, or approval of the manuscript for publication, or the decision to submit the manuscript for publication. In addition, no pharmaceutical company that produces n‐3 [omega‐3] LCPUFA was involved in the trial. The intervention was funded solely by COPSAC” Declarations of interest: none reported |
|
| Risk of bias | ||
| Bias | Authors' judgement | Support for judgement |
| Random sequence generation (selection bias) | Low risk | Quote: “The women were randomized using a computer‐generated list of random numbers”. |
| Allocation concealment (selection bias) | Low risk | Randomisation was “prepared by an external investigator with no other involvement in the trial”. |
| Blinding of participants and personnel (performance bias) All outcomes | Low risk | For the outcomes reported and included in this review, the participants and personnel were blinded to intervention assignment. However, for the outcomes relating to the 5‐year data collection time point, only the investigators were blind to group allocations. Quote: “Neither the investigators nor the participants were aware of group assignments during follow‐up for the first 3 years of the children’s lives, after which there was a 2‐year follow‐up period during which only the investigators were unaware of group assignments”. |
| Blinding of outcome assessment (detection bias) All outcomes | Low risk | Probably done |
| Incomplete outcome data (attrition bias) All outcomes | Low risk |
Intervention: 365 women allocated to intervention, 21 withdrew during pregnancy due to intrauterine death (n = 2), disabling disease (n = 2), emigration (n = 1) and 16 were lost to follow‐up; therefore, data from 344/365 intervention group women (94.2 %) were available for inclusion in the analyses for maternal outcomes reported. There were 3 pairs of twins born to the intervention group women; therefore, data from 347 intervention group infants were available for inclusion in the analysis for infant outcomes. Control: 371 women allocated to control, 22 withdrew during pregnancy due to intrauterine death (n = 2), disabling disease (n = 2), emigration (n = 2) and 16 were lost to follow‐up; therefore, data from 349/371 control group women (94%) were available for inclusion in the analyses for maternal outcomes reported. There were 2 pairs of twins born to the control group women; therefore, data from 351 control group infants were available for inclusion in the analyses for infant outcomes. Therefore, there were limited missing outcome data, and the missing data were balanced in numbers across intervention groups, with similar reasons for missing data across groups. |
| Selective reporting (reporting bias) | Low risk | No evidence of selective reporting; data for prespecified outcomes (according to published protocol, made available as supplementary material with the online paper), have been reported. Further, the protocol provides a detailed description of the planned analysis which is reflected in the reporting of results. |
| Other bias | Low risk | Baseline characteristics were similar between groups: Quotes: “The baseline characteristics of the pregnant women and their children showed that randomisation was not biased”. No indication of difference in intervention fidelity related to different levels of adherence between the 2 groups. |
Boris 2004.
| Methods | Further randomisation (4 arms) of Olsen 1992 (supplementation until birth versus supplementation until 30 days after giving birth) | |
| Participants | 44 women randomised Inclusion criteria: healthy pregnant women Exclusion criteria: not reported Setting: Aarhus, Denmark |
|
| Interventions |
SUPPLEMENTATION: omega‐3 (until birth) versus omega‐3 (continuing for 30 days after giving birth) versus olive oil versus no supplementation Group 1: omega‐3 (1.3 g EPA and 0.9 g DHA per day) as 4 x 1 g gelatine capsules with Pikasol (Lube A/S, Hadsund, Denmark) fish oil (32% EPA (20:5n‐3), 23% DHA, and 2 mg tocopherol/mL), stopping at birth: n = 11 Group 2: omega‐3 (1.3 g EPA and 0.9 g DHA per day) as 4 x 1 g gelatine capsules with Pikasol (Lube A/S, Hadsund, Denmark) fish oil (32% EPA (20:5n‐3), 23% DHA, and 2 mg tocopherol/mL), stopping 30 days after giving birth: n = 12 Group 3: 4 x 1 g capsules of olive oil per day (72% oleic acid (18:1n‐9) and 12% LA (18:2n‐6)), stopping at birth: n = 8 Group 4: no supplement, stopping 30 days after giving birth: n = 5 Timing of supplementation: from 30 weeks GA until birth or 30 days after giving birth DHA + EPA dose/day: high: 900 mg DHA + 1300 mg EPA |
|
| Outcomes | Omega‐3 and lipid concentrations in breast milk | |
| Notes |
Funding: The University of Aarhus (Aarhus, Denmark); Lube A/S ((Hadsund, Denmark), supplied Pikasol fish oil and olive oil capsules. Declarations of interest: not reported No outcomes able to be used in this review. |
|
| Risk of bias | ||
| Bias | Authors' judgement | Support for judgement |
| Random sequence generation (selection bias) | Unclear risk | Quote: "randomly allocated" |
| Allocation concealment (selection bias) | Unclear risk | Quote: "randomly allocated" |
| Blinding of participants and personnel (performance bias) All outcomes | Unclear risk | Partial (one group not supplemented; timing for omega‐3 groups not able to be blinded) |
| Blinding of outcome assessment (detection bias) All outcomes | Unclear risk | Not reported |
| Incomplete outcome data (attrition bias) All outcomes | High risk | 3/26 in the intervention groups and 6/18 in the control groups were lost to follow‐up (no reasons reported) |
| Selective reporting (reporting bias) | Unclear risk | Insufficient detail reported to determine confidently |
| Other bias | Low risk | Groups were similar for baseline characteristics with regard to maternal age at birth, and prepregnancy weight |
Bosaeus 2015.
| Methods | RCT: PONCH (Pregnancy Obesity Nutrition and Child Health Study) | |
| Participants | 101 women randomised Inclusion criteria: pregnant women of normal weight (BMI 18.5 to 24.9), aged 20‐45 years Exclusion criteria: non‐European descent, self‐reported diabetes, use of neuroleptic drugs, and vegetarianism or veganism. Exclusion after study entry: women having a miscarriage, abortion, intrauterine fetal death, sudden infant death, twin pregnancy or giving birth before 34 weeks' gestation (n = 1 but not reported which group) Setting: Sahlgrenska University Hospital, Gothenburg, Sweden |
|
| Interventions |
DIETARY ADVICE: 3 fish meals a week versus control Group 1: dietary counselling (from registered dieticians): 3 sessions, 5 phone calls during pregnancy (from 8‐12 weeks GA). Participants were advised to eat 3 meals of fish a week, with advice on types of fish to consume to avoid pollutants, to generally lower sugar intake to reach < 10% energy; to eat 500 g of vegetables and fruits a day; to increase daily energy intake by 350 kcal in the second trimester and by 500 kcal in the third trimester: n = 49 Group 2: control group: study visit each trimester (not further described): n = 52 Timing of counselling: from 8‐12 weeks GA DHA + EPA dose/day: other: unable to determine |
|
| Outcomes |
Women/birth: fish intake; body composition; GWG; serum phospholipid fatty acids (in all 3 trimesters); fat mass (air‐displacement plethysmography); size, number and lipolytic activity of adipocytes; and adipokine release and density of immune cells and blood vessels in adipose tissue Babies/infants/children: birthweight (numerical results not reported) |
|
| Notes |
Funding: "Supported by grants from Novo Nordisk Foundation, the Swedish Research Council (No. 12206), the Swedish Research Council (Project No. 2013‐28632‐103061‐41), the Swedish Diabetes Association Research Foundation, the Swedish Federal Government under the LUA/ALF agreement, IngaBritt and Arne Lundbergs Foundation, Freemasonry Barnhus Board in Gothenburg, Olle Engkvist Building contractor Foundation (210/56) and Queen Silvia’s Jubilee Fund". Declarations of interest: none declared Women in the intervention group did not use supplements containing fish oil or omega‐3 fatty acids during pregnancy but in the control group, 1 woman in the first trimester, 2 in the second trimester and 4 women in the third trimester used these supplements. No outcomes could be used in this review. |
|
| Risk of bias | ||
| Bias | Authors' judgement | Support for judgement |
| Random sequence generation (selection bias) | Low risk | Quote: “Randomization was done by a computerized program…matched for age, BMI and parity” |
| Allocation concealment (selection bias) | Unclear risk | Not reported |
| Blinding of participants and personnel (performance bias) All outcomes | High risk | Not feasible to blind |
| Blinding of outcome assessment (detection bias) All outcomes | Unclear risk | Not reported |
| Incomplete outcome data (attrition bias) All outcomes | High risk | 66/101 (65%) attrition (complete measurements from all trimesters): 31/49 (63%) in the intervention group and 35/52 (67%) in the control group lost to follow‐up |
| Selective reporting (reporting bias) | Unclear risk | ‘Exclusions’ not always reported by intervention or control group; preterm < 37 weeks not reported; birthweight not fully reported |
| Other bias | Unclear risk | Baseline characteristics comparable except for women in the intervention reporting lower fish consumption and being shorter than women in the control group |
Bulstra‐Ramakers 1994.
| Methods | RCT | |
| Participants | 68 women randomised Inclusion criteria: women 12‐14 weeks GA with a history of IUGR (birthweight < 10th centile), ± PIH* in the previous pregnancy; or chronic renal disease or placental abnormalities of an impaired uteroplacental circulation Exclusion criteria: women with diabetes, systemic lupus erythematosus or other connective tissue disease, or women who had already agreed to be treated with low dose aspirin because of their obstetric history Setting: University Hospital and regional hospitals in the north of the Netherlands *PIH defined as an increase in diastolic pressure of at least 25 mmHg during the course of pregnancy with a final diastolic pressure > 90 mmHg. |
|
| Interventions |
SUPPLEMENTATION: EPA + DHA versus placebo Group 1: EPA (n = 34 randomised; 32 analysed): 3 g/day, given as 12 capsules/day (each capsule contained 250 mg EPA); no information about the DHA content of the capsules Group 2: 12 capsules coconut oil/day (n = 34; 31 analysed) Timing of supplementation: from 12‐14 weeks GA "onwards" ‐ until birth DHA + EPA content/day: high: DHA not stated + 3 g EPA |
|
| Outcomes |
Women/birth: PIH; preterm birth < 37 weeks; preterm birth < 34 weeks; antenatal hospitalisation; miscarriage; mode of birth; high uric acid; low platelets; 2nd trimester Hb decrease < 5%; duration of pregnancy; adverse effects Babies/infants/children: SGA (birthweight < 10th percentile); LGA (> 10th percentile); stillbirth; neonatal death; perinatal death |
|
| Notes |
Funding: not reported Declarations of interest: not reported Sample size estimate was based on the first randomised study of aspirin in high‐risk pregnancies. |
|
| Risk of bias | ||
| Bias | Authors' judgement | Support for judgement |
| Random sequence generation (selection bias) | Unclear risk | Not reported |
| Allocation concealment (selection bias) | Low risk | Quote: "Randomisation was performed by the hospital pharmacy"; placebo capsules were identical to treatment capsules |
| Blinding of participants and personnel (performance bias) All outcomes | Low risk | Identical placebos (not reported whether women could guess their treatment) |
| Blinding of outcome assessment (detection bias) All outcomes | Low risk | Outcome assessments were blinded |
| Incomplete outcome data (attrition bias) All outcomes | Unclear risk | 5/68 (7.3%) post‐randomisation exclusions: 2/34 in the EPA group due to non‐adherence and 3/34 in the placebo group (1 miscarriage and 2 due to non‐adherence). Non‐adherence was due to the perceived effects of nausea and vomiting. |
| Selective reporting (reporting bias) | Unclear risk | Most expected outcomes were reported, but GA was not reported as mean and SD. |
| Other bias | Unclear risk | Some baseline imbalance between groups: previous PIH in 24/32 women in the EPA group and 15/31 in the control group. |
Carlson 2013.
| Methods | RCT: NCT00266825 (KUDOS) | |
| Participants | 350 women randomised Inclusion criteria: women who were English speaking, between 8 and 20 weeks of gestation, between 16 and 35.99 years of age, and planning to give birth at a hospital in the Kansas City metropolitan area Exclusion criteria: carrying more than 1 fetus, had pre‐existing diabetes mellitus or SBP ≥ 140 mmHg at enrolment, or had any serious health condition likely to affect the prenatal or postnatal growth and development of their offspring, including cancer, lupus, hepatitis, HIV/AIDS, or a diagnosed alcohol or chemical dependency, BMI ≥ 40 (self‐reported); taking DHA supplement 300 mg or more/day Characteristics: baseline DHA status mean 4.3 [1] g/100 g total fatty acids; 42% women enrolled in KUDOS were African‐American which is higher than the national average of 16% Setting: Kansas City metropolitan area, KS, USA. Study conducted from January 2006 and October 2011. |
|
| Interventions |
SUPPLEMENTATION: omega‐3 (DHA) versus placebo Group 1: 600 mg DHA/day: 3 capsules/day of a marine algae‐oil source of DHA (200 mg DHA/capsule) DHASCO; n = 178 Group 2: placebo: 3 capsules containing half soybean and half corn oil. The placebo capsules did not contain DHA but did contain a‐linolenic acid; n = 172. Timing of supplementation: < 20 weeks (˜14 weeks GA) until birth DHA + EPA dose/day: mid: 600 mg DHA + EPA negligible |
|
| Outcomes |
Women/birth: adherence; DHA concentrations (maternal and cord blood); DHA concentrations (by FADS genotypes in a subset of 250 women); length of gestation; miscarriage; severe PE; gestational diabetes; caesarean section; maternal adverse effects; PPH; placental abruption; preterm birth < 37 weeks; early preterm birth < 34 weeks; low birthweight; very low birthweight; antenatal hospital admission; PPROM; GWG, costs. Babies/infants/children: birthweight; birth length; head circumference at birth; ponderal index; NICU admissions, length of hospital stay; mortality; congenital anomalies; visual habituation at 4, 6 and 9 months; and at 5 years, fat mass; fat‐free mass; body fat; weight; height, BMI Z‐score |
|
| Notes |
Adherence: "Capsule compliance was similar for the 2 groups: placebo (76% consumed) and DHA (78% consumed)”. Funding: NIH (R01 HD047315) and the Office of Dietary Supplements; Kansas Intellectual and Developmental Disabilities Research Center (P30 HD02528). DSM Nutritional Products (formerly Martek Biosciences) donated the placebo and DHA capsules. Declarations of interest: "SEC has given talks for several companies, including Martek, Mead Johnson Nutrition, and Nestle on results from our studies and the results of others who study the effects of DHA on infant and child outcomes. She is the President of the International Society for the Study of Fatty Acids and Lipids, which has corporate members who produce sources of DHA. JC consults with several companies on developmental measures to assess cognitive development of infants and children. None of the other authors declared a potential conflict of interest.” |
|
| Risk of bias | ||
| Bias | Authors' judgement | Support for judgement |
| Random sequence generation (selection bias) | Low risk | Quote: "The study biostatistician generated randomization schedules for 2 maternal age groups (16–25.99 and 26–35.99 y), and each sequence of 8 random numbers included 4 assignments per group to stratify by age and treatment” |
| Allocation concealment (selection bias) | Low risk | Quote: “The Investigational Pharmacy personnel assigned women to placebo or DHA based on the age shared by the study personnel” |
| Blinding of participants and personnel (performance bias) All outcomes | Low risk | Quote: “Participants and data collectors were blinded to allocation, as were all investigators until children were 18 mo of age and had completed early cognitive and visual acuity development testing” |
| Blinding of outcome assessment (detection bias) All outcomes | Low risk | Quote: “Participants and data collectors were blinded to allocation, as were all investigators until children were 18 mo of age and had completed early cognitive and visual acuity development testing” |
| Incomplete outcome data (attrition bias) All outcomes | Unclear risk | 24/178 (13.5%) lost from DHA group:
25/172 (14.5%) lost from placebo group:
At 5‐year follow‐up, data were available for 88 children in the omega‐3 group and 83 children in the placebo group, equating to 179/350 (51%) lost to follow‐up. |
| Selective reporting (reporting bias) | Low risk | Most expected outcomes were reported. |
| Other bias | Low risk | No apparent source of other bias. |
Chase 2015.
| Methods | RCT (pilot): NCT00333554 | |
| Participants | 41 infants (randomised during pregnancy). A further 21 mothers (˜33%) received either DHA or placebo during their last trimester, but discontinued post birth. Inclusion criteria: women 18 years of age or older, from 24 weeks GA whose babies may be at higher risk for T1D based on family history (had T1D, or child’s father or a full or half sibling of the child had T1D) Exclusion criteria: any condition investigators believed would put the mother or her fetus at an unacceptable medical risk; known complication of pregnancy causing an increased risk for the mother of fetus prior to entry into the study; have previously had 2 or more preterm births (< 36 weeks); were diabetic and had a known HbA1c > 9% at any time during the pregnancy, plan to take DHA during the pregnancy Setting: 9 clinical sites across USA |
|
| Interventions |
SUPPLEMENTATION: DHA versus placebo Group 1: algal DHA daily while pregnant and lactating (if choosing to breastfeed); 800 mg DHA per day (4 capsules); infant received ˜ 150 mg/day from mother or from formula; then 400 mg/day as toddlers (1‐2 years of age): total number randomised: n = unclear (21 reported) Group 2: corn/soy oil (placebo): total number randomised: n = unclear (16 reported) Timing of supplementation: supplementation began immediately after randomisation (start of third trimester of pregnancy) and continued at least until the HLA type of the infant was known; if an infant entered the study antenatally, duration of supplementation would be a minimum of 36 months DHA + EPA dose/day: mid: 800 mg DHA + EPA negligible |
|
| Outcomes |
Women/birth: breastmilk DHA Babies/infants/children: RBC DHA, IL 1‐betaC, CRP and other inflammatory mediators; infant vitamin D |
|
| Notes |
Funding: NIDDK branch of the NIH, the ADA, and the Juvenile Diabetes Research Foundation (JDRF). Supplements from DHASCO‐S oil, Martek Biosciences Corporation, Columbia, MD Declarations of interest: not reported No outcomes could be used in this review |
|
| Risk of bias | ||
| Bias | Authors' judgement | Support for judgement |
| Random sequence generation (selection bias) | Unclear risk | Not reported |
| Allocation concealment (selection bias) | Unclear risk | Quote: "randomly assigned" |
| Blinding of participants and personnel (performance bias) All outcomes | Unclear risk | Quote: "double blinded" |
| Blinding of outcome assessment (detection bias) All outcomes | Unclear risk | Not reported |
| Incomplete outcome data (attrition bias) All outcomes | Unclear risk | Not fully reported |
| Selective reporting (reporting bias) | Unclear risk | Limited number of outcomes reported |
| Other bias | Unclear risk | Insufficient information to determine |
D'Almedia 1992.
| Methods | RCT (3 arms) | |
| Participants | 100 women (from 2 of the 3 arms) Inclusion criteria: primiparous and multiparous women, aged 14‐40 years and ≤ 16 weeks' gestation. Exclusion criteria: none reported Characteristics: 76% had a recent history of malaria or fever of unknown origin, 34% had a history of sickle cell trait or disease, 37% had a history of anaemia, 21% had a history of pregnancy hypertension or other hypertension and 4% had a previous preterm birth. Setting: Luanda, Angola |
|
| Interventions |
SUPPLEMENTATION + OTHER AGENT: GLA + EPA + DHA (omega 6/omega 3) versus placebo Group 1: 8 capsules/day evening primrose oil + fish oil, providing a total of 296 mg GLA, 144 mg EPA and 80 mg DHA/day: total number randomised = 50 Group 2: 8 capsules olive oil/day (without vitamin E): total number randomised = 50 (The third arm (magnesium oxide: n = 50) was not considered for this review): Timing of supplementation: 6 months DHA + EPA dose/day: low: 80 mg DHA + 144 mg EPA |
|
| Outcomes | Women: PIH, PE (hypertension (rise in SBP > 30 mmHg and/or a rise in DBP > 15 mmHg); oedema (visible fluid accumulation in the ankles and feet), and proteinuria (protein > 1 determined by test tape) any time during the pregnancy), eclampsia. Babies/infants/children: birthweight (< 2000 g and > 3000 g (not used for LGA outcome)). | |
| Notes |
Funding: GLA, EPA, DHA tablets and placebo tablets were prepared by Efamol Research Institute and Efamol Ltd Declarations of interest: not reported Reported dietary intake of women in all groups at study entry was poor. |
|
| Risk of bias | ||
| Bias | Authors' judgement | Support for judgement |
| Random sequence generation (selection bias) | Low risk | Women "randomly assigned using a random number table" |
| Allocation concealment (selection bias) | Low risk | Quote: "the code of the capsules was not made known by the manufacturer, until the end of the treatment period" |
| Blinding of participants and personnel (performance bias) All outcomes | Low risk | Olive oil and evening primrose oil + fish oil capsules identical (but both different to magnesium oxide), so fully blinded with regard to the fish oil/evening primrose and placebo comparison. |
| Blinding of outcome assessment (detection bias) All outcomes | Low risk | Outcome assessments partially blinded ‐ olive oil and evening primrose oil + fish oil capsules identical (but both different to magnesium oxide), so fully blinded with regard to the fish oil/evening primrose and placebo comparison. |
| Incomplete outcome data (attrition bias) All outcomes | Unclear risk | Not specifically reported |
| Selective reporting (reporting bias) | Unclear risk | Outcomes such as preterm birth and perinatal mortality were not reported |
| Other bias | Unclear risk | Baseline nutritional profiles (determined by dietary recall) differed (placebo group higher caloric intake; higher animal protein; higher total fat; higher “fish fat”; higher cholesterol; higher fibre; higher potassium) |
de Groot 2004.
| Methods | RCT: parallel | |
| Participants | 79 women randomised Inclusion criteria: white origin, GA < 14 weeks, normal health (not suffering from any hypertensive, metabolic, cardiovascular, renal, psychiatric, or neurologic disorder), fish consumption < 2 times per week Exclusion criteria: DBP > 90 mmHg, multiple pregnancy, use of medications, use of (LC)PUFA rich supplements, origin other than Caucasian Setting: region around Maastricht, Heerlen and Sittard in the Netherlands |
|
| Interventions |
SUPPLEMENTATION/ENRICHMENT: ALA + LA versus LA (in margarine) Group 1: ALA: daily ≥ 25 g ALA‐enriched high‐LA margarine from week 14 of pregnancy until birth (with the requested intake of 25 g margarine/day women consumed 2.82 g ALA + 9.02 g LA per day) ‐ 40 women randomised; 29 analysed Group 2: No ALA: daily ≥ 25 g of high‐LA margarine without ALA from week 14 of pregnancy until birth (with the requested intake of 25 g of margarine/day women consumed 10.94 g LA and 0.03 g ALA per day) ‐ 39 women randomised; 29 analysed All women: every 3 weeks the volunteers received 3 tubs each containing 250 g margarine. Women were instructed to consume the margarine primarily on bread (if consumption was lower than required, they were advised to put it on top of potatoes or pasta; they were not allowed to use it for baking because of possible adverse effects on the polyunsaturated fatty acid content of the margarine). They were allowed to maintain their usual diets during the course of the study, with the exception of the use of butter/their usual margarine. Timing of supplementation: from 14 weeks GA to birth DHA + EPA dose/day: other (2.82 g ALA) |
|
| Outcomes |
Women/birth: maternal cognitive functioning; caesarean section; gestational diabetes; depression (postnatal); antenatal admission to hospital (long‐term hospitalisation); gestational length; fatty acid concentrations; breastfeeding Babies/infants/children: preterm birth < 36 weeks; stillbirth; birthweight; Apgar score |
|
| Notes |
Funding: grant from Unilever Research and Development (Vlaardingen, Netherlands), which also donated the margarines used in the study. Declarations of interest: none declared by authors of main reference, not reported in other references |
|
| Risk of bias | ||
| Bias | Authors' judgement | Support for judgement |
| Random sequence generation (selection bias) | Unclear risk | Quote: "randomly allocated"; no further details reported |
| Allocation concealment (selection bias) | Unclear risk | Quote: "randomly allocated"; no further details reported |
| Blinding of participants and personnel (performance bias) All outcomes | Unclear risk | Described as "double blind"; no further details reported |
| Blinding of outcome assessment (detection bias) All outcomes | Unclear risk | Not reported |
| Incomplete outcome data (attrition bias) All outcomes | High risk | 21/79 (27%) women were lost to follow‐up: 11 from the ALA group:
10 in the no ALA group:
After giving birth, a further 2 women were lost to follow‐up, both in the ALA group (1 moved away; 1 postnatal depression). |
| Selective reporting (reporting bias) | Unclear risk | Not all expected outcomes were reported; some outcomes treated as exclusions and therefore may be incompletely reported |
| Other bias | Unclear risk | More breastfeeding mothers in the ALA group |
Dilli 2018.
| Methods | RCT: NCT02371343 (MaFOS‐GDM) | |
| Participants | 140 women randomised Inclusion criteria: pregnant women, 18‐40 years old, between 24‐28 weeks GA, residents of one of the study centres, planning to remain in the area for the next year, subsequently diagnosed with gestational diabetes mellitus Setting: three tertiary maternity and children's hospitals from different regions in Turkey (trial conducted from January 2015 to January 2017) |
|
| Interventions |
SUPPLEMENTATION: EPA + DHA versus placebo Group 1: omega‐3 LCPUFA 1200 mg/day: 384 mg EPA; 252 mg DHA (Ocean Plus): n = 70 Group 2: placebo (sunflower oil ‐ similar in appearance and taste to the fish oil capsules): n = 70 Timing of supplementation: from 26‐27 weeks till birth (˜ 9 weeks) DHA + EPA dose/day: mid: 252 mg DHA + 384 mg EPA |
|
| Outcomes |
Women/birth: GWG; caesarean; preterm birth < 37 weeks Babies/infants/children: cord Insulin‐like growth factor 1 (IGF)‐1 DNA methylation; birth weight; macrosomia (> 90th percentile for GA); head circumference at birth; hospitalisation (not further specified) |
|
| Notes |
Funding: Republic of Turkey Ministry of Health Central Directorate for Health Research Declaration of interest: authors declared no conflict of interest |
|
| Risk of bias | ||
| Bias | Authors' judgement | Support for judgement |
| Random sequence generation (selection bias) | Unclear risk | Quote: "balanced blocks" |
| Allocation concealment (selection bias) | Unclear risk | Quote: "sealed envelopes" |
| Blinding of participants and personnel (performance bias) All outcomes | Low risk | Quote: placebo‐controlled |
| Blinding of outcome assessment (detection bias) All outcomes | Unclear risk | Not reported |
| Incomplete outcome data (attrition bias) All outcomes | High risk | Omega‐3 LCPUFA: 18/70 lost to follow‐up or refused to continue Placebo: 2/70 refused to continue Judged to be at high risk due to differential rates of losses between omega‐3 and placebo groups (also see other bias text). |
| Selective reporting (reporting bias) | Unclear risk | Limited number of pregnancy outcomes reported |
| Other bias | Unclear risk | No apparent evidence of other bias, though GDM was more often managed by diet only in the omega‐3 group than in the ‐placebo group |
Dunstan 2008.
| Methods | RCT: ACTRN12611000041954 | |
| Participants | 98 women randomised Inclusion criteria: all women had a history of physician‐diagnosed allergic rhinitis and/or asthma and 1 or more positive skin prick test to common allergens, but who were otherwise healthy, with healthy full‐term infants; and recruited < 20 weeks GA. Exclusion criteria: normal consumption of fish meals exceeding 2 per week, women who smoked, had other medical problems, complicated pregnancies, seafood allergy Setting: antenatal clinic, St John of God Hospital, Perth, Western Australia |
|
| Interventions |
SUPPLEMENTATION: DHA + EPA versus olive oil Group 1: omega‐3 LCPUFA: 3300 mg/day (DHA 2200 mg/day): 4 (x 1 g) omega‐3 LCPUFA capsules comprising 2.07 g DHA and 1.03 g EPA per day (total number randomised = 52) Group 2: control: 4 (x 1 g) capsules of olive oil per day containing 66.6% omega‐9 oleic acid and < 1% omega‐3 LCPUFAs (total number randomised = 46) Timing of supplementation: 20 weeks GA to birth DHA + EPA dose/day: high: 2.07 g DHA + 1.03 g EPA |
|
| Outcomes |
Women/birth: food frequency questionnaire (20 and 30 weeks GA); adherence; allergen‐specific T‐cell responses in cord blood, neonatal cord blood CD4+ T‐cell DNA methylation; fatty acid composition (including in breast milk), length of gestation, elective caesarean, spontaneous labour, induction; maternal BP; pregnancy weight gain (subsample in Keelan 2015); Beck Depression Inventory (depressed mood = score ≥ 10) (not reported by randomised groups) Babies/infants/children:
|
|
| Notes | Funding: National Health and Medical Research Council of Australia (APP139025 and APP1010495); National Heart Foundation of Australia (G 09P 4280); Raine Medical Research Foundation; Ada Bartholomew Trust; and McMaster University. Dr Janet Dunstan was supported by the Child Health Research Foundation of Western Australia Women and Infants Research Foundation. Declarations of interest: none declared | |
| Risk of bias | ||
| Bias | Authors' judgement | Support for judgement |
| Random sequence generation (selection bias) | Unclear risk | Not reported |
| Allocation concealment (selection bias) | Low risk | Quote: "Randomization and allocation of capsules occurred at a different centre separate from the recruitment of participants. Capsules were administered to the participants by someone separate from those doing the allocation"; and, “staff dispensing the capsules were blinded to the allocation”. |
| Blinding of participants and personnel (performance bias) All outcomes | Low risk | Participants, research scientists and paediatrician remained blinded to group allocations for the duration of the study. |
| Blinding of outcome assessment (detection bias) All outcomes | Low risk | Not reported but probably done |
| Incomplete outcome data (attrition bias) All outcomes | Unclear risk |
Birth: 15/98 (15%) excluded or lost to follow‐up: From the omega‐3 group 12/52 (23%):
From the placebo group 3/46 (7%):
Child follow‐up at 2.5 years: 26/98 (27%) lost to follow‐up: From the omega‐3 group 12 (plus a further 7 = 19/52 (37%)):
From the placebo group 3 (plus a further 4 = 7/52 (13%)):
|
| Selective reporting (reporting bias) | Unclear risk | Some outcomes (e.g. preterm births) treated as exclusions. |
| Other bias | Unclear risk | Possible baseline imbalance with 52 and 46 randomised. |
England 1989.
| Methods | RCT: parallel | |
| Participants | 40 women randomised Inclusion criteria: women with severe gestational proteinuric hypertension (BP > 140/90; proteinuria > 0.3 g/24 hour) Exclusion criteria: not reported Setting: University of Witwatersrand and the South African Institute for Medical Research, Johannesburg, South Africa |
|
| Interventions |
SUPPLEMENTATION: EPA versus placebo Group 1: EPA 3 g/day: total number randomised = 20* Group 2: placebo (not further described): total number randomised = 20* Timing of supplementation: not reported DHA + EPA dose/day: high: 3 g EPA; DHA not stated *assumed, not specifically stated. |
|
| Outcomes |
Women/birth: requirement for pregnancy to be terminated; mean time to termination of pregnancy; amount of proteinuria; platelet and serum membrane EPA in first 2 weeks of treatment; amount hypertensive therapy required; Babies/infants/children: birthweight |
|
| Notes |
Funding: not reported Declarations of interest: not reported |
|
| Risk of bias | ||
| Bias | Authors' judgement | Support for judgement |
| Random sequence generation (selection bias) | Unclear risk | Not reported |
| Allocation concealment (selection bias) | Unclear risk | Quote: "prospective randomized double blind trial” |
| Blinding of participants and personnel (performance bias) All outcomes | Unclear risk | Quote: "prospective randomized double blind trial”; no details about the placebo were reported. |
| Blinding of outcome assessment (detection bias) All outcomes | Unclear risk | Not reported |
| Incomplete outcome data (attrition bias) All outcomes | Unclear risk | 3/20 women in the EPA arm and 2/20 in the placebo arm required termination of pregnancy due to fulminating hypertension in the first week and were subsequently excluded from analysis. |
| Selective reporting (reporting bias) | Unclear risk | Only a few outcomes reported fully. |
| Other bias | Low risk | The 2 groups were similar in terms of maternal age, GA, level of hypertension and amount of proteinuria at baseline. |
Freeman 2008.
| Methods | RCT: parallel | |
| Participants | 59 women randomised (25 were pregnant and thus only these women were eligible for this review) Inclusion criteria: perinatal women (pregnant (n = 25) and postpartum (n = 34) with major depressive disorder, 12‐32 weeks GA or postpartum (within 6 months of childbirth); 18‐45 years of age; scored ≥ 9 on EPDS, outpatient status Exclusion criteria: previous intolerance to omega‐3 fatty acids, current use of antidepressants or anticoagulants, psychosis, diagnosis of bipolar disorder, active substance use, or active suicidal ideation. Setting: University of Arizona, USA |
|
| Interventions |
SUPPLEMENTATION: EPA + DHA versus placebo Group 1: EPA + DHA: 1.9 g/day (1.1 g EPA and 0.8 g DHA, total 4 capsules/day) for 8 weeks: total 12 pregnant women randomised Group 2: placebo: corn oil with a small amount of fish oil for 8 weeks: total 13 pregnant women randomised (9 completed study) Timing of supplementation: pregnant women: from 12‐32 weeks GA All women: were provided with manualised supportive psychotherapy DHA + EPA dose/day: high: 0.8 g DHA + 1.1 g EPA |
|
| Outcomes | Women/birth: Hamilton Rating Scale Depression (HAM‐D) biweekly; Edinburgh Postnatal Depression Scale (EPDS) biweekly; Clinical Global Impression; tolerability of omega‐3 | |
| Notes |
Funding: NIMH K23MH066265; Pronova/EPAX provided study drug and placebo at no cost. Declarations of interest: Dr Marlene Freeman: Research support: NIMH, U.S. FDA, Institute for Mental Health Research (Arizona), Forest, Reliant, Lilly; honorarium from AstraZeneca; Dr Katherine Wisner: Research support: NIMH, Stanley Medical Research Foundation, New York‐Mid Atlantic Consortium for Genetics and Newborn Screening Services (NYMAC), State of Pennsylvania, American Society for Bariatric Surgery, Pfizer, Wyeth (pending) Dr Alan Gelenberg: Consultantships: Eli Lilly, Pfizer, Best Practice, Astra/Zeneca, Wyeth, Cyberonics, Novartis, Forest, GlaxoSmithKline; Stock Options: Vela Pharmaceuticals; Speakers Bureau: Pfizer Pharmaceuticals, GlaxoSmithKline Dr Joseph Hibbeln, Dr. Priti Sinha, Dr Melinda Davis: nothing to disclose |
|
| Risk of bias | ||
| Bias | Authors' judgement | Support for judgement |
| Random sequence generation (selection bias) | Unclear risk | Described as randomised; no further details reported |
| Allocation concealment (selection bias) | Unclear risk | Described as randomised; no further details reported |
| Blinding of participants and personnel (performance bias) All outcomes | Low risk | Placebo‐controlled |
| Blinding of outcome assessment (detection bias) All outcomes | Low risk | Not reported, but probably done. |
| Incomplete outcome data (attrition bias) All outcomes | High risk | 7/59 women dropped out after the baseline visit; a further woman was diagnosed with hyperthyroidism after randomisation and was then excluded as being ineligible (leaving 51 women who completed at least 2 assessments) – 21 of these women were pregnant meaning 4/25 (16%) pregnant women were lost to follow‐up (all 4 were from the placebo group). |
| Selective reporting (reporting bias) | High risk | Few outcomes were reported |
| Other bias | Unclear risk | Some baseline differences – omega‐3 group more likely to be Caucasian; and to enrol earlier in their pregnancy and more likely to take antidepressants |
Furuhjelm 2009.
| Methods | RCT: NCT00892684 | |
| Participants | 145 women randomised Inclusion criteria: women affected by allergies themselves, or having a husband or an older child with current or previous allergic symptoms, i.e. bronchial asthma diagnosed by a doctor, atopic eczema, allergic food reactions, itching and running eyes and nose on exposure to pollen, pets or other known allergens. Exclusion criteria: mothers with an allergy to soy or fish or undergoing treatment with anticoagulants or commercial omega‐3 fatty acid supplements Characteristics: 73% of women in the omega‐3 group and 63% in the placebo group had allergic symptoms; average registered dietary intake of DHA and EPA at inclusion was 0.2 g/day and 0.1 g/day, respectively, thus the daily dose of omega‐3 LCPUFA was increased 8–10 times by the supplementation (this corresponds to a meal of approximately 100 g salmon daily). Setting: Linköping and Jönköping, Sweden |
|
| Interventions |
SUPPLEMENTATION: EPA + DHA versus placebo (soy oil) Group 1: EPA/DHA: 9 x 500 mg capsules a day containing 35% EPA, and 25% DHA, to provide 1.6 g of EPA and 1.1 g of DHA; plus 28 mg alphatocopherol: total number randomised = 70 Group 2: placebo: 9 soy oil capsules a day, containing 58% LA to provide 2.5 g LA/day and 6% ALA to provide 0.28 g ALA/day, plus 36 mg alphatocopherol: total number randomised = 75 Timing of supplementation: 25 weeks GA to birth, and encouraged to continue during lactation (average 3‐4 months). DHA + EPA dose/day: high: 1.1 g DHA + 1.6 g EPA |
|
| Outcomes |
Women/birth: GA at birth; maternal BMI at end of gestation; breastfeeding duration; diet at 6 months postpartum Babies/infants/children: birthweight; Apgar scores at 10 minutes; medically diagnosed allergy outcomes at 3, 6, 12 months and 2 years of age including: IgE antibody analysis, food allergy and eczema |
|
| Notes |
Funding: Medical Research Council of Southeast Sweden (FORSS), The Östergötland County Council, The Ekhaga Foundation, Swedish Asthma and Allergy Association, The Swedish Research Council for Environment, Agricultural Sciences and Spatial Planning (FORMAS), The Swedish Society of Medicine and Glaxo Smith Kline, Sweden; Bio Marin capsules were supplied at a reduced price from Pharma Nord, Denmark. Declarations of interest: none declared |
|
| Risk of bias | ||
| Bias | Authors' judgement | Support for judgement |
| Random sequence generation (selection bias) | Unclear risk | Quote: "block randomization" |
| Allocation concealment (selection bias) | Unclear risk | Quote: "randomly allocated" |
| Blinding of participants and personnel (performance bias) All outcomes | Low risk | Placebo‐controlled; however women may have been able to detect if they were in the omega‐3 group through fishy burps. |
| Blinding of outcome assessment (detection bias) All outcomes | Low risk | Outcome assessors were blinded. |
| Incomplete outcome data (attrition bias) All outcomes | Unclear risk | Total 28/145 (19%) women not included in analysis: 25 women did not complete the requested 15 week intervention period (16, 23% omega‐3 and 9, 12% placebo) and were excluded from the analysis, 1 withdrew postpartum, 2 not followed as moved (group not stated). 2 year follow‐up: 17/70 omega‐3 group (24%) and 12/75 (16%) placebo group were lost to follow‐up |
| Selective reporting (reporting bias) | Unclear risk | Mostly allergy outcomes; some child development outcomes not fully reported |
| Other bias | Low risk | Maternal LA and AA levels at study entry inclusion were not equal in the 2 groups |
Giorlandino 2013.
| Methods | RCT: ISRCTN39268609 | |
| Participants | 43 women randomised Inclusion criteria: women at high risk of preterm birth (history of previous IUGR, fetal demise or PE) with 1 or more previous preterm birth and/or ultrasonographic findings of cervical incompetence Exclusion criteria: a non‐viable fetus (before or after randomisation), a history of placental abruption, bleeding episode in the present pregnancy, use of (or used) PG inhibitors, multiple pregnancy, allergy to fish, regular intake of fish oil, a positive cervical swab for chlamydia, mycoplasma/ureaplasma and bacterial vaginosis infections, major fetal abnormalities. Setting: Artemisia Medical Centre, Rome, Italy |
|
| Interventions |
VAGINAL APPLICATION: DHA versus placebo Group 1: DHA (1 g/day) vaginally: n = 22 Group 2: placebo vaginally: n = 21 Timing: from 21 weeks to 37 weeks 0 days DHA + EPA dose/day: high: 1 g DHA |
|
| Outcomes |
Women/birth: GA at birth Babies/infants/children: birthweight |
|
| Notes | Funding: Pharmarte Srl (Italy) and sponsors Italian Society of Prenatal Diagnosis and Fetal Maternal Medicine (S.I.Di.P.) (Italy) and the Artemisia Foundation in Fetal‐Maternal Medical Research. The authors report that the funders had no role in data collection, data analysis, data interpretation or writing of the report. Declarations of interest: not reported | |
| Risk of bias | ||
| Bias | Authors' judgement | Support for judgement |
| Random sequence generation (selection bias) | Low risk | Quote: "customised randomisation programme that generated a random number for each participant, with equal ratio of selection" |
| Allocation concealment (selection bias) | Unclear risk | Not reported |
| Blinding of participants and personnel (performance bias) All outcomes | Low risk | Physicians and women were blinded to treatment. |
| Blinding of outcome assessment (detection bias) All outcomes | Low risk | Not reported, but probably done. |
| Incomplete outcome data (attrition bias) All outcomes | Unclear risk | 1 woman in the omega‐3 group was lost to follow‐up (1/22); and women whose condition worsened were taken off treatment (1/22 in the omega‐3 group and 7/21 in the placebo group). |
| Selective reporting (reporting bias) | Unclear risk | Birthweight was only reported for women who gave birth at 37 weeks' gestation or later (and was therefore not included in the meta‐analysis). |
| Other bias | Low risk | No apparent risk of other bias. |
Gustafson 2013.
| Methods | RCT: NCT01007110 (HOPE) | |
| Participants | 67 women randomised Inclusion criteria: women 16 to < 40 years old with a singleton pregnancy, 12‐20 weeks GA Exclusion criteria: any serious health condition likely to affect the growth and development of the fetus or the health of the mother including cancer, lupus, hepatitis, diabetes mellitus (type 1, 2 or gestational) or HIV/AIDS at baseline. Women who self‐reported illicit drug use or alcohol use during pregnancy and those with hypertension or BMI ≥ 40 were excluded. Women who were taking more than 200 mg/day DHA in prenatal vitamins or over‐the‐counter supplements were excluded from participation. Setting: Kansas City, Kansas, USA |
|
| Interventions |
SUPPLEMENTATION: DHA versus placebo Group 1: DHA 600 mg/day: contained 500 mg of oil: algal oil as a source of DHA (200 mg of DHA per capsule; 3 capsules a day): total number randomised = 35 Group 2: placebo (3 placebo capsules a day containing 50% soy and 50% corn oil): total number randomised = 32 Timing of supplementation: 14.4 weeks GA ± 4 weeks; women were advised to stop taking capsules once they had given birth DHA + EPA dose/day: mid: 600 mg DHA + EPA negligible |
|
| Outcomes |
Women/birth: DHA RBC concentrations; GA at birth Babies/infants/children: fetal heart rate, heart rate variability (at 24, 32 and 36 weeks GA); birthweight; birth length; DHA RBC concentrations; NBAS at 1‐14 days postpartum |
|
| Notes |
Funding: Eunice Kennedy Shriver National Institute of Child Health and Development, Kansas Intellectual Development and Disabilities Research Center; study product donated by DSM Nutritional Products (P30NICHDHD002528). Declarations of interest: not reported |
|
| Risk of bias | ||
| Bias | Authors' judgement | Support for judgement |
| Random sequence generation (selection bias) | Low risk | Computer‐generated random sequence |
| Allocation concealment (selection bias) | Low risk | Quote: “only members of the investigational pharmacy knew the subject allocation” |
| Blinding of participants and personnel (performance bias) All outcomes | Low risk | Participants and all members of the investigational team were blinded to the intervention assignment. |
| Blinding of outcome assessment (detection bias) All outcomes | Unclear risk | Not reported ‐ insufficient information to make any judgement. |
| Incomplete outcome data (attrition bias) All outcomes | Unclear risk | 33% loss to follow‐up overall: to birth (23/69): In the control group, 8/32 (25%):
In the DHA group: 13/35 (37%):
NBAS: a further 12 from the control group and a further 7 from the DHA group did not have NBAS assessments |
| Selective reporting (reporting bias) | High risk | Few maternal and birth outcomes reported |
| Other bias | Low risk | Maternal characteristics at trial entry were similar, no other sources of bias were apparent. |
Haghiac 2015.
| Methods | RCT: NCT00957476 | |
| Participants | 72 women randomised Inclusion criteria: overweight/obese pregnant women (BMI ≥ 25 at first antenatal visit); singleton pregnancy and GA between 8 weeks and 16 weeks Exclusion criteria: known fetal anomaly, regular intake of fish oil supplements (> 500 mg per week in the previous 4 weeks), daily use of NSAIDs; pre‐existing metabolic disorder such as hypertension, diabetes or hyperthyroidism; allergy to fish or fish products; gluten intolerance; women who are vegetarians and do not eat any fish; planned termination of pregnancy or birth at another hospital; known HIV‐positive, illicit drug or alcohol use during current pregnancy Setting: MetroHealth Medical Center, Ohio, USA (participants recruited September 2009 to August 2011) |
|
| Interventions |
SUPPLEMENTATION: DHA + EPA versus placebo Group 1: DHA plus EPA (total 2 g/day): 800 mg DHA (22:6n‐3) and 1200 mg EPA (20:5n‐3): 4 capsules (2 x twice a day). Total number randomised: n = 36 (25) Group 2: placebo (2 capsules twice a day); contains wheat germ oil. Total number randomised: n = 36 (25) Timing of supplementation: weeks 10‐16 to term DHA + EPA dose/day: high: 800 mg DHA + 1200 mg EPA |
|
| Outcomes |
Women/birth: length of gestation; maternal plasma omega‐3 and omega‐6 concentrations; CRP; TLR4, IL6, IL8 (in adipose and placental tissue); glucose concentrations; insulin sensitivity (narrative report only); adiponectin; leptin; spontaneous abortions; stillbirth; gestational diabetes; placental gene expression; placental triglycerides Babies/infants/children: birthweight; neonatal lean mass; fat mass; body fat; pea pod lean mass; pea pod fat mass; pea pod body fat |
|
| Notes |
Notes relating to intervention: adherence run‐in: consenting eligible women were given 1 week’s supply of placebo capsules; they were not allowed to participate in the trial if they did not return or if they had taken < 50% of the placebo capsules. Funding: NIH RHD057236. Emiment supplied the study supplements. Declarations of interest: "The authors declared that they have no conflicts of interest". |
|
| Risk of bias | ||
| Bias | Authors' judgement | Support for judgement |
| Random sequence generation (selection bias) | Low risk | Computerised random number generation |
| Allocation concealment (selection bias) | Low risk | Quote: "Randomization and treatment assignment were carried out by the research coordinators" Probably done |
| Blinding of participants and personnel (performance bias) All outcomes | Low risk | Quote: "Study group assignment was not known by study participants, their health care providers, or the research staff" |
| Blinding of outcome assessment (detection bias) All outcomes | Low risk | Not reported but probably done |
| Incomplete outcome data (attrition bias) All outcomes | High risk | 21/72 (29%) attrition: Omega‐3 group, lost 10:
Control group, lost 11:
|
| Selective reporting (reporting bias) | Unclear risk | Few maternal, birth and neonatal outcomes reported |
| Other bias | Unclear risk | Baseline characteristics were similar except for higher average weight (but not BMI) in the omega‐3 group. |
Harper 2010.
| Methods | RCT: NCT00135902 | |
| Participants | 852 women randomised Inclusion criteria: women with at least 1 prior spontaneous preterm birth; singleton pregnancies; GA at randomisation between 16 and 22 (21 6/7) weeks. An US examination was required between 14 weeks GA and enrolment to screen for major anomalies. Exclusion criteria: major fetal anomaly or demise; regular intake of fish oil supplements (> 500 mg per week at any time during the preceding month); daily use of NSAIDs; allergy to fish or fish products; gluten intolerant; heparin use or known thrombophilia; haemophilia; planned termination; current hypertension or current use of antihypertensive medications; uncontrolled thyroid disease; type D, F or R diabetes; maternal medical complications; current or planned cerclage; illicit drug or alcohol abuse during current pregnancy; plan to, or give birth at a non‐network hospital; participation in another pregnancy intervention study; participation in this trial in a previous pregnancy; seizure disorder. Characteristics: 30% women never consumed fish or consumed fish < once per month; 9% consumed fish > 3 times a week. Setting: antenatal clinics in 13 network centres, USA: recruitment between January 2005 and October 2006 |
|
| Interventions |
SUPPLEMENTATION: DHA + EPA + PG versus placebo + PG Group 1: 1200 mg EPA; 800 mg DHA for a total of 2000 mg of omega‐3 long‐chain polyunsaturated acids, divided into 4 capsules per day: total number randomised: n = 434 (Source of omega‐3 LCPUFA was deep ocean fish; each capsule contained 10 IU of vitamin E as a preservative.) Group 2: matching placebo (4 capsules containing a minute amount of inert mineral oil per day). Total number randomised: n = 418 Timing of supplementation: 16‐22 weeks GA (mean 19.6 weeks) to 36 weeks GA All women: received 17α‐hydroxyprogesterone caproate (weekly intramuscular injections: 250 mg); participants received no dietary advice as part of the study and otherwise received usual clinical care. DHA + EPA dose/day: high: 800 mg DHA + 1200 mg EPA |
|
| Outcomes |
Women/birth: fatty acid status; diet (fish intake); DNA; PE; PPH; adverse events; gestational diabetes; preterm birth < 37 weeks; spontaneous preterm birth < 37 weeks; preterm birth < 34 weeks; birth > 40 weeks; low birthweight < 2500 g; SGA; LGA; GA reported as IQR Babies/infants/children: birthweight (median); NEC; RDS (clinical diagnosis of RDS and oxygen therapy (FiO2 > 0.40); neonatal sepsis; BPD; ROP, IVH, perinatal mortality (pregnancy loss and neonatal death); NICU/intermediate care nursery admission; neonatal morbidity composite (ROP, grade III or IV IVH, Patent ductus arteriosus, NEC, culture‐proven sepsis, respiratory morbidity, and perinatal death) |
|
| Notes |
Compliance run‐in: consenting women received an injection of 250 mg 17α‐hydroxyprogesterone caproate (17P) and a 7‐day supply of placebo capsules. Those who did not return after 5 days and before 21 6/7 weeks GA or had taken < half of the placebo capsules were not allowed to participate. Women passing the compliance run‐in were randomly assigned to EPA/DHA or placebo. Funding: The Eunice Kennedy Shriver National Institute of Child Health and Human Development Grants (HD27860, HD27917, HD40560, HD34208, HD40485, HD21410, HD27915, HD40500, HD40512, HD40544; MO1‐RR‐000080; HD34136; HD27869; HD40545; HD36801 and HD19897). Declarations of interest: "Dr Esplin serves on the scientific advisory board and holds stock in Sera Prognostics, a private company that was established to create a commercial test to predict preterm birth and other obstetric complications. Dr Manuck is also on the scientific advisory board for Sera Prognostics". None of the other authors reported any conflicts of interest. |
|
| Risk of bias | ||
| Bias | Authors' judgement | Support for judgement |
| Random sequence generation (selection bias) | Low risk | Quote: “randomly assigned”; “simple urn method of randomization with stratification according to clinical center to create a randomization sequence for each center” |
| Allocation concealment (selection bias) | Low risk | Quote: “randomly assigned”; “simple urn method of randomization with stratification according to clinical center to create a randomization sequence for each center” |
| Blinding of participants and personnel (performance bias) All outcomes | Low risk | Quote: “double‐masked”; "Study group assignment was not known by study participants, their health care providers or the research personnel”; placebo control |
| Blinding of outcome assessment (detection bias) All outcomes | Low risk | After giving birth, “records of the participants and their newborns were reviewed by study personnel, unaware of treatment assignments, who abstracted delivery date, birth weight, occurrence of maternal or neonatal complications and interventions” |
| Incomplete outcome data (attrition bias) All outcomes | Low risk | No losses to follow‐up (for primary outcome) Denominators for liveborns = 427 and 410 (2 neonates in the omega‐3 group and 7 in the placebo group died before admission to NICU and were not included in liveborn neonate outcomes). |
| Selective reporting (reporting bias) | Low risk | Large number of relevant outcomes reported (some as medians). |
| Other bias | Low risk | Baseline demographics, risk factors for recurrent preterm birth and dietary fish intake were similar between omega‐3 and placebo groups. |
Harris 2015.
| Methods | RCT: 3 arms (and a non‐randomised 4th arm): NCT02219399 | |
| Participants | 843 pregnant women randomised (634 to the 3 supplement arms and 209 to the single nutrition arm) Inclusion criteria: women recruited at 16‐20 weeks of gestation or at WIC intake visits with singleton pregnancies; 18 to 40 years of age, able to sign informed consent and Health Insurance Portability and Accountability Act forms in English or Spanish Exclusion criteria: women presenting with known medical or obstetrical complications associated with increased risk for preterm birth including cervical incompetence, presence of cervical cerclage, placenta praevia, intrauterine infection, known substance abuse, multiple fetuses, current PE, pre‐existing diabetes, or a history of gestational diabetes in a prior pregnancy. Women were also excluded if they were taking NSAIDS or if they consumed salmon, mackerel, rainbow trout, or sardines at least once weekly or if they had known allergies to fish or any constituent of the nutritional supplement. Characteristics: low‐income population, but at lower risk of preterm birth with predominantly Hispanic women included Setting: antenatal clinics, Denver Health Hospitals (Denver, Colorado, USA) |
|
| Interventions |
SUPPLEMENTATION: DHA, 300 mg versus 600 mg, as bars) versus placebo Group 1: supplementation: 300 mg algae‐derived DHA (200 women randomised) – provided in the form of 300 Kcal supplement bars containing DHASCO‐S oil (DHA single‐cell oil) Group 2: supplementation: 600 mg of algae‐derived DHA (221 women randomised) – provided in the form of 300 Kcal supplement bars containing DHASCO‐S oil (DHA single‐cell oil) Group 3: placebo: olive oil (213 women randomised) – provided in the form of 300 Kcal supplement bars All women: gel capsules containing the test oil or olive oil were available for those who refused the bars (51 women opted for gel capsules ‐ groups not reported). Timing of supplementation: from 20 weeks GA to birth DHA + EPA dose/day: low and mid: 300 mg and 600 mg DHA/day + negligible EPA |
|
| Outcomes |
Women/birth: adherence; DHA concentrations at birth; dietary intake of DHA‐rich foods; adverse events (including vaginal infection, vaginal bleeding during pregnancy and preterm labour); GA at birth; preterm birth < 34 weeks (preterm birth < 280 days was reported but not by group); post‐term birth; mode of birth; type of rupture of membranes; type of labour onset; estimated blood loss; birth complications. Babies/infants/children: birthweight; birth length; head circumference |
|
| Notes |
Funding: United States Department of Agriculture. Bars and gel capsules were supplied by Martek Biosciences, Columbia, MD, USA. Declarations of interest: none reported |
|
| Risk of bias | ||
| Bias | Authors' judgement | Support for judgement |
| Random sequence generation (selection bias) | Low risk | Quote: “stratified block randomization schedule, generated using a randomization table by staff at Martek Biosciences, to insure equal group assignment from each of three clinics participating in the supplement trial” |
| Allocation concealment (selection bias) | Low risk | As above; probably adequate allocation concealment (third party) |
| Blinding of participants and personnel (performance bias) All outcomes | Low risk | Both participants and all study personnel were blinded. |
| Blinding of outcome assessment (detection bias) All outcomes | Low risk | Not reported, but probably done. |
| Incomplete outcome data (attrition bias) All outcomes | High risk | 53.5% and 52.9% were lost to follow‐up from the 2 intervention arms (leaving 107/200 in the 300 mg DHA arm and 117/221 in the 600 mg DHA arm: 56.8% (121/213) were lost to follow‐up from control arm. Reasons were not given. |
| Selective reporting (reporting bias) | Unclear risk | Insufficient information to make judgement; preterm birth not fully reported |
| Other bias | Low risk | Comparable baseline characteristics for total fatty acids, maternal BMI and maternal age, parity and previous preterm birth (and for completers and withdrawals) |
Hauner 2012.
| Methods | RCT: NCT00362089 (INFAT ‐ The Impact of Nutritional Fatty acids during pregnancy and lactation for early human Adipose Tissue development) | |
| Participants | 208 women randomised Inclusion criteria: healthy pregnant women < 15 weeks GA, aged 18‐43 years, BMI at conception between 18 and 30, sufficient German language; for infants at follow‐up, GA at birth between 37‐42 weeks, appropriate size for GA, and Apgar score > 7 at 5 minutes Exclusion criteria: high‐risk pregnancy (multiple pregnancy, hepatitis B or C infection, parity > 4), hypertension, chronic diseases such as diabetes or gastrointestinal disorders, psychiatric disorders, supplementation with omega‐3 fatty acids before randomisation, alcohol abuse, hyperemesis gravidarum, smoking; known metabolic defects Characteristics: mean baseline BMI of 22; women were relatively well educated Setting: University Hospital Klinikum rechts der Isar, Technische Universität München, Germany (women recruited between 2006 and 2009) |
|
| Interventions |
SUPPLEMENTATION + DIET ADVICE: DHA + EPA + diet advice versus diet advice Group 1: omega‐3 LCPUFA (180 mg EPA and 1020 mg DHA (= 1200 mg omega‐3) and 9 mg vitamin E), taken as 3 capsules per day and requested to restrict consumption of AA‐rich foods (e.g. meat (500 g a week = 2‐3 portions), meat products and eggs); n = 104 Group 2: brief semi‐structured counselling on a healthy diet according to the guidelines of the German Nutrition Society for a healthy balanced diet; women in the control group were specifically asked to refrain from taking fish oil or DHA supplements: n = 104 All women: participants of both groups were also offered individual nutrition counselling based on the 7‐day dietary record. Timing of supplementation: women were randomised and began the study at 15 weeks GA and continued supplementation until 4 months lactating (or time when ceased breastfeeding if earlier) DHA + EPA dose/day: high: 1020 mg DHA + 180 mg EPA |
|
| Outcomes |
Women: adherence; preterm birth; post‐term birth; induction (all at term); GWG; blood loss at birth; gestational diabetes; pathological cardiotocography; cessation of labour; retained placenta; mode of birth (spontaneous birth, caesarean section, vacuum extraction); breastfeeding; blood lipid concentrations (triglycerides, total cholesterol, high‐ and low‐density lipoproteins) at baseline, 32 weeks GA, birth, 6 weeks and 4 months postpartum in pregnant and lactating women; leptin; fatty acid pattern in erythrocytes and plasma in maternal blood as well as umbilical cord blood samples and adipokines in maternal plasma, as well as umbilical cord plasma samples and breastmilk samples at 6 weeks and 4 months; maternal 7‐day dietary questionnaire (energy, protein, carbohydrates, lipids, AA); maternal plasma levels of DHA, EPA and AA reported as per cent weight of total fatty acids; maternal RBC fatty acid baseline (16‐21 weeks GA) – before study drug was dispensed (reported in Hauner 2009 only by fish consumption), insulin resistance; maternal leptin; cord blood insulin concentrations Babies/infant/children: Apgar score; LGA > 90th percentile; adipose tissue mass (skinfold thickness) 3‐5 days after birth, 6 weeks, 4 and 12 months postpartum; subgroup: subcutaneous and visceral fat mass ultrasonography at 6 weeks, 4 and 12 months postpartum and MRI at 6 weeks and 4 months postpartum; birthweight; birth length; head circumference; upper arm circumference); body weight and length, head circumference and upper arm circumference, BMI (kg/m²) ‐ all at birth/3‐5 days after birth, 6 weeks, 4 and 12 months postpartum; weight/length (g/cm) at birth; ponderal index (kg/m³) at birth; fetal leptin; annual body‐composition measurements including skinfold thickness measurements (primary outcome) ‐ up to 5 years, a sonographic assessment of abdominal subcutaneous and preperitoneal fat, and child growth at 2, 3, 4 and 5 years (weight, height, head circumference, BMI percentile, waist circumference); abdominal MRI was performed in a subgroup of 5‐year‐old children; dietary intake at 3, 4 and 5 years; physical activity at 3, 4 and 5 years; Child Development Inventory at 4 and 5 years; hand movement test at 5 years (mirror movements reported as medians). |
|
| Notes |
Funding: Else Krӧner‐Fresenius Foundation, Bad Hamburg, the International Unilever Fund, EU‐funded EARNEST Consortium (subcontractor Numico, Frankfurt), and the German Ministry of Education and Research via the Competence Network on Adiposity; Danone Research‐Centre for Specialised Nutrition, Friedrichsdorf, Germany. The analysis of fatty acids was performed by the laboratory of Lipid Research, Danone Research–Centre for Specialised Nutrition by using coded samples. "There was no intervention from any sponsor with any of the research aspects of the study including study design, intervention, data collection, data analysis and interpretation as well as writing of the manuscript." "Danone as a Funding source and cooperation partner in fatty acid analysis was recruited after the study design was fully established." Declarations of interest: "HH has received grants from Riemser and Weight Watchers for clinical trials and payment for lectures from Novartis, Roche Germany, and Sanofi‐Aventis". The other authors reported no conflicts of interest related to the study. |
|
| Risk of bias | ||
| Bias | Authors' judgement | Support for judgement |
| Random sequence generation (selection bias) | Low risk | Computerised randomisation |
| Allocation concealment (selection bias) | Unclear risk | Quote: “randomly assigned” |
| Blinding of participants and personnel (performance bias) All outcomes | High risk | Not blinded; “open label” |
| Blinding of outcome assessment (detection bias) All outcomes | High risk | No (except for US measurements, e.g. for fat mass measurements) |
| Incomplete outcome data (attrition bias) All outcomes | High risk | Omega 3: 17/104 (16%) lost at 12 months postpartum:
Control: 21/104 (20%) lost at 12 months:
2 years and longer:
Unclear why 3/4 preterm births in the control group were treated as exclusions, whereas none of the 3 preterm births in the omega‐3 group were. |
| Selective reporting (reporting bias) | Unclear risk | Focus on biochemical and skinfold measurements rather than clinical outcomes |
| Other bias | Unclear risk | Baseline demographics and characteristics were comparable, except for higher rates of smoking and alcohol use during pregnancy in the control group. |
Helland 2001.
| Methods | RCT | |
| Participants | 590 women Inclusion criteria: healthy women 19‐35 years of age with singleton pregnancies, nulliparous or primiparous, intending to breastfeed, no omega‐3 supplementation earlier in the pregnancy, 17‐19 weeks' gestation Exclusion criteria: already taking DHA, preterm births, birth asphyxia, general infections, anomalies in infants requiring special attention Setting: attendance at routine US scans, Rikshospitalet University Hospital and Baerum Central Hospital, Oslo, Norway; women recruited between December 1994 to October 1996. |
|
| Interventions |
SUPPLEMENTATION: DHA + EPA (cod‐liver oil) versus placebo (corn oil) Group 1: cod‐liver oil (10 mL = 1183 mg DHA, 803 mg EPA (total omega‐3 LCPUFA 2494 mg); total number randomised: n = 301 Group 2: liquid oil (corn oil); (10 mL = 4747 mg LnA, 92 mg ALA); total number randomised: n = 289 Fat‐soluble vitamin content was identical for both groups (117 µg/mL vitamin A; 1 µg/mL vitamin D; 1.4 mg/mL dl‐α); cod‐liver oil added 42 mg cholesterol per 10 mL. Timing of supplementation: 18 weeks GA to 3 months infant age DHA + EPA dose/day: high: 1183 mg DHA + 803 mg DHA |
|
| Outcomes |
Women: length of gestation; maternal and infant diet (food frequency questionnaires); placental weight; fatty acids in breast milk; breastfeeding; BMI at birth Babies/infants/children: birthweight; birth length; head circumference at birth; fatty acids (cord blood and infants at 4 weeks and 3 months); electroencephalography (2 days and 3 months); Fagan (infant intelligence) (6 and 9 months); K‐ABC (IQ) (4 and 7 years) |
|
| Notes |
Funding: Peter Möller (Oslo, Norway) provided both oils; Orkla ASA; Eckbos Legater; Aktieselskabet Freia Chocolade‐fabriks Medicinske Fond Declarations of interest: Dr Helland's scholarship during the study period was funded by the Peter Möller Department of Orkla ASA, and Dr Saarem was working at the Peter Möller Department of Orkla ASA during the study period and Dr Drevon has been a consultant for the Peter Möller Department of Orkla ASA; Drs Smith, Saugstad, and Ms Blomén indicated they had no financial relationships relevant to disclose. |
|
| Risk of bias | ||
| Bias | Authors' judgement | Support for judgement |
| Random sequence generation (selection bias) | Low risk | Quote: "randomization was performed by a computer program" |
| Allocation concealment (selection bias) | Unclear risk | Quote: "randomization was performed by a computer program" |
| Blinding of participants and personnel (performance bias) All outcomes | Low risk | Quote: "double‐blinded" |
| Blinding of outcome assessment (detection bias) All outcomes | Low risk | Not specifically stated, but probably done. |
| Incomplete outcome data (attrition bias) All outcomes | High risk | 249/590 (42%) lost to follow‐up by time of birth: 126/301 (42%) in the cod‐liver oil group and 123/289 (43%) in the corn oil group. There were 27 exclusions and 222 withdrawals (mostly due to "feeling discomfort taking the oil"). K‐ABC at 4 years of age: 51 of the 135 children invited (38%) were lost to follow‐up: 90 came for assessment (84 children completed the assessment). K‐ABC at 7 years: 119 of the 262 children tested on Fagan intelligence scale during their first year of life were invited were lost to follow‐up (45%). |
| Selective reporting (reporting bias) | Unclear risk | Individual K‐ABC scales not fully reported; did not have SDs reported at 4 years; no SDs reported at 7 years. |
| Other bias | Unclear risk | Women in the omega‐3 group were on average 1 year older than women in the corn oil group. |
Horvaticek 2017.
| Methods | RCT | |
| Participants | 109 women Inclusion criteria: pregnant women with T1D mellitus (not further specified) Exclusion criteria: not reported (post‐randomisation exclusions: fetal loss, preterm birth) Setting: Referral Center for Diabetes in Pregnancy Ministry of Health Republic of Croatia, Department of Obstetrics and Gynecology, Zagreb University of Hospital Center, Zagreb, Croatia, conducted 1 January 2014 to 30 September 2016 |
|
| Interventions |
SUPPLEMENTATION: DHA + EPA + standard diabetic diet versus placebo (corn oil) + standard diabetic diet Group 1: EPA and DHA capsules twice daily (each capsule contained EPA 60 mg and DHA 308 mg, therefore 120 mg EPA and 616 mg DHA daily); total number randomised: n = 56 (47 included in main analysis) Group 2: placebo capsules (corn oil; total number randomised: n = 53 (43 included in main analysis) Timing of supplementation: from 9 weeks GA DHA + EPA dose/day: mid: 616 mg DHA + 120 mg EPA |
|
| Outcomes |
Women/birth: adherence; preterm birth (< 37 weeks); early preterm birth (< 34 weeks); length of gestation; PE (and hypertension); GWG Babies/infants/children: miscarriage; stillbirth; perinatal mortality; birthweight > 4.5 kg (macrosomia); birthweight; birth length; head circumference |
|
| Notes |
Funding: not reported Declarations of interest: none declared |
|
| Risk of bias | ||
| Bias | Authors' judgement | Support for judgement |
| Random sequence generation (selection bias) | Unclear risk | Method used to generate a random sequence not reported. |
| Allocation concealment (selection bias) | Unclear risk | Quote: "It was randomly decided which pregnancy women with type‐1 diabetes would take EPA and DHA or which placebo". |
| Blinding of participants and personnel (performance bias) All outcomes | Low risk | Placebo‐controlled |
| Blinding of outcome assessment (detection bias) All outcomes | Unclear risk | Not reported |
| Incomplete outcome data (attrition bias) All outcomes | High risk | 90/109 (81%) women included in the study remained at the birth time point (n = 47 in intervention group and n = 43 in control group). The number of women randomised to the intervention and control groups was not reported. From flow chart (Figure 1) we might assume (though not with 100% certainty) that 56 women were assigned to the intervention, and 43 to the control groups respectively. Before the end of pregnancy/birth pregnancy (main) data collection point: Intervention group lost 9/56 (16%):
Control group lost 10/53 (19%):
|
| Selective reporting (reporting bias) | High risk | Outcomes of trial poorly defined and no protocol available. Additionally, number of participants randomised to each group not reported in text (inferred from flowchart of participants in the trial). |
| Other bias | Unclear risk | Data provided on participant characteristics at baseline insufficient to confidently assess similarity of baseline characteristics. |
Hurtado 2015.
| Methods | RCT: NCT01947426 (NUGELA) | |
| Participants | 110 women randomised Inclusion criteria: healthy term infants with no presence of diseases that may affect the normal development of pregnancy or lactation, singleton gestation, normal course of pregnancy, BMI of 18 to 30 kg/m² at the start of pregnancy, weight gain of 8 kg to 12 kg since pregnancy onset, no intake of DHA supplements during pregnancy, term birth, spontaneous vaginal birth, appropriate weight for GA, Apgar index ≥ 7 at 1st and fifth minute of life, normal monitoring results, and breast‐feeding of the neonate Exclusion criteria: see above Setting: 2 hospitals, Hospital Materno‐Infantil (Granada, Spain) and Hospital Universitario Materno‐Infantil (Las Palmas de Gran Canaria, Spain), between June 2009 and August 2010 |
|
| Interventions |
SUPPLEMENTATION + FOOD: DHA + EPA versus placebo (in the form of a dairy product) Group 1: Fish oil enriched dairy drink (400 mL enriched with omega‐3 (total 392 mg – 72 mg EPA and 320 mg DHA/day; fish oil from tuna)): total number randomised = 56 Group 2: dairy drink with no fish oil: 400 mL: total number randomised = 54 Timing of supplementation: from 28 weeks GA to 4th month of lactation Both groups of women received dietary advice DHA + EPA dose/day: low: 320 mg DHA + 72 mg EPA |
|
| Outcomes |
Women/birth: fatty acid profiles were determined in the mother’s (at enrolment, at birth, and at 2.5 and 4 months) and newborn (at birth, and at 2.5 months) placenta and breast milk (colostrum and at 1, 2, and 4 months); maternal diet (enrolment, 1 month after enrolment and first month of lactation); GWG; GA; placenta DMT1, FPN1, TfR1 and Hamp1 mRNA and protein expression; hepcidin expression; oxidative damage biomarkers (enrolment, birth, 2.5 and 4 months postpartum); inflammatory markers (birth and 2.5 months); cytokines Babies/infants/children: hepcidin expression; oxidative damage biomarkers (birth; 2.5 months); Apgar at 1 and 5 minutes; birthweight; birth length; head circumference at birth; pattern reversal visual evoked potentials (VEPs) (at 2.5 and 7.5 months) and Bayley test (at 12 months) – BSID II MDI; PDI |
|
| Notes |
Funding: Excellence grant (mP‐BS‐9) from the Campus de Excelencia Internacional GREIB (Granada Research of Excellence Initiative on BioHealth) Declarations of interest: “F.L.‐V is an employee of Lactalis Puleva”. No other conflicts declared. |
|
| Risk of bias | ||
| Bias | Authors' judgement | Support for judgement |
| Random sequence generation (selection bias) | Low risk | Quote: "unpredictable sequence computer‐generated" |
| Allocation concealment (selection bias) | Unclear risk | Quote: "randomly assigned" |
| Blinding of participants and personnel (performance bias) All outcomes | Low risk | Identical white packaging used; trial investigators and participants were unaware of the treatment allocation. |
| Blinding of outcome assessment (detection bias) All outcomes | Low risk | Not reported, but probably done. |
| Incomplete outcome data (attrition bias) All outcomes | High risk | 34/110 (31%) lost to follow‐up by the end of the intervention. In the omega‐3 group 18/56:
In the control group 16/54:
Likely to have been post randomisation exclusions (e.g. preterm) but none were mentioned. At 12 months: 24/56 (43%) in the DHA group and 25/54 (46%) in the placebo group were lost to follow‐up. |
| Selective reporting (reporting bias) | Unclear risk | Inadequate information to assess confidently. |
| Other bias | Low risk | Similar baseline characteristics |
Ismail 2016.
| Methods | RCT: NCT01990690 | |
| Participants | 140 women randomised Inclusion criteria: pregnant women with singleton pregnancy (30‐34 weeks' gestation) with an ultrasonographic diagnosis of oligohydramnios (amniotic fluid index ≤ 5 cm); women aged 20‐35 years with normal Doppler indices in uterine and umbilical arteries at the time of recruitment (the normal value of S/D ratio is from 2.5 to 3.5; RI is from 0.60 to 0.75; and PI is from 0.96 to 1.27) Exclusion criteria: women with evidence of IUGR, history of premature rupture of membranes, impaired liver or kidney function, PE or long‐term diabetes and any placental abnormalities; women with non‐reactive non‐stress test or women using NSAIDs or who had any congenital fetal malformation; and women who had abnormal Doppler indices at the time of recruitment Setting: Department of Obstetric and Gynecology, Woman's Health Hospital, Assiut University, Assiut, Egypt (conducted between 1 January 2015 and 1 August 2015) |
|
| Interventions |
SUPPLEMENTATION: EPA + DHA versus placebo Group 1: omega‐3 capsules: 1000 mg fish oil (containing 13% EPA and 9% DHA plus 100 mg wheat‐germ oil (LA 52% to 59%) as a natural source of vitamin E once daily for 4 weeks: n = 70 Group 2: placebo: once daily empty soft gelatin capsules of the same shape, size, colour and weight for the same duration: Total number randomised: n = 70 Timing of supplementation: from 30‐34 weeks' gestation for 4 weeks DHA + EPA dose/day: low: 90 mg DHA + 130 mg EPA |
|
| Outcomes | Women: improvement in amniotic fluid volume 4 weeks after start of treatment; Doppler blood flow changes in the uterine artery after 4 weeks of treatment; uterine artery Doppler indices | |
| Notes | No outcomes could be used in this review. Funding: not reported Declarations of interest: none declared |
|
| Risk of bias | ||
| Bias | Authors' judgement | Support for judgement |
| Random sequence generation (selection bias) | Low risk | Computer‐generated random table |
| Allocation concealment (selection bias) | Low risk | Allocation concealment was carried out using serially numbered closed opaque envelopes. Each envelope was labelled with a serial number and had a card noting the intervention type inside. Allocation was never changed after opening the envelopes. Preparation and sorting of the serially numbered envelopes was carried out by an investigator who did not participate in the evaluation of patients. |
| Blinding of participants and personnel (performance bias) All outcomes | Low risk | Placebo controlled |
| Blinding of outcome assessment (detection bias) All outcomes | Low risk | Not specifically reported, but probably done. |
| Incomplete outcome data (attrition bias) All outcomes | Unclear risk | 14.3% (20/140) lost to follow‐up: 10/70 in omega‐3 group and 10/70 in the placebo group. |
| Selective reporting (reporting bias) | Unclear risk | No perinatal health outcomes reported. |
| Other bias | Low risk | Similar baseline characteristics |
Jamilian 2016.
| Methods | RCT: IRCT201406305623N20 | |
| Participants | 54 women randomised Inclusion criteria: women with GDM not on oral hypoglycaemic agents (diagnosed by 1‐step 2‐hour 75 g OGTT at 24‐28 weeks GA ‐ ADA criteria) and singleton pregnancy Exclusion criteria: pre‐existing diabetes, required complex diets, chronic medical conditions (e.g. valvular heart disease), significant psychiatric disease, smokers, kidney or liver diseases, chronic hypertension or hypothyroidism, those needing to commence insulin therapy during the intervention Setting: Arak, Iran |
|
| Interventions |
SUPPLEMENTATION: omega‐3 (EPA + DHA) versus placebo Group 1: omega‐3 (1000 mg omega‐3 pearl (containing 180 mg EPA and 120 mg DHA) per day): total number randomised: n = 27 Group 2: placebo 1 per day (appearance, colour, shape size, and packaging identical to omega‐3 capsules): total number randomised: n = 27 Timing of supplementation: from 24‐28 weeks GA for 6 weeks All women were asked to maintain their usual diet and physical activity levels throughout the study period. All women were also consuming both 400 mg/day folic acid from the beginning of pregnancy and 60 mg/day ferrous sulphate from the second trimester. DHA + EPA dose/day: low: 120 mg DHA + 180 mg DHA |
|
| Outcomes |
Women/birth: diet and physical activity at weeks 2, 4 and 6 of intervention; weight at end of intervention; BMI at end of intervention; maternal polyhydramnios; PE; GA; caesarean section; birthweight; birth length; birth head circumference; inflammatory factors, biomarkers of oxidative stress and metabolic biomarkers; need for insulin therapy after intervention; antenatal hospitalisation Babies/infants/children: Apgar score; hyperbilirubinaemia; intrauterine fetal death; macrosomia (> 4000 g); ponderal index; 1 and 5 minute Apgar; newborn hyperbilirubinaemia; newborn hospitalisation |
|
| Notes | Adherence was 100% Funding: Arak University of Medical Sciences (grant no. 93‐165‐20) Declarations of interest: none declared |
|
| Risk of bias | ||
| Bias | Authors' judgement | Support for judgement |
| Random sequence generation (selection bias) | Low risk | Quote: “computer‐generated random numbers" |
| Allocation concealment (selection bias) | Low risk | Quote: "Random assignment was done by the use of computer‐generated random numbers ... randomization and allocation were concealed from the researchers and participants...A trained midwife at the maternity clinic did the randomized allocation sequence, enrolled participants, and assigned participants to intervention" |
| Blinding of participants and personnel (performance bias) All outcomes | Low risk | Placebo‐controlled |
| Blinding of outcome assessment (detection bias) All outcomes | Low risk | Not reported, but probably done. |
| Incomplete outcome data (attrition bias) All outcomes | Unclear risk | 3/27 women in the omega‐3 group withdrew, and 2/27 women in the placebo group withdrew, all 5 for personal reasons. Data for all 54 women were analysed, using Last Observation Carried Forward for missing data. |
| Selective reporting (reporting bias) | Low risk | Most expected perinatal outcomes were reported. |
| Other bias | Low risk | Baseline characteristics were similar |
Jamilian 2017.
| Methods | RCT (4 arms, see below) | |
| Participants | 140 women randomised Inclusion criteria: women 18‐40 years; without prior diabetes; diagnosed with GDM by 1‐step 2‐hour 75‐g OGTT at 24‐28 weeks’ gestation referred to Kosar Clinic in Arak, Iran. GDM was diagnosed according to the ADA guidelines: those whose plasma glucose met 1 of the following criteria were considered as having GDM: FPG ≥ 92 mg/dL, 1‐hour OGTT ≥ 180 mg/dL, and 2‐hour OGTT ≥ 153 mg/dL. Exclusion criteria: taking vitamin D and/or omega‐3 fatty acid supplements; taking insulin; placental abruption; PE; hypothryroidism and hyperthyroidism; smokers; those with kidney or liver disease Setting: Kosar Clinic, Arak, Iran; women were recruited from March 2016 to July 2016 |
|
| Interventions |
SUPPLEMENTATION + OTHER AGENT: omega‐3 versus omega‐3 + vitamin D versus vitamin D versus placebo Group 1: omega‐3 fatty acids (2000 mg; 720 mg EPA and 480 mg DHA per day) as 2 capsules (produced by Zahravi Pharmaceutical Company, Tabriz, Iran): n = 35 randomised (n = 32 completed study) Group 2: omega‐3 fatty acids (2000 mg; 720 mg EPA and 480 mg DHA per day) as 2 capsules plus vitamin D (50,000 IU every 2 weeks): n = 35 randomised (and completed study) Group 3: vitamin D (50,000 IU every 2 weeks) plus omega‐3 placebo capsules: n = 35 randomised (and completed study) Group 4: no supplement (placebo) as 2 capsules that were indistinguishable in colour, shape, size, and packaging, smell, and taste from the vitamin D and omega‐3 fatty acids capsules: n = 35 randomised (32 completed study) Timing of supplementation: 6 weeks (start 24‐28 weeks' gestation) DHA + EPA dose/day: high: 480 mg DHA + 720 mg EPA |
|
| Outcomes | Women/birth: insulin metabolism (primary); lipid concentrations (secondary) | |
| Notes | No outcomes could be included in this review. Funding: grant from the Vice‐Chancellor for Research, AUMS (no.1394.373) Declarations of interest: none declared |
|
| Risk of bias | ||
| Bias | Authors' judgement | Support for judgement |
| Random sequence generation (selection bias) | Low risk | Random sequence generation was ensured using a computer‐generated random numbers table. |
| Allocation concealment (selection bias) | Unclear risk | Not reported |
| Blinding of participants and personnel (performance bias) All outcomes | Low risk | Quote: "appearance of placebo capsule was indistinguishable in color, shape, size, and packaging, smell, and taste from Vitamin D and omega‐3 fatty acids capsules"; considering the nature of intervention and placebo, participants and personnel could have been effectively blind to group assignments throughout the trial. |
| Blinding of outcome assessment (detection bias) All outcomes | Unclear risk | Not reported |
| Incomplete outcome data (attrition bias) All outcomes | Low risk | 140 women were randomised, 35 each to: placebo; vitamin D; omega‐3; and vitamin D + omega‐3. A total of 6 women (3 placebo group, 3 omega‐3), were lost to follow‐up, leaving 134/140 (97%) women randomised in the data collection. The difference in the proportions of randomised women included in the data collection was marginal: 100% of women in the vitamin D and vitamin D + omega 3 groups; and 91% of the women in the remaining 2 groups. |
| Selective reporting (reporting bias) | Unclear risk | Insufficient information for confident assessment |
| Other bias | Low risk | Baseline characteristics similar; no obvious other bias identified |
Judge 2007.
| Methods | RCT | |
| Participants | 73 women randomised Inclusion criteria: women aged 18‐35 years, primiparous or not been pregnant for the past 2 years, with no pregnancy complications Exclusion criteria: women with a history of drug or alcohol addiction; hypertension, smoking, hyperlipidaemia, renal disease, liver disease, diabetes, or psychiatric disorder, parity > 5, history of chronic hypertension, heart disease, thyroid disorder, multiple gestations or pregnancy‐induced complications including hypertension, PE or preterm labour; treated during labour with analgesics such as Stadol (butorphanol tartrate) that may cause infant respiratory distress. Infants born preterm and infants with less than 4 hours of crib time in the first and second days postpartum were excluded from the analyses. Setting: Hartford Hospital, Connecticut, USA |
|
| Interventions |
SUPPLEMENTATION: DHA versus placebo (cereal bars) Group 1: DHA‐containing cereal‐based bars (300 mg DHA/92 kcal bar, with 8:1 ratio of DHA to EPA); average consumption of 5 bars a week = average 214 mg/day (1.7 g of micro‐encapsulated fish oil in each 23 g bar). Total number randomised: n = 37 Group 2: cereal‐based placebo bars: 1.7 g of corn oil in each 23 g bar (same total macronutrient content as intervention with respect to carbohydrate, protein and fat). Total number randomised: n = 36 Timing of supplementation: 24 weeks GA to birth (38‐40 weeks GA) DHA + EPA dose/day: low: 191 mg DHA + 23 mg EPA |
|
| Outcomes |
Women/birth: GWG; GA; birthweight; head circumference; length; sexually transmitted infections; maternal depression; mode of birth; maternal dietary intake; DHA status Infant/child: Apgar score at 1 and 5 minutes; Infant Planning test (total intention scores over 5 trials and intentional solutions – retrieving a toy) at age 9 months; Fagan Test of Infant Intelligence (recognition memory) at age 9 months; mode of feeding; infant sleep; ponderal index; visual acuity. (Developmental assessments were only conducted on healthy infants.) |
|
| Notes |
Funding: US Department of Agriculture Initiative for Future Agriculture and Food Systems; NESTEC; US Department of Agriculture Agricultural Research Service; University of Connecticut Research Foundation; National Fisheries Institute; American Dietetic Association Foundation Declarations of interest: not reported |
|
| Risk of bias | ||
| Bias | Authors' judgement | Support for judgement |
| Random sequence generation (selection bias) | Unclear risk | Quote: "randomly assigned"; no further details reported |
| Allocation concealment (selection bias) | Unclear risk | Quote: "randomly assigned"; no further details reported |
| Blinding of participants and personnel (performance bias) All outcomes | Low risk | Quote: “double‐blind, placebo‐controlled” |
| Blinding of outcome assessment (detection bias) All outcomes | Unclear risk | Problem solving trials were administered and scored by a single tester who was blinded to test groups (one‐third of videos were scored by an additional rater). |
| Incomplete outcome data (attrition bias) All outcomes | High risk | Apparently large and differential losses to follow‐up. |
| Selective reporting (reporting bias) | Unclear risk | Some outcomes not fully reported. |
| Other bias | Unclear risk | Baseline characteristics were mostly similar between groups; more women in the placebo group had higher BMI and received WIC support compared with the omega‐3 group. |
Judge 2014.
| Methods | RCT | |
| Participants | 73 women randomised Inclusion criteria: no other births in previous 2 years; ≤ 20 weeks' gestation; aged 18‐35 years Exclusion criteria: women with a self‐reported significant medical history (e.g. currently being treated for depression/psychiatric illness, addiction problems, hyperlipidaemia, hypertension, renal disease, liver disease or diabetes) Setting: several WIC’s offices and hospitals in New England, USA |
|
| Interventions |
SUPPLEMENTATION: DHA versus placebo Group 1: DHA (1 fish oil capsule 300 mg DHA 5 days per week): total number randomised: n = 37 (20) Group 2: placebo (1 corn oil capsule, no DHA 5 days per week): total number randomised: n = 36 (22) Timing of supplementation: 24 weeks GA to 40 weeks GA (or to birth) DHA + EPA dose/day: low: 215 mg DHA; EPA not stated |
|
| Outcomes | Women/birth: maternal postpartum depressive symptomatology at 2 and 6 weeks; and 3 and 6 months postpartum; repeated measures over 6 months (assessed with the PDSS and CES‐D; RBC DHA (weight%) | |
| Notes |
Funding: Patrick and Catherine Weldon Donaghue Medical Research Foundation, Hartford CT; LodersCroklaan (supplied capsules), University of Connecticut School of Nursing and Agricultural Center and Pennington Biomedical Research Center, Louisana State University Declarations of interest: none declared |
|
| Risk of bias | ||
| Bias | Authors' judgement | Support for judgement |
| Random sequence generation (selection bias) | Unclear risk | Quote: “randomized utilizing a coded marble system” |
| Allocation concealment (selection bias) | Low risk | Quote: “randomized utilizing a coded marble system and assigned to groups by a trained individual who was not a research team member. Packages containing capsules were labeled identically and listed only sequential study identification numbers.” |
| Blinding of participants and personnel (performance bias) All outcomes | Low risk | Quote: “A record linking participant names with group assignments was maintained in a secure location away from the researchers to ensure adequate blinding throughout the investigation from recruitment to the completion of data analysis. Identical numbered packages were assembled in advance for use by the research team in enrolling participants. Participants were blinded to group allocation through identical dose and packaging.” |
| Blinding of outcome assessment (detection bias) All outcomes | Low risk | Not specifically stated, but probably done. |
| Incomplete outcome data (attrition bias) All outcomes | High risk | Intervention group lost 17/37 (46%) to follow‐up:
Control group lost 14/36 (39%) to follow‐up:
|
| Selective reporting (reporting bias) | High risk | Only 2 outcomes reported (depression and DHA concentrations) |
| Other bias | Unclear risk | Baseline depressive symptoms (CES‐D) were similar; however baseline RBC DHA concentrations were higher in the intervention group. |
Kaviani 2014.
| Methods | RCT: IRCT201212101011717 | |
| Participants | 80 women randomised Inclusion criteria: primiparous women > 20 weeks' gestation, with mild depression BDI score between 14 to 19, > 18 years of age, not consuming fish more than twice a week#, not suffering from schizophrenia, bipolar disorders, blood disorders, such as Von Willebrand, hypertension, hyperlipidaemia, renal and thyroid diseases, not taking anticoagulants or antidepressants, not smoking or using narcotics, or not participating in activities such as yoga, relaxation, and psychological consultations. #those consuming fish more than twice a week were replaced by the next individual Exclusion criteria: allergic or digestive reactions to study medications Setting: 2 randomly selected health centres in Shiraz, Iran |
|
| Interventions |
SUPPLEMENTATION: omega‐3 versus placebo Group 1: omega‐3 LCPUFA: 1 g/day*: total number randomised = 40 Group 2: placebo (olive oil): total number randomised = 40 Timing of supplementation: women in the omega‐3 group were supplemented for 6 weeks** DHA + EPA dose/day: unclear *not further specified **gestational ages not specified apart from being > 20 weeks' gestation |
|
| Outcomes | Women/birth: depression during pregnancy (Beck Depression Inventory) | |
| Notes | Funding: not reported Declarations of interest: none declared | |
| Risk of bias | ||
| Bias | Authors' judgement | Support for judgement |
| Random sequence generation (selection bias) | Unclear risk | Quote: “permuted block randomisation” |
| Allocation concealment (selection bias) | Unclear risk | Quote: “permuted block randomisation” |
| Blinding of participants and personnel (performance bias) All outcomes | Low risk | Quote: “Both mothers and researchers were blinded to drug and placebo” |
| Blinding of outcome assessment (detection bias) All outcomes | Unclear risk | Not reported |
| Incomplete outcome data (attrition bias) All outcomes | Unclear risk | No losses to follow‐up reported; however women consuming fish more than twice a week were replaced by the next individual (number of instances not reported). |
| Selective reporting (reporting bias) | High risk | Only 1 outcome was reported. |
| Other bias | Unclear risk | Similar baseline characteristics except that all participants in placebo group were employed, compared with only 5% of participants in the intervention group. |
Keenan 2014.
| Methods | RCT: NCT01158976: Nutrition and Pregnancy Study (NAPS) | |
| Participants | 64 women randomised (2:1 ratio) Inclusion criteria: pregnant women living in urban low‐income environments, enrolled at 16‐21 weeks' gestation and 'demographically eligible' (Medicaid insured or eligible, African American, and aged 20‐30 years) Exclusion criteria: 2 or more servings of sea fish per week, known medical complications (gestational diabetes, PE, subchorionic haematoma), regular use of steroid medications, regular alcohol use, cigarettes or use of illegal substances (by maternal report), use of blood thinners or anticoagulants, use of psychotropic medications, BMI > 40, allergy to iodine or soy Setting: Pittsburgh, USA: University of Pittsburgh Medical Center obstetric clinics (from 2010‐2012). The clinics are located in urban areas, and provide health services to women living in low‐income households. |
|
| Interventions |
SUPPLEMENTATION: DHA + EPA + DPA + ETA versus placebo Group 1: omega‐3 LCPUFA (2 gel capsules providing 450 mg DHA, 40 mg DPA and ETA, 90 mg EPA and 10 mg vitamin E): n = 43 Group 2: placebo capsules ‐ matched in size, colour and smell to the study drug (900 mg soybean oil, 16.5 mg vitamin E, 10 mg EPA/DHA): n = 21 Timing of supplementation: 16‐21 weeks GA to birth To support adherence with the intervention, research assistants contacted participants by phone 3 times per week to ask the time of day that the supplement was taken, and gathered data on perception of taste and possible gastrointestinal side effects. DHA + EPA dose/day: mid: 450 mg DHA + 90 mg EPA |
|
| Outcomes |
Women/birth: Perceived Stress Scale (self report) at 24 and 30 weeks' gestation; Trier Social Stress Test (cortisol response ‐ saliva samples before and after test completion; baseline, 24 and 30 weeks' gestation); symptoms of depression (Edinburgh Postnatal Depression Scale (EPNS)) at 24 and 30 weeks; Difficult Life Circumstances Scale; length of gestation Babies/infants/children: birthweight; 1‐minute Apgar score; cortisol concentrations; BSID‐III at 4 months; Face‐to‐Face Still Face at 4 months |
|
| Notes |
Funding: capsules provided by Nordic Naturals; supported by NIH grant. “This study was supported by NIH grants R21 HD058269 and RO1HD084586 to Dr Keenan, with additional support from the University of Chicago Institute for Translational Medicine (UL1TR000430). DHA supplement and placebo were supplied by Nordic Naturals”. Declarations of interest: none reported |
|
| Risk of bias | ||
| Bias | Authors' judgement | Support for judgement |
| Random sequence generation (selection bias) | Low risk | Computer‐generated random assignment Quote: “The pharmacist at the University of Pittsburgh used computer‐generated random assignment of identification numbers to active supplement or placebo in blocks of nine" |
| Allocation concealment (selection bias) | Low risk | Pharmacist (third party) |
| Blinding of participants and personnel (performance bias) All outcomes | Low risk | Placebo controlled |
| Blinding of outcome assessment (detection bias) All outcomes | Low risk | Placebo capsules matched in size, colour and smell to the study drug; probably done |
| Incomplete outcome data (attrition bias) All outcomes | Unclear risk | 13/64 (20%) women were lost to follow‐up: 21% in the omega‐3 group and 19% in the placebo group. 2 participants in the placebo group withdrew due to miscarriage and mood changes; 2 also withdrew in the omega‐3 group ‐ 1 with headaches and 1 with an upset stomach. Data for 15/64 (23%) infants were not available at the 4 months postpartum assessment. End of pregnancy/birth mother and infant outcomes, including length of gestation and birthweight: at the 36‐week gestation data collection point (last before birth), data were collected from 36/43 (84%) and 17/21 (81%) of mothers randomised to the intervention and control groups respectively. Number of mothers and infants from whom data were collected at the end of pregnancy/birth time point was not reported. 3‐month postpartum outcomes, including infant neurological/neurosensory and developmental outcomes and maternal stress: data were collected from 34/43 (79%) and 15/21 (71%) of infants born to mothers randomised to the intervention and control groups respectively. |
| Selective reporting (reporting bias) | Unclear risk | Not all expected outcomes were reported (e.g. preterm birth). |
| Other bias | Unclear risk | Only baseline comparisons for maternal mental health characteristics were reported (baseline groups wrong way round in Table 1 of 2014 paper). |
Khalili 2016.
| Methods | RCT: IRCT2013100914957N1 | |
| Participants | 150 women randomised Inclusion criteria: women aged 18‐35 years; 1st to 5th pregnancy, with a household health record in the participating health centres, ability to read and write, singleton pregnancy, stable phone access Exclusion criteria: bleeding during pregnancy, placenta praevia, abruption or cerclage in the present pregnancy, history of allergy to fish oil or other fish products, allergy to gelatin, history of previous underlying diseases such as heart disease, kidney disease, hyperlipidaemia, taking medication for 1 of these, consuming fish more than twice a week, smoking or drug addiction, bleeding disorders or taking anticoagulants, BMI > 30, participating in another interventional study Characteristics: very low baseline omega‐3 concentrations Setting: 27 health care centres, Tabriz, Iran |
|
| Interventions |
SUPPLEMENTATION: DHA + EPA versus placebo Group 1: 1000 mg fish oil supplements (120 mg DHA and 180 mg EPA). Total number randomised: n = 75 Group 2: placebo (similar shape, size and weight); liquid paraffin. Total number randomised: n = 75 Timing of supplementation: from 20 weeks GA to 30 days after birth (women were recruited between 16‐20 weeks GA) DHA + EPA dose/day: low: 120 mg DHA + 180 mg EPA |
|
| Outcomes |
Women/birth: maternal serum fatty acid profiles at 35‐37 weeks GA; adherence; adverse events (nausea, unpleasant taste, vomiting diarrhoea, stomach pain); caesarean section Babies/infants/children: neonatal death; perinatal death; birthweight; low birthweight; birth length; head circumference at birth; growth at 4 and 6 months; ASQ (2nd edition) at 4 and 6 months (scores and thresholds) |
|
| Notes |
Funding: Tabriz University of Medical Sciences. follow‐up study supported by Tabriz Health Services Management Research Centre (Grant No. 5/77/5241) Declarations of interest: none declared |
|
| Risk of bias | ||
| Bias | Authors' judgement | Support for judgement |
| Random sequence generation (selection bias) | Low risk | Computerised random number table generator |
| Allocation concealment (selection bias) | Low risk | Quote: “randomly assigned … by a staff member not involved in the research” |
| Blinding of participants and personnel (performance bias) All outcomes | Low risk | Placebo controlled (although smell or taste of paraffin may have been able to be detected) |
| Blinding of outcome assessment (detection bias) All outcomes | Low risk | Not reported, but probably done. |
| Incomplete outcome data (attrition bias) All outcomes | Unclear risk | 8/75 women in the omega‐3 group and 7/75 did not have blood samples at 35‐37 weeks GA (omega‐3 group: 5 not interested in sampling; 2 preterm labour: placebo group: 6 not interested in sampling; 2 preterm labour); 1 women in the placebo group stopped capsules due to nausea. For other health outcomes, 0/75 in the omega‐3 group and 4/75 in the placebo group were lost to follow‐up. |
| Selective reporting (reporting bias) | Low risk | No apparent evidence of selective reporting (though stillbirth not explicitly reported). |
| Other bias | Low risk | Baseline characteristics appeared similar. |
Knudsen 2006.
| Methods | RCT: parallel with 7 groups (6 treatment and 1 control group in 1:1:1:1:1:1:2 ratio) | |
| Participants | 3098 women randomised; a letter was mailed to women in the 6 treatment groups, with a 56% take‐up rate overall (1291/2324) Inclusion criteria: women at gestation week 17 to 27, with limited fish intake, no use of fish oil capsules in pregnancy; only liveborn singleton pregnancies were analysed Exclusion criteria: none stated Characteristics: about 86% women consumed some fish at baseline. Setting: subgroup of the National Danish Birth Cohort, Denmark |
|
| Interventions |
SUPPLEMENTATION: omega‐3 (5 different doses DHA/EPA; ALA (flax oil)) versus no treatment Group 1: 0.1 g/day EPA + DHA: total number randomised = 389 (234 participated: 229 analysed) Group 2: 0.3 g/day EPA + DHA: n = 385 (231 participated: 224 analysed) Group 3: 0.7 g/day EPA + DHA: n = 385 (228 participated: 222 analysed) Group 4: 1.4 g/day EPA + DHA: n = 383 (223 participated: 212 analysed) Group 5: 2.8 g/day EPA + DHA: n = 393 (195 participated: 187 analysed) Group 6: 2.2 g/day ALA: n = 389 (180 participated: 176 analysed) – 4 x 1 g flax oil Group 7: no treatment: (774 randomised:748 analysed) (not contacted at all) Timing of supplementation: women were asked to stop taking capsules on the date of expected birth. On average, women stopped taking the capsules 12 days before giving birth; with a mean baseline supplementation commencement of 22‐23 weeks' gestation (approximate estimate of 16 weeks mean supplementation length). DHA + EPA dose/day: different doses ‐ see above |
|
| Outcomes | Women/birth: GA at birth | |
| Notes | Unclear how recruitment by mail may have influenced results. Funding: Danish National Research Foundation, Pharmacy Foundation, Egmont Foundation, Augustinus Foundation, Health Foundation, March of Dimes Birth Defects Foundation, EU, Heart Foundation. Dansk Droge and Biooriginal Food Science Corp donated the fish oil and flax oil capsules respectively Declarations of interest: not reported |
|
| Risk of bias | ||
| Bias | Authors' judgement | Support for judgement |
| Random sequence generation (selection bias) | Unclear risk | Quote: “block‐wise stratified randomisation”; no further details reported. |
| Allocation concealment (selection bias) | Unclear risk | Quote: “block‐wise stratified randomisation”; no further details reported. |
| Blinding of participants and personnel (performance bias) All outcomes | Unclear risk | Not clearly stated, but we assume that women in the 6 treatment groups did not know the dosage (or type) of omega‐3 they were taking. |
| Blinding of outcome assessment (detection bias) All outcomes | Unclear risk | Not explicitly reported; "date of birth was extracted from the Danish Civil Registration System". |
| Incomplete outcome data (attrition bias) All outcomes | High risk | Between 40% and 54% of women failed to participate in the 6 treatment groups. |
| Selective reporting (reporting bias) | High risk | Only gestational length reported. |
| Other bias | Low risk | Similar baseline characteristics |
Krauss‐Etschmann 2007.
| Methods | RCT: NCT01180933 (NUHEAL Nutraceuticals for a Healthier Life); 2 x 2 factorial | |
| Participants | 315 women randomised (4 groups ‐ see below) Inclusion criteria: apparently healthy women < 20 weeks GA; singleton pregnancy, intention to give birth in 1 of the obstetric centres listed below; body weight from > 50 kg to 92 kg and > 18–41 years old Exclusion criteria: women with serious chronic illness (e.g. diabetes, hepatitis, or chronic enteric disease) or who used fish oil supplements since the beginning of pregnancy or folate or vitamin B‐12 supplements after gestation week 16 Setting: Departments of Obstetrics at Ludwig Maximilians University, Munich, Germany; the University of Granada, Granada, Spain; and the University of Pecs, Pecs, Hungary |
|
| Interventions |
SUPPLEMENTATION + OTHER AGENTS: DHA + EPA versus DHA + EPA + folate versus folate versus placebo ‐ all in a milk base Group 1: DHA/EPA: 15 g milk‐based supplement with 500 mg DHA and 150 mg EPA daily: total number randomised: n = 77 Group 2: DHA/EPA/folate:15 g milk‐based supplement with 500 mg DHA and 150 mg EPA, 400 µg 5‐MTHF daily: total number randomised: n = 77 Group 3: folate:15 g of a milk‐based supplement with 400 µg 5‐MTHF daily: total number randomised: n = 80 Group 4: control: 15 g of a milk‐based supplement placebo: total number randomised: n = 81 Timing of supplementation: 20 weeks GA to birth (infant formula (see below) until 6 months of age if child not breastfed) All women: all sachets contained vitamins and minerals in amounts that met the recommended intakes during the second half of pregnancy for European women (minerals: 300 mg Ca, 240 mg P, 93 mg Mg, 3 mg Zn, 66 µg I; vitamins: 330 µg vitamin A, 1.5 µg vitamin D, 3 mg vitamin E, 0.36 mg thiamine, 1.5 mg riboflavin, 4.5 mg vitamin B‐3, 1.9 mg vitamin B‐6, 3.5 µg vitamin B‐12, 270 mg vitamin C). All women were encouraged to breastfeed. For infants who were not fully breastfed: if the newborns were born to fish oil‐supplemented women, they received an infant formula containing 0.5% of total fatty acids as DHA and 0.4% as AA, whereas children born to mothers in the placebo or 5‐MTHF groups received a formula virtually free of DHA and AA during the first 6 months of postnatal life. DHA + EPA dose/day: mid: 500 mg DHA + 150 mg EPA |
|
| Outcomes |
Women/birth: length of gestation; maternal and cord plasma DHA and EPA; dietary data at gestation weeks 20 and 30 and at birth; indicators of pregnancy outcome, and fetal development; placental samples; proliferation cell nuclear antigen; mRNA expression of placental proteins; TLR2, TLR4 and CD14 mRNA (maternal blood, placenta, cord blood); GWG, mode of birth; preterm birth < 35 weeks; postnatal depression 8 weeks after birth (EPDS); proteinuria, BP, and eclampsia for gestation weeks 22 and 30 and at birth; blood loss at birth; birthweight, birth length; head circumference at birth (the previous 3 measurements reported for only a sample of babies); MTHFR C677T polymorphism; fatty acids. Babies/infants/children: Apgar score; umbilical pH; visually evoked potentials at 8 weeks (Germany and Spain); Bayley Mental Development Test at 6 months old (Spain); skin‐prick test at 6 months old (Spain); paediatric symptoms and illness questionnaire at birth, 8 and 24 weeks; Hempel examination at 4 years; Touwen examination at 5.5 years; minor neurological dysfunction, NOS; fluency score; cognitive development (Kaufman Assessment Battery) at 6.5 years; response conflict‐resolution ability; alerting, and spatial orienting of attention (Attention Network Test), ERPs, and sLORETA at 8.5 years; MTHFR C677T polymorphism |
|
| Notes | DHA and EPA provided by Pronova Biocare, Lysaker, Norway: Folate from BASF, Ludwigshafen, Germany Adherence: 89.5% of the women in the second trimester gestation and 87.4% in the 3rd trimester missed < 5 days of supplementation Funding: Commission of the European Research and Technological Development Programme “Quality of Life and Management of Living Resources” within the 5th Framework Programme (contract QLK1‐CT‐1999‐00888 (NUHEAL “Nutraceuticals for a Healthier Life”)) and the European Community’s 7th Framework Programme (FP7/2008‐2013) under grant agreement 212652 (NUTRIMENTHE Project “The Effect of Diet on the Mental Performance of Children”); the University Science Program of Ludwig Maximilians University; a Freedom to Discover Award from the Bristol Myers Squibb Foundation; Spanish Ministry of Economy and Competitiveness grant (State Secretariat for Research, Development, and Innovation; PSI2012‐39292); European Research Council advanced grant ERC‐2012‐AdG (no.322605 META‐GROWTH). Declarations of interest: "Disclosure of potential conflict of interest: The authors have received grant support from the Commission of the European Communities and the Danone Institute of Nutrition". No other potential or actual conflicts of interest declared. |
|
| Risk of bias | ||
| Bias | Authors' judgement | Support for judgement |
| Random sequence generation (selection bias) | Unclear risk | Quote: “blockwise randomization” |
| Allocation concealment (selection bias) | Unclear risk | Quote: “envelopes containing cards with 1 of 4 numbers (1, 2, 3, or 4) according to the 4 intervention groups were mixed and put into a closed box. By drawing envelopes, intervention group numbers were consecutively assigned to subject identity numbers.” |
| Blinding of participants and personnel (performance bias) All outcomes | Low risk | Quote: "Neither the participating women nor the study personnel knew the content of the sachets" |
| Blinding of outcome assessment (detection bias) All outcomes | Low risk | Not specifically reported, but probably done. |
| Incomplete outcome data (attrition bias) All outcomes | High risk | 45/315 (14.3%) did not complete the study at first follow‐up: Group 1: DHA/EPA 8/77 (10.4%) Group 2: DHA/EPA + folate 13/77 (16.9%) Group 3: folate 15/80 (18.8%) Group 4: placebo 9/81 (11.1%) There were 4 post randomisation exclusions: 2 women weighed > 92 kg, 1 of whom used commercial fish oil preparations; and 2 women regularly consumed fish oil preparations. Reasons for dropping out (n = 41) were noncompliance (n = 2), relocation (n = 1), aversion to or bad taste of the supplement (n = 9), and loss of contact (n = 2). In the remaining 17* cases, the reasons for dropping out were not known. Reasons were not reported by group and there were differential rates of loss between groups. *could be 27 Later follow‐up (4 and 5.5 years) 270 mother‐infant pairs were invited for neurological assessment; 175 complied with the request at the age of 4 years and 157 complied at 5.5 years of age. Dropout rates were a further 35.18% at the age of 4 years and 41.9% at the age of 5.5 years, with no differences in the dropout rates between groups. Main reasons for dropping out were relocation (n = 3), loss of contact (n = 65, n = 76), and unwillingness to continue in the study (n = 27, n = 34). 4 of the children examined at the age of 4 years and 5 of those examined at 5.5 years were born prematurely before week 35 of pregnancy and were therefore excluded from the analyses. Except for 1 child who was born with a congenital left side anophthalmus, no other serious congenital disorder was observed. In the health screening questionnaire at 4 years of age, 1 child was reported to have left side deafness, another had developed craniosynostosis and had surgery at the age of 6 months, and 1 child suffered from a developmental retardation of unknown etiology. These children were also excluded from the analyses, which left 167 and 148 children at the age of 4 and 5.5 years, respectively. 6.5 year follow‐up 161 children participated (exclusions: 4 children born < 35 weeks, 1 child was born with a congenital left‐side anophthalmus, 1 child developed craniosynostosis, and another was reported to have left‐side deafness). Dropout rates were similar between groups. Main reasons for dropping out were relocation (n = 3), loss of contact (n = 74), and unwillingness to continue (n = 30). There was a higher attrition of children whose fathers had a high educational level in the placebo and FO + 5‐MTHF groups, as well as differences in several outcomes (e.g. length of gestation, birth length) between children followed up and those lost to follow‐up. 8.5 year follow‐up 130 children participated; 37 FO, 27 folate; 32 placebo and 34 FO/folate (32 from Germany, 96 from Spain and 8 from Hungary; (exclusions: 4 children born < 35 weeks, 1 child was born with a congenital left‐side anophthalmus, 1 child developed craniosynostosis, and another was reported to have left‐side deafness). Dropout rates were similar between groups and had similar sociodemographic profiles. Main reasons for dropping out were relocation (n = 7), loss of contact (n = 75), and unwillingness to continue (n = 45). |
| Selective reporting (reporting bias) | Unclear risk | Preterm births treated as exclusions and not reported by group. |
| Other bias | Low risk | Similar baseline characteristics |
Krummel 2016.
| Methods | RCT: NCT00865683: The Omega‐3 pregnancy study | |
| Participants | 91 women randomised Inclusion criteria: women with prepregnancy BMI ≥ 25 kg/m², ˜ 26 weeks' gestation, 18‐40 years of age, and a singleton pregnancy (stated as BMI ≥ 30 kg/m² in Foster 2017). Exclusion criteria: diseases affecting study outcomes (e.g. gestational or other diabetes mellitus, hypertension, or concurrent inflammatory, vascular or metabolic disease); high unusual intake of DHA (more than 1 fish meal per week, use of DHA‐fortified foods or supplements); current or previous use of tobacco, illicit drugs, or medications such as corticosteroids that affect inflammatory markers; inability to travel to the research centre for study visits. Setting: General Clinical Research Center, Cincinnati, Ohio, USA (December 2009 to June 2013) |
|
| Interventions |
SUPPLEMENTATION: DHA versus placebo Group 1: DHA (800 mg/day) for 10 weeks, in capsule form; number randomised not reported Group 2: placebo: corn/soy oil daily for 10 weeks, in capsule form: number randomised not reported Timing of supplementation: from 26 to 36 weeks' gestation DHA + EPA dose/day: mid: 800 mg DHA; EPA not stated |
|
| Outcomes |
Women/birth: maternal adverse effects; gestational diabetes; birthweight, length and adiposity (BMI Z score); length of gestation; DHA concentrations (erythrocyte and placenta); fasting blood glucose; cytokines; metabolic hormones; lipids Babies/infants/children: child growth (including adiposity, weight, height, arm circumference and arm skinfold); child neurological/neurosensory and developmental outcomes (as measured by the Bayley Scales of Infant and Toddler Development) |
|
| Notes |
Funding: “Research reported in this publication was supported by National Institutes of Health grant R21HL093532, 8UL1TR000149 and the Mike Hogg Fund (T.L.P). The two‐year follow‐up was supported by the Rita and William Head endowment for studies on environmental influences on Prematurity (R.R.). B.A.F.was supported by a grant from the National Institute of Diabetes and Digestive and Kidney Diseases of the National Institutes of Health under Award Number K23DK109199." Declarations of interest: none declared |
|
| Risk of bias | ||
| Bias | Authors' judgement | Support for judgement |
| Random sequence generation (selection bias) | Low risk | Quote: “The randomization scheme was prepared prior to start of the trial by the study pharmacist using a tested system utilizing a random‐number generator. Each study subject was assigned to study group on a consecutive basis” |
| Allocation concealment (selection bias) | Low risk | Pharmacy‐controlled randomisation |
| Blinding of participants and personnel (performance bias) All outcomes | Low risk | Quotes: “Study staff, subjects, and investigators were blinded to the group assignment. At the end of the study, pharmacy staff mailed the study group assignment to the subject and investigators”; and “the gelcaps were identical in size, appearance, taste, and smell (orange flavoured)” |
| Blinding of outcome assessment (detection bias) All outcomes | Low risk | Quotes: “Study staff, subjects, and investigators were blinded to the group assignment. At the end of the study, pharmacy staff mailed the study group assignment to the subject and investigators”; and “the gelcaps were identical in size, appearance, taste, and smell (orange flavoured)” |
| Incomplete outcome data (attrition bias) All outcomes | High risk | The 2 papers reported different numbers of participants remaining in the trial at the 36‐week and birth data collection points (end of main study). Of the 91 women, initially randomised, 31 (34%) or 28 (30%) were not included the analysis. It was unclear which groups the excluded women had been randomised to, and therefore it was not possible to assess potential systematic differences between groups in withdrawals from the study confidently. No further losses to follow‐up (in the follow‐up study) were reported. |
| Selective reporting (reporting bias) | Unclear risk | Some mismatches with the outcomes reported in the trial registration entry; outcomes such as GDM and BSID III incompletely reported in results; unclear whether some standard errors were SDs |
| Other bias | Unclear risk | Higher BMIs and body weight in the placebo group |
Laivuori 1993.
| Methods | RCT (3‐arms) | |
| Participants | 18 women randomised Inclusion criteria: women with PE (admitted to hospital between 26 and 37 weeks' gestation because of BP consistently exceeding 140/100 mmHg; 8 women also had proteinuria) Exclusion criteria: none reported Setting: Helsinki, Finland |
|
| Interventions |
SUPPLEMENTATION: omega‐3 versus LA + GLA (Primrose oil) versus placebo Group 1: fish oil: 10 MaxEPA capsules (180 mg EPA, 120 mg DHA per capsule): total number randomised: n = 5 (3) Group 2: primrose oil: 10 Preglandin capsules (375 mg linolenic acid and 45 mg gammalinolenic acid per capsule): total number randomised: n = 7 (4) Group 3: placebo (10 capsules each containing 500 mg of maize oil and 500 mg olive oil); total number randomised: n = 6 (5) All women: intervention between 31‐36 weeks' gestation; bed rest in hospital for 2 days before randomisation Median duration and range of supplementation was:
Women were advised to follow their normal diets. DHA + EPA dose/day: daily dose unclear |
|
| Outcomes | Women/birth: prostanoids (urine); clinical signs of PE; birthweight (reported as median and range); BP (reported as % of pretreatment levels) | |
| Notes | 2 women used betablockers (metoprolol 100 mg/day) and 1 used dihydrazaline 50 mg/day. No aspirin‐like drugs were allowed. No outcomes could be meta‐analysed Funding: Preglandin capsules (Suomen Rohdos, Turku, Finland); MaxEpa and placebo capsules (Orion OY, Kuopio, Finland) Declarations of interest: not reported |
|
| Risk of bias | ||
| Bias | Authors' judgement | Support for judgement |
| Random sequence generation (selection bias) | Unclear risk | Reported as “in randomized order” |
| Allocation concealment (selection bias) | Unclear risk | Sealed envelopes |
| Blinding of participants and personnel (performance bias) All outcomes | Low risk | Capsules of identical appearance |
| Blinding of outcome assessment (detection bias) All outcomes | Low risk | Not reported, but probably done. |
| Incomplete outcome data (attrition bias) All outcomes | High risk | 6/18 (33%) women excluded: 3 women gave birth before samples could be collected and 3 additional women failed to collect adequate urine samples. |
| Selective reporting (reporting bias) | Unclear risk | Limited number of outcomes reported. |
| Other bias | High risk | Median length of supplementation differed substantially between the 3 groups. |
Makrides 2010.
| Methods | RCT: ACTRN012605000569606 (DOMInO main trial); allergy follow‐up: ACTRN12610000735055; 3‐ and 5‐year follow‐ups: ACTRN12611001127998; 4‐year follow‐up: ACTRN12611001125910; 7‐year follow‐up: ACTRN12614000770662 | |
| Participants | 2399 women randomised Inclusion criteria: singleton pregnancy < 21 weeks GA, no known fetal abnormality, and not taking medication where tuna oil was contraindicated Exclusion criteria: women already taking a DHA supplement, with a bleeding disorder in which tuna oil was contraindicated, taking anticoagulant therapy, had a documented history of drug or alcohol abuse, were participating in another fatty acid trial, fetus had a known major abnormality, or were unable to give written informed consent or if English was not the main language spoken at home Setting: 5 Australian perinatal centres, recruiting from October 2005 to January 2008 Pregnant women were approached to enter the allergy follow‐up, Palmer 2012, after randomisation into the DOMInO trial. Only Adelaide‐based women were eligible for the allergy follow‐up. Women were eligible if the unborn baby had a mother, father, or sibling with a history of any medically diagnosed allergic disease (asthma, allergic rhinitis, eczema) (n = 706). |
|
| Interventions |
SUPPLEMENTATION: DHA + EPA versus placebo Group 1: DHA‐rich fish oil capsules: 3 x 500 mg/day (providing 800 mg DHA + 100 mg EPA per day): n = 1197 Group 2: matching placebo vegetable oil blend of 3 non‐genetically modified oils (rapeseed, sunflower, palm) in equal proportions: n = 1202 Timing of supplementation: from trial entry (˜20 weeks) to birth DHA + EPA dose/day: mid: 800 mg DHA + 100 mg EPA |
|
| Outcomes |
Women/birth: length of gestation; adherence (28 weeks); PPH; log blood loss at birth; preterm birth < 37 weeks; early preterm birth < 34 weeks; PIH; PE; PE (clinical diagnosis in medical records); caesarean section; post‐term induction or post‐term prelabour caesarean; post‐term induction; serious morbidity composite; renal failure; liver failure; death; eructations (28 and 36 weeks); diarrhoea; gestational diabetes (based on glucose tolerance test); gestational diabetes (based on clinical diagnosis in medical record); postnatal depression (all women: EPDS > 12 at 6 weeks, 6 months postpartum); postnatal depression (women with previous or current depression at trial entry: EPDS > 12 at 6 weeks, 6 months postpartum); new diagnosis of depression in study period; new or existing diagnosis of depression during study period; antenatal admission to hospital; maternal admission to intensive care unit (level III antenatal hospitalisation); vitamin D concentrations (cord blood) Babies/infants/children: perinatal death; birthweight; birth length; head circumference at birth; birthweight z score; birth length z score; head circumference at birth z score; low birthweight < 2.5 kg); SGA (weight < 10th percentile), length, head circumference); LGA (weight (> 90th percentile), length, head circumference); birthweight > 4 kg; any serious adverse event; IVH (and grade); NEC; sepsis; convulsion; BPD (oxygen required for treatment of chronic lung disease); neonatal hypoglycaemia; resuscitation at birth; bone fracture; NICU admission; breastfeeding; morbidities up to 5 years; BSID at 18 months in 600 randomly selected infants; visual development outcomes at 4 months; attention and working memory and inhibitory control at 27 months; general cognitive function (DAS II), executive function, language, behaviour at 4 years; BMI z‐scores; body fat; BP; and insulin sensitivity at 3 and 5 years (HOMA‐IR); BMI z‐score and percentage body fat at 3 and 5 years of age (Allergy outcomes are reported in another Cochrane review (Gunaratne 2015)). |
|
| Notes |
Funding: supported by grants from the Australian National Health and Medical Research Council and Australian Egg Corporation Limited. Treatment and placebo capsules were donated by Efamol, UK and Croda Chemicals. Declarations of interest: Professor Makrides reported serving on scientific advisory boards for Nestle, Fonterra, True Origins and Nutricia. Professor Gibson reported serving on scientific advisory boards for Nestle and Fonterra. Associated honoraria for Professors Makrides and Gibson were paid to their institutions to support conference travel and continuing education for postgraduate students and early career researchers. Dr Makrides reported receiving non financial support from Clover Corporation and Nestle Nutrition. Dr Makrides, through the Women's & Children's Health Research Institute, has a patent pending: "Methods and compositions for promoting the neurological development of an infant". Dr Gould reports honoraria paid to her institution from the Nestle Nutrition Institute. Dr John Colombo served on the advisory boards for Nestle, Fonterra and Nutricia. Dr Muhlhausler had given lectures on maternal nutrition for Aspen Nutrition and Danone Nutritia. Linda Tapsell served on the Science Advisory Committees of the California Walnut Commission and the McCormicks Science Institute. Dr Palmer had consulted for and received payment for lectures from Nestle Nutrition. Dr Prescott reported receiving honorariums from the Nestle Nutrition Institute and Fonterra and being paid for lectures by the World Allergy Association and the American Academy of Asthma, Allergy and Immunology. Dr Heddle reported being paid for expert testimony from Analysis Plus and Rodika Research Services, and receiving grants from Commonwealth Serum Laboratories, Vaxine, GLaxoSmithKline, and Healthed. Dr Beverley Muhlhausler had given lectures on maternal nutrition for Aspen Nutrition and Danone Nutricia. No other author declarations. |
|
| Risk of bias | ||
| Bias | Authors' judgement | Support for judgement |
| Random sequence generation (selection bias) | Low risk | Quote: "Women were randomly assigned a unique study number and treatment group allocation through a computer‐driven telephone randomization service according to an independently generated randomization schedule" |
| Allocation concealment (selection bias) | Low risk | As above |
| Blinding of participants and personnel (performance bias) All outcomes | Low risk | Quote: "All capsules were similar in size, shape and color", and, "trial investigators, staff and participants were unaware of the treatment allocation"; however more women in the treatment group guessed that they were taking fish oil capsules (67% in the treatment group compared with 13% in the control group) |
| Blinding of outcome assessment (detection bias) All outcomes | Low risk | Described as "double blind"; Zhou 2012* describes a "blinded audit of medical records"; Smithers 2011* describes "a blinded assessment of a subset of healthy full‐term infants; Makrides 2014* specifies "with a psychologist who was blinded to group allocation" *These references are listed under Makrides 2010. |
| Incomplete outcome data (attrition bias) All outcomes | Low risk | 1179/1197 (98%) women in the omega‐3 group and 1166/1202 (97%) in the placebo group completed 6‐month postpartum follow‐up (though all women were included in the primary analyses): "adequate data for the analysis of the primary outcome were available for 2320 women (97.3% in the DHA group and 96.1% in the control group)".
|
| Selective reporting (reporting bias) | Low risk | No indication of selective reporting bias. |
| Other bias | Low risk | The demographic and clinical characteristics of the women at randomisation were comparable between the 2 groups, though some divergence was seen over time in the follow‐ups, particularly with regard to sociodemographic characteristics. |
Malcolm 2003.
| Methods | RCT | |
| Participants | 100 women randomised Inclusion criteria: women who were expected to deliver their infants at term and planned to feed them on breast and/or formula milk Exclusion criteria: women with diabetes, twin pregnancies, PE/toxaemia, a past history of abruption or PPH, allergy to fish products, a thrombophilic tendency, or who were receiving drugs that affect thrombocyte function; pregnancies concluded prematurely before 36 weeks, in which the neonate had an Apgar score < 7 at 5 minutes, had weight below the 3rd centile for GA, or had medical or developmental problems were not included in the final analysis of results. Setting: antenatal clinic (elective); Yorkhill NHS Trust, Stirling, Scotland |
|
| Interventions |
SUPPLEMENTATION: DHA versus placebo Group 1: fish oil; blended, Marinol D40 (200 mg DHA/day, 100 mg per capsule); 2 capsules per day; n = 50 randomised Group 2: placebo capsules containing high‐oleic acid sunflower oil, with 810 mg oleic acid/g (200 mg per capsule), devoid of any omega‐3 fatty acid; 2 capsules per day; n = 50 randomised Timing of supplementation: 15 weeks GA to birth All women: advised to follow their normal diet during pregnancy DHA + EPA dose/day: low: 200 mg DHA |
|
| Outcomes |
Women/birth: DHA and other fatty acid status (RBC and plasma); length of gestation; birthweight; length at birth; head circumference at birth; preterm birth Babies/infants/children: longer‐term growth at 50 and 66 weeks post‐conceptional age; visual development; DHA and other fatty acid status (cord blood) |
|
| Notes |
Funding: University of Glasgow and the Chief Scientist Office, Scotland. RP Scherer Ltd UK donated the capsules. Declarations of interest: none declared |
|
| Risk of bias | ||
| Bias | Authors' judgement | Support for judgement |
| Random sequence generation (selection bias) | Unclear risk | Quotes: “double blind, prospective, randomised, and controlled in design”; “The women were then randomised” |
| Allocation concealment (selection bias) | Unclear risk | As above, no further detail provided. |
| Blinding of participants and personnel (performance bias) All outcomes | Low risk | Quote: "The study supplements were identical in appearance and could not be identified on the basis of scent or taste" and "The capsules were identical in appearance, taste and odour." |
| Blinding of outcome assessment (detection bias) All outcomes | Unclear risk | Not specifically detailed |
| Incomplete outcome data (attrition bias) All outcomes | High risk | Of 100 women recruited to the study, 29 (29%) (15 in DHA group; 14 in placebo group) withdrew before 28 weeks, and a further 7 (4 in DHA group; 3 in placebo group) withdrew before birth (total n = 36). Common reasons for withdrawing were poor adherence (n = 16); frequent nausea/vomiting (n = 13); loss of contact (n = 3); anxiousness (n = 2); unspecified (n = 3). A further 3 infants (all from the placebo group) were excluded from the postnatal portion of the study after birth: born before 36 weeks (n = 1); Apgar score < 7 at 5 minutes (n = 2). A further infant was discharged before testing. Therefore birth outcomes were available for 60/100 women; birth vision tests were performed on 59 infants. ERG studies (retina) were performed on 56 infants. (Other paper reports 2 excluded from placebo group due to prematurity, and SGA) |
| Selective reporting (reporting bias) | Unclear risk | Unclear; no access to trial protocol |
| Other bias | Unclear risk | Insufficient detail to determine risk of other bias |
Mardones 2008.
| Methods | RCT | |
| Participants | 1173 women Inclusion criteria: women age 18 years and over, parity 0‐5, up to 20 weeks’ gestation (confirmed by US), non‐consumers of drugs and alcohol, and underweight (BMI ≤ 21.2 at 10 weeks' gestation, as defined by Chilean charts for pregnant women) Exclusion criteria: multiple pregnancies; suffering from chronic diseases that could affect fetal growth; smokers; and disease diagnosed during pregnancy Setting: 19 urban health clinics belonging to the Servico de Salud Metropolitano Sur‐Oriente (Southeast Metropolitan Public Health Services), Santiago, Chile (study dates not reported). Mainly low‐income, ethnically diverse families (Ameri‐Indian and Hispanic). |
|
| Interventions |
SUPPLEMENTATION + OTHER AGENT: omega‐3 + omega‐6 + multiple micronutrients + milk versus milk only Group 1: milk product fortified with omega‐3 LCPUFA (0.6 g/day) omega‐6 LCPUFA (3 g/day), multiple micronutrients: total number randomised: n = 589 Group 2: regular powdered milk; total number randomised: n = 552 Timing of supplementation: < 20 weeks to birth (presumed) DHA + EPA dose/day: mid: 600 mg DHA; EPA not stated |
|
| Outcomes |
Women/birth: preterm birth (< 37 weeks); preterm birth (< 34 weeks); miscarriage; PE; length of gestation; caesarean section; GWG; stillbirth; neonatal death; perinatal death Babies/infants/children: birthweight; infant growth (crown‐heel length, head circumference) |
|
| Notes |
Funding: Parmalat SpA, Italy, the company that provided the Maman (intervention) product. Declarations of interest: none declared |
|
| Risk of bias | ||
| Bias | Authors' judgement | Support for judgement |
| Random sequence generation (selection bias) | High risk | Quote: "Midwives in charge assigned the women in their initial pregnancy visit using the order of arrival: odd numbers to the experimental group and even numbers to the control group". |
| Allocation concealment (selection bias) | High risk | Quote: "Midwives in charge assigned the women in their initial pregnancy visit using the order of arrival: odd numbers to the experimental group and even numbers to the control group". |
| Blinding of participants and personnel (performance bias) All outcomes | Unclear risk | Authors reported that: "the study could not be blinded because Chilean regulations do not allow delivery of food without information on its composition". However, lack of blinding of participants and personnel is unlikely to have introduced bias due to the objective nature of the outcomes measured and reported. |
| Blinding of outcome assessment (detection bias) All outcomes | Unclear risk | Quote: “For those co‐authors who performed the calculations, groups were simply labelled 1 or 2, and the coding was not known by them either. These measurements should suffice to minimise the possible effects of non‐blinding”. No information was provided on blinding of the individuals who performed the assessments. |
| Incomplete outcome data (attrition bias) All outcomes | High risk | There were 32/1173 post randomisation exclusions. Data were available for 333/552 (60%) and 365/589 (62%) of women assigned to the control and intervention group respectively. |
| Selective reporting (reporting bias) | Unclear risk | insufficient information to permit confident assessment. |
| Other bias | Unclear risk | Among women who discontinued the trial, GA at recruitment was lower in the intervention group. |
Martin‐Alvarez 2012.
| Methods | RCT | |
| Participants | 60 women Inclusion criteria: not reported Exclusion criteria: not reported Setting: Virgen de las Nieves Hospital, Granada, Spain |
|
| Interventions |
SUPPLEMENTATION + FOOD: DHA versus placebo (in the form of a dairy product) Group 1: dairy product (2 glasses a day) supplemented with DHA (400 mg/day): total number randomised: n = 30 Group 2: dairy product (2 glasses a day) with no DHA supplement: total number randomised: n = 30 Timing of supplementation: from 28 weeks' gestation to when breastfeeding stopped DHA + EPA dose/day: low: 400 mg DHA |
|
| Outcomes |
Women: plasma antioxidant capacity; adipokines Babies/infants/children: antioxidant capacity (umbilical cord; newborn); peroxides; superoxide dismutase activity; adipokines (birth; 2.5 months) |
|
| Notes | Abstracts only available No outcomes could be included in this review Funding: not reported Declarations of interest: not reported |
|
| Risk of bias | ||
| Bias | Authors' judgement | Support for judgement |
| Random sequence generation (selection bias) | Unclear risk | Not reported |
| Allocation concealment (selection bias) | Unclear risk | Not reported |
| Blinding of participants and personnel (performance bias) All outcomes | Unclear risk | Quote: "double‐blind"; not further described |
| Blinding of outcome assessment (detection bias) All outcomes | Unclear risk | Not reported |
| Incomplete outcome data (attrition bias) All outcomes | Unclear risk | Not reported |
| Selective reporting (reporting bias) | Unclear risk | Insufficient detail |
| Other bias | Unclear risk | Insufficient detail |
Miller 2016.
| Methods | RCT: NCT02219399 | |
| Participants | 115 women randomised Inclusion criteria: women aged 18‐42 years, singleton pregnancies and willingness to breastfeed exclusively for first 3 months Exclusion criteria: maternal age < 18 years, multiple pregnancies, diabetes, HIV‐positive, chronic illnesses or other conditions which could preclude breastfeeding, and any known allergies to seafood or fish oils Setting: private practice gynaecology and obstetrics clinics, Fort Collins, Colorado, USA |
|
| Interventions |
SUPPLEMENTATION: omega‐3 (DHA + EPA) versus placebo Group 1: tuna fish oil (300 mg DHA and 67 mg EPA); hard capsule: n = 60 Group 2: placebo: identical Sunola hard capsule (high oleic acid sunflower oil placebo): n = 55 Timing of supplementation: from the last trimester of pregnancy through to the first 3 months of breastfeeding DHA + EPA dose/day: low: 300 mg DHA + 67 mg EPA |
|
| Outcomes |
Women/birth: maternal FFQ; lipids (blood, breastmilk); Home Screening Questionnaire at 9 months; abbreviated Wechsler Adult Intelligence Scale (at baseline); gestational length (last menstrual period method); preterm birth < 37 weeks; later term birth > 40 weeks; caesarean birth; breastfeeding Babies/infants/children: BSID‐III, MDI at 4 months and 12 months (cognitive, language, social‐emotional and general adaptive behaviour scales) |
|
| Notes | Same NCT # allocated to Harris 2015 (but author has confirmed this is a separate trial) Funding: not reported Declarations of interest: not reported |
|
| Risk of bias | ||
| Bias | Authors' judgement | Support for judgement |
| Random sequence generation (selection bias) | Low risk | Computer‐generated block randomisation |
| Allocation concealment (selection bias) | Unclear risk | Method of allocation not reported |
| Blinding of participants and personnel (performance bias) All outcomes | Low risk | Quote: “Participating women, all data collectors and investigators were blinded to supplement allocation until all study children were 12 months of age and had completed the cognitive testing. After all study data was collected, the study was un‐blinded only to study investigators for analysis”. |
| Blinding of outcome assessment (detection bias) All outcomes | Low risk | Quote: “Participating women, all data collectors and investigators were blinded to supplement allocation until all study children were 12 months of age and had completed the cognitive testing. After all study data was collected, the study was un‐blinded only to study investigators for analysis”. |
| Incomplete outcome data (attrition bias) All outcomes | Unclear risk | In omega‐3 group 12/60 (20%) loss to follow‐up for BSID:
In placebo group 20/55 (36%) lost to follow‐up:
|
| Selective reporting (reporting bias) | Unclear risk | Secondary outcomes (including infant birth length, infant growth velocity, infant birthweight or infant head circumference at birth) prespecified in the trial registration were not reported. |
| Other bias | Unclear risk | Baseline characteristics similar; however all women were allowed to take voluntary fish oil supplements (63% in the DHA group and 71% in the placebo group did so). Additionally women in the placebo group took higher amounts than the DHA group. |
Min 2014.
| Methods | RCT: ISRCTN68997518: FOSIP | |
| Participants | 173 women randomised (88 healthy women and 85 women with pre‐existing type 2 diabetes) Inclusion criteria: women 17–45 years old with singleton pregnancies with either pre‐existing type 2 diabetes; or without any known medical condition (uncomplicated pregnancy group). Exclusion criteria: multiple pregnancy; known major fetal anomaly; current or planned corticosteroid therapy; asthma requiring medication; current or planned beta‐adrenergic therapy; chronic medical conditions such as HIV/AIDS, kidney disease, or congenital heart disease; haematologic or autoimmune disease such as sickle cell disease, other haemoglobinopathies, lupus, or antiphospholipid syndrome; previous or planned tocolytic therapy to induce labour or increase contraction strength Characteristics: high proportion of South Asian and African/Caribbean women Setting: antenatal clinic, Newham University Hospital, London, UK (women were recruited during their first visit to the antenatal clinic between January 2008 and December 2011) |
|
| Interventions |
SUPPLEMENTATION: DHA + EPA versus placebo Group 1: fish oil: 2 capsules per day (600 mg DHA): n = 86 (41 women with type 2 diabetes; 45 healthy women) Group 2: placebo: 2 capsules per day; 82.6% oleic acid (sunflower oil): n = 87 (47 women with type 2 diabetes; 40 healthy women) Timing of supplementation: recruited between 10‐12 weeks' gestation, with supplementation continuing until birth All women: both supplements contained vitamin E DHA + EPA dose/day: mid: 600 mg DHA; EPA not stated |
|
| Outcomes | Women/birth: caesarean section; miscarriage (< 24 weeks); GA (reported only as median and range) Babies/infants/children: preterm birth < 37 weeks; preterm birth < 34 weeks; shoulder dystocia; stillbirth; birthweight; low birthweight (< 2500 g); anthropometric measures at birth: head circumference; length; femur length; humerus length; biparietal diameter; occipito‐frontal diameter; arm and thigh lean and fat mass; abdominal circumference; abdominal fat mass; shoulder circumference, mid‐arm circumference | |
| Notes |
Funding: FP6 Marie Curie Actions‐Transfer of Knowledge, The Foyle Foundation, Newham University Hospital NHS Trust, Diabetes Research Network (North East London Diabetes Local Research Network), Equazen/Vifor Pharma Ltd., London Metropolitan University, The Letten Foundation, The Mother and Child Foundation, Sir Hally Stewart Trust, Emeritus Professor Clara Lowy Declarations of interest; none declared |
|
| Risk of bias | ||
| Bias | Authors' judgement | Support for judgement |
| Random sequence generation (selection bias) | Low risk | Randomisation was carried out using a random code generated by the supplement provider. |
| Allocation concealment (selection bias) | Low risk | Randomisation was carried out using a random code generated by the supplement provider (third party). |
| Blinding of participants and personnel (performance bias) All outcomes | Low risk | Participants, midwives and all investigators were blinded to allocation until all the analysis was completed and the data recorded. |
| Blinding of outcome assessment (detection bias) All outcomes | Low risk | Participants, midwives and all investigators were blinded to allocation until all the analysis was completed and the data recorded; probably done. |
| Incomplete outcome data (attrition bias) All outcomes | High risk | 30% (26/86) in the fish oil arm and 35% (30/87) in the placebo arm were excluded or lost to follow‐up at birth. Diabetic women: Fish oil: 13/41 (32%); 4 dropouts, 7 miscarriages, 2 stillbirths Placebo: 17/47 (36%); 11 dropouts, 6 miscarriages Healthy women Fish oil: 13/45 (29%); 6 dropouts, 2 moved, 1 termination, 4 miscarriages, 3 developed GDM Placebo: 13/40 (33%); 8 dropouts, 2 moved, 3 miscarriages |
| Selective reporting (reporting bias) | Unclear risk | Some protocol changes after trial registration Under the same registry number as FOSIP ((Min 2014; Min 2016); not entirely clear whether these trials were conducted jointly or in tandem). |
| Other bias | Unclear risk | Possibly some baseline imbalance: more smokers and more planned pregnancies in the omega‐3 group. |
Min 2014 [diabetic women].
| Methods | See Min 2014 above | |
| Participants | Subset of women with type 2 diabetes (41 from fish oil group: 47 from placebo group) | |
| Interventions | ||
| Outcomes | ||
| Notes | ||
Min 2016.
| Methods | RCT: ISRCTN68997518: FOSIP | |
| Participants | 138 women randomised Inclusion criteria: women 17–45 years old with singleton pregnancies diagnosed with GDM (some were tested early in pregnancy) Exclusion criteria: planning to receive tocolytic or corticosteroid therapy or taking fish oil supplements Characteristics: high proportion of South Asian and African/Caribbean women Setting: antenatal clinic, Newham University Hospital, inner‐city London, UK |
|
| Interventions |
SUPPLEMENTATION: omega‐3 + AA versus placebo (oleic acid) Group 1: omega‐3: 2 capsules of fish oil = 600 mg of DHA; 84 mg EPA; 16.8 mg AA (plus vitamin E): total number randomised = 67 Group 2: placebo: 1442 mg high oleic acid sunflower oil/day: total number randomised = 71 Timing of supplementation: GA at recruitment: median 28 weeks (range 17 to 33) Duration of supplementation: median 10 weeks (range 4 to 20) All women: both supplements contained vitamin E DHA + EPA dose/day: mid: 600 mg DHA + 84 mg EPA |
|
| Outcomes |
Women/birth: RBC membrane phospholipid DHA levels in the women and their neonates at birth; GA (median and range); caesarean; miscarriage; stillbirth; congenital anomaly; preterm birth < 37 weeks; preterm birth < 34 weeks; late preterm birth, low birthweight; birthweight > 4 kg; birthweight, birth length; birth head circumference; shoulder, mid arm and abdominal circumferences at birth Babies/infants/children: neonatal hyperglycaemia |
|
| Notes |
Funding: grants from FP6 Marie Curie Actions‐Transfer of Knowledge (MTKD‐CT‐2005‐029914), Foyle Foundation, Newham University Hospital NHS Trust, Diabetes Research Network (North East London Diabetes Local Research Network), Equazen/Vifor Pharma Ltd., London Metropolitan University, Sir Halley Stewart Trust, The Mother and Child Foundation, Letten Foundation and personal donation from Emeritus Professor Clara Lowy. The supplements (Mumomega and placebo) used in this study were prepared and provided by Equazen/Vifor Pharma Ltd free of charge. Declarations of interest: none declared Trial registration is the same as for Min 2014. |
|
| Risk of bias | ||
| Bias | Authors' judgement | Support for judgement |
| Random sequence generation (selection bias) | Low risk | Randomisation was carried out using a random code generated by the supplement provider. |
| Allocation concealment (selection bias) | Low risk | Randomisation was carried out using a random code generated by the supplement provider (third party). |
| Blinding of participants and personnel (performance bias) All outcomes | Low risk | Participants, midwives and all investigators were blinded to allocation until all the analysis was done. |
| Blinding of outcome assessment (detection bias) All outcomes | Low risk | Participants, midwives and all investigators were blinded to allocation until all the analysis was done. |
| Incomplete outcome data (attrition bias) All outcomes | Unclear risk | The omega‐3 + AA arm lost 9/67 (13%) to follow‐up:
The placebo arm lost 13/71 (18%) to follow‐up:
|
| Selective reporting (reporting bias) | Unclear risk | Some protocol changes after trial registration. Under the same registry number as FOSIP ((Min 2014; Min 2016); not clear whether these trials were conducted jointly or in tandem). |
| Other bias | Unclear risk | Possible imbalance: most women with a preterm birth in the omega‐3 group had a history of preterm birth in contrast to 1 woman in the placebo group. |
Mozurkewich 2013.
| Methods | RCT: NCT00711971: Mothers, Omega‐3, and Mental Health Study 3 arms |
|
| Participants | 126 women randomised (2 omega‐3 groups and 1 control group) Inclusion criteria: a past history of depression (EPDS score 9‐19), singleton gestation, a maternal age of ≥18 years, and a GA of 12‐20 weeks Exclusion criteria: women with history of a bleeding disorder, thrombophilia requiring anticoagulation, multiple gestation, bipolar disorder, current major depressive disorder, current substance abuse, lifetime substance dependence or schizophrenia. Women were also ineligible if they were taking omega‐3 fatty acid supplements or antidepressant medications or eating more than 2 fish meals per week. The Mini‐International Neuropsychiatric Interview was also used to exclude current major depressive disorder, bipolar disorder, current substance abuse or dependence, suicidal ideation or schizophrenia. Setting: The University of Michigan Health System and St Joseph’s Mercy Hospital Health System, in southeastern Michigan, USA from October 2008 to May 2011 |
|
| Interventions |
SUPPLEMENTATION: EPA versus DHA versus placebo (soy oil) Group 1: EPA‐rich fish oil supplementation (1060 mg EPA plus 274 mg DHA): 2 large EPA‐rich fish oil capsules and 4 small placebo capsules (double‐dummy design); total number randomised: n = 42 (39) Group 2: DHA‐rich fish oil supplementation (900 mg DHA plus 180 mg EPA): 2 large placebo capsules and 4 small DHA‐rich fish oil capsules; total number randomised: n = 42 (38) Group 3: soy oil placebo (98% soybean oil and 1% each of lemon and fish oil): 2 large and 4 small placebo capsules; total number randomised: n = 42 (41) Timing of supplementation: from 12‐20 weeks GA to 6‐8 weeks postpartum DHA + EPA dose/day: Group 1: high: 274 mg DHA + 1060 mg EPA Group 2: high: 900 mg DHA + 80 mg EPA |
|
| Outcomes |
Women/birth: PE/hypertension; caesarean section; induction of labour; PPH (blood loss); adverse effects; cessation of the intervention; gestational diabetes; postnatal depression; length of gestation; spontaneous vaginal birth; operative vaginal birth; birthweight; cytokines Babies/infants/children: admission to NICU; cytokines (cord blood) (Allergy (childhood eczema at 36 months) was reported, but is covered by another Cochrane review, Gunaratne 2015) |
|
| Notes |
Funding: NIH grant R21 AT004166‐03S1 (National Center for Complementary and Alternative Medicine) and a University of Michigan Clinical Research Initiatives grant and by the University of Michigan General Clinical Research Center, now the Michigan Clinical Research Unit. This study was also supported (in part) by the NIH through the University of Michigan’s Cancer Center Support Grant (P30 CA046592), and by the National Center for Research Resources and the National Center for Advancing Translational Sciences, NIH, through grant 8UL1TR000041, for the Clinical and Translational Science Center, University of New Mexico. The Nordic Naturals Corporation donated both active supplements and placebos to the trial. Declarations of interest: “E.L.M. was an invited speaker at the Nutracon 2012 Conference, sponsored by the Global Organization for EPA and DHA Omega‐3s (GOED), Anaheim, CA, March 7–8, 2012, and received reimbursement for travel expenses. The remaining authors report no conflict of interest” |
|
| Risk of bias | ||
| Bias | Authors' judgement | Support for judgement |
| Random sequence generation (selection bias) | Low risk | Quote: “Randomization was carried out using a random number table maintained in the University of Michigan Investigational Drug Service.” |
| Allocation concealment (selection bias) | Low risk | Quote: “Randomization was carried out using a random number table maintained in the University of Michigan Investigational Drug Service.” (central randomisation) |
| Blinding of participants and personnel (performance bias) All outcomes | Low risk | Quote: “The placebos were formulated to be identical in appearance to both the EPA‐ and DHA‐rich supplements … Because the EPA and DHA capsules were not identical in appearance, we used a double‐dummy design to maintain blinding.” |
| Blinding of outcome assessment (detection bias) All outcomes | Unclear risk | Not specifically detailed |
| Incomplete outcome data (attrition bias) All outcomes | Low risk | Loss to follow‐up (and exclusion from analyses):
(7/8 women were lost to follow‐up; 1 woman in the DHA group had a second‐trimester pregnancy loss attributed to cervical insufficiency). |
| Selective reporting (reporting bias) | Low risk | Trial protocol available; no evidence of selective reporting (though data on adverse effects reported in text only). |
| Other bias | Low risk | Baseline characteristics reported were well balanced across the 3 groups. |
Mulder 2014.
| Methods | RCT: NCT00620672 | |
| Participants | 270 women randomised Inclusion criteria: women at 16 weeks' gestation or less, not taking any lipid or fatty acid supplement, who were expected to deliver 1 infant at full‐term gestation, with no maternal or fetal complications Exclusion criteria: diabetes, cardiac disease, renal disease, tuberculosis, HIV/AIDS, hepatitis, previous pregnancy complications, substance abuse Setting: Vancouver, Canada: 2004 to 2008 |
|
| Interventions |
SUPPLEMENTATION: DHA versus placebo Group 1: DHA: 400 mg/day (given as algal oil triglycerides). The supplements were provided in identical capsules in bottles with more than sufficient supplements to cover the study interval: total number randomised = 132 Group 2: placebo: equivalent amount of corn and soybean oil blended to reflect the dietary 18:2 omega‐6 and 18:3 omega‐3 ratio (but in amounts quantitatively insignificant compared to usual intakes): total number randomised n = 138 Timing of supplementation: from enrolment (˜16 weeks) to 36 weeks GA DHA + EPA dose/day: low: 400 mg DHA + EPA not stated |
|
| Outcomes |
Women/birth: RBC DHA; dietary intake at 16 and 36 weeks GA; GWG; breast milk DHA; breastfeeding monthly Babies/infants/children: birthweight; infant mortality; weight at 2, 6, 9, 12 and 18 months; length at 2, 6, 9, 12 and 18 months; weight for length at 18 months; weight for age at 18 months; visual acuity at 2 months, 12 months and 5.75 years; language at 14‐18 months and 5.75 years; problem‐solving; MacArthur Communicative Development Inventory; BSID‐III; all at 18 months at 5.75 years: PPVT, K‐ABC scores, lipids, attention (TOVA) |
|
| Notes |
Funding: Canadian Institutes for Health Research Declarations of interest: none declared |
|
| Risk of bias | ||
| Bias | Authors' judgement | Support for judgement |
| Random sequence generation (selection bias) | Low risk | Computer‐generated, random codes |
| Allocation concealment (selection bias) | Unclear risk | Use of sealed, opaque envelopes |
| Blinding of participants and personnel (performance bias) All outcomes | Low risk | The supplements were identical in appearance, and contained an orange flavour mask. |
| Blinding of outcome assessment (detection bias) All outcomes | Low risk | As above; plus "testers blinded to the infant group” |
| Incomplete outcome data (attrition bias) All outcomes | Unclear risk | Lost to follow‐up at 36 weeks from: DHA group: 27/132 (20%):
Placebo group: 23/138 (17%):
At 18 months losses to follow‐up were:
(with higher losses for some of the anthropometric assessments) At 5.75 years losses to follow‐up were:
|
| Selective reporting (reporting bias) | Unclear risk | Adverse birth outcomes treated as exclusions; not clearly reported. |
| Other bias | Unclear risk | There were more boys born in the placebo group than the DHA group; no other obvious sources of bias identified. |
Noakes 2012.
| Methods | RCT: NCT00801502 (SiPs) | |
| Participants | 123 women randomised Inclusion criteria: women with a diet low in oily fish (excluding canned tuna) (intake ≤ twice per month); with a family history of atopy, allergy or asthma (1 or more of the first‐degree relatives of the infant affected by atopy, allergy or asthma by self‐report); age 18‐40 years; < 19 weeks GA; healthy uncomplicated singleton pregnancy; not using fish oil supplements currently or in the previous 3 months Exclusion criteria: participation in another research study; known diabetic; presence of any autoimmune disease, learning disability, terminal illness or mental health problems Setting: catchment area of the Princess Anne Hospital, Southampton University Hospitals NHS Trust, Southampton, UK (recruitment and study dates not reported) |
|
| Interventions |
FISH DIET versus USUAL DIET (low in oily fish) Group 1: farmed salmon: women were provided with 2 x 150 g portions of farmed salmon a week and a cookbook of salmon recipes). The salmon (see below) was delivered to the homes of these women in individual frozen and vacuum‐packed portions (150 g) on a monthly basis; sufficient portions were provided for each woman and her partner. Salmon for use in the SiPS were raised at Skretting Aquaculture Research Centre, Stavanger, Norway. Each 150‐g salmon portion contained (on average) 30.5 g protein, 16.4 g fat, 0.57 g EPA, 0.35 g DPA (22:5n23), 1.16 g DHA, 3.56 g total omega‐3 PUFA, 4.1 mg α‐tocopherol, 1.6 mg γ‐tocopherol, 6 μg vitamin A (sum of all retinols), 14 μg vitamin D3, and 43 μg selenium; variance in content of all nutrients among several analysed portions was: 5% for protein and fat; 10% for individual fatty acids, α‐tocopherol, and γ‐tocopherol; and 20% for vitamin A, vitamin D3, and selenium. Thus, 2 portions of salmon/wk would typically provide 3.45 g EPA +DHA, 28 μg vitamin D3, and 86 μg selenium. Total number randomised: n = 62 Group 2: usual diet: women were asked to continue their habitual diets; these women also received the information sheet that described the possible health benefits of consuming oily fish during pregnancy and the government recommendation that pregnant women consume 1 or 2 oily fish meals/week. In addition, they received a cookbook providing recipes for healthy eating during pregnancy. All women: received a diary in which to record any seafood consumed during the course of the study and the nature of its preparation and cooking. Total number randomised: n = 61 Timing of supplementation: 20 weeks GA to birth DHA + EPA dose/day: low: 330 mg DHA + 160 mg EPA |
|
| Outcomes |
Women/birth: adherence, caesarean section, adverse effects; length of gestation Babies/infants/children: birthweight; birth length; head circumference; ILs (cord blood); IgE (birth and at 6 months); incidence and severity of atopic eczema at 6 months, skin prick test positivity at 6 months |
|
| Notes |
Funding: supported by the European Commission under Framework 6: Sustainable aqua feeds to maximize the health benefits of farmed fish for consumers (Aquamax; FOOD‐CT‐2006‐16249). 2 researchers were supported by the Southampton NIHR Biomedical Research Unit in Nutrition, Diet & Lifestyle. Salmon was donated by the University of Bergen, Norway. Declarations of interest: Grethe Roselunf is employed by a company that produces feed for farmed salmon. None of the other authors had any personal or financial conflicts of interest. |
|
| Risk of bias | ||
| Bias | Authors' judgement | Support for judgement |
| Random sequence generation (selection bias) | Low risk | Quote: “The women were allocated to 1 of 2 groups according to a previously generated random number table”. |
| Allocation concealment (selection bias) | Unclear risk | No details reported |
| Blinding of participants and personnel (performance bias) All outcomes | Unclear risk | Quote: "single blind" |
| Blinding of outcome assessment (detection bias) All outcomes | Low risk | Researchers responsible for assessing outcomes measures (both laboratory and clinical) remained blinded to the groups. |
| Incomplete outcome data (attrition bias) All outcomes | Unclear risk | 123 enrolled at 19‐20 weeks (62 salmon, 61 control):
Therefore 53/62 (86%) remained in salmon group and 54/61 (89%) in control group at birth. |
| Selective reporting (reporting bias) | Unclear risk | Very few clinical outcomes have been reported; trial registration brief and no access to trial protocol. |
| Other bias | Low risk | Baseline characteristics were comparable between groups. |
Ogundipe 2016.
| Methods | RCT: FOSS: ISRCTN24068733 | |
| Participants | 300 women randomised (normal healthy controls (n = 50), women identified at risk of having a low birthweight baby either spontaneously (n = 100) or because of developing PE (n = 100), and women at risk of gestational diabetes (n = 50). Inclusion criteria: healthy women and women at risk of developing pregnancy‐related complications PE, fetal growth restriction, gestational diabetes Exclusion criteria: women with known allergy to fish and fish oil, non‐English speakers who decline the use of an interpreter and those unable or unwilling to attend follow‐up appointments; women with chronic disease such as HIV, cirrhosis or other chronic liver disease, hepatitis B and C carriers; women previously on regular pre‐conceptual fish oil supplement or who, for different reasons, were not able to give competent, written consent Setting: Chelsea and Westminster Hospital, London, UK |
|
| Interventions |
SUPPLEMENTATION + OTHER AGENT: DHA + EPA + AA versus placebo Group 1: 2 capsules daily of DHA‐enriched formula (each capsule contained 300 mg of DHA, 42 mg of EPA and 8.4 mg of AA): total number randomised unclear Group 2: placebo: 2 capsules daily (high oleic acid sunflower seed oil – 721 mg oleic acid); total number randomised unclear Timing of supplementation: from 8‐12 weeks' gestation DHA + EPA dose/day: mid: 600 mg DHA + 84 g EPA |
|
| Outcomes |
Women/birth: maternal neurobehavioural outcomes (listed in trial registration entry), maternal lipid profile Babies/infants/children: MRI brain scan findings; infant developmental outcomes (no outcomes yet reported by intervention and control group ‐ Ogundipe 2016 reports overall GA, birthweight, birth length, head circumference at birth, low birthweight) |
|
| Notes | No outcomes could be used in this review to date. Funding: The Mother and Child Foundation, Letten Foundation, Waterloo Foundation and Vifor Pharma, Switzerland. Declarations of interest: not reported |
|
| Risk of bias | ||
| Bias | Authors' judgement | Support for judgement |
| Random sequence generation (selection bias) | Unclear risk | Not reported |
| Allocation concealment (selection bias) | Unclear risk | Not reported |
| Blinding of participants and personnel (performance bias) All outcomes | Unclear risk | Not reported |
| Blinding of outcome assessment (detection bias) All outcomes | Unclear risk | Not reported |
| Incomplete outcome data (attrition bias) All outcomes | Unclear risk | Not reported |
| Selective reporting (reporting bias) | Unclear risk | Not reported |
| Other bias | Unclear risk | Not reported |
Oken 2013.
| Methods | 3‐arm trial; NCT01126762: 'Food for thought' (pilot study) | |
| Participants | 61 women randomised Inclusion criteria: women 12‐22 weeks GA, consuming ≤ 2 fish servings/month, ≥18 years of age, singleton pregnancy, planning to remain in Boston till the birth, women with no contraindications to fish consumption such as allergy, or self‐restrictions such as vegetarian diet Exclusion criteria: as indicated above Setting: Harvard Medical School or participant’s homes, greater Boston, USA (recruited April to October 2010) |
|
| Interventions |
DIETARY ADVICE: Advice to consume fish versus advice + vouchers versus generic advice Group 1: advice to consume low‐mercury/high‐DHA fish; 8‐page booklet and resources on safe fish consumption and health benefits; weekly emails; total number randomised: n = 20 (17) Group 2: advice and grocery store gift cards to purchase fish; 8‐page booklet on safe fish consumption and health benefits; weekly emails; USD 120 value in gift cards (USD 40 at baseline, first month and second month = USD 10 a week); total number randomised: n = 20 (18) Group 3: generic advice (control): 8‐page generic advice on pregnancy nutrition; weekly emails; total number randomised: n = 21 (20) All women: USD 25 gift card at baseline and completion DHA + EPA dose/day: unclear |
|
| Outcomes | Women/birth: fish intake (using 1 month fish intake FFQ) and fruit, vegetables, dairy, nuts and meat; use of DHA supplements; women’s opinions and attitudes about fish consumption; DHA (plasma); mercury (blood and hair); preterm birth; maternal mortality; stillbirth; gestational diabetes; PE; gestational hypertension; induction of labour; caesarean birth; postpartum depressive symptoms | |
| Notes |
Funding: NIH; HSPH‐NIEHS Center for Environmental Health, Harvard Clinical Nutrition Research Center; Harvard Pilgrim Health Care Institute Declarations of interest: none declared |
|
| Risk of bias | ||
| Bias | Authors' judgement | Support for judgement |
| Random sequence generation (selection bias) | Low risk | Random number table |
| Allocation concealment (selection bias) | Low risk | Sealed opaque envelopes, sequentially opened |
| Blinding of participants and personnel (performance bias) All outcomes | Low risk | Quote: “All study staff were blinded to group assignment before baseline measures were collected. To minimize bias introduced by non‐blinding of the single research assistant who both delivered the intervention and collected follow‐up data, self‐reported data were collected by self‐administered questionnaire rather than by interview. Laboratory staff, statistical analysts, and study investigators remained blinded to group assignment throughout data collection and analysis.” |
| Blinding of outcome assessment (detection bias) All outcomes | Low risk | Quote: "Laboratory staff, statistical analysts, and study investigators remained blinded to group assignment throughout data collection and analysis.” |
| Incomplete outcome data (attrition bias) All outcomes | Unclear risk | 6/61 (10%) women were lost to follow‐up (2 in the advice group discontinued intervention (1 died)); and 1 and 3 in the control and advice + gift card groups respectively Post birth outcomes were not available for 13/61 (21%) women – 9/40 in the 2 intervention arms and 4/21 in the control arm. |
| Selective reporting (reporting bias) | Unclear risk | Specific figures for most birth outcomes not reported (only direction of effect). |
| Other bias | Unclear risk | Baseline characteristics similar, except for a higher proportion of women working full time in the advice + gift card group. |
Olsen 1992.
| Methods |
NCT01353807 3‐arm RCT in a ratio of 2:1:1: for fish oil, olive oil, and no supplement |
|
| Participants | 533 women randomised Inclusion criteria: healthy women, at approximately 30 weeks' gestation, aged 18‐44 years Exclusion criteria: history of placental abruption, a serious bleed in the current pregnancy, use of PG inhibitors, multiple pregnancy, fish allergy or regular intake of fish oil Setting: main midwifery clinic, Aarhus, Denmark |
|
| Interventions |
SUPPLEMENTATION: omega‐3 versus olive oil versus no supplement Group 1: fish oil (2.7 g omega‐3 fatty acids/day) given as 4 x 1 g capsules/day containing fish oil (Pikasol 32% EPA (20:5n‐3), 23% DHA (22:6n‐3)) and 2 mg tocopherol/mL: total number randomised = 266 Group 2: 4 x 1 g capsules olive oil/day: total number randomised = 136 Group 3: no supplement: total number randomised = 131 Timing of supplementation: from ˜30 weeks GA to birth DHA + EPA dose/day: high: 864 mg DHA + 621 mg EPA |
|
| Outcomes |
Women/birth: SBP and DBP, PIH, PE, food frequency questionnaire*, preterm birth < 37 weeks, caesarean, congenital anomalies, blood loss, maternal adverse effects
Babies/infants/children/adults: stillbirth, duration of gestation, birthweight, birth length, BMI At 16‐year follow‐up: asthma, atopic dermatitis, allergic rhinitis At 19‐year follow‐up: insulin, glucose, glycated Hb, leptin, adiponectin, insulin‐like growth factor 1, high sensitivity CRP, height, weight, BMI, waist circumference *enabled women to be classified into low, medium and high habitual intake of fish |
|
| Notes | Sample size estimates were done but not reported in the papers because they were regarded as posthoc by authors (personal communication). Women completed baseline information regarding fish intake. Outcome assessment was blinded, but 85% of women in the fish oil group correctly identified their group allocation, whereas for olive oil 50% identified the correct oil. Funding: "This study was supported by the Danish Medical Research council (J No 12‐9052) and 12‐9144), Sygekassernes Helsefond, Weirnan's Legat and Michaelsen Fonden". Capsules were provided by Lube Ltd, Hadsund, Denmark. Follow‐up was supported by the EU FP5 consortium, Early Nutrition Programming Project, NIH, The Danish Strategic Research Council, The Danish Heart Foundation, The Novo Nordisk Foundation, The Danish Diabetes Foundation, The Aase and Ejnar Danielsens Foundation, and the National Center for Complementary and Alternative Medicine. Declarations of interest: JE Chavarro and Sjurdur F Olsen received research support from the NIH. The rest of the authors declared that they had no relevant conflicts of interest. |
|
| Risk of bias | ||
| Bias | Authors' judgement | Support for judgement |
| Random sequence generation (selection bias) | Unclear risk | Stratified and block randomisation |
| Allocation concealment (selection bias) | Low risk | A sealed, opaque envelope containing a randomisation number which identified either a particular package of oil capsules or no treatment. |
| Blinding of participants and personnel (performance bias) All outcomes | Unclear risk | Capsules and their boxes looked identical for fish oil and olive oil; however the no treatment group was unblinded. |
| Blinding of outcome assessment (detection bias) All outcomes | Unclear risk | Not reported, apart from that at 19‐year follow‐up outcome assessors were blinded to group allocation. |
| Incomplete outcome data (attrition bias) All outcomes | Low risk | No post‐randomisation exclusions and no losses to follow‐up; at 19‐year follow‐up: n = 243 completed physical examination (out of 517 mother/child dyads alive and still living in Denmark); 41% were from the fish oil group and 53% were from the olive oil/no oil group. |
| Selective reporting (reporting bias) | Low risk | Most expected outcomes were reported. |
| Other bias | Low risk | Similar baseline characteristics |
Olsen 2000.
| Methods | Multicentre RCT: NCT02229526 (FOTIP) with 6 different subsets (A to F) of eligibility criteria. The 6 subsets had a standard protocol, and were mutually exclusive. Trials A‐D were prophylactic trials in women after 16 weeks' gestation, with uncomplicated pregnancies: A: previous preterm birth (before 259 days gestation); n = 232 B: IUGR (< 5th centile); n = 280 C: PIH (DBP > 100 mmHg); n = 386 D: current twin pregnancies: n = 579. Trials E and F were therapeutic trials, enrolling women around 33 weeks' gestation: E: signs or symptoms of PE in the current pregnancy (± IUGR): n = 79; or F: suspected IUGR (< 10th centile by ultrasonography) in current pregnancy: n = 63. |
|
| Participants | 1647 women randomised (fish oil: 818, olive oil: 829) Inclusion criteria Prophylactic trials: women after 16 weeks' gestation with an uncomplicated pregnancy, who in an earlier pregnancy had experienced preterm birth (before 259 days gestation); IUGR (< 5th centile); PIH (DBP > 100 mmHg); or women with current twin pregnancies Therapeutic trials: women with threatening PE (women with signs or symptoms or PE) or suspected IUGR (< 10th centile). Exclusion criteria: diabetes mellitus in or before pregnancy, diagnosed severe fetal malformation or hydrops in current pregnancy, suspicion in current pregnancy or occurrence in an earlier pregnancy of placental abruption, drug or alcohol abuse, regular intake of fish oil or of NSAIDs or other drugs with an effect on thrombocyte function or eicosanoid metabolism, allergy to fish products. In the therapeutic trials, an additional exclusion criterion was: high probability of delivering soon after randomisation (within 1 week). Setting: 19 hospital centres in Denmark, Scotland, Sweden, England, Italy, the Netherlands, Norway, Belgium and Russia |
|
| Interventions |
SUPPLEMENTATION: omega‐3 (EPA/DHA) versus control (olive oil) Group 1: omega‐3 (2.7 g/day (1.3 g EPA and 0.9 g DHA)), given as 4 capsules/day in the prophylactic trials and 9 capsules per day in the therapeutic trials (6.1 g/day: 2.9 g EPA and 2.1 DHA): total n = 818 Group 2: matching olive oil capsules: total n = 829 Timing of supplementation: prophylactic trials: ˜20 weeks' gestation to birth; therapeutic trials ˜33 weeks' gestation to birth DHA + EPA dose/day: prophylactic trials: high: 900 mg DHA + 1300 mg EPA DHA + EPA dose/day: therapeutic trials: high: 2100 mg DHA + 2900 EPA |
|
| Outcomes |
Subset A: preterm birth (< 37 weeks), early preterm birth (< 34 completed weeks), low birthweight, length of gestation, birthweight
Subset B: SGA, low birthweight, birthweight.
Subset C: PIH (DBP > 90 mmHg at rest, PE (combination of PIH and proteinuria), antihypertensive therapy, BP
Subset D: preterm birth (< 37 weeks), early preterm birth (< 34 completed weeks), PE (combination of PIH and proteinuria), antihypertensive therapy, BP, SGA, low birthweight, length of gestation, birthweight Threat‐PE trial: duration until birth Susp‐IUGR trial: weight for GA For the combined subsets: length of gestation, preterm birth (minus elective births), early preterm birth (minus elective births), prolonged gestation (42 completed weeks), maternal morbidity and mortality, infant mortality and morbidity Elective births were defined as induced vaginal births or prelabour caesareans. |
|
| Notes | Sample size estimates were modified during the course of the study: sample size determinations were undertaken twice in the study; after 4 years of enrolment, it was realised the original estimated sample sizes were unrealistically large, therefore a stopping strategy was developed (based on a number of primary hypotheses, defined a priori for the prophylactic trials). Funding: Concerted Action (ERB‐BMH1‐CT92‐1906) and PECO (ERB‐CIPD‐CT94‐0235) programmes of the European Commission, and the Danish National Research Foundation. Lube Ltd provided Pikasol fish oil and olive oil capsules. Declarations of interest: not reported |
|
| Risk of bias | ||
| Bias | Authors' judgement | Support for judgement |
| Random sequence generation (selection bias) | Low risk | Restricted blockwise computer‐generated randomisation was used |
| Allocation concealment (selection bias) | Low risk | Quote: "Randomisation identified a package number at the relevant centre, where packages were ordered in a random way as to oil type". Placebo capsules were identical looking but contained olive oil. |
| Blinding of participants and personnel (performance bias) All outcomes | Low risk | Quote: "Both oils were provided in 1 g identical looking gelatine capsules, which were not identical in taste; packages with capsules were identified by a cryptographed number, the code of which was known only by the data manager"; however a questionnaire completed by a subgroup of women indicated that 80% of women in the fish oil group could guess their allocation. |
| Blinding of outcome assessment (detection bias) All outcomes | Low risk | Assessments were blinded (correspondence with Olsen). |
| Incomplete outcome data (attrition bias) All outcomes | Low risk | Overall, 1647 women randomised (fish oil: 818, olive oil: 829), trial entry forms received for: 98% in both groups, follow‐up forms received for 97% in both groups (and compliance forms for 68% in both groups). |
| Selective reporting (reporting bias) | Unclear risk | Not all outcomes were measured in all groups. |
| Other bias | Low risk | Baseline characteristics were similar between groups except for women with suspected IUGR where GA at enrolment was higher in the olive oil group.. |
Olsen 2000 [twins].
| Methods | Twins (see Olsen 2000) | |
| Participants | ||
| Interventions | ||
| Outcomes | ||
| Notes | ||
Onwude 1995.
| Methods | RCT | |
| Participants | 232 women randomised (161 multigravida and 72 primigravida) Inclusion criteria: mean 24 weeks' gestation with high‐risk singleton pregnancy: history of 1 or more small babies (birthweight < 3rd percentile), history of pregnancy hypertension, history of unexplained stillbirth, or primigravida with abnormal uterine Doppler at 24 weeks' gestation Exclusion criteria: history of diabetes mellitus, chronic hypertension, asthma, use of anticoagulants, multiple pregnancy Setting: antenatal clinic, St James's University Hospital, Leeds, UK |
|
| Interventions |
SUPPLEMENTATION: EPA + DHA versus placebo Group 1: 2.7 g of MaxEPA/day (n = 113): 9 capsules/day provided 1.62 g EPA and 1.08 g DHA Group 2: control: matching air‐filled capsules (n = 119) Timing of supplementation: from a mean of 24 weeks to 38 weeks' gestation EPA + DHA dose/day: high: 1080 mg DHA + 1620 mg EPA |
|
| Outcomes | Women/birth: length of gestation; preterm birth < 37 weeks; preterm birth < 32 weeks; duration and mode of onset of labour; mode of birth; PIH, PE, adverse events (75 women only) Babies/infants/children: stillbirth; neonatal mortality; birthweight; birthweight < 3rd percentile | |
| Notes | Sample size estimate was given for proteinuric hypertension All women were asked to avoid NSAIDs Adherence: 50% of women in the fish oil group and 57% of women in the placebo group took < 70% of capsules. Protocol variations: 1 woman in the omega‐3 arm took aspirin and 1 women in the placebo arm purchased fish oil privately. Funding: Yorkshire Region Locally Organised Research; GLAXO (Leeds); Sevens Seas (Hull) Declarations of interest: not reported |
|
| Risk of bias | ||
| Bias | Authors' judgement | Support for judgement |
| Random sequence generation (selection bias) | Low risk | Random numbers were generated by computer. |
| Allocation concealment (selection bias) | Low risk | Random numbers were kept in sealed, opaque, numbered envelopes in the hospital pharmacy and pharmacy staff allocated the trial treatments. |
| Blinding of participants and personnel (performance bias) All outcomes | Low risk | Placebo capsules were identical to treatment capsules (44% of a subgroup of women identified that they were in the fish oil group). |
| Blinding of outcome assessment (detection bias) All outcomes | Low risk | Outcome assessments were blinded. |
| Incomplete outcome data (attrition bias) All outcomes | Low risk | 1/233 (0.4%) post‐randomisation exclusions (one woman with a multiple pregnancy was randomised in error) Adverse events were reported only for a small subsample; 76/233 (33%) women returned the questionnaires. |
| Selective reporting (reporting bias) | High risk | Limited range of outcomes reported; no SDs reported for continuous outcomes (length of gestation; birthweight). |
| Other bias | Low risk | Baseline characteristics were similar in supplement and placebo groups. |
Otto 2000.
| Methods | RCT | |
| Participants | 24 women randomised Inclusion criteria: healthy pregnant women in the second trimester, aged 20‐38 years, with singleton pregnancies Setting: Department of Obstetrics and Gynecology, University Hospital Maastricht; and midwifery practices in the Maastricht area, the Netherlands |
|
| Interventions |
SUPPLEMENTATION + OTHER AGENT: DHA + AA versus no treatment Group 1: DHA capsules (algal oil: 0.57 g DHA/day) and AA (fungal‐derived oil: 0.26 g/day) for 4 weeks: total number randomised = 12 Group 2: no supplements: total number randomised = 12 Timing of supplementation: from 17‐20 weeks' gestation DHA + EPA dose/day: mid: 570 mg DHA; negligible EPA |
|
| Outcomes | Women: fish and seafood consumption at the end of the study; plasma phospholipid fatty acids after 4 weeks; adverse events | |
| Notes | 3 women in each group reported consuming fish once a week during the 4 week study period. Funding: Martek Corporation (donation of capsules); Numico BV, the Netherlands Declarations of interest: not reported |
|
| Risk of bias | ||
| Bias | Authors' judgement | Support for judgement |
| Random sequence generation (selection bias) | Unclear risk | Quote: "randomly assigned" |
| Allocation concealment (selection bias) | Unclear risk | Quote: "randomly assigned" |
| Blinding of participants and personnel (performance bias) All outcomes | High risk | Not blinded |
| Blinding of outcome assessment (detection bias) All outcomes | Unclear risk | Not reported |
| Incomplete outcome data (attrition bias) All outcomes | Low risk | All 12 women completed the study. |
| Selective reporting (reporting bias) | High risk | Limited number of outcomes reported. |
| Other bias | Low risk | Baseline characteristics were similar, apart from more primigravida in the supplement group (8/12 versus 5/12 in the control group). |
Pietrantoni 2014.
| Methods | RCT | |
| Participants | 300 women Inclusion criteria: < 8 weeks' gestation; Caucasian women aged 22‐35 years; singleton pregnancy; BMI ≥ 18.5 and ≤ 25; habitual fish consumption (at least twice a week); high school or university degree; average socioeconomic status; absence of uterine abnormalities (fibroids, cervical incompetence; uterine malformations etc.) Exclusion criteria: smoking, substance abuse including alcohol; allergy to fish or derivatives; diabetes, hypertension, metabolic, cardiovascular, renal, psychiatric, neurological, thrombophilic, thyroid or autoimmune disease; previous pregnancy complications (miscarriage, preterm or operative birth); previous uterine surgery (myomectomy, cervical conisation, trachelorraphy, caesarean etc.); recurrent genito‐urinary infections Setting: Department of Obstetrics and Gynaecology, San Camillo Forlanini Hospital, Rome, Italy |
|
| Interventions |
SUPPLEMENTATION + DIET: DHA + fish versus placebo + fish Group 1: omega‐3 (2 capsules of DHA (100 mg each) administered daily); total number randomised: n = unclear (129) Group 2: placebo (2 capsules of olive oil); total number randomised: n = unclear (126) All women: controlled diet (high protein ˜17%; low in carbohydrates ˜54%; fat ˜2%; omega‐3 (600 g fish/week); increased calorie requirements (+200 Kcal); food diary for a week a month Timing of supplementation: from 8 weeks GA until birth DHA + EPA dose/day: low: 200 mg DHA; EPA not stated |
|
| Outcomes | Women: lipids; food diary; rupture of membranes | |
| Notes |
Funding: Ministry of Health, Rome, Italy Declarations of interest: none declared |
|
| Risk of bias | ||
| Bias | Authors' judgement | Support for judgement |
| Random sequence generation (selection bias) | Unclear risk | Not reported |
| Allocation concealment (selection bias) | Unclear risk | Not reported |
| Blinding of participants and personnel (performance bias) All outcomes | Unclear risk | Not reported |
| Blinding of outcome assessment (detection bias) All outcomes | Unclear risk | Not reported |
| Incomplete outcome data (attrition bias) All outcomes | Unclear risk | Not clear, but if 300 women were randomised, then 45/300 (15%) were lost to follow‐up |
| Selective reporting (reporting bias) | High risk | Only rupture of membranes reported |
| Other bias | Low risk | Similar baseline characteristics |
Ramakrishnan 2010.
| Methods | RCT: parallel; NCT00646360: POSGRAD (Prenatal Omega‐3 fatty acid Supplements, Growth, and Development) | |
| Participants | 1094 women randomised Inclusion criteria: women 18‐35 years old, at 18‐22 weeks' gestation, who planned to give birth at the Mexican Institute of Social Security General Hospital (IMSS) in Cuernavaca, exclusively or predominately breastfeeding for at least 3 months, and planned to live in the area for at least 2 years after giving birth Exclusion criteria: high‐risk pregnancy (history or prevalence of pregnancy complications: abruptio placenta, PE, PIH, any serious bleeding episode in current pregnancy, physician referral), lipid metabolism or abruption disorders, regular intake of fish oil or DHA supplements, or chronic use of certain medications (e.g. for epilepsy) Characteristics: medium‐low socioeconomic status; low baseline omega‐3; high omega 6:omega 3 ratio Primiparae and multipara results presented separately. Setting: Mexico: hospital (routine antenatal); IMMS, Cuernavaca, Mexico, and 3 small health clinics (study conducted between February 2005 and February 2007 |
|
| Interventions |
SUPPLEMENTATION: DHA versus placebo Group 1: DHA: 400 mg daily; capsules contained 200 mg DHA derived from an algal source. Women were instructed to take 2 capsules, together, at the same time each day: total number randomised: n = 547 Group 2: placebo: daily; placebo capsules contained olive oil or soy/corn mix and were similar in appearance and taste to the DHA capsules: total number randomised: n = 547 Timing of supplementation: 18‐22 weeks GA (mean 20.6 weeks) to birth DHA + EPA dose/day: low: 400 mg DHA; EPA not stated |
|
| Outcomes |
Women: nausea; vomiting; vaginal bleeding; GA; caesarean section; cessation of supplements; adherence Birth/infant/child:
|
|
| Notes |
Adherence: 88%; did not differ by treatment group Funding: NIH (HD‐043099) and the March of Dimes Foundation Declarations of interest: Y Gutierrez‐Gomez, AD Stein, U Ramakrishnan, A Barraza‐Villarreal, H Moreno‐Macias, C Aguilar‐Salinas, I Romieu, and JA Rivera declared no conflicts of interest |
|
| Risk of bias | ||
| Bias | Authors' judgement | Support for judgement |
| Random sequence generation (selection bias) | Low risk | Quote: “We used block randomization to randomly create balanced replication of four treatments (two colors for DHA and two for control) using a block size of eight. The list was generated for a sample size of 1,104” ‐ probably done |
| Allocation concealment (selection bias) | Low risk | Quote: “The assignment codes were placed in sealed envelopes at the beginning of the study, and these envelopes were held in a sealed location by a faculty member … who was not involved in the study.” |
| Blinding of participants and personnel (performance bias) All outcomes | Low risk | Quote: "All the study participants and members of the study team remained blinded to the treatment scheme throughout the intervention period of the study. Data were unblinded for the analytical study team after the last baby in the study was born and had reached 6 months of age, at which time the participants were no longer taking supplements. Since the study is ongoing for follow‐up of child development, the participants and fieldworkers in Mexico remain blinded to the treatment allocation” |
| Blinding of outcome assessment (detection bias) All outcomes | Low risk | Quote: "All the study participants and members of the study team remained blinded to the treatment scheme throughout the intervention period of the study. Data were unblinded for the analytical study team after the last baby in the study was born and had reached 6 months of age, at which time the participants were no longer taking supplements. Since the study is ongoing for follow‐up of child development, the participants and fieldworkers in Mexico remain blinded to the treatment allocation” |
| Incomplete outcome data (attrition bias) All outcomes | Unclear risk | 1094 randomised (547 to each group); birthweight analysed for 487/547 in the DHA group and 486/547 in the placebo group (and GA analysed for 486/547 and 484/547) = 11% loss to follow‐up in the DHA group and 11% in the placebo group. Reasons for loss to follow‐up similar among groups; though the women in the final sample with birth outcomes (973) were of higher socioeconomic status than randomised women for whom birth outcomes were not available (121). 18‐month follow‐up (growth): 739 children at 18 months (76.0% of birth cohort), loss to follow‐up did not differ by treatment assignment; children lost to follow‐up were lighter at birth, had smaller head circumferences at birth, and were more likely to have a low birthweight compared with those assessed at 18 months (and in the 18‐month sample, women who received DHA were shorter than those who received placebo). 18‐month follow‐up (development: 730 included in analyses (“Comparison of the final sample with outcome data (n = 730) to those randomised but lost to follow‐up (n = 364) showed that the offspring in the final sample were similar in terms of selected maternal and infant characteristics including treatment group”). 4‐year follow‐up: data available for DHA: 51% (276) children and placebo: 45% (248) children 5‐year follow‐up: 802 children (DHA 403: placebo 399) = 73% of those randomised. |
| Selective reporting (reporting bias) | Unclear risk | Trial registered retrospectively |
| Other bias | Low risk | No obvious sources of other bias; similar baseline characteristics |
Ranjkesh 2011.
| Methods | RCT: IRCT138706061113N1 | |
| Participants | 100 women Inclusion criteria: women with risk of PE (primiparous women, aged < 20 years and > 40 years, previous history of PE or a positive family history, twin pregnancy, BMI > 29, history of renal disease and hypertension), not using any anticoagulant or antihypertension drugs at the time of entering the study Exclusion criteria: none specified Setting: Qazvin city, Iran |
|
| Interventions |
SUPPLEMENTATION: omega‐3 (EPA + DHA) versus placebo Group 1: omega‐3 (EPA + DHA ‐ individual doses not specified), 1 g daily: n = 50 Group 2: placebo (starch): n = 50 Timing of supplementation: from 14‐18 weeks GA to end of pregnancy DHA + EPA dose/day: unclear |
|
| Outcomes |
Women/birth: BP (mmHg); PE, hypertension, caesarean birth; birthweight Babies/infants/children: Apgar score at 5 minutes |
|
| Notes |
Funding: not reported Declarations of interest: not reported |
|
| Risk of bias | ||
| Bias | Authors' judgement | Support for judgement |
| Random sequence generation (selection bias) | Unclear risk | Quote: “randomly divided” |
| Allocation concealment (selection bias) | Unclear risk | Quote: “randomly divided” |
| Blinding of participants and personnel (performance bias) All outcomes | Low risk | Described both as single‐ and double‐blind; placebo‐controlled so probably done. |
| Blinding of outcome assessment (detection bias) All outcomes | Unclear risk | Not reported |
| Incomplete outcome data (attrition bias) All outcomes | Low risk | No losses to follow‐up reported. |
| Selective reporting (reporting bias) | Unclear risk | Some outcomes not fully reported. |
| Other bias | Low risk | Baseline characteristics were similar. |
Razavi 2017.
| Methods | RCT (4 arms, see below) | |
| Participants | 120 women randomised Inclusion criteria: 18‐40 years; without prior diabetes; diagnosed with GDM at 24‐28 weeks’ gestation Exclusion criteria: taking omega‐3 fatty acid supplements; insulin therapy; placental abruption; PE; eclampsia; hypo‐ and hyperthyroidism; smokers Setting: Ardabil, Iran (conducted from September 2016 to March 2017) |
|
| Interventions |
SUPPLEMENTATION: omega‐3 versus omega‐3 + vitamin D versus vitamin D versus placebo Group 1: omega‐3 fatty acids (2000 mg size of capsules containing 360 mg EPA and 240 mg DHA per day) as 2 capsules plus placebo vitamin D capsules; n = 30 randomised (all completed) Group 2: omega‐3 fatty acids (2000 mg size of capsules containing 360 mg EPA and 240 mg DHA per day) as 2 capsules, plus vitamin D (50 000 IU every 2 weeks): n = 30 randomised (all completed) Group 3: vitamin D (50 000 IU every 2 weeks) plus placebo omega‐3 capsules: n = 30 randomised (all completed) Group 4: no supplement (2 placebo capsules, each containing 500 mg of liquid paraffin): n = 30 randomised (all completed) Timing of supplementation: from 24‐28 weeks' gestation (for 6 weeks) All women: requested not to change their routine physical activity or usual dietary intakes throughout study and not to consume any supplements other than the one provided to them by the investigators, as well as not to take any medications that might affect findings during the 6‐week intervention DHA + EPA dose/day: mid: 240 mg DHA + 360 mg EPA |
|
| Outcomes | Women/birth: inflammatory biomarkers; biomarkers of oxidative stress; caesarean section; preterm birth < 37 weeks; polyhydramnios; PE; length of gestation Babies/infants/children: macrosomia (> 4000 g); birthweight; length at birth; head circumference at birth; Apgar score; newborn hyperbilirubinaemia; newborn hospitalisation; newborn hypoglycaemia | |
| Notes |
Funding: research grant from Research Deputy of Ardabil University of Medical Sciences (AUMS) Declarations of interest: none declared |
|
| Risk of bias | ||
| Bias | Authors' judgement | Support for judgement |
| Random sequence generation (selection bias) | Low risk | Assignment was conducted using computer‐generated random numbers. |
| Allocation concealment (selection bias) | Low risk | Computer based randomisation; and "a person who was not involved in the trial and not aware of random sequences, assigned the subjects to the numbered bottles of capsules" |
| Blinding of participants and personnel (performance bias) All outcomes | Low risk | Quote: "Randomisation and allocation were concealed from the researchers and participants until the final analyses were completed" |
| Blinding of outcome assessment (detection bias) All outcomes | Low risk | Not reported; however outcomes probably assessed by the researchers (who were blind to group assignments), and all outcomes included for analysis objective. |
| Incomplete outcome data (attrition bias) All outcomes | Low risk | All 120 participants randomised included for analysis. |
| Selective reporting (reporting bias) | Unclear risk | Outcomes specified in published protocol reported; no obvious sign of selective reporting, however limited range of outcomes for babies/infants/children reported. |
| Other bias | Low risk | No clear baseline differences between the 4 groups of participants. |
Razavi 2017 [vit D].
| Methods | With Vitamin D (see Razavi 2017) | |
| Participants | ||
| Interventions | ||
| Outcomes | ||
| Notes | ||
Rees 2008.
| Methods | RCT | |
| Participants | 26 women randomised Inclusion criteria: current episode of major depression or dysthymia, according to DSM‐IV criteria, confirmed by both CIDI‐structured interview criteria and clinical assessment by a psychiatrist; at least 21 years of age; from the third trimester of pregnancy to 6 months postnatal; baseline score ≥ 13 on the EPDS and either > 14 on the HDRS or > 25 on MADRS. Exclusion criteria: bipolar disorder, psychosis, drug and alcohol abuse, obsessive‐compulsive disorder, eating disorder or personality disorder, an unstable medical condition, diabetes, receipt of anticoagulants or having a fish allergy; those already receiving an antidepressant or any psychological therapy, as well as those taking fish oil supplements or eating more than 3 oily fish portions per week. Those with comorbid anxiety disorders were not excluded. Setting: perinatal depression clinic and midwives' antenatal clinic at Royal Hospital for Women, Sydney, Australia |
|
| Interventions |
SUPPLEMENTATION: DHA + EPA versus placebo Group 1: fish oil (soft gelatin capsules, DHA 0.77 g/day, EPA 0.23 g/day); vitamin E (80 mg) was added to prevent oxidation of the oil: n = 13 randomised Group 2: placebo (sunola oil (85% monounsaturated fats, 7% saturated fats)): n = 13 randomised All women: peppermint oil was added to all capsules to disguise any fish taste and may have minimised any gastrointestinal effects. Timing of supplementation: either from 28‐33 weeks' gestation; or from 11‐19 weeks postnatal for 6 weeks intervention DHA + EPA dose/day: mid: 770 mg DHA + 230 mg EPA |
|
| Outcomes | Women/birth: depression scores at 6 weeks (EPDS, HDRS, MADRS); adherence; omega‐3 plasma concentrations; adverse events | |
| Notes |
Funding: NSW Institute of Psychiatry; Pfizer Neuroscience Research Grant, NHMRC Program Grant 222708, NSW Department of Health Infrastructure Grant; Numega Ingredients and Clover Corporation for supply of fish oil and placebo capsules Declarations of interest: none reported |
|
| Risk of bias | ||
| Bias | Authors' judgement | Support for judgement |
| Random sequence generation (selection bias) | Low risk | Quote: “computer‐based random number generation” |
| Allocation concealment (selection bias) | Low risk | Quote: “dispensed by the hospital pharmacy” |
| Blinding of participants and personnel (performance bias) All outcomes | Low risk | Quote: “dispensed by the hospital pharmacy … to ensure blinding of the investigators and raters”; in “identical plastic containers”; "peppermint used to mask fish oil taste" |
| Blinding of outcome assessment (detection bias) All outcomes | Low risk | Quote: "Subjects were interviewed by the first author, who remained blind to treatment assignment and assessed weekly by her. The blind was not broken until the study had been completed" |
| Incomplete outcome data (attrition bias) All outcomes | High risk |
Fish oil: 1/13 (8%) discontinued (possibly hypomanic) Placebo: 4/13 (31%) discontinued (nausea (1); suicidal (1); non‐adherent (1); other treatment (1)) Results for all 26 women were analysed; with depression scores extrapolated using the last‐observation‐carried‐forward method. |
| Selective reporting (reporting bias) | High risk | The only clinical outcomes reported were depression and adverse events. |
| Other bias | High risk | Women in the placebo group were more likely to have a co‐morbid anxiety disorder (9/13 vs 3/13). |
Ribeiro 2012.
| Methods | RCT | |
| Participants | 11 women randomised Inclusion criteria: age 20‐30 years; in 30th week of pregnancy; not using any form of medication; not showing any signs of intolerance or allergy to fish; not using any dietary supplements containing omega‐3 and omega‐6 PUFA; and not feeding the baby exclusively on their own milk Exclusion criteria: unable to attend all the scheduled study sessions; non‐authorisation by the gynaecologist responsible; embarking on a medication treatment after the study had begun; or deciding not to participate after consenting for the study Setting: Sao Francisco University Hospital, Brazil (participants were selected from May 2009 to February 2010) |
|
| Interventions |
SUPPLEMENTATION: omega‐3 (fish oil) versus primrose oil Group 1: fish oil capsules containing 0.72 g omega‐3 PUFA/day; total number randomised = 7 Group 2: primrose oil capsules containing 1.46 g omega‐6 PUFA/day; total number randomised = 4 Timing of supplementation: for 15 days (no further details) All women: instructed to maintain their usual diet for 7 days, and then to include the capsules during the period of the study intervention (15 days) DHA + EPA dose/day: mid? ‐ (unclear) |
|
| Outcomes | Women/birth: dietary intake; fatty acid composition of the erythrocyte membranes and breastmilk | |
| Notes | No outcomes could be used in this review. Funding: not reported Declarations of interest: none declared |
|
| Risk of bias | ||
| Bias | Authors' judgement | Support for judgement |
| Random sequence generation (selection bias) | Unclear risk | Method used to generate a random sequence not reported. |
| Allocation concealment (selection bias) | Unclear risk | Allocation concealment method not reported. |
| Blinding of participants and personnel (performance bias) All outcomes | Unclear risk | Method used to blind participants and personnel not reported. |
| Blinding of outcome assessment (detection bias) All outcomes | Unclear risk | Not reported |
| Incomplete outcome data (attrition bias) All outcomes | Unclear risk | Post randomisation dropouts and exclusions not reported. |
| Selective reporting (reporting bias) | Unclear risk | Few outcomes reported, and without access to a published protocol it was not possible to assess risk of reporting bias confidently. |
| Other bias | Unclear risk | Inadequate reporting of methods made confident assessment of risk of other bias impossible. |
Rivas‐Echeverria 2000.
| Methods | RCT | |
| Participants | 127 women randomised Inclusion criteria: pregnant women < 29 weeks' gestation at high risk of PE, nulliparity, previous PE, obesity, hypertension, < 20 years old, diabetes, nephropathy, mean arterial pressure < 85 mmHg, positive roll‐over test, “black race”, family history of hypertension or PE, twin pregnancy, poor socioeconomic conditions Exclusion criteria: none reported Setting: Mérida, Venezuela |
|
| Interventions |
SUPPLEMENTATION + OTHER AGENTS: omega‐3 ( + aspirin, vitamins C and E) versus placebo Group 1: fish oil capsules 3 times a day (omega‐3 content not reported); aspirin 100 mg 3 times a week, vitamin C 500 mg 3 times a day, vitamin E 400 IU a day; total number randomised = 63 Group 2: placebo (not further described); total number randomised = 64 Timing of supplementation: not reported DHA + EPA dose/day: unclear |
|
| Outcomes | Women/birth: PE; “no serious maternal or neonatal side effects of treatment occurred in either group” | |
| Notes |
Funding: none reported Conflicts of interest: none reported |
|
| Risk of bias | ||
| Bias | Authors' judgement | Support for judgement |
| Random sequence generation (selection bias) | Unclear risk | Quote: “randomly divided” |
| Allocation concealment (selection bias) | Unclear risk | Quote: “randomly divided” |
| Blinding of participants and personnel (performance bias) All outcomes | Low risk | Quote: “triple‐blind”; probably done |
| Blinding of outcome assessment (detection bias) All outcomes | Unclear risk | Not reported |
| Incomplete outcome data (attrition bias) All outcomes | Unclear risk | Not reported |
| Selective reporting (reporting bias) | High risk | Only 1 outcome fully reported. |
| Other bias | Unclear risk | Not sufficient reporting to determine risk of other bias. |
Samimi 2015.
| Methods | RCT: IRCT20131226562N16 | |
| Participants | 56 women randomised Inclusion criteria: pregnant women 18‐40 years, diagnosed with GDM (1 step 2‐hour 75 g OGTT at 24‐28 weeks GA using ADA 2014 criteria, i.e. fasting glucose ≥ 92 mg/dL,1‐hour ≥ 180 mg/dL and 2‐hour ≥ 153 mg/dL) Exclusion criteria: women requiring insulin therapy, women with PPROM, placental abruption, PE, eclampsia, chronic hypertension, hypothyroidism, urinary tract infection, smokers and those with kidney or liver diseases or those taking oestrogen therapy Characteristics: women had high omega‐6 concentrations Setting: Kashan, Iran (January‐March 2014) |
|
| Interventions |
SUPPLEMENTATION: EPA + DHA + other omega‐3 versus placebo Group 1: 1000 mg omega‐3 fatty acid (1 ‘pearl’ per day for 6 weeks; the pearl contained 70% LCPUFA (180 mg EPA, 120 mg DHA and 400 mg of other omega‐3 fatty acids)); total number randomised: n = 28 Group 2: placebo (1 ‘pearl’ per day for 6 weeks; the pearl contained 500 mg liquid paraffin); total number randomised: n = 28 Timing of supplementation: 6 weeks from 24‐28 weeks GA All women: asked not to alter their routine physical activity or usual dietary intakes throughout the study and not to consume any supplements other than the 1 provided to them by the investigators DHA + EPA dose/day: low: 120 mg DHA + 120 mg EPA |
|
| Outcomes |
Women: insulin resistance (HOMA‐IR); HOMA‐B; plasma glucose; QUICKI; lipid profile; dietary records; adherence, CRP (ng/mL) Babies/infants/children: nil |
|
| Notes |
Funding: Kashan University of Medical Sciences Declarations of interest: none reported |
|
| Risk of bias | ||
| Bias | Authors' judgement | Support for judgement |
| Random sequence generation (selection bias) | Low risk | Computer‐generated random numbers |
| Allocation concealment (selection bias) | Low risk | Quote: "Randomization and allocation were concealed from the researchers and participants until the main analyses were completed. A trained midwife at maternity clinic did the randomized allocation sequence, enrolled participants and assigned participants to intervention" |
| Blinding of participants and personnel (performance bias) All outcomes | Low risk | Quote: "The appearance of placebo ... color, shape, size, and packaging, were identical to omega‐3 fatty acid capsule" |
| Blinding of outcome assessment (detection bias) All outcomes | Low risk | Not reported, but probably done. |
| Incomplete outcome data (attrition bias) All outcomes | Low risk | 3/28 women in each group were lost to follow‐up (omega‐3: 1 insulin therapy and 2 hospitalised); placebo (2 insulin therapy and 1 placental abruption). However results for all 56 women were analysed. |
| Selective reporting (reporting bias) | Unclear risk | No baby or child outcomes reported. |
| Other bias | Low risk | No clear baseline differences. |
Sanjurjo 2004.
| Methods | RCT | |
| Participants | 20 women randomised Inclusion criteria: normal pregnant women without risk of systemic diseases or the existence of malnutrition Exclusion criteria: multiple pregnancies; IUGR; diabetes or hypertension Setting: Baracaldo, Spain |
|
| Interventions |
SUPPLEMENTATION: DHA + EPA versus placebo Group 1: DHA: 200 mg DHA/day and 40 mg EPA in a supplement containing 2 g fat; n = 10 randomised, 8 analysed Group 2: placebo: n = 10 randomised, 8 analysed Timing of supplementation: 26‐27 weeks GA to birth DHA + EPA dose/day: low: 200 mg DHA + 40 mg EPA |
|
| Outcomes |
Women/birth: plasma AA; plasma DHA; GA Babies/infants/children: DHA; birthweight |
|
| Notes |
Funding: supported in part by grants from Novartis op Declarations of interest: not reported |
|
| Risk of bias | ||
| Bias | Authors' judgement | Support for judgement |
| Random sequence generation (selection bias) | Low risk | Computer‐generated random number table |
| Allocation concealment (selection bias) | Unclear risk | Not reported |
| Blinding of participants and personnel (performance bias) All outcomes | Low risk | Quote: "the women were given either 200 mg/day of DHA (group A) on a blind basis (through a dietary formula for pregnant women containing 2 g of fat, of which 200 mg are DHA and 40 mg EPA) or placebo" |
| Blinding of outcome assessment (detection bias) All outcomes | Unclear risk | Not reported |
| Incomplete outcome data (attrition bias) All outcomes | Unclear risk | Quote: "the number of biochemical samples obtained and maternal‐fetal studies completed was 16 (eight from group A and eight from group B)" |
| Selective reporting (reporting bias) | Unclear risk | Without access to a published protocol it was not possible to assess selective reporting confidently. |
| Other bias | Unclear risk | Information on methods insufficient to assess this domain confidently. |
Smuts 2003a.
| Methods | RCT | |
| Participants | 350 women randomised Inclusion criteria: singleton pregnancies, women aged 16‐36 years; 24‐28 weeks' gestation at enrolment; able and willing to consume eggs; access to refrigeration Exclusion criteria: weight > 109 kg at baseline; serious illness such as cancer, lupus, hepatitis; known to have any untreated serious infectious disease; diabetes or gestational diabetes at baseline; elevated BP attributed to any cause Characteristics: most women were socially disadvantaged, and most were African‐American (73%). Setting: Department of Dietetics and Nutrition, University of Kansas Medical Center, Kansas City, Kansas, USA |
|
| Interventions |
OMEGA‐3‐ENRICHED FOOD: DHA‐enriched eggs versus CONTROL (ordinary eggs) Group 1: DHA‐enriched eggs: each egg had 133 mg DHA. Women were asked to eat 12 eggs per week but reported eating 5.5 per week (731.5 mg DHA): n = 176 randomised (142 could be analysed) Group 2: ordinary eggs: each egg had 33 mg DHA. Women were asked to eat 12 eggs per week but reported eating 5.4 per week (178.2 mg DHA): n = 174 randomised (149 could be randomised) Timing of supplementation: 24‐28 weeks GA to birth DHA + EPA dose/day: low: 100 mg DHA/day; EPA not stated |
|
| Outcomes |
Women/birth: gestational diabetes; PE/eclampsia; duration of gestation, preterm birth (< 37 weeks); caesarean; maternal RBC phospholipid DHA concentration at enrolment and at birth Babies/infants/children: birthweight; birth length, head circumference; low birthweight; meconium staining; admissions to neonatal care; neonatal RBC phospholipid DHA concentration at birth; serious adverse events (life‐threatening event, inpatient hospitalisation, or prolonging of an existing hospitalisation, a persistent or significant disability/incapacity, or a congenital anomaly/birth defect |
|
| Notes | Initial sample size was 285. Because there were no published data for low‐level DHA supplementation on which to base a power analysis, a blinded review of the data was undertaken after the first 100 births to refine power analysis. Sample size was increased to 350 after the blinded analysis. Funding: OmegaTech Inc, Colorado, USA Declarations of interest: not reported |
|
| Risk of bias | ||
| Bias | Authors' judgement | Support for judgement |
| Random sequence generation (selection bias) | Low risk | Computer‐generated randomisation schedule |
| Allocation concealment (selection bias) | Unclear risk | Not reported |
| Blinding of participants and personnel (performance bias) All outcomes | Low risk | Quote: "double blinded" |
| Blinding of outcome assessment (detection bias) All outcomes | Low risk | Outcome assessments were blinded |
| Incomplete outcome data (attrition bias) All outcomes | Unclear risk | Overall 59/350 (16.9%) lost to follow‐up: DHA‐enriched eggs group lost 34/176 (19.3%):
Ordinary eggs group lost 25/174 (14.4%):
|
| Selective reporting (reporting bias) | Low risk | Most expected outcomes were reported. |
| Other bias | Low risk | Baseline characteristics similar in each group. |
Smuts 2003b.
| Methods | RCT: parallel (feasibility study) | |
| Participants | 52 women randomised (52 randomised to the 2‐egg groups: 25 to the regular‐egg group and 27 to the high‐DHA egg group. (Another 21 women consented to the study but were not randomised and were not given eggs (low‐egg intake group).) Inclusion criteria: women 24‐28 weeks pregnant by obstetric assessments (either date of last menstrual period or US), aged 16‐35 years, were accessible by telephone, and planned to give birth at the Regional Medical Center (Memphis, TN) If women said they ate eggs, they were asked for informed consent to be randomised to ordinary or high‐DHA eggs. Exclusion criteria: any chronic illness, PIH, PE, or pregnancy‐induced diabetes at the time of enrolment. Women were excluded if they had > 4 prior pregnancies. Characteristics: women were mainly African‐African and rarely consumed fish; however they commonly consumed eggs. Setting: Regional Medical Center (Memphis, TN), USA (trial recruitment dates not reported) |
|
| Interventions |
OMEGA‐3‐ENRICHED FOOD: high‐DHA eggs versus ordinary eggs Group 1: high‐DHA eggs (135 mg DHA/egg): total number = 27 randomised (18 could be analysed) Group 2: ordinary eggs (18 mg DHA/egg): total number = 25 randomised (19 could be analysed) Timing of supplementation: egg consumption started at ˜27 weeks' gestation and continued for ˜13 weeks During the course of the study, women were sent 2 dozen eggs (i.e. 24 eggs) every 2 weeks by courier. After the first delivery, they were interviewed before each subsequent delivery and asked how many eggs they had consumed. In addition, the unused eggs were returned by the courier, counted, the number recorded, and the eggs destroyed. Women were asked to keep a written record of their egg intake on forms supplied to them and to return these with the uneaten eggs; however, few were compliant with this request. DHA + EPA dose/day: low: up to 135 mg DHA; EPA not stated |
|
| Outcomes |
Women/birth: GA, GWG, caesarean section, gestational diabetes, maternal plasma and RBC lipids just prior to birth, maternal antibiotics, preterm birth, low birthweight, placental weight, PE, birthweight, length at birth; head circumference at birth, birthweight < 37 weeks Babies/infants/children: newborn plasma and RBC lipids; admission to NICU/Special Care Unit; not routine hospital care, meconium |
|
| Notes |
Funding: OmegaTech, Inc (Boulder, CO) supplied both ordinary and high‐DHA eggs (Gold Circle Farms). Declarations of interest: not reported |
|
| Risk of bias | ||
| Bias | Authors' judgement | Support for judgement |
| Random sequence generation (selection bias) | Unclear risk | Method of sequence generation not reported ‐ “using a randomization in blocks of 6 to ensure that the groups remained relatively balanced”. |
| Allocation concealment (selection bias) | Unclear risk | Quote: “women were randomized to the two egg groups”; no further information provided |
| Blinding of participants and personnel (performance bias) All outcomes | Unclear risk | Quote: "The ordinary and high‐DHA eggs had white shells but came in cartons of different colors. Carton color remained the same throughout the study" indicating that study personnel and possibly women could deduce which group they were in. |
| Blinding of outcome assessment (detection bias) All outcomes | Unclear risk | Not reported |
| Incomplete outcome data (attrition bias) All outcomes | High risk | 9/27 in the high DHA and 7/25 in the control group lost to follow‐up; reasons for losses not clearly reported. |
| Selective reporting (reporting bias) | Unclear risk | No protocol or trial registration entry; unable to determine |
| Other bias | Unclear risk | Women assigned to consume ordinary eggs were significantly older than those in the high DHA egg group. |
Su 2008.
| Methods | RCT: parallel: NCT00618865 | |
| Participants | 36 women randomised Inclusion criteria: pregnant women aged 18‐40 years, with major depressive disorder (DSM‐IV) with onset between 16 weeks and 32 weeks GA; and to not have taken psychotropic agents for at least 1 month, to have a score of at least 18 on the 21‐item HAM‐D at screening; and to have good physical health as determined by medical history, physical examination, blood laboratory results, electrocardiogram, chest radiography and urinalysis. No psychotropic agents were given during the study period. Exclusion criteria: DSM‐IV diagnosis of bipolar disorder, psychotic disorder, or substance abuse/dependence or any Axis II diagnosis of borderline or antisocial personality disorder. Setting: China Medical University Hospital, Taiwan (June 2004 to June 2006). |
|
| Interventions |
SUPPLEMENTATION: DHA + EPA versus placebo Group 1: omega‐3 LCPUFA (3.4 g/day; 2.2 g EPA and 1.2 g DHA) (produced from Menhaden fish body oil concentrate). Total number randomised: n = 18 (13 completed) Group 2: placebo: 5 identical gelatin capsules per day (olive‐oil ethyl‐esters). Total number randomised: n = 18 (11 completed) Timing of supplementation: 8 weeks to ˜30‐32 weeks GA Before random assignment, all consenting participants took part in a placebo trial for 1 week – those showing a decrease of 20% or more in HAM‐D scores (placebo responders) were not permitted to proceed to the randomisation stage. All capsules (fish oil and placebo) were vacuum deodorised, amended by blending with orange flavour and supplemented with tertiary butylhydroquinone (0.2 mg/g) and tocopherols (2 mg/g) as antioxidants DHA + EPA dose/day: high: 1.2 g DHA + 2.2 g EPA |
|
| Outcomes |
Women/birth: HAM‐D (every other week); EPDS (Taiwanese version); Beck Depression Inventory and brief adverse effect checklist at week ‐1 (lead‐in period), week 0 (baseline) and weeks 2, 4, 6 and 8; blood samples taken at week 1 and week 8 for omega‐3 PUFA analysis (EPA; DHA) “No obstetric complication was noted in any participant” Babies/infants/children: “all the newborns were normal in general physical and neurobehavioral examination at birth” |
|
| Notes |
Funding: National Science Council, Department of Health, and China Medical University and Hospital, Taiwan Declarations of interest: none reported |
|
| Risk of bias | ||
| Bias | Authors' judgement | Support for judgement |
| Random sequence generation (selection bias) | Unclear risk | Not reported |
| Allocation concealment (selection bias) | Unclear risk | Not reported |
| Blinding of participants and personnel (performance bias) All outcomes | Low risk | Placebo used |
| Blinding of outcome assessment (detection bias) All outcomes | Low risk | Not reported, but probably done. |
| Incomplete outcome data (attrition bias) All outcomes | High risk | The intention‐to‐treat population included all women who had a baseline and at least 1 post baseline observation. The per protocol population included all women who completed 8 weeks of treatment. 12/36 (33%) lost to follow‐up: Omega‐3: 5/18 (28%) lost to follow‐up:
Placebo: 7/18 (39%) lost to follow‐up:
|
| Selective reporting (reporting bias) | High risk | Only depressive symptoms, adverse events and omega‐3 status assessed, e.g. no birth outcomes reported numerically. |
| Other bias | Unclear risk | Baseline characteristics similar between study groups. Not clear what constituted “unsatisfactory response” (3 women in each group). |
Taghizadeh 2016.
| Methods | RCT: IRCT201506085623N43 (also IRCT201507035623N47 (Asemi 2015; Jamilian 2016) |
|
| Participants | 60 women randomised Inclusion criteria: women with GDM (diagnosed with ‘one‐step’ 2‐hour 75 g OGTT at 24‐28 weeks' gestation using ADA 2014 criteria, i.e. plasma glucose meeting any of the following criteria: fasting plasma glucose ≥ 92 mg/dL, 1‐hour OGTT ≥ 180 mg/dL and 2‐hour OGTT ≥ 153 mg/dL), who were not taking oral hypoglycaemics, aged 18‐40 years, without prior diabetes. Exclusion criteria: premature preterm rupture of membranes, placental abruption, PE, eclampsia, hypo‐ and hyperthyroidism, urinary‐tract infection, smokers, women with kidney or liver diseases, and women commencing insulin therapy during intervention. Setting: Kosar Clinic, Kashan, Iran (study conducted May 2015 to July 2015) |
|
| Interventions |
SUPPLEMENTATION: omega‐3 (ALA) + vitamin E versus placebo Group 1: omega‐3 and vitamin E co‐supplementation (1000 mg omega‐3 fatty acids from flaxseed oil; 400 mg α‐linoleic acid, plus 400 IU vitamin E): total number randomised: n = 30 Group 2: placebo: colour, shape, size, and packaging identical to combined fatty acids and vitamin E pearl; total number randomised: n = 30 Timing of supplementation: 6 weeks from trial entry (24‐28 weeks GA) All women: 400 µg/day vitamin B9 from the beginning of pregnancy and 60 mg/day ferrous sulphate from the second trimester. Although the intervention was for 6 weeks only, all women were followed up to the time of the birth (mean follow‐up ˜13 weeks) DHA + EPA dose/day: not applicable |
|
| Outcomes |
Women/birth: fasting plasma glucose; serum insulin concentrations; homeostasis models of assessment‐estimated insulin resistance and beta cell function; quantitative insulin sensitivity checklist; serum triglycerides; VLDL‐cholesterol; low‐density lipoprotein; HDL‐cholesterol; total antioxidant capacity, nitric oxide, plasma malondialdehyde concentrations, plasma glutathione and serum high‐sensitivity CRP concentrations; maternal BMI; GWG, DBP and SBP, need of insulin therapy after intervention, maternal hospitalisation, GA, polyhydramnios, preterm birth, PE; 3 day dietary intakes (baseline, week 1, 3, 5 and end of trial); maternal adherence; birthweight; birth length and head circumference at birth Babies/infants/children: hyperbilirubinaemia; 1‐ and 5‐minute Apgar scores, newborn hospitalisation rates; hypoglycaemia |
|
| Notes |
Funding: supplements and placebos were supplied by Barij Essence Pharmaceutical Company, Kashan, Iran; grant from KUMS, Kashan, Iran. Declaration of interests: none declared |
|
| Risk of bias | ||
| Bias | Authors' judgement | Support for judgement |
| Random sequence generation (selection bias) | Low risk | Computer‐generated random number sequence |
| Allocation concealment (selection bias) | Low risk | Quote: “randomly allocated into two groups”; a trained midwife assigned participants and “randomization and allocation were hidden from the researchers and patients until the main analyses were completed” |
| Blinding of participants and personnel (performance bias) All outcomes | Low risk | Quote: “double‐blind placebo‐controlled” |
| Blinding of outcome assessment (detection bias) All outcomes | Low risk | Not specifically reported, but probably done. |
| Incomplete outcome data (attrition bias) All outcomes | Unclear risk | 3/30 women in each group withdrew due to personal reasons. |
| Selective reporting (reporting bias) | Low risk | No apparent selective outcome reporting bias. |
| Other bias | Low risk | Baseline characteristics similar |
Tofail 2006.
| Methods | RCT (parallel) | |
| Participants | 400 women randomised Inclusion criteria: pregnant women at 25 weeks' gestation Exclusion criteria: not reported Characteristics: 28% of mothers were under‐nourished; 82% of babies predominantly breastfed Setting: Dhaka, Bangladesh (January to March 2000): participants from low‐income households (assessed via a household survey) |
|
| Interventions |
SUPPLEMENTATION: DHA + EPA versus soy oil Group 1: fish oil: 4 capsules (1 g in each) as a single daily dose. Total daily fish oil supplement contained 1.2 g of DHA and 1.8 g of EPA. Total number randomised: n = 200 Group 2: soy oil: 4 capsules (1 g in each) as a single daily dose. Soy oil supplement contained 2.25 g of LA, and 0.27 g of ALA. Total number randomised: n = 200 Timing of supplementation: 25 weeks GA to birth DHA + EPA dose/day: high: 1.2 g DHA + 1.8 g EPA |
|
| Outcomes |
Women/birth: length of gestation; birthweight; birth length; head circumference at birth; ponderal index; preterm birth; stillbirth; neonatal death; perinatal mortality; infant death; low birthweight Babies/infants/children: duration of exclusive breastfeeding; at 10 months: Bayley Mental developmental index; Bayley psychomotor developmental index; Behaviour (Wolke) (Approach; Activity; Co‐operation; Emotional tone; Vocalisation) using 0‐9 scales where higher scores are better; head circumference; weight‐for‐height z‐score; weight‐for‐age z‐score; height‐for‐age z‐score; HOME (modified for Bangladesh) |
|
| Notes | Tofail 2012 was a follow‐up study but results were not reported by supplementation/no supplementation. Funding: World Bank Declarations of interest: not reported |
|
| Risk of bias | ||
| Bias | Authors' judgement | Support for judgement |
| Random sequence generation (selection bias) | Unclear risk | Not described |
| Allocation concealment (selection bias) | Unclear risk | Not described |
| Blinding of participants and personnel (performance bias) All outcomes | Low risk | Capsules were identical in appearance |
| Blinding of outcome assessment (detection bias) All outcomes | Low risk | Quote: "Two female psychologists, unaware of the infant’s group assignment, tested all infants” |
| Incomplete outcome data (attrition bias) All outcomes | High risk | 76/400 women were lost before birth due to out‐migration or refusal to take capsules (fish oil: 41/200, soy oil: 35/200). Of the mothers included at birth (159 fish oil; 165 soy oil), further losses occurred after birth (stillbirth: 8 and 6; early neonatal death: 4 and 5; outmigration: 19 and 26; infant death: 3 and 4); Therefore 249 infants (62%) were included in the 10‐month follow‐up (125/200 in the fish oil, and 124/200 in the soy oil group). |
| Selective reporting (reporting bias) | Low risk | No apparent risk of selective reporting. |
| Other bias | Unclear risk | Baseline characteristics: mothers in the fish oil group were younger and had fewer children. |
Valenzuela 2015.
| Methods | RCT | |
| Participants | 40 women randomised Inclusion criteria: women aged 22–35 years; GA of at least 22‐25 weeks according to the date of the last menstrual period and confirmed by US; 1–4 children Exclusion criteria: women with a history of drug or alcohol consumption; a diet including polyunsaturated fatty acids (PUFA, ALA supplements) or LCPUFA (EPA and or DHA supplements); underweight as defined by the Chilean chart for pregnant women; history of twins or of suffering from chronic diseases such as diabetes, arterial hypertension, obesity, or other illness that could affect fetal growth Characteristics: recruited women were mostly of low‐ and middle‐socioeconomic status (according to the ESOMAR); all were of Hispanic origin. Setting: Obstetrical and Gynecology Health Service of the University of Chile Hospital, Chile (study conducted January 2012‐December 2013) |
|
| Interventions |
SUPPLEMENTATION: ALA versus soy oil Group 1: chia oil (provided in 240 mL bottles, 4500 mL in total). Women were requested to consume 16 mL/day (10.1 g ALA/day). Total number randomised: n = 19 Group 2: sunflower/soy oil (provided in 240 mL bottles, 4500 mL in total). Women were requested to consume 16 mL/day. Total number randomised: n = 21 Timing of supplementation: from the 6th month of pregnancy until the 6th month of nursing (total of 9 months) All women: received a complete nutritional interview including nutritional diagnosis and counselling according to the dietary guidelines for pregnant women, were given plastic teaspoons (4 mL) for measuring consumption of intervention/control oil; received a dietary record to register the daily consumption of oil; visited weekly to assess oil consumption DHA + EPA dose/day: not applicable |
|
| Outcomes |
Women/birth: maternal diet (energy and composition of diet ingested by mothers during pregnancy and nursing); fatty acid composition of erythrocyte phospholipids of mothers during pregnancy and nursing; fatty acid profile of breast milk; length of gestation Babies/infants/children: birthweight; head circumference at birth |
|
| Notes |
Funding: not reported Declarations of interest: none declared |
|
| Risk of bias | ||
| Bias | Authors' judgement | Support for judgement |
| Random sequence generation (selection bias) | Unclear risk | Quote: “the pregnant women were randomly assigned to either the control group (n=21) or to the experimental group that received the dietary supplementation with chia oil” |
| Allocation concealment (selection bias) | Unclear risk | Quote: “the pregnant women were randomly assigned to either the control group (n=21) or to the experimental group that received the dietary supplementation with chia oil” |
| Blinding of participants and personnel (performance bias) All outcomes | Unclear risk | Not reported |
| Blinding of outcome assessment (detection bias) All outcomes | Unclear risk | Not reported |
| Incomplete outcome data (attrition bias) All outcomes | Low risk | No missing outcome data: all women randomised (to intervention and control), and their infants, were included for analyses. |
| Selective reporting (reporting bias) | Unclear risk | Few outcomes reported; additionally, without access to a published protocol it is not possible to assess selective outcome reporting confidently. |
| Other bias | Low risk | Data reported on the characteristics of women (age; weight; BMI; socioeconomic status) suggests groups were similar at baseline. |
Van Goor 2009.
| Methods | RCT: ISRCTN58176213 | |
| Participants | 183 women randomised (3 groups ‐ see below) Inclusion criteria: apparently healthy women with a low‐risk first or second pregnancy Exclusion criteria: preterm births (< 37 weeks) or GA > 42 weeks and any maternal or neonatal complications; vegetarians or vegans Characteristics: low background DHA intake (fish intake once a week) Setting: Groningen, the Netherlands: assumed to be during antenatal care (recruited by midwives and obstetricians) |
|
| Interventions |
SUPPLEMENTATION: DHA + AA versus DHA versus placebo Group 1: DHA + AA (220 mg each/day): total number randomised: 58 (41) Group 2: DHA (220 mg/day) + 1 soy capsule/day: 63 (41) Group 3: placebo (2 soy capsules/day); equivalent to 535 mg LA/day: total number randomised: n = 62 (36) Timing of supplementation: mean 16.5 weeks GA (range 14‐20 weeks) till 12 weeks postpartum (formula not supplied if child not breast fed) DHA + EPA dose/day: low: 220 mg DHA |
|
| Outcomes |
Women/birth: preterm birth; GA; GDM; fatty acids in plasma (at 16 and 36 weeks GA); EPDS at 16 and 36 weeks GA and 6 weeks pp; blues questionnaire within 1 week pp; DHA and AA in breastmilk (2 and 12 weeks pp); sleep quality (36 weeks GA and 4 weeks pp); Obstetric Optimality Score (74 items covering socioeconomic status, non‐obstetric conditions during pregnancy, obstetric history, diagnostic and therapeutic measures, parturition and neonatal condition immediately after birth; food frequency questionnaires (16 and 36 weeks GA, 12 weeks pp); fatty acids (in umbilical cord); birthweight; duration of breastfeeding Babies/infants/children: general movement quality; NOS; Hempel neurological examination; BSID II (Dutch version); weight at 18 months; height at 18 months; head circumference at 18 months; cerebral palsy (EPDS and Hempel reported as median and ranges only) |
|
| Notes |
Funding: Friesland Foods, the Netherlands Declarations of interest: none declared |
|
| Risk of bias | ||
| Bias | Authors' judgement | Support for judgement |
| Random sequence generation (selection bias) | Unclear risk | Block randomisation; not further reported |
| Allocation concealment (selection bias) | Unclear risk | Quote: “randomized into three groups” |
| Blinding of participants and personnel (performance bias) All outcomes | Low risk | Double‐blind placebo‐controlled |
| Blinding of outcome assessment (detection bias) All outcomes | Unclear risk | Not reported |
| Incomplete outcome data (attrition bias) All outcomes | High risk | 58/183 (32%) “lost interest” (23 placebo; 20 DHA; 15 DHA/AA); 6 pregnancy complications (3 placebo, 1 DHA, 2 DHA/AA), leaving 119 for analysis |
| Selective reporting (reporting bias) | Low risk | Most expected outcomes were reported (although numbers per group were not reported for EPDS > 12 and blues score > 12) |
| Other bias | Low risk | Baseline characteristics similar |
Van Winden 2017.
| Methods | RCT (pilot study) | |
| Participants | 14 women randomised (2 groups, see below) Inclusion criteria: women with diet‐controlled GDM, between 24‐30 weeks' gestation Exclusion criteria: not reported in conference abstract Setting: not reported in conference abstract |
|
| Interventions |
SUPPLEMENTATION: DHA + EPA versus placebo Group 1: commercial fish oil (2200 mg/day; 1300 mg EPA and 900 mg DHA). Total number randomised: n = 7 (4 completed) Group 2: placebo, identical (no further details in conference abstract). Total number randomised: n = 7 (5 completed) Timing of supplementation: 6 weeks (start 24‐30 weeks' gestation) DHA + EPA dose/day: high: 900 mg DHA + 1300 mg EPA |
|
| Outcomes | Women/birth: maternal adverse effects (narrative report only) | |
| Notes | No outcomes included that could be used in meta‐analysis Funding: not reported. Declaration of interests: none declared |
|
| Risk of bias | ||
| Bias | Authors' judgement | Support for judgement |
| Random sequence generation (selection bias) | Unclear risk | Not reported |
| Allocation concealment (selection bias) | Unclear risk | Not reported |
| Blinding of participants and personnel (performance bias) All outcomes | Low risk | Quote: "randomised in a prospective, double‐blind fashion to receive either 2200 mg daily of commercial fish oil ... or an identical placebo." |
| Blinding of outcome assessment (detection bias) All outcomes | Unclear risk | Not reported |
| Incomplete outcome data (attrition bias) All outcomes | High risk | 14 GDM patients randomised to treatment with fish oil (n = 7) or placebo (n = 7); 36% (3 in the treatment group, 2 in the placebo group) did not complete the treatment course due to intolerance. |
| Selective reporting (reporting bias) | Unclear risk | Confident assessment was not possible with conference abstract report only. |
| Other bias | Unclear risk | Information on methods insufficient to assess this domain confidently. |
Vaz 2017.
| Methods | RCT: NCT01660165 | |
| Participants | 60 women randomised Inclusion criteria: women 5‐13 weeks' gestation; aged 20‐40 years at the time of enrolment; free from any known chronic diseases; residing in the study catchment area; intending to continue prenatal care in the public health centre; classified as at risk for postpartum depression (reported a past history of depression or presented a depressive symptom score at baseline ≥ 9 based on the EPDS). Exclusion criteria: depressed or presented with psychotic symptoms; past history of mania; or at suicidal risk; or taking any psychiatric medication (as anti‐depressives and anxiolytics); or being seen by a psychologist or psychiatrist. Women taking any oil supplementation (such as fish oil, flaxseed oil or cod liver oil), were also excluded. Setting: Rio de Janeiro, Brazil (enrolled November 2009‐October 2011 and the last follow‐up visit occurred in July 2012). |
|
| Interventions |
SUPPLEMENTATION: omega‐3 versus placebo Group 1: omega‐3: 6 capsules/day, 1 g each, for a total dose of 1.8 EPA and 0.72 g DHA (The capsules were deodorised, and contained 0.2 mg/g of vitamin E as antioxidant. Women were advised to take 3 capsules at lunch and 3 capsules at dinner): n = 32 Group 2: placebo: n = 28 Timimg of supplementation: second trimester to 16 weeks postpartum All women: 400 µg/day of folic acid from the beginning of pregnancy, and 60 mg/day ferrous sulphate from the 2nd trimester until birth, as provided during standard prenatal care in Brazil. Participants were asked to not alter their usual dietary habits and not consume any supplements other than the ones provided by the research team and antenatal care service. DHA + EPA dose/day: high: 720 mg DHA + 1.8 g EPA |
|
| Outcomes |
Women/birth: length of gestation; depression (at 30‐32 weeks' gestation and 4‐6 weeks postpartum); adverse effects (gastrointestinal and non‐gastrointestinal); EPA, DHA and omega‐6/omega‐3 concentrations Babies/infants/children: birthweight The EPDS was used to measure depression, and scored at 5‐13 weeks' gestation, 22‐24 weeks' gestation (baseline for RCT), 30‐32 weeks' gestation, and 4‐6 weeks postpartum. The Portuguese version of the scale was validated in a sample of mothers from Pelotas, southern Brazil. EPDS score of ≥ 11 was the cut off for depressive symptoms. |
|
| Notes | The fish oil supplement was manufactured by Galena Nutrition Quίmica Industrial, São Paulo, Brazil. Funding: “The present study was supported by Carlos Chagas Filho Foundation for Research Support of Rio de Janeiro State (Grant No. E‐26/112.181/2012). The funding institution did not have any role in study design, data collection, analysis, and interpretation of results, writing the manuscript or in the decision to submit the manuscript for publication”. Declarations of interest: “The authors declare they have no competing interests”. |
|
| Risk of bias | ||
| Bias | Authors' judgement | Support for judgement |
| Random sequence generation (selection bias) | Unclear risk | Quote: "The randomization was performed by a researcher not involved in the data collection using the participant identification (subject ID) after stratification for EPDS score and previous history of depression”. |
| Allocation concealment (selection bias) | Unclear risk | Quote: "The randomization was performed by a researcher not involved in the data collection using the participant identification (subject ID) after stratification for EPDS score and previous history of depression”. |
| Blinding of participants and personnel (performance bias) All outcomes | Low risk | Quote: “Participants and all research assistants and technicians responsible for running both the cohort study and the RCT were blinded to the study allocation” |
| Blinding of outcome assessment (detection bias) All outcomes | Unclear risk | No information provided by the authors on whether assessors were blinded, for any of the outcomes reported. |
| Incomplete outcome data (attrition bias) All outcomes | High risk | Of the 32 women randomised to the intervention, 6 did not receive intervention (2 transferred antenatal care to another health centre; 3 exceeded 13 weeks of gestation at the baseline), and 7 dropped out before the end of pregnancy time‐point, leaving 17/32 women (53%) contributing data to the analysis for end of pregnancy/birth outcomes. A further 2 women were lost to follow‐up before the 4‐6‐week postpartum data collection time point (did not visit); therefore only 15/32 women (47%) of the women randomised to the intervention were included in the analysis for the postpartum outcomes. Of the 28 women randomised to the control, 4 did not receive intervention (1 transferred prenatal care to another health centre; 1 miscarriage; 2 missed 2nd trimester visit), and 5 dropped out before the end of pregnancy time‐point, leaving 17/28 women (60%) contributing data to the analysis for end of pregnancy/birth outcomes. |
| Selective reporting (reporting bias) | Unclear risk | Reporting of birthweight and GA incomplete (the total number of participants in the groups is not reported). |
| Other bias | Unclear risk | Baseline characteristics similar between except for ethnicity. |
Abbreviations:
2D: 2‐dimensional
AA: arachidonic acid; ALA: alpha‐linolenic acid; AIDS: acquired immune deficiency syndrome; ADA: American Diabetes Association;ASQ: Ages and Stages Questionnaire
BASC‐PRS: Behaviour Assessment for Children: Parent Rating Scale;BDI: Beck Depression Inventory;BMI: body‐mass index; BP: blood pressure; BPD: bronchopulmonary dysplasia; BSID: Bayley Scales of Infant Development
CES‐D: Center for Epidemiologic Studies Depression Scale; CRP: C‐reactive protein
DBP: diastolic blood pressure; DHA: docosahexaenoic acid; DNA: deoxyribonucleic acid; DPA: docosapentaenoic acid;DSM: Diagnostic and Statistical Manual;
EPA: eicosapentaenoic acid; EPDS: Edinburgh Postnatal Depression Scale; ERG: electroretinography;ERP: electroencephalography/event‐related potentials; ESOMAR: European Society for Opinion and Marketing Research; ETA: eicosatetranoic acid; EU: European Union
FADS: fatty acids desaturase; FDA: Food and Drug Administration; FFQ: food frequency questionnaire; FiO2: fraction of inspired oxygen; FPG: fasting plasma glucose
GA: gestational age; GDM: gestational diabetes mellitus; GLA: gamma linolenic acid; GWG: gestational weight gain
HAM‐D: Hamilton Rating Scale Depression; Hb: haemoglobin; HbA1c: glycated haemoglobin; HC:AC: head circumference/abdominal circumference; HDL‐cholesterol: high density lipoprotein‐cholesterol; HDRS: Hamilton Rating Scale for Depression; HLA: human leukocyte antigen; HIV: human immunodeficiency virus; HOMA‐B: Homeostatic Model Assessment of Beta cell function; HOMA‐IR: Homeostatic Model Assessment of Insulin Resistance;HOME: home observation measurement of the environment
IgE: immunoglobulin E; IGF: Insulin‐like growth factor; IL: interleukin;IQ: intelligence quotient; IQR: interquartile range;IU: international units; IUGR: intrauterine growth restriction; IVH: intraventricular haemorrhage
K‐ABC: Kaufman Assessment Battery for Children; K‐CPT: Conners Kiddie Continuous Performance Test
LA: linoleic acid; LC: long‐chain; LCPUFA: long‐chain polyunsaturated fatty acid; LGA: large‐for‐gestational age
MADRS: Montgomery–Åsberg Depression Rating Scale; MD: Maryland;MDI: mental development index (BSID);MRI: magnetic resonance imaging; mRNA: messenger ribonucleic acid; MTHF: methyltetrahydrofolic acid
n‐3: omega‐3; n‐6: omega‐6; n‐9: omega‐9; NBAS: Neonatal Behavioral Assessment Scale; NCT: ClinicalTrials.gov registry; NEC: necrotising enterocolitis; NICU: neonatal intensive care unit; NIDDK: National Institute of Diabetes and Digestive and Kidney Diseases; NIH: National Institutes of Health; NIMH: National Institute of Mental Health;NOS: neurological optimality score;NSAIDS: nonsteroidal anti‐inflammatory drugs
OGTT: oral glucose tolerance test
PDI: psychomotor development index (BSID); PDI: postnatal depression inventory; PDSS: Postpartum Depression Screening Scale;PE: pre‐eclampsia; PG: prostaglandin; PI: pulsatility index; PIH: pregnancy‐induced hypertension; PONCH: Pregnancy Obesity Nutrition and Child Health Study; PPH: postpartum haemorrhage; PPROM: preterm prelabour rupture of membranes
QUICKI: quantitative insulin sensitivity check index
RBC: red blood cell; RCT: randomised controlled trial; RDS: respiratory distress syndrome;RI: resistance index; ROP: retinopathy of prematurity
S/D: systolic/diastolic; SBP: systolic blood pressure;SD: standard deviation; SGA: small‐for‐gestational age; SiPS: Salmon in Pregnancy Study;sLORETA: standardised low‐resolution brain electromagnetic tomography
T1D: type 1 diabetes; TLR: toll‐like receptor; TOVA: Test of Variables of Attention
US: ultrasound; U.S. FDA: United States Food and Drug Administration
VLDL‐cholesterol: very low density lipoprotein‐cholesterol
WIC: Women, Infants and Children
Characteristics of excluded studies [ordered by study ID]
| Study | Reason for exclusion |
|---|---|
| Escobar 2008 | Trial registered but no participants were recruited |
| Fievet 1985 | Intervention (evening primrose oil) is not an omega‐3 fatty acid |
| Gholami 2017 | Not randomised |
| Herrera 1993 | Intervention (linoleic acid) is an omega‐6 fatty acid |
| Herrera 1998 | Intervention (linoleic acid) is an omega‐6 fatty acid |
| Herrera 2004 | Intervention (linoleic acid) is an omega‐6 fatty acid |
| Lauritzen 2004 | Women supplemented with omega‐3 fatty acids only during lactation |
| Marangell 2004 | Non‐randomised pilot study |
| Morrison 1984 | Intervention (linoleic acid) is an omega‐6 fatty acid |
| Morrison 1986 | Trial does not appear to be randomised. |
| Nishi 2016 | Non‐randomised pilot study |
| Starling 1990 | Not randomised: "divided into two groups" |
| Valentine 2013 | Lactating women only (human milk donor pilot study) |
| Velzing‐Aarts 2001 | Not randomised |
| Yelland 2016 | Methodological study across several trials |
Characteristics of studies awaiting assessment [ordered by study ID]
Farahani 2010.
| Methods | RCT |
| Participants | 120 women randomised |
| Interventions | 1) salmon fish oil capsule (1000 mg/day) from 16 weeks GA to birth 2) standard prenatal care |
| Outcomes | Systolic and diastolic blood pressure |
| Notes | In Arabic |
Gopalan 2004.
| Methods | Comparison of 3 groups ‐ not clear if this was a randomised study |
| Participants | 900 pregnant women; low socioeconomic status, attending government antenatal centres in India |
| Interventions | 1) 900 mg alpha linolenic acid daily from 22 weeks GA + iron/folate supplementation from 20 weeks' gestation 2) iron/folate (100 mg/500 μg) daily from 20 weeks GA 3) control |
| Outcomes | Birthweight; low birthweight; preterm birth < 37 weeks |
| Notes | Abstract only ‐ no details of how groups were allocated |
Jamilian 2018.
| Methods | RCT: IRCT201610015623N90 |
| Participants | 40 women aged 18‐40 diagnosed with GDM, based on the American Diabetes Association guidelines, without prior history of diabetes |
| Interventions | 1) 1000 mg fish oil capsules, containing 180 mg EPA and 120 mg (DHA) (n = 20)
2) placebo (n = 20) ‐ twice a day for 6 weeks from ˜25 weeks gestation |
| Outcomes | PPAR‐ʏ gene expression, low‐density lipoprotein receptor (LDLR), interleukin‐1 (IL‐1), interleukin‐8 (IL‐8), and TNF‐ɑ; birth outcomes; infant outcomes |
| Notes | need to clarify if this is a separate study or an additional report |
Kadiwala 2015.
| Methods | Abstract |
| Participants | |
| Interventions | |
| Outcomes | |
| Notes | Abstract only; no further information available |
Laitinen 2013.
| Methods | RCT (4 arms): NCT01922791 |
| Participants |
Recruitment target: 440 women. Inclusion criteria: less than 17 gestational weeks; overweight; healthy. Exclusion criteria: diabetes (Type 1 or 2); coeliac disease; increased bleeding tendency. Setting: Turku University Hospital, Finland. |
| Interventions |
Intervention groups 1) probiotic dietary supplements; 2) women will receive fish oil; and 3) probiotics and fish oil (from early pregnancy until 6 months after birth, no further information provided). Control group 4) placebo (from early pregnancy until 6 months after birth). |
| Outcomes |
Primary outcomes: GDM (at 24‐28 weeks' gestation; fasting glucose levels (assessed at third trimester of pregnancy); prevalence of allergy in child (at 12 and 24 months of age). Other outcomes: need for medication for management of GDM (insulin or metformin); body composition of mother (during and after pregnancy); immunologic and metabolic markers (during and after pregnancy); and faecal microbiota (during and after intervention); body composition, growth, development and metabolic markers of child 9 (0‐12 months). |
| Notes | awaiting to see if there are further reports of other outcomes |
Lazzarin 2009.
| Methods | RCT |
| Participants | 60 women with unexplained recurrent miscarriage |
| Interventions | 1) aspirin (20 women) 2) omega‐3 LCPUFA (20 women) 3) aspirin and omega‐3 LCPUFA (20 women) |
| Outcomes | Doppler uterine artery pulsatility index |
| Notes | awaiting to see if there are further reports of other outcomes |
Parisi 2013.
| Methods | RCT |
| Participants | 35 healthy singleton nulliparous pregnant women (20‐22 weeks' gestation) |
| Interventions | Not reported |
| Outcomes | Not reported |
| Notes | Insufficient detail in abstract |
Pavlovich 1999.
| Methods | RCT |
| Participants | 60 pregnant women at high risk of developing placental insufficiency |
| Interventions | 1) Picasol (omega‐3 fatty acid preparation) 2) placebo |
| Outcomes | Triglyceride and cholesterol concentrations |
| Notes | In Russian |
Sajina‐Stritar 1994.
| Methods | "comparative trial"; "randomly allocated" |
| Participants | 20 women at high risk of gestational hypertension |
| Interventions | Omega‐3 fatty acids versus aspirin |
| Outcomes | Hypertension and other pregnancy outcomes |
| Notes | Results not reported numerically |
Sajina‐Stritar 1998.
| Methods | "randomly allocated" |
| Participants | 48 women at high risk of gestational hypertension |
| Interventions | 1) aspirin (12 women) 2) fish oil (11 women) 3) no treatment (25 women) |
| Outcomes | Gestational hypertension |
| Notes | Not clear that this study is a RCT |
Salvig 2009.
| Methods | RCT |
| Participants | 190 women with a previous preterm birth < 34 weeks GA |
| Interventions | Omega‐3 (2.7 g/day) versus olive oil |
| Outcomes | Preterm birth; GA |
| Notes | Abstract; states only that no differences were found and no numeric results were reported |
Salzano 2001.
| Methods | "divided into 2 unequal groups" |
| Participants | 65 primigravid women at risk of hypertension |
| Interventions | 1) calcium, linoleic acid, mono and polyunsaturated fatty acids (40 women) 2) no treatment (25 women) |
| Outcomes | Gestational hypertension |
| Notes | not clear if this is a RCT |
Stoutjesdijk 2014.
| Methods | RCT (4‐arm trial) |
| Participants | 43 healthy women in first trimester of pregnancy, intending to breastfeed |
| Interventions | 4 different doses of DHA/EPA |
| Outcomes | Maternal RBC and milk DHA/EPA concentrations at 4 weeks postpartum |
| Notes | no maternal or birth outcomes yet reported |
Vahedi 2018.
| Methods | RCT |
| Participants | pregnant women |
| Interventions | 1) fish oil supplementation 2) control |
| Outcomes | maternal glucose concentrations, haemoglobin, haematocrit |
| Notes | not enough detail yet available |
Vakilian 2010.
| Methods | RCT |
| Participants | 100 women with a singleton pregnancy, aged between 18‐40, any acute or chronic diseases, antenatal care before 16 weeks' gestation, non‐smoking |
| Interventions | 1) omega 3 (1000 mg) from 16 weeks to 40 weeks' gestation 2) no treatment |
| Outcomes | Lipid peroxide, thiol group, and ferric reducing antioxidant plasma |
| Notes | Completed but no English translation is available |
Valentine 2014.
| Methods | RCT |
| Participants | 90 pregnant women (19‐20 weeks GA); > 18 years; diagnosed with hypertension; without bleeding disorders, lupus, autoimmune diseases, or presence of infant congenital (trisomy 13, 18, 21, urethral, gastrointestinal and cardiac defects) |
| Interventions | 1) 200 mg DHA daily, from 18‐20 weeks GA to 6 weeks postpartum 2) 1000 mg DHA daily, from 18‐20 weeks GA to 6 weeks postpartum |
| Outcomes | Primary: endothelial health (measures not reported); secondary: maternal homoeostasis (blood and cord blood concentrations of pro‐inflammatory cytokines IL‐6, I L‐8, TNF a, and receptor sRAGE |
| Notes | May have been withdrawn/never commenced |
Valenzuela 2017.
| Methods | abstract |
| Participants | |
| Interventions | |
| Outcomes | |
| Notes | not enough detail provided in the abstract |
GA: gestational age RCT: randomised controlled trial
Characteristics of ongoing studies [ordered by study ID]
Albert 2017.
| Trial name or title | Fish oil in pregnancy for a healthy start to life for the children of overweight mothers |
| Methods | RCT: ACTRN12617001078347p |
| Participants |
Recruitment target: 160 women. Inclusion criteria: age > 18 < 40 years; pregnant; BMI 30‐45; singleton pregnancy; between 12‐16 weeks of gestation. Exclusion criteria: current use of tobacco or nicotine; illicit drugs or medications that influence blood pressure; lipid metabolism or insulin sensitivity. Women were also excluded if they had diabetes mellitus or chronic illnesses such as autoimmune disease or malignancy. Setting: Auckland, New Zealand. |
| Interventions |
Intervention group 3 g of omega‐3 PUFA rich fish oil taken in capsules on each day of pregnancy and for 3 months during the breastfeeding period. Note that if the mother chooses to stop breastfeeding then supplementation will stop early, this will be at birth if the mother decides not to breast feed at all. Compliance will be assessed by return of unused capsules, and secondarily by measurement of omega‐3 PUFA levels in maternal red blood cells. Note that the expected concentration of omega‐3 PUFAs in this oil is 33% EPA/22% DHA, but this will be independently verified. Control group 3 g of olive oil taken in capsules on each day of pregnancy and for 3 months during the breastfeeding period (if the mother chooses to breast feed) |
| Outcomes |
Primary outcome: whole body percentage body fat, as measured by DXA scan (in the offspring). Other outcomes: peripheral quantitative computed tomography derived measures of bone strength from the lower Tibia (in the offspring, at 2 weeks of age); birthweight; whole body percentage body fat, measured by DXA scan (in the offspring, at 3 months of age); HOMA‐IR (in the offspring, at 3 months of age); weight in the offspring (at 12 months of age); HOMA‐IR (in the mother, at 30 weeks' gestation); Ponderal Index (in the offspring, at 12 months of age); Insulin sensitivity as determined by a modified IVGTT with minimal modelling (offspring, 4‐7 years of age). |
| Starting date | 2 October 2017 |
| Contact information | Dr Benjamin Albert, Liggins Institute, University of Auckland. E‐mail: b.albert@auckland.ac.za |
| Notes | Funding and collaborators: A Better Start National Science Challenge, Funded by the Ministry of Business, Innovation and Employment (government body, New Zealand); Cure Kids (charity, New Zealand); Health Research Council (charity, New Zealand); Liggins Institute, University of Auckland. |
Carlson 2017 ADORE.
| Trial name or title | ADORE |
| Methods | RCT (multi‐centre, adaptive design, 3 arms): NCT02626299 |
| Participants | Recruitment target: 1200 women. Inclusion criteria: women ≥ 18 years; 12–20 weeks of gestation; agree to consume study capsules and a typical prenatal supplement of 200 mg CHA; and available by telephone. Exclusion criteria: expecting multiple infants; gestational age at baseline < 12 weeks or > 20 weeks; unable or unwilling to agree to consume capsules until birth; unwilling to discontinue use of another prenatal supplement with DHA; and with allergy to any component of DHA product (including algae), soybean oil or corn oil. Setting: Kansas, USA. |
| Interventions |
Intervention group DHA supplements (800 mg/day), administered in 2 400 mg capsules, plus 1 200 mg/capsule per day of DHA that is a common amount in prenatal vitamins. Control group Standard care (200 mg/day of DHA) administered in 2 capsules (masked) containing half soybean oil and half corn oil equalling 800 mg. the soybean and corn oil combination does not contain DHA. |
| Outcomes |
Primary outcome: early preterm birth < 34 weeks (baseline to 34 weeks). Other outcomes: change in plasmal soluble(s) RAGE concentration (baseline to 34 weeks); and adverse events (34 weeks). |
| Starting date | 8 June 2016 |
| Contact information | Dr Susan Carlson, University of Kansas Medical Center, USA, E‐mail: scarlson@kumc.edu |
| Notes | Funding and collaborators: NICHD R01 HD083292, University of Kansas Medical Center, University of Cincinnati, Ohia State University, Nationwide Children's Hospital. |
Carvajal 2014.
| Trial name or title | Docosahexaenoic acid (DHA) supplementation during pregnancy to prevent deep placentation disorders: a randomized clinical trial and a study of the molecular pathways of abnormal placentation prevention |
| Methods | RCT |
| Participants | 2400 women 18 years or older; GA < 16 weeks Setting: Chile |
| Interventions | DHA (600 mg/day) from early pregnancy until the ed of pregnancy versus placebo |
| Outcomes | Composite of preterm birth < 34 weeks or pre‐eclampsia before 34 weeks or severe fetal growth restriction < 34 weeks GA |
| Starting date | May 2015 |
| Contact information | Jorge Carvajal, email: jcarva@med.puc.cl |
| Notes |
de Carvalho 2017.
| Trial name or title | Gestational obesity and interventions with probiotics or fish oil trial: GOPROFIT |
| Methods | RCT (4 arms) |
| Participants | 80 women at 13 weeks GA, aged between 19 to 40, pre‐pregnancy BMI > 29.9 Setting: Brazil |
| Interventions | 1) DHA (100 mg) + EPA (137 mg) a day 2) probiotic 1 3) probiotic 2 4) placebo |
| Outcomes | Inflammation |
| Starting date | March 2015 |
| Contact information | Fátima Lúcia C Sardinha, email: sardinhaflc@nutricao.ufrj.br |
| Notes |
Dos Santos 2018.
| Trial name or title | Omega‐3 supplementation during pregnancy to prevent postpartum depressive symptoms and possible effect on breastfeeding, child growth and development |
| Methods | RCT |
| Participants | 80 women with postpartum depression score greater than or equal to 10 and need for medical treatment and/or medical follow‐up |
| Interventions | 1) fish oil (1000mg DHA and 400mg EPA per day) 2) placebo capsules (olive oil) Both groups will be instructed to ingest 2 x 1000mg capsules per day for 16 weeks. |
| Outcomes | Prevention of postpartum depressive symptoms (Edinburgh Postnatal Depression Scale) |
| Starting date | August 2018 |
| Contact information | Luana Caroline dos Santos, email: luanacstos@gmail.com |
| Notes | Universidade Federal de Minas Gerais |
Dragan 2013.
| Trial name or title | The impact of EPA and DHA supplementation on the content of lipids in the pregnant women and the fetus |
| Methods | RCT |
| Participants |
Recruitment target: 87 women. Inclusion criteria: healthy; with a singleton pregnancy; BMI < 25 kg/m2; willing to provide informed consent. Exclusion criteria: pregnancy terminated as preterm birth; with chronic illness; gestational diabetes mellitus or pre‐eclampsia. Setting: Bosnia, Herzegovina. |
| Interventions |
Intervention group 360 mg EPA (eicosapentanoic fatty acid) and 240 mg DHA (docosahexanoic fatty acid) per day during pregnancy, from baseline (14th week of gestation) until birth. Control group No supplementation of omega‐3 fatty acids during pregnancy. |
| Outcomes | Primary outcomes: concentration of omega‐3 fatty acids in total serum lipids, measured using gas chromatography at the end of pregnancy; concentration of omega‐3 fatty acids in umbilical vein serum, measured using gas chromatography at time of birth; concentration of monounsaturated fatty acids in serum total lipids of umbilical vein serum, measured by gas chromatography at time of birth; concentration of monounsaturated fatty acids in serum total lipids of the mother's serum, measured by gas chromatography at the end of pregnancy; weight of mother, measured by weighing scale at recruitment, 20th week of gestation, 30th week of gestation and before birth. Secondary outcomes: weight of mother (measured at recruitment, 20 weeks of gestation, 30 weeks of gestation and before birth). |
| Starting date | May 2013 |
| Contact information | Dr Soldo Dragon, Department of Obstetrics and Gynecology School of Medicine Mostar, Kralja Tvrtka, b.b. Mostar 88000, Bosnia, Herzegovina. E‐mail:dragan.soldo3@tel.net.ba |
| Notes | Funding and collaborators: investigator initiated and funded. |
FOPCHIN.
| Trial name or title | FOPCHIN |
| Methods | RCT (3 arms): NCT02770456 |
| Participants |
Recruitment target: 5531 women Inclusion criteria: women 20 to 44 years and pregnant without known complications. Exclusion criteria: regular user of fish oil; regular user of NSAIDs; known twin pregnancy. Setting: China* |
| Interventions |
Intervention group 1) High‐dose intervention group: 4 0.72‐g gelatine capsules daily with fish oil providing 2.0 g/d Ic‐n3FA, from 16‐24 weeks' gestation until they have completed the preterm period (i.e. at 37 full gestation weeks) or until they deliver. 2) Low‐dose intervention group will receive 4 0.72‐g gelatine capsules daily with a mixture of fish oil and olive oil providing 0.5 g/d Ic‐n3FA, from 16‐24 weeks' gestation until they have completed the preterm period (i.e. at 37 full gestation weeks) or until they deliver. Control group Placebo (4 x 0.72‐g gelatine capsules daily with olive oil providing 0 g/d Ic‐n3FA), from 16‐24 weeks' gestation until they have completed the preterm period (i.e. at 37 full gestation weeks) or until they deliver. |
| Outcomes |
Primary outcome: preterm birth. No other outcomes specified. |
| Starting date | March 2008 |
| Contact information | Dr Sjurdur F Olsen, Statens Serum Institut. E‐mail: SFO@ssi.dk |
| Notes | Funding and collaborators: Centre for Fetal Programming, Denmark; Shanghai Institute of Planned Parenthood Research. * assumed, not specifically stated |
Garg 2017.
| Trial name or title | Omega‐3 fish oil for the prevention of gestational diabetes |
| Methods | RCT: ACTRN12617000177358 |
| Participants |
Recruitment target: 74 women Inclusion criteria: < 14 weeks pregnant; aged 18‐40; with any 1 of the following: a) PAPP‐A between 0.3 and 0.6 MoM in their Nuchal Translucency Scan b) previous history of gestational diabetes c) at risk of developing gestational diabetes Exclusion criteria: BMI greater than 45 kg/m2; any incidence of ongoing bleeding beyond 8 weeks' gestation in the current pregnancy; on anti‐coagulant therapy or known to have clotting disorders; known to be pregnant with multiples; lactating; established diabetes prior to pregnancy or currently taking anti‐diabetic medications; being diagnosed with gestational diabetes in this pregnancy prior to enrolment in the study; known allergies to seafood or corn; currently on medication with aspirin and warfarin; has significant current gastrointestinal disease; incapable of giving informed consent; history of new investigational drug 3 months prior to this trial; currently consuming more than 200 g oily fish per week or taking supplements delivering 150 mg or more of DHA/day; unable to fast for 10 hr before obtaining blood sample Setting: John Hunter Hospital, Newcastle, Australia |
| Interventions |
Intervention group 2 x 1 g fish oil capsules each day (each capsule containing 60mg eicosapentaenoic acid and 430 mg DHA) from ˜ 14 weeks' gestation until 34 weeks' gestation Control group Placebo: 1 x 1 g corn oil capsules/day from ˜ 14 weeks' gestation until 34 weeks' gestation |
| Outcomes |
Primary outcome: insulin resistance, as measured by HOMA‐IR fasting glucose X fasting insulin/22.5 (at 14, 20, 28 & 34 weeks' gestation). Other outcomes: plasma inflammatory markers (IL‐6, TNF‐alpha, CRP, IL‐1beta) and adipokines (adiponectin, leptin), measured using ELISA assays (at 14, 20 & 34 weeks' gestation); blood pressure (at 14, 20 & 34 weeks' gestation); newborn whole‐blood fatty acid composition (48‐72 hours after birth); Matsuda Index (calculated from 2 hour oral glucose tolerance test at 28 weeks' gestation); erythrocyte fatty acid composition, measured by gas chromatography from a fasting blood sample (at 14, 20 & 34 weeks' gestation) |
| Starting date | 1 March 2017 |
| Contact information | Prof Manohar Garg, University of Newcastle. E‐mail: manohar.garg@newcastle.edu.au |
| Notes | Funding and collaborators: University of Newcastle, Australia and EPAX, Norway. |
Garmendia 2015.
| Trial name or title | Diet and physical activity counselling and n3‐long chain (PUFA) supplementation in obese pregnant women (MIGHT) |
| Methods | RCT (cluster, with 4 arms): NCT02574767 |
| Participants |
Recruitment target: 1000 women. Inclusion criteria: ≤ 14 weeks' gestational age at first prenatal visit; BMI > 30 kg/m2 at first prenatal visit; singleton pregnancy; plan to deliver at Sotero del Rio Hospital. Exclusion criteria: pre‐existing diabetes (known or diagnosed at first control (fasting plasma glucose > 126 mg/dl or 2 h plasma glucose > 200 mg/dl during an OGTT; insulin or metformin use; known medical or obstetric complications which restrict physical activity; history of eating disorders; high risk of haemorrhagic bleeding; high‐risk pregnancy according to national guidelines. Setting: 12 primary healthcare centres (PHCC) and Sotero del Rio Hospital, Chile. |
| Interventions |
Intervention groups 1) 'Lifestyle counselling + PUFA supplement group': home‐based diet & physical activity counselling (2 home visits of 1 hour duration consisting of individually tailored dietary educational and behaviour education plus PUFA supplementation (n3LC‐PUFAs oral supplementation based on Schizochytrium oil (S‐oil) containing 800 mg DHA acid/day, administered as capsular preparations containing 200 mg DHA/capsule (4 capsules/day). 2) 'PUFA supplementation" group': routine dietary and physical activity counselling plus n3LC‐PUFAs oral supplementation based on Schizochytrium oil (S‐oil) containing 800 mg DHA acid/day, administered as capsular preparations containing 200 mg DHA/capsule (4 capsules/day). Control groups 3) 'Llifestyle counselling + PUFA placebo group': home‐based diet & physical activity counselling (2 home visits of 1 hour duration consisting of individually tailored dietary educational and behaviour education plus capsular preparations containing 50 mg DHA capsule (4 capsules/day), delivered in the same way as the n3LC‐PUFA supplementation. 4) 'Routine diet & PA + PUFA placebo group': routine dietary and physical activity counselling plus capsulare preparations containing 50 mg DHA/capsule (4 capsules/day), delivered in the same way as the n3LC‐PUFA supplementation. |
| Outcomes |
Primary outcomes: GDM (at 24‐28 weeks of gestation according to ADA 2011 guidelines); macrosomia (birthweight > 4000 g); prevalence of insulin resistance at birth. Other outcomes: low birthweight (below 2500 g); excess weight gain during pregnancy; pre‐eclampsia (at 24‐28 weeks of gestation); preterm birth (< 37 weeks); caesarean. |
| Starting date | August 2015 |
| Contact information | Dr Maria Luisa Garmendia. E‐mail: mgarmendia@inta.uchile.ch |
| Notes | Funding and collaborators: University of Chile; Fondo Nacional de Desarrolo Cientificao y Technológico, Chile; DSM Nutritional Products, Inc; Corporación de Apoyo de la Investigatión Científica en Nutrición. |
Ghebremeskel 2014.
| Trial name or title | DHA4PREG: DHA for PREGnant women: is the current recommendation appropriate for women with very low intake and status? |
| Methods | RCT (with 3 arms) |
| Participants |
Recruitment target: 180 women Inclusion criteria: healthy pregnant women with a singleton pregnancy (with very low DHA intake and status) Exclusion criteria: pre‐existing chronic medical conditions such as diabetes, high blood pressure, congenital heart disease, kidney disease, very preterm birth; sickle cell disease or haemoglobinopathies; history of pre‐eclampsia, stillbirth, fetal death, major fetal abnormality; smoking or illegal substance use. Setting: Sudan |
| Interventions |
Intervention group 1) Low‐dose intervention group: 575 mg omega‐3 (322.5 mg DHA and 47.2 mg EPA) 2) High‐does intervention group: 1725 mg omega‐3 (967.7 mg DHA and 141.5 mg EPA) Control group 3) placebo |
| Outcomes | Maternal DHA concentrations (blood and breast milk); fetal growth; preterm birth; gestational age at birth; birthweight; head circumference; length |
| Starting date | September 2014 |
| Contact information | Professor Kebreab Ghebremeskel: k.ghebremeskel@londonmet.ac.uk |
| Notes | Funding and collaborators: Lipidomics and Nutrition Research Centre, London Metropolitan University, London (UK). |
Hegarty 2012.
| Trial name or title | STABIL: Fish oil for mood stabilization during pregnancy in women with bipolar disorder |
| Methods | RCT: ACTRN12612000405819 |
| Participants |
Recruitment target: 200 women Inclusion criteria: pregnant women (up to 10 weeks of pregnancy, clinical diagnosis of bipolar disorder I or II, using MS medication with an intention to either continue or discontinue MS medication throughout pregnancy, no experience of a mood episode reaching DSM IV‐TR criteria within 4 weeks of recruitment, prepared to continue regular visits to personal treating medical professional/s throughout study period for ongoing psychiatric and antenatal care, able to give informed consent. Exclusion criteria: under 18 years of age, poor written and/or spoken English, diagnosed with schizophrenia or schizoaffective disorder, taking any daily supplement containing more than 120 mg EPA or more than 500 mg EPA + DHA, at high risk of suicide, participating in another clinical trial, current drug or alcohol problems, unstable medical condition or unstable thyroid dysfunction or lipid metabolism disorder, current use of anticoagulant therapy, have a bleeding disorder, fish/seafood allergy. Setting: Australia |
| Interventions |
Intervention group 5 g concentrated omega‐3 triglycerides from fish, containing 1000 mg DHA and 1500 mg EPA daily, taken as an oral capsule once daily, from enrolment (up to 10 weeks of pregnancy) till 12 weeks postpartum Control group 1 g concentrated omega‐3 triglycerides from fish, containing 430 mg DHA and 90 mg EPA, plus 4 g medium chain fatty acids from coconut, taken as an oral capsule once daily, from enrolment (up to 10 weeks of pregnancy) till 12 weeks postpartum |
| Outcomes |
Primary outcomes: number of mood episode recurrences (defined by DSM‐IV criteria for major depression, hypomania or mania, or the need for rescue medication to be provided by the treating clinician due to deteriorating mood) Other outcomes: time to onset of first mood episode recurrence; severity of depressive and manic symptoms (Montgomery Asberg Depression Rating Scale (MADRS) and Young Mania Rating Scale (YMRS) will be used to assess the severity of mood symptoms) |
| Starting date | 1 May 2012 |
| Contact information | B Hegarty. E‐mail: b.hegarty@unsw.edu.au |
| Notes | Funding and collaborators: Department of Health and Aging, Canberra; University of New South Wales, Black Dog Institute (Australia) |
Hendler 2017.
| Trial name or title | The effect of alpha linolenic acid (ALA) supplementation during pregnancy |
| Methods | RCT (3 arm): NCT03040856 |
| Participants | 150 pregnant women aged 18 to 45 years attending the high‐risk clinic (GA 12‐16 weeks) |
| Interventions | ALA (1260 mg/day) versus DHA + EPA (480 mg DHA and 720 mg EPA/day) versus placebo (olive oil) |
| Outcomes | Omega‐3 fatty acid concentrations, expression of messenger RNAs |
| Starting date | May 2017 |
| Contact information | Aya Mohr Sasson, email: mohraya@gmail.com |
| Notes | Sheba Medical Center, Israel |
Khandelwal 2012.
| Trial name or title | Effect of Docosa‐Hexanoic Acid (DHA) Supplements During Pregnancy on Newborn Outcomes in India: (DHANI) |
| Methods | RCT: NCT 01580345. |
| Participants |
Recruitment target: 600 women Inclusion criteria: 18 to 35 years or older; ≤ 20 weeks of gestation; willing to participate in the study and perform all measurements for self, husband and offspring; willing to provide signed and dated informed consent. Exclusion criteria: allergic (if aware) to any of the test products; at high risk for hemorrhagic bleeding, clotting (if aware); high‐risk pregnancy; consuming omega‐3 supplements or having used these in 3 months preceding the intervention period; reported participation in another biomedical trial 3 months before the start of the study or during the study. Setting: KLEUs Jawaharlal Nehru Medical College, Prabhakar Kore Charitable Hospital, Belgaum, Karnataka, India. |
| Interventions |
Intervention group 400 mg of DHA daily, from ≤ 20 weeks' gestation until birth. Control group 400 mg/day of placebo (corn/soy oil), from ≤ 20 weeks' gestation until birth. |
| Outcomes |
Primary outcomes: newborn anthropometry (birthweight, length, and head circumference). Other outcomes: gestational age; new born APGAR score (at 1 minute and 5 minutes); unfavourable pregnancy outcomes (stillbirth, low birthweight babies, and preterm babies) |
| Starting date | December 2015 |
| Contact information | Dr Shweta Khandelwal, Senior Public Health Nutritionist, Centre for Chronic Disease Control, India. E‐mail: shweta.khandelwal@phfi.org |
| Notes | Funding and collaborators: Centre for Chronic Disease Control, India; Department of Science and Technology, Government of India; Jawaharlal Nehru Medical College. |
Kodkhany 2017.
| Trial name or title | Maternal DHA Supplementation and Offspring Neurodevelopement in India (DHANI‐2) |
| Methods | RCT: NCT03072277 |
| Participants | 957 participants Inclusion criteria: 18 to 35 year old pregnant women (singleton) at ≤ 20 weeks GA, willing to participate in study and perform all measurements for self, husband and offspring including anthropometry, dietary assessment, questionnaires and biological samples (blood and breast milk), willing to provide signed and dated informed consent Exclusion criteria: allergic (if aware) to any of the test products, at high risk for haemorrhagic bleeding or clotting (if aware), high‐risk pregnancies (history and prevalence of pregnancy complications, including abruptio placentae, pre‐eclampsia, pregnancy‐induced hypertension, any serious bleeding episode in the current pregnancy, and/or physician referral); and/or diagnosed chronic degenerative disease(s) such as diagnosed heart disease, cancer, stroke or diabetes (as omega‐3 could raise blood sugar and lower insulin promotion) Setting: KLEUs Jawaharlal Nehru Medical College, Prabhakar Kore Charitable Hospital, Belgaum, Karnataka, India. |
| Interventions |
Intervention group DHA (400 mg/day) from ≤ 20 weeks of gestation through 6 months postpartum Control group Placebo (400 mg/day corn/soy oil) from ≤ 20 weeks of gestation through 6 months postpartum |
| Outcomes |
Primary outcomes: infant neurodevelopment defined as measured by the mean difference in the average Developmental Quotient (DQ) scores of the 2 groups Other outcomes: DHA levels (fatty acid levels in maternal and infant blood) |
| Starting date | December 2015 |
| Contact information | Public Health Foundation of India cited as responsible party, no further details. |
| Notes |
Funding and collaborators: Public Health Foundation of India, Jawaharlal Nehru Medical College, India Alliance Estimated study completion date: December 2020 (primary completion August 2019) |
Li 2013.
| Trial name or title | Effect of omega‐3 fatty acids on insulin sensitivity in Chinese gestational diabetes patients |
| Methods | RCT: NCT01912170 |
| Participants |
Recruitment target: 75 women. Inclusion criteria: 18‐40 years; with gestational diabetes; willing to participate in the trial. Exclusion criteria: type 1 diabetes mellitus or type 2 diabetes mellitus before pregnancy; not willing to provide informed consent; with a family history of hypertriglyceridaemia or fasting triglyceride > 4.56 mmol/L; diagnosed with severe liver disease, kidney disease or cancer; participating in another clinical trial within 30 days; other diseases or conditions for which the doctor does not agree to the participant's participation. Setting: Jiaxing Women's and Children's Hospital, China. |
| Interventions |
Intervention group Fish oil 2 g a day (220 mg EPA and 170 mg DHA per 1 g capsule), from the third trimester of pregnancy until the 4th week after birth. Control group Flaxseed oil 2 g a day (550 mg ALA per 1 g capsule), from the third trimester of pregnancy until the 4th week after birth. |
| Outcomes |
Primary outcomes: fasting glucose; fasting insulin. Secondary outcomes: birthweight; birth length; blood lipids. |
| Starting date | August 2013 |
| Contact information | Professor Duo Li (Principal Investigator) and Huijuan Liu (contact provided), Zhejiang University, China. E‐mails: not provided. |
| Notes | Funding and collaborators: Zhejiang University; National Natural Science Foundation of China. |
Makrides 2013 (ORIP).
| Trial name or title | Omega‐3 fats to reduce the incidence of prematurity: the ORIP trial |
| Methods | RCT: ACTRN12613001142729 |
| Participants |
Recruitment target: 5540 women. Inclusion criteria: < 20 weeks' gestation (singleton or multiple pregnancy). Exclusion criteria: known fetal abnormality; taking dietary supplements containing LCPUFA 150mg/day; taking dietary supplements containing LCPUFA 150 mg/day and not willing to stop; bleeding disorders where fish oil is contraindicated or on anticoagulant therapy; and history of drug or alcohol abuse. Setting: South Australia, Victoria and Queensland, Australia. |
| Interventions |
Intervention group 3 capsules of fish oil containing a total dose of approximately 800 mg of DHA daily from enrolment (12 weeks ‐ 20 weeks' gestation) until 34 weeks of gestation or birth (whichever occurs first) Control group 3 placebo vegetable oil capsules with a trace of DHA to aid masking. |
| Outcomes |
Primary outcome: early preterm birth (< 34 weeks). Other outcomes: post‐term induction; post‐term pre labour caesarean birth; preterm birth (< 37 weeks); safety and tolerability of DHA supplementation; low birthweight (< 2500 g); small‐for‐gestational age (< 10th centile for corresponding GA and sex); neonatal complications (up to 28 days post birth); admission to NICU. |
| Starting date | October 2013 |
| Contact information | Prof Maria Makrides, SAHMRI. E‐mail: maria.makrides@sahmri.com |
| Notes |
Funding and collaborators: NHMRC; SAHMRI. Recruitment ended 27 April 2017. |
Martini 2014 (CORDHA).
| Trial name or title | A randomised controlled trial for the optimization of the viability of stem cells derived from umbilical CORd blood after maternal supplementation with DHA during the second or third trimester of pregnancy (CORDHA) |
| Methods | RCT: ISRCTN58396079. |
| Participants |
Recruitment target: 150 women. Inclusion criteria: Caucasian, non‐smoker, > 18 years of age, single pregnancy, absence of diabetes or hypertension or any other type of pathology requiring pharmacological therapy, absence of chromosome abnormalities and/or congenital malformations in the fetus, and HBV, HCV, HIV and CMV negative. Exclusion criteria: impossible to collect cord blood (for bureaucratic reasons or because of emergencies regarding the health of the mother or the baby), taken other supplements containing DHA or fish oil, temperature of 39C during birth, and UCB samples with a volume of less than 80 mL and/or less than 70% cell vitality. Setting: Rome, Italy. |
| Interventions |
Intervention group DHA (250 mg/day), from the 20th or from the 28th week up to the 40th week of estimated gestational age. Control group Placebo (250 mg olive oil/day), from the 20th or from the 28th week up to the 40th week of estimated gestational age. |
| Outcomes |
Primary outcome: measure of the viability (%) and the number of CD34+ cells collected from the umbilical cord blood at birth. No other outcomes specified. |
| Starting date | September 2010 |
| Contact information | Irene Martini, Via Vittorio Locchi 9 00197 Rome, Italy. E‐mail: martini@smartbank.it |
| Notes |
Funding and collaborators: SmartBank SRL; Biovault and Avantgarde SAS. Recruitment ended September 2014. |
Mbayiwa 2016.
| Trial name or title | Improving Maternal and Child Health Through Prenatal Fatty Acid Supplementation (NAPS): A Randomized Controlled Study in African‐American Women Living in Low‐income Envrionments |
| Methods | RCT (NCT02647723) |
| Participants |
Recruitment target: 162 women. Inclusion criteria: women 18 to 34 years of age, household recipient of public assistance (e.g. Medicaid insurance) due to low income, low levels of DHA consumption defined as less than 2 fish servings per week Exclusion criteria: reports of known medical complications, regular use of steroid medications or alcohol or cigarettes or illegal substances (by medical report), use of blood thinners or anti‐coagulants, use of psychotropic medications, BMI > 40, allergy to iodine and/or soy Setting: United States, Illinois |
| Interventions |
Intervention group DHA (450 mg twice daily), by oral intake, for 24 weeks Control group Placebo (450 mg soybean oil twice daily, by oral intake, for 24 weeks) |
| Outcomes |
Primary outcome: average change in perceived stress scale (PSS) score (time frame 16 months), assessed at baseline and at 24, 30 and 36 weeks of pregnancy, and at 1, 4 and 9 months after birth No other outcomes specified |
| Starting date | January 2016 |
| Contact information | Kimberley Mbayiwa. E‐mail: kmbayiwa@yoda.bsd.uchicago.edu |
| Notes | Funding and collaborations: University of Chicago, Eunice Kennedy Shriver National Institute of Child Health and Human Development (NICHD), University of Pittsburgh. |
Murff 2017 (FORTUNE).
| Trial name or title | Fish Oil to Reduce Tobacco Use iN Expectant Mothers (FORTUNE) |
| Methods | RCT: NCT03077724 |
| Participants | 40 pregnant women aged 18 to 45 years, between 6 and 36 weeks' gestation, who are active smokers Setting: Nashville, Tennessee, United States |
| Interventions | Omega‐3 (4.2 g/day) versus placebo (olive oil) |
| Outcomes | Reduction in total cigarettes smoked per day |
| Starting date | March 2017 |
| Contact information | Associate Professor Harvey Murff, Vanderbilt University Medical Center, USA. email: harvey.j.murff@vanderbilt.edu |
| Notes | Pilot feasibility trial |
Nishi 2015 (SYNCHRO).
| Trial name or title | SYNCHRO |
| Methods | RCT (multi centre): NCT02166424 |
| Participants |
Recruitment target: 108 women. Inclusion criteria: ≥ 20 years; 12‐24 weeks' gestation, Japanese conversational ability in Japan site, Mandarin conversational ability in Taiwan site, willing to take assessments after childbirth, with EPDS 9 or more and in good physical health (judged by obstetricians). Exclusion criteria: history and current suspicion of psychosis or bipolar disorder or substance‐related disorder or eating disorder or personality disorder, serious phychiatric symptoms such as self‐harm behaviour or in need of rapid psychiatric treatment, difficult to expect a normal birth, having a history of bleeding disorder such as von Willebrand's Disease, regular treatment with Asprin or warfarin within the last 3 months, a smoking habit of ≥ 40 cigarettes per day, regular treatment with ethyl icosapentate or regular consumption of omega‐3 PUFA supplements within the last 3 months, and a habit of eating fish as a main dish ≥ times per week. Setting: Japan and Taiwan. |
| Interventions |
Intervention group Omega‐3 polyunsaturated fatty acids (1200 mg eicosapentaenoic acid EPA and 600 mg DHA daily). Control group Placebo (2880 mg olive oil daily). |
| Outcomes |
Primary outcome: total score on HAMD (12 weeks). Other outcomes: total score on HAMD (4‐6 weeks after childbirth); MDD as determined by the depression module of MINI (4‐6 weeks after childbirth); total scores on EPDS (4‐6 weeks after childbirth); total score on BDI‐Ⅱ (4‐6 weeks after childbirth); omega‐3 fatty acids concentrations in erythrocytes (4‐6 weeks after childbirth); oestrogen in plasma (4‐6 weeks after childbirth); oxytocin in plasmal (4‐6 weeks after childbirth); progesterone in plasma (4‐6 weeks after childbirth), hCG in plasma (4‐6 weeks after childbirth), phospholipase A2 in plasma (4‐6 weeks after childbirth);gestational age (at childbirth); GDM (4‐6 weeks after childbirth); gestational hypertension or pre‐eclampsia (4‐6 weeks after childbirth); gestational hypertension or pre‐eclampsia (4‐6 weeks after childbirth); induced labour; blood loss at childbirth; caesarean section; operative vaginal birth; birthweight; Apgar score (at 1 minute and 5 minutes); NICU admission (4‐6 weeks after childbirth); and cholesterol (4‐6 weeks after childbirth). |
| Starting date | June 2014 |
| Contact information | Daisuke Nishi, Assistant Professor, Tokyo Medical University. E‐mail: d‐nishi@umin.ac.jp |
| Notes |
Funding and collaborators: Tokyo Medical University, China Medical University (Taiwan), University of Toyama, Chiba University, and National Center for Child Health and Development. A non‐randomised pilot for this study was registered as NCT01948596 (completed: Nishi 2016) |
Wang 2018.
| Trial name or title | Impact of DHA/Oat on metabolic health in gestational diabetes mellitus |
| Methods | RCT |
| Participants | 80 women with a singleton pregnancy without any evidence of malformation and with a de novo diagnosis of gestational diabetes at 22‐28 weeks gestation |
| Interventions | 1) DHA 2) oat 3) DHA + oat 4) placebo |
| Outcomes | neonatal leptin; maternal fasting plasma glucose concentration, |
| Starting date | August 2017 |
| Contact information | Wen_Juan Wang, Master email:wangwe.njuean@163.com |
| Notes | Xinhua Hospital, Shanghai Jiao Tong University School of Medicine |
Zielinsky 2015.
| Trial name or title | Effect of mother's supplementation omega‐3 in the dynamics of fetal ductus arteriosus: a randomized clinical trial |
| Methods | RCT: NCT02565290 |
| Participants |
Recruitment target: 74 women. Inclusion criteria: at 28‐32 weeks' gestation; and willing to participate Exclusion criteria: hypertensive; diabetic; not using anti‐inflammatory drugs; not HIV positive; not using mate, black or green tea; no inflammation in past 5 days; and not allergic to fish or soy. Setting: Brazil |
| Interventions |
Intervention group Omega 3 capsules (1g), 2 times a day, for 21 days. Control group Placebo soy oil capsules (1g), 2 times a day, for 21 days. |
| Outcomes |
Primary outcome: pulsatility index of fetal ductus arteriosus Other outcomes: inflammatory biomarkers (interleukins, prostaglandins, cyclooxygenase); systolic and diastolic velocity of fetal ductus arteriosus; and biomarkers of oxidative stress. |
| Starting date | May 2015 |
| Contact information | Dr Paulo Zielinsky, Instituto de Cardiologia do Rio Grande do Sul. E‐mail: paulozie.voy@terra.com.br |
| Notes | Funding and collaborators: Instituto de Cardiologia do Rio Grande do Sul. |
Zimmermann 2018.
| Trial name or title | Dietary supplementation of Omega 3 and the participation in the placentary vascular resistance mechanism in pregnant people |
| Methods | RCT |
| Participants | 150 pregnant women ≥ 19 years; non‐smokers |
| Interventions | women without risk factors for pre‐eclampsia: 1) 400 mg omega from 12 weeks gestation to one week prior to birth 2) no omega women at risk of pre‐eclampsia 1) AAS + 400 mg omega 2) 400 mg omega women with thrombophilia 1) heparin + 400 mg omega 2) 400 mg omega |
| Outcomes | placental vascular resistance; pre‐eclampsia; oligohydramnios; intrauterine growth restriction |
| Starting date | August 2018 |
| Contact information | Juliana Barroso Zimmermann email: julianabz@uol,com,br |
| Notes | Faculdade de Medicina de Barbacena |
Abbreviations: ADA: American Diabetes Associaton; ADORE: Assessment of DHA on Reducing Early Preterm Birth; ADP: Air Displacement Plethsmography; BDI: Beck Depression Inventory; BIS: Bioelectical Independence Spectroscopy; BMI: Body Mass Index; CMV: cytomegalovirus; DHA4PREG: DHA for PREGnant women; DHA: docosahexaenoic acid; DXA: dual x‐ray absorptiometry; EPA: eicosapentaenoic acid; EPDS: Edinburgh Postnatal Depression Scale; FOPCHIN: Fish Oil Supplementation to Pregnant Women in China; GA: gestational age; GDM: gestational diabetes mellitus; HAMD: Hamilton Rating Scale for Depression; HBV: Hepatitis B virus; HCV: Hepatitis C virus; HIV: human immunodeficiency virus; HOMA‐IR: Homeostatic Model Assessment of Insulin Resistance; hCG: human chorionic gonadotropin; IVGTT: Intravenous Glucose Tolerance Test; LCPUFA: long‐chain polyunsaturated acids; MDD: major depressive disorder; MINI: Min‐International Neuropsychiatric Interview; NHMRC: National Health and Medical Research Institute; NICU: neonatal intensive care unit; NSAIDs: nonsteroidal anti‐inflammatory drugs; OGTT: oral glucose tolerance test; PUFA: polyunsaturated fatty acid; RCT: randomised controlled trial; SAHMRI: South Australian Health and Medical Resesarch Institute; SYNCHRO:The Synchronized Trial on Expectant Mothers with Depressive Symptoms by Omega‐3 PUFAs; UBC: umbilical cord blood
Differences between protocol and review
In the 2006 version (Makrides 2006), the title was updated from 'Fish oil and other prostaglandin precursor supplementation during pregnancy for reducing pre‐eclampsia, preterm birth, low birthweight and intrauterine growth restriction' to 'Marine oil, and other prostaglandin precursor, supplementation for pregnancy uncomplicated by pre‐eclampsia and intrauterine growth restriction' to more clearly identify the types of interventions and types of participants included.
For this 2018 update, we have expanded the scope of the review, with the following objective: "To assess the effects of omega‐3 long‐chain polyunsaturated fatty acids (LCPUFA), as supplements or as dietary additions, during pregnancy on maternal, perinatal, and neonatal outcomes and longer term outcomes for mother and child." We have also expanded the types of participants by including women with pre‐eclampsia and other risk factors.
This change in focus has led to a change in outcomes, with outcomes arranged into primary and secondary and more specific outcomes added (e.g. types of morbidities, specific infant development outcomes), with flow‐on effects to specification of subgroup analyses. We have also added large‐for‐gestational age as an outcome.
With changes to methods over the 12‐year period, we have used the newer methods for assessing risk of bias and specified outcomes to be used in GRADE and 'Summary of findings' tables.
We have added four new authors, Philippa Middleton, Judith Gomersall, Jacqueline Gould, and Emily Shepherd; and Lelia Duley has stepped down as an author.
Contributions of authors
In the first version of the review (Makrides 2006), Maria Makrides (MM) and Sjurdur Olsen (SO) assessed the trials for inclusion and extracted the data. MM wrote the protocol and review with contributions from Lelia Duley and SO.
For the 2018 update, Philippa Middleton (PM), Emily Shepherd (ES), Jacqueline Gould (JGou) and Judith Gomersall (JGom) joined the review author team. PM, ES and JGom assessed the trials for inclusion, extracted the data and assessed the risk of bias for the new trials. PM and JGom wrote the text, and prepared the graphs and 'Summary of findings' tables. All authors reviewed the text and contributed to editing of the review.
Sources of support
Internal sources
SAHMRI, Australia.
Women's & Children's Hospital, Australia.
External sources
Department for International Development, UK.
Medical Research Council, UK.
National Health and Medical Research Council, Australia.
Danish National Research Foundation, Denmark.
Declarations of interest
Philippa Middleton: none known.
Judith C Gomersall: none known.
Emily Shepherd: none known.
Sjurdur F Olsen: Sjurdur Olsen’s institution has received grant funding from the Innovation Fund Denmark (grant no. 09‐067124, Centre for Fetal Programming) and from the March of Dimes Foundation (6‐FY‐96‐0240, 6‐FY97‐0553, 6‐FY97‐0521, 6‐FY00‐407). Sjurdur Olsen was the principal investigator of three trials included in the review: Olsen 1992, Olsen 2000 and Knudsen 2006.
Maria Makrides: Maria Makrides’ institution has received grant funding (NHMRC Fellowship 1061704 Improving the outcomes of mothers and babies through nutritional interventions and NHMRC 1146806 Efficacy and safety of omega‐3 DHA supplementation in preterm infants: childhood follow‐up of the N3RO trial); and honorarium money from Fonterra (for advice relating to maternal and child nutrition) to fund ECR and MCR conference travel. Professor Makrides is the principal investigator of the DOMInO trial (included) and the ORIP (ongoing) trial trials. She was on the Scientific Advisory Board of Fonterra (to September 2018); and she is President Elect of the International Society for the Study of Fatty Acids and Lipids (ISSFAL).
Jacqueline Gould is an investigator on some of the DOMInO follow‐up studies. She has received honoraria from the Nestle Nutrition Institute ‐ these have been paid to Dr Gould’s institution to support conference travel.
Dr Gould is an investigator in a clinical trial of high‐dose DHA supplementation during pregnancy that was eligible for inclusion in this review. Dr Gould's institute has received project grant funding and a fellowship from the NHMRC and WCH Foundation for work unrelated to this review. She has received honoraria from the Nestle Nutrition Institute and Fonterra ‐ these have been paid to Dr Gould’s institution to support conference travel.
Sjurdur Olsen, Maria Makrides and Jacqueline Gould were not involved in any decisions relating to the above studies and assessment for inclusion/exclusions, risk of bias, data extraction, etc. was carried out by other members of the review team who were not directly involved in these studies.
New search for studies and content updated (conclusions changed)
References
References to studies included in this review
Ali 2017 {published data only}
- Ali MK. The effect of omega 3 on pregnancy complicated by asymmetrical intrauterine growth restriction. clinicaltrials.gov/ct2/show/NCT02696577 (first received 28 February 2016).
- Ali MK, Amin ME, Amin AF, Abd El, Aal DE. Evaluation of the effectiveness of low‐dose aspirin and omega 3 in treatment of asymmetrically intrauterine growth restriction: a randomized clinical trial. European Journal of Obstetrics, Gynecology, and Reproductive Biology 2017;210:231‐5. [NCT02696577] [DOI] [PubMed] [Google Scholar]
Bergmann 2007 {published data only}
- Bergmann RL, Bergmann KE, Haschke‐Becher E, Richter R, Dudenhausen JW, Barclay D, et al. Does maternal docosahexaenoic acid supplementation during pregnancy and lactation lower BMI in late infancy?. Journal of Perinatal Medicine 2007;35(4):295‐300. [DOI] [PubMed] [Google Scholar]
- Bergmann RL, Bergmann KE, Richter R, Haschke‐Becher E, Henrich W, Dudenhausen JW. Does docosahexaenoic acid (DHA) status in pregnancy have any impact on postnatal growth? Six‐year follow‐up of a prospective randomized double‐blind monocenter study on low‐dose DHA supplements. Journal of Perinatal Medicine 2012;40:677‐84. [DOI] [PubMed] [Google Scholar]
- Bergmann RL, Haschke‐Becher E, Klassen‐Wigger P, Bergmann KE, Richter R, Dudenhausen JW, et al. Supplementation with 200 mg/day docosahexaenoic acid from mid‐pregnancy through lactation improves the docosahexaenoic acid status of mothers with a habitually low fish intake and of their infants. Annals of Nutrition & Metabolism 2008;52(2):157‐66. [DOI] [PMC free article] [PubMed] [Google Scholar]
- Bergmann RL, Haschke‐Becher, Bergmann KE, Dudenhausen JW, Haschke F. Low dose docosahexaenoic acid supplementation improves the DHA status of pregnant women. Pediatric Academic Societies Annual Meeting; 2006 April 29‐May 2; San Francisco (CA). 2006.
- Bergmann RL, Richter R, Bergmann KE, Dudenhausen JW, Haschke F. 21 months old infants are leaner if their mothers received low dose DHA supplements during pregnancy and lactation. European Journal of Pediatrics 2006;165(Suppl 1):114. [Google Scholar]
Bisgaard 2016 {published data only}
- Bisgaard H. Fish oil supplementation during pregnancy for prevention of asthma, eczema and allergies in childhood: interventional trial in the cCOPSAC2010 (Copenhagen studies on asthma in childhood) birth cohort. clinicaltrials.gov/ct2/show/NCT00798226 (accessed 15 September 2012).
- Bisgaard H, Stockholm J, Chawes B, Vissing N, Bjarndottir E, Schoos A, et al. Fish oil‐derived fatty acids in pregnancy and wheeze and asthma in offspring. New England Journal of Medicine 2016;375(26):2530‐8. [DOI] [PubMed] [Google Scholar]
Boris 2004 {published data only}
- Boris J, Jensen B, Salvig JD, Secher NJ, Olsen SF. A randomized controlled trial of the effect of fish oil supplementation in late pregnancy and early lactation on the n‐3 fatty acid content in human breast milk. Lipids 2004;39(12):1191‐6. [DOI] [PubMed] [Google Scholar]
Bosaeus 2015 {published data only}
- Bosaeus M, Hussain A, Karlsson T, Andersson L, Hulthén L, Svelander C, et al. A randomized longitudinal dietary intervention study during pregnancy: effects on fish intake, phospholipids, and body composition. Nutrition Journal 2015;14:1. [DOI] [PMC free article] [PubMed] [Google Scholar]
- Svensson H, Wetterling L, Bosaeus M, Odén B, Odén A, Jennische E, et al. Body fat mass and the proportion of very large adipocytes in pregnant women are associated with gestational insulin resistance. International Journal of Obesity 2016;40(4):646‐53. [DOI] [PMC free article] [PubMed] [Google Scholar]
Bulstra‐Ramakers 1994 {published data only}
- Bulstra‐Ramakers MT, Huisjes HJ, Visser GH. The effects of 3g eicosapentaenoic acid daily on recurrence of intrauterine growth retardation and pregnancy induced hypertension. British Journal of Obstetrics and Gynaecology 1994;102:123‐6. [DOI] [PubMed] [Google Scholar]
Carlson 2013 {published data only}
- Carlson S, NCT02487771. Kansas University DHA Outcome Study (KUDOS) follow‐up. clinicaltrials.gov/show/NCT02487771 (first received 1 July 2015).
- Carlson SE. DHA supplementation and pregnancy outcome. clinicaltrials.gov/ct2/show/NCT00266825 (first received 19 December 2005).
- Carlson SE, Colombo J, Gajewski BJ, Gustafson KM, Mundy D, Yeast J, et al. DHA supplementation and pregnancy outcomes. American Journal of Clinical Nutrition 2013;97(4):808‐15. [DOI] [PMC free article] [PubMed] [Google Scholar]
- Carlson SE, Gajewski BJ, Alhayek S, Colombo J, Kerling EH, Gustafson KM. Dose‐response relationship between docosahexaenoic acid (DHA) intake and lower rates of early preterm birth, low birth weight and very low birth weight. Prostaglandins, Leukotrienes and Essential Fatty Acids 2018;138:1‐5. [DOI] [PMC free article] [PubMed] [Google Scholar]
- Colombo J, Gustafson KM, Gajewski BJ, Shaddy DJ, Kerling EH, Thodosoff JM, et al. Prenatal DHA supplementation and infant attention. Pediatric Research 2016;80(5):656‐62. [DOI: 10.1038/pr.2016.134] [DOI] [PMC free article] [PubMed] [Google Scholar]
- Hidaka BH, Kerling EH, Thodosoff JM, Sullivan DK, Colombo J, Carlson SE. Dietary patterns of early childhood and maternal socioeconomic status in a unique prospective sample from a randomized controlled trial of prenatal DHA supplementation. BMC Pediatrics 2016;16:91. [DOI: 10.1186/s12887-016-0729-0] [DOI] [PMC free article] [PubMed] [Google Scholar]
- Hidaka BH, Thodosoff JM, Kerling EH, Hull HR, Colombo J, Carlson SE. Intrauterine DHA exposure and child body composition at 5 y: exploratory analysis of a randomized controlled trial of prenatal DHA supplementation. American Journal of Clinical Nutrition 2018;107(1):35‐42. [DOI] [PMC free article] [PubMed] [Google Scholar]
- Scholtz SA, Kerling EH, Shaddy DJ, Li S, Thodosoff JM, Colombo J, et al. Docosahexaenoic acid (DHA) supplementation in pregnancy differentially modulates arachidonic acid and DHA status across FADS genotypes in pregnancy. Prostaglandins, Leukotrienes and Essential Fatty Acids (PLEFA) 2015;94:29‐33. [DOI] [PMC free article] [PubMed] [Google Scholar]
- Shireman T, Kerling EH, Gajewski BJ, Colombo J, Carlson SE. Docosahexaenoic acid supplementation (DHA) and the return on investment for pregnancy outcomes. Prostaglandins Leukotrienes, and Essential Fatty Acids 2016;111:8‐10. [DOI] [PMC free article] [PubMed] [Google Scholar]
Chase 2015 {published data only}
- Chase HP, Boulware D, Rodriguez H, Donaldson D, Chritton S, Rafkin‐Mervis L, et al. Effect of docosahexaenoic acid supplementation on inflammatory cytokine levels in infants at high genetic risk for type 1 diabetes. Pediatric Diabetes 2015;16(4):271‐9. [DOI] [PMC free article] [PubMed] [Google Scholar]
- Chase HP, Lescheck E, Rafkin‐Mervis L, Krause‐Steinrauf H, Chritton S, Azare SM, et al. Nutritional intervention to prevent (NIP) type 1 diabetes: a pilot trial. Childhood Obesity and Nutrition 2009;1(2):98‐107. [DOI: 10.1177/1941406409333466] [DOI] [Google Scholar]
D'Almedia 1992 {published data only}
- D'Almeida A, Carter JP, Anatol A, Prost C. Effects of a combination of evening primrose oil (gamma linolenic acid) and fish oil (eicosapentaenoic + docahexaenoic acid) versus magnesium, and versus placebo in preventing pre‐eclampsia. Women & Health 1992;19:117‐31. [DOI] [PubMed] [Google Scholar]
de Groot 2004 {published data only}
- Otto SJ, Groot RH, Hornstra G. Increased risk of postpartum depressive symptoms is associated with slower normalization after pregnancy of the functional docosahexaenoic acid status. Prostaglandins, Leukotrienes, and Essential Fatty Acids 2003;69(4):237‐43. [DOI] [PubMed] [Google Scholar]
- Groot RH, Hornstra G, Jolles J. Exploratory study into the relation between plasma phospholipid fatty acid status and cognitive performance. Prostaglandins Leukotrienes and Essential Fatty Acids 2004;76(3):165‐72. [DOI] [PubMed] [Google Scholar]
- Groot RH, Hornstra G, Houwelingen AC, Roumen F. Effect of alpha‐linolenic acid supplementation during pregnancy on maternal and neonatal polyunsaturated fatty acid status and pregnancy outcome. American Journal of Clinical Nutrition 2004;79:251‐60. [DOI] [PubMed] [Google Scholar]
Dilli 2018 {published data only}
- Dilli D. Fish oil supplementation in women with gestational diabetes. clinicaltrials.gov/ct2/show/NCT02371343 (first received 19 February 2015). [NCT02371343]
- Dilli D, Dogan NN, Ipek MS, Cavus Y, Ceylaner S, Dogan H, et al. MaFOS‐GDM trial: maternal fish oil supplementation in women with gestational diabetes and cord blood DNA methylation at insulin like growth factor‐1 (IGF‐1) gene. Clinical Nutrition ESPEN 2018;23:73‐8. [DOI] [PubMed] [Google Scholar]
Dunstan 2008 {published data only}
- Amarasekera M, Noakes P, Strickland D, Saffery R, Martino DJ, Prescott SL. Epigenome‐wide analysis of neonatal CD4+ T‐cell methylation sites potentially affected by maternal fish oil supplementation. Epigenetics 2014;9(12):1570‐6. [DOI] [PMC free article] [PubMed] [Google Scholar]
- Barden AE, Dunstan JA, Beilin LJ, Prescott SL, Mori TA. n ‐ 3 fatty acid supplementation during pregnancy in women with allergic disease: effects on blood pressure, and maternal and fetal lipids. Clinical Science 2006;111(4):289‐94. [DOI] [PubMed] [Google Scholar]
- Barden AE, Mori TA, Dunstan JA, Taylor AL, Thornton CA, Croft KD, et al. Fish oil supplementation in pregnancy lowers f2‐isoprostanes in neonates at high risk of atopy. Free Radical Research 2004;38:233‐9. [DOI] [PubMed] [Google Scholar]
- Denburg JA, Hatfield HM, Cyr MM, Hayes L, Holt PG, Semhi R, et al. Fish oil supplementation in pregnancy modifies neonatal progenitors at birth in infants at risk of atopy. Pediatric Research 2005;57(2):276‐81. [DOI] [PubMed] [Google Scholar]
- Dunstan JA, Mitoulas LR, Dixon G, Doherty DA, Hartmann PE, Simmer K, et al. The effects of fish oil supplementation in pregnancy on breast milk fatty acid composition over the course of lactation: a randomized controlled trial. Pediatric Research 2007;62(6):689‐94. [DOI] [PubMed] [Google Scholar]
- Dunstan JA, Mori TA, Barden A, Beilin LJ, Holt PG, Calder PC, et al. Effects of n‐3 polyunsaturated fatty acid supplementation in pregnancy on maternal and fetal erythrocyte fatty acid composition. European Journal of Clinical Nutrition 2004;58:429‐37. [DOI] [PubMed] [Google Scholar]
- Dunstan JA, Mori TA, Barden A, Beilin LJ, Taylor AL, Holt PG, et al. Maternal fish oil supplementation in pregnancy reduces interleukin‐13 levels in cord blood of infants at high risk of atopy. Clinical and Experimental Allergy 2003;33(4):442‐8. [DOI] [PubMed] [Google Scholar]
- Dunstan JA, Mori TA, Barden A, Beilin LJ, Taylor AL, Holt PG, et al. Fish oil supplementation in pregnancy modifies neonatal allergen‐specific immune responses and clinical outcomes in infants at high risk of atopy: a randomized, controlled trial. Journal of Allergy and Clinical Allergy Immunology 2003;112(6):1178‐84. [DOI] [PubMed] [Google Scholar]
- Dunstan JA, Roper J, Mitoulas L, Hartmann PE, Simmer K, Prescott SL. The effect of supplementation with fish oil during pregnancy on breast milk immunoglobulin A, soluble CD14, cytokine levels and fatty acid composition. Clinical and Experimental Allergy 2004;34(8):1237‐42. [DOI] [PubMed] [Google Scholar]
- Dunstan JA, Simmer K, Dixon G, Prescott SL. Cognitive assessment of children at age 2(1/2) years after maternal fish oil supplementation in pregnancy: a randomised controlled trial. Archives of Disease in Childhood Fetal & Neonatal Edition 2008;93(1):F45‐50. [DOI] [PubMed] [Google Scholar]
- Hatfield HM, Dunstan JA, Hayes L, Sehmi R, Holt PM, Denberg JA, et al. Dietary N‐3 polyunsaturated fatty acid (PUFA) supplementation during pregnancy is associated with changes in cord blood (CB) progenitor numbers and responsiveness to IL‐5 in infants at risk of atopy. Journal of Allergy and Clinical Immunology 2003;111(2 Suppl):S320. [Google Scholar]
- Keelan JA, Mas E, D'Vaz N, Dunstan JA, Li S, Barden AE, et al. Effects of maternal n‐3 fatty acid supplementation on placental cytokines, pro‐resolving lipid mediators and their precursors. Reproduction 2015;149:171‐8. [DOI] [PubMed] [Google Scholar]
- Mattes E, McCarthy S, Gong G, Eekelen JA, Dunstan J, Foster J, et al. Maternal mood scores in mid‐pregnancy are related to aspects of neonatal immune function. Brain, Behavior, and Immunity 2009;23(3):380‐8. [DOI] [PubMed] [Google Scholar]
- Meldrum S, Dunstan JA, Foster JK, Simmer K, Prescott SL. Maternal fish oil supplementation in pregnancy: a 12 year follow‐up of a randomised controlled trial. Nutrients 2015;7(3):2061‐7. [DOI] [PMC free article] [PubMed] [Google Scholar]
- Prescott S. Studies fish oil maternal diet in pregnancy to prevent allergy: the effects of maternal n‐3 PUFA (fish oil) supplementation on neonatal immune responses. anzctr.org.au/Trial/Registration/TrialReview.aspx?ACTRN=12611000041954 (first received 10 January 2011). [ACTRN12611000041954]
- Prescott SL, Barden AE, Mori TA, Dunstan JA. Maternal fish oil supplementation in pregnancy modifies neonatal leukotriene production by cord‐blood‐derived neutrophils. Clinical Science 2007;113(10):409‐16. [DOI] [PubMed] [Google Scholar]
- Prescott SL, Irvine J, Dunstan JA, Hii C, Ferrante A. Protein kinase C: a novel protective neonatal T‐cell marker that can be upregulated by allergy prevention strategies. Journal of Allergy and Clinical Immunology 2007;120:200‐6. [DOI] [PubMed] [Google Scholar]
- See VH, Mas E, Burrows S, O'Callaghan NJ, Fenech M, Prescott SL, et al. Prenatal omega‐3 fatty acid supplementation does not affect offspring telomere length and f2‐isoprostanes at 12 years: a double blind, randomized controlled trial. Prostaglandins, Leukotrienes, and Essential Fatty Acids 2016;112:50‐5. [DOI] [PubMed] [Google Scholar]
- See VH, Mas E, Prescott SL, Beilin LJ, Burrows S, Barden AE, et al. Effects of prenatal n‐3 fatty acid supplementation on offspring resolvins at birth and 12 years of age: a double‐blind, randomised controlled clinical trial. British Journal of Nutrition 2017;118:971‐80. [DOI] [PubMed] [Google Scholar]
England 1989 {published data only}
- England MJ, Chetty N, Dukes IA, Reavis S, Atkinson P, Sonnendecker EW. Eicosapentaenoic acid in pre‐eclampsia: a randomized trial. Proceedings of Silver Jubilee Congress of Obstetrics and Gynaecology; 1989; London (UK). 1989:154.
Freeman 2008 {published data only}
- Freeman MP, Davis M, Sinha P, Wisner KL, Hibbeln JR, Gelenberg AJ. Omega‐3 fatty acids and supportive psychotherapy for perinatal depression: a randomized placebo‐controlled study. Journal of Affective Disorders 2008;110:142‐8. [DOI] [PMC free article] [PubMed] [Google Scholar]
- Freeman MP, Davis MF. Supportive psychotherapy for perinatal depression: preliminary data for adherence and response. Depression and Anxiety 2010;27(1):39‐45. [DOI] [PubMed] [Google Scholar]
- Freeman MP, Sinha P. Tolerability of omega‐3 fatty acid supplements in perinatal women. Prostaglandins, Leukotrienes and Essential Fatty Acids 2007;77(3‐4):203‐8. [DOI] [PubMed] [Google Scholar]
Furuhjelm 2009 {published data only}
- Duchen K. Omega‐3 fatty acid supplementation in pregnancy and during lactation: a randomized, double‐blind, placebo controlled trial. clinicaltrials.gov/show/NCT00892684 (first received 4 May 2009).
- Duchen KM. Combined dietary supplementation with Lactobacillus reuteri and omega‐3 PUFA during pregnancy and postnatally in relation to development of IgE‐associated disease during infancy. clinicaltrials.gov/show/NCT01542970 (first received 2 March 2012).
- Furuhjelm C, Jenmalm MC, Falth‐Magnusson K, DuchIn K. Th1 and Th2 chemokines, vaccine‐induced immunity, and allergic disease in infants after maternal ‐3 fatty acid supplementation during pregnancy and lactation. Pediatric Research 2011;69(3):259‐64. [DOI] [PubMed] [Google Scholar]
- Furuhjelm C, Warstedt K, Fageras M, Falth‐Magnusson K, Larsson J, Fredriksson M, et al. Allergic disease in infants up to 2 years of age in relation to plasma omega‐3 fatty acids and maternal fish oil supplementation in pregnancy and lactation. Pediatric Allergy and Immunology 2011;22(5):505‐14. [DOI] [PubMed] [Google Scholar]
- Furuhjelm C, Warstedt K, Fageras M, Falth‐Magnusson K, Larsson J, Fredriksson M, et al. A randomised placebo controlled study of omega‐3‐fatty acid supplementation during pregnancy and lactation. Skin sensitisation in the children. Allergy 2007;62(Suppl 83):46. [Google Scholar]
- Furuhjelm C, Warstedt K, Fageras‐Bottcher M, Falth‐Magnusson K, Duchen K. A randomised placebo controlled study of maternal n‐3 fatty acid supplementation during pregnancy and lactation. Allergy 2008;63(Suppl 88):53. [Google Scholar]
- Furuhjelm C, Warstedt K, Larsson J, Fredriksson M, Bottcher MF, Falth‐Magnusson K, et al. Fish oil supplementation in pregnancy and lactation may decrease the risk of infant allergy. Acta Paediatrica 2009;98(9):1461‐7. [DOI] [PubMed] [Google Scholar]
- Karlsson T, Birberg‐Thornberg U, Duchen K, Gustafsson PA. LC‐PUFA supplemented to mothers during pregnancy and breast‐feeding improves cognitive performance in their children four years later ‐ an RCT study. 9th Congress of the ISSFAL; 2010 May 29 May‐June 2; Maastricht (the Netherlands) 2010:113.
- Warstedt K, Furuhjelm C, Duchen K, Falth‐Magnusson K, Fageras M. The effects of omega‐3 fatty acid supplementation in pregnancy on maternal eicosanoid, cytokine, and chemokine secretion. Pediatric Research 2009;66(2):212‐7. [DOI] [PubMed] [Google Scholar]
- Warstedt K, Furuhjelm C, Fälth‐Magnusson K, Fageras M, Duchen K. High levels of omega‐3 fatty acids in milk from omega‐3 fatty acid‐supplemented mothers are related to less immunoglobulinE‐associated disease in infancy. Acta Paediatrica 2016;205(11):1337‐47. [DOI] [PubMed] [Google Scholar]
Giorlandino 2013 {published data only}
- Giorlandino C, Giannarelli D. Effect of vaginally administered DHA fatty acids on pregnancy outcome in high risk pregnancies for preterm delivery: a double blinded randomised controlled trial. Journal of Prenatal Medicine 2013;7(3):42‐5. [PMC free article] [PubMed] [Google Scholar]
- Giorlandino C, ISRCTN39268609. Effect of vaginally administered docosahexaenoic acid (DHA) fatty acids on pregnancy outcome: a randomised controlled trial. isrctn.com/ISRCTN39268609 (first received 27 May 2009). [ISRCTN39268609]
Gustafson 2013 {published data only}
- Carlson SE, Gajewski BJ, Alhayek S, Colombo J, Kerling EH, Gustafson KM. Dose‐response relationship between docosahexaenoic acid (DHA) intake and lower rates of early preterm birth, low birth weight and very low birth weight. Prostaglandins, Leukotrienes and Essential Fatty Acids 2018;138:1‐5. [DOI] [PMC free article] [PubMed] [Google Scholar]
- Gustafson K, NCT01007110. The effects of docosahexaenoic acid (DHA) on fetal cardiac outcomes. clinicaltrials.gov/show/NCT01007110 (first received 3 November 2009).
- Gustafson KM, Carlson SE, Colombo J, Yeh HW, Shaddy DJ, Li S, et al. Effects of docosahexaenoic acid supplementation during pregnancy on fetal heart rate and variability: a randomized clinical trial. Prostaglandins Leukotrienes, and Essential Fatty Acids 2013;88(5):331‐8. [DOI] [PMC free article] [PubMed] [Google Scholar]
Haghiac 2015 {published data only}
- Berggren EK, Groh‐Wargo S, Presley L, Hauguel‐de Mouzon S, Catalano PM. Maternal fat, but not lean, mass is increased among overweight/obese women with excess gestational weight gain. American Journal of Obstetrics and Gynecology 2016;214:745.e1‐5. [DOI] [PMC free article] [PubMed] [Google Scholar]
- Calabuig‐Navarro V, Haghiac M, Catalano P, Hauguel de‐Mouzon S, O'Tierney‐Ginn P. Chronic omega‐3 supplementation during pregnancy is associated with decreases in lipid accumulation pathways in placenta of obese and overweight women. Reproductive Sciences 2015;22:289A. [Google Scholar]
- Calabuig‐Navarro V, Puchowicz M, Glazebrook P, Haghiac M, Minium J, Catalano P, et al. Effect of omega‐3 supplementation on placental lipid metabolism in overweight and obese women. American Journal of Clinical Nutrition 2016;103:1064‐72. [DOI] [PMC free article] [PubMed] [Google Scholar]
- Calabuig‐Navarro V, Puchowicz M, Haghiac M, Catalano P, De‐Mouzon SH, O'Tierney‐Ginn P. Reduced fatty acid esterification and accumulation in placentas of omega‐3 supplemented women. Diabetes 2015;64:A95. [Google Scholar]
- Catalano P, Haghiac M, Smith S, Dettlebach S, Gunzler D, Groh‐Wargo S, et al. Omega‐3 poly‐unsaturated fatty acid supplementation in overweight and obese women: a pilot RCT to improve inflammation, insulin sensitivity and decrease fetal adiposity. American Journal of Obstetrics and Gynecology 2014;210(1 Suppl):S43. [Google Scholar]
- Catalano P, NCT00957476. Omega‐3 supplementation decreases inflammation and fetal obesity in pregnancy. clinicaltrials.gov/show/NCT00957476 (first received 12 August 2009).
- Haghiac M, Yang X‐H, Presley L, Smith S, Dettelback S, Minium J, et al. Dietary omega‐3 fatty acid supplementation reduces inflammation in obese pregnant women: a randomized double‐blind controlled clinical trial. PLOS One 2015;10(9):e0137309. [DOI] [PMC free article] [PubMed] [Google Scholar]
Harper 2010 {published data only}
- Bustos ML, Caritis SN, Jablonski KA, Reddy UM, Sorokin Y, Manuck T, et al. The association among cytochrome P450 3A, progesterone receptor polymorphisms, plasma 17‐alpha hydroxyprogesterone caproate concentrations, and spontaneous preterm birth. American Journal of Obstetrics and Gynecology 2017;271(3):369.e1‐369.e9. [DOI: 10.1016/j.ajog.2017.05.019] [DOI] [PMC free article] [PubMed] [Google Scholar]
- Caritis S. Pharmacodynamic impact of 17‐hydroxyprogesterone caproate (17‐OHPC) in singleton gestation. Reproductive Sciences 2012;19(3 Suppl):126A. [Google Scholar]
- Caritis SN, Venkataramanan R, Thom E, Harper M, Klebanoff MA, Sorokin Y, et al. Relationship between 17‐alpha hydroxyprogesterone caproate concentration and spontaneous preterm birth. American Journal of Obstetrics and Gynecology 2014;210(2):128.e1‐6. [DOI] [PMC free article] [PubMed] [Google Scholar]
- Harper M. Low maternal omega‐3 levels prior to 22 weeks' gestation are associated with preterm delivery and low fish intake. American Journal of Obstetrics and Gynecology 2009;201(6 Suppl 1):S172‐3. [Google Scholar]
- Harper M. Omega‐3 fatty acids and cytokine production. American Journal of Obstetrics and Gynecology 2011;204(1 Suppl):S202. [Google Scholar]
- Harper M. Randomized controlled trial of omega‐3 fatty acid supplementation for recurrent preterm birth prevention. American Journal of Obstetrics and Gynecology 2007;197(6 Suppl 1):S2. [DOI] [PMC free article] [PubMed] [Google Scholar]
- Harper M, Li L, Zhao Y, Klebanoff MA, Thorp JM Jr, Sorokin Y, et al. Change in mononuclear leukocyte responsiveness in midpregnancy and subsequent preterm birth. Obstetrics & Gynecology 2013;121(4):805‐11. [DOI] [PMC free article] [PubMed] [Google Scholar]
- Harper M, Thom E, Klebanoff MA Jr, Thorp J, Sorokin Y, Varner MW, et al. Omega‐3 fatty acid supplementation to prevent recurrent preterm birth. Obstetrics & Gynecology 2010;115:234‐42. [DOI] [PMC free article] [PubMed] [Google Scholar]
- Harper M, Zheng SL, Thom E, Klebanoff MA, Thorp J Jr, Sorokin Y, et al. Cytokine gene polymorphisms and length of gestation. Obstetrics & Gynecology 2011;117(1):125‐30. [DOI] [PMC free article] [PubMed] [Google Scholar]
- Klebanoff MA, Harper M, Lai Y, Thorp JJ, Sorokin Y, Varner MW, et al. Fish consumption, erythrocyte fatty acids, and preterm birth. Obstetrics & Gynecology 2011;117(5):1071‐7. [DOI] [PMC free article] [PubMed] [Google Scholar]
- Kuper SG, Abramovici AR, Jauk VC, Harper LM, Biggio JR, Tita AT. Does smoking status influence the effect of omega‐3 supplementation on pregnancy outcomes?. American Journal of Obstetrics and Gynecology 2017;216(1):S226. [DOI] [PMC free article] [PubMed] [Google Scholar]
- Kuper SG, Abramovici AR, Jauk VC, Harper LM, Biggio JR, Tita AT. The effect of omega‐3 supplementation on pregnancy outcomes by smoking status. American Journal of Obstetrics and Gynecology 2017; Vol. 217, issue 4:e1‐476.e6. [DOI: 10.1016/j.ajog.2017.05.033] [DOI] [PMC free article] [PubMed]
- Manuck TA, Stoddard GJ, Fry RC, Esplin MS, Varner MW. Non‐response to 17‐alpha hydroxyprogesterone caproate for recurrent spontaneous preterm birth prevention: clinical prediction and generation of a risk scoring system. American Journal of Obstetrics and Gynecology 2016;215(5):622.e1‐8. [DOI] [PMC free article] [PubMed] [Google Scholar]
- Monthe‐Dreze C, Penfield‐Cyr A, Smid M, Sen S. Maternal obesity modulates response to omega‐3 fatty acids supplementation during pregnancy. Reproductive Sciences 2017; Vol. 24, issue 1 Suppl 1:186A. [DOI] [PMC free article] [PubMed]
- Mourad M, Jain J, Kern‐Goldberger AR, Gyamfi‐Bannerman C. Omega‐3 supplementation in pregnancy and neonatal respiratory outcomes. American Journal of Obstetrics and Gynecology 2018;218(1):S96. [Google Scholar]
- National Institute of Child Health and Human Development. Omega‐3 fatty acid supplementation to prevent preterm birth in high risk pregnancies. clinicaltrials.gov/ct2/show/NCT00135902 (first received 26 August 2005.
- Smid MC, Stuebe AM, Manuck TA, Sen S. Maternal obesity, fish intake, and recurrent spontaneous preterm birth. Journal of Maternal‐Fetal & Neonatal Medicine 2018 [Epub ahead of print]. [DOI] [PMC free article] [PubMed]
- Thorp JM Jr, Rice MM, Harper M, Klebanoff M, Sorokin Y, Varner MW, et al. Advanced lipoprotein measures and recurrent preterm birth. American Journal of Obstetrics and Gynecology 2013;209(4):e1‐7. [DOI] [PMC free article] [PubMed] [Google Scholar]
- Thorp JM, Camargo CA. Vitamin D, fish consumption and preterm birth: Is there a link. Reproductive Sciences 2011;18(3 Suppl 1):S‐073. [Google Scholar]
Harris 2015 {published data only}
- Harris MA. DHA supplementation and pregnancy outcome. clinicaltrials.gov/ct2/show/record/NCT02219399 (first received 18 August 2014).
- Harris MA, Reece MS, McGregor JA, Wilson JW, Burke SM, Wheeler M, et al. The effect of omega‐3 docosahexaenoic acid supplementation on gestational length: randomized trial of supplementation compared to nutrition education for Increasing n‐3 intake from foods. BioMed Research International 2015;2015:Article ID: 123078. [CENTRAL: 3195090; DOI: 10.1155/2015/123078] [DOI] [PMC free article] [PubMed] [Google Scholar]
Hauner 2012 {published data only}
- Amann‐Gassner U, NCT00362089. The impact of the nutritional fatty acids during pregnancy and lactation for early human adipose tissue development. clinicaltrials.gov/ct2/show/NCT00362089 (first received 3 February 2014).
- Brei C, Brunner S, Pusch K, Much D, Stecher L, Amann‐Gassner U, et al. Long‐chain polyunsaturated fatty acids during pregnancy/lactation and children's body composition: 5‐year follow‐up data (INFAT‐study). Annals of Nutrition and Metabolism 2015;67(Suppl 1):413. [Google Scholar]
- Brei C, Much D, Heimberg E, Schulte V, Brunner S, Stecher L, et al. Sonographic assessment of abdominal fat distribution during the first year of infancy. Pediatric Research 2015;78(3):342‐50. [DOI: 10.1038/pr.2015.108] [DOI] [PubMed] [Google Scholar]
- Brei C, Stecher L, Brunner S, Ensenauer R, Heinen F, Wagner PD, et al. Impact of the n‐6:n‐3 long‐chain PUFA ratio during pregnancy and lactation on offspring neurodevelopment: 5‐year follow‐up of a randomized controlled trial. European Journal of Clinical Nutrition 2017; Vol. 71, issue 9:1114‐20. [DOI: 10.1038/ejcn.2017.79] [DOI] [PubMed]
- Brei C, Stecher L, Much D, Karla MT, Amann‐Gass U, Shen J, et al. Reduction of the n‐6:n‐3 long‐chain PUFA ratio during pregnancy and childbirth on offspring body composition: follow‐up results from a randomized controlled trial up to 5 y of age. American Journal of Clinical Nutrition 2016; Vol. 103, issue 6:1472‐81. [DOI: ] [DOI] [PubMed]
- Brunner S. Breast milk leptin and adiponectin in relation to infant body composition up to 2 years. Pediatric Obesity 2015;10(1):67‐73. [DOI: 10.1111/j.2047-6310.2014.222.x] [DOI] [PubMed] [Google Scholar]
- Brunner S, Schmid D, Huttinger K, Much D, Bruderl M, Sedlmeier EM, et al. Effect of reducing the n‐6/n‐3 fatty acid ratio on the maternal and fetal leptin axis in relation to infant body composition. Obesity 2014;22(1):217‐24. [DOI] [PubMed] [Google Scholar]
- Brunner S, Schmid D, Huttinger K, Much D, Bruderl M, Sedlmeier EM, et al. Effect of a dietary intervention to reduce the n‐6/n‐3 fatty acid ratio on the maternal and cord blood leptin axis and relation of leptin to body composition in the offspring ‐ results of the INFAT‐study (PEPO consortium of the Competence Network Obesity). Obesity Facts 2012;5(Suppl 2):10. [Google Scholar]
- Brunner S, Schmid D, Huttinger K, Much D, Heimberg E, Sedlmeier EM, et al. Maternal insulin resistance, triglycerides and cord blood insulin in relation to post‐natal weight trajectories and body composition in the offspring up to 2 years. Diabetic Medicine 2013;30(12):1500‐7. [DOI] [PubMed] [Google Scholar]
- Hauner H, Much D, Vollhardt C, Brunner S, Schmid D, Sedlmeier EM, et al. Effect of reducing the n‐6:n‐3 long‐chain PUFA ratio during pregnancy and lactation on infant adipose tissue growth within the first year of life: an open‐label randomized controlled trial. American Journal of Clinical Nutrition 2012;95(2):383‐94. [DOI] [PubMed] [Google Scholar]
- Hauner H, Vollhardt C, Schneider KT, Zimmermann A, Schuster T, Amann‐Gassner U. The impact of nutritional fatty acids during pregnancy and lactation on early human adipose tissue development. Rationale and design of the INFAT study. Annals of Nutrition & Metabolism 2009;54(2):97‐103. [DOI] [PubMed] [Google Scholar]
- Meyer DM, Brei C, Stecher L, Much D, Brunner S, Hauner H. Cord blood and child plasma adiponectin levels in relation to childhood obesity risk and fat distribution up to 5 y. Pediatric Research 2017;81(5):745‐51. [DOI: 10.1038/pr.2016] [DOI] [PubMed] [Google Scholar]
- Meyer DM, Brei C, Stecher L, Much D, Brunner S, Hauner H. The relationship between breast milk leptin and adiponectin with child body composition from 3 to 5 years: a follow‐up study. Pediatric Obesity 2017;12(Suppl 1):125‐9. [DOI: 10.1111/ijpo.12192] [DOI] [PubMed] [Google Scholar]
- Much D, Brunner S, Volhardt C, Schmid D, Sedlmeier EM, Bruderl M, et al. Breast milk fatty acid profile in relation to infant growth and body composition: results from the INFAT study. Pediatric Research 2013;74(2):230‐7. [DOI] [PubMed] [Google Scholar]
- Much D, Brunner S, Vollhardt C, Schmid D, Sedlmeier EM, Bruderl M, et al. Effect of dietary intervention to reduce the n‐6/n‐3 fatty acid ratio on maternal and fetal fatty acid profile and its relation to offspring growth and body composition at 1 year of age. European Journal of Clinical Nutrition 2013;67(3):282‐8. [DOI] [PubMed] [Google Scholar]
- Sedlmeier EM, Brunner S, Much D, Pagel P, Ulbrich SE, Meyer HH, et al. Human placental transcriptome shows sexually dimorphic gene expression and responsiveness to maternal dietary n‐3 long‐chain polyunsaturated fatty acid intervention during pregnancy. BMC Genomics 2014;15:941. [DOI: 10.1186/1471-2164-15-941] [DOI] [PMC free article] [PubMed] [Google Scholar]
Helland 2001 {published data only}
- Haugen G, Helland I. Influence of preeclampsia or maternal intake of omega‐3 fatty acids on the vasoactive effect of prostaglandin F‐two‐alpha in human umbilical arteries. Gynecologic & Obstetric Investigation 2001;52:75‐81. [DOI] [PubMed] [Google Scholar]
- Helland IB, Saugstad OD, Saarem K, Houwelingen AC, Nylander G, Drevon CA. Supplementation of n‐3 fatty acids during pregnancy and lactation reduces maternal plasma lipid levels and provides DHA to the infants. Journal of Maternal‐Fetal & Neonatal Medicine 2006;19(7):397‐406. [DOI] [PubMed] [Google Scholar]
- Helland IB, Saugstad OD, Smith L, Saarem K, Solvoll K, Ganes T, et al. Similar effects on infants of n‐3 and n‐6 fatty acid supplementation to pregnant and lactating women. Pediatrics 2001;108:1‐7. [DOI] [PubMed] [Google Scholar]
- Helland IB, Smith L, Blomen B, Saarem K, Saugstad OD, Drevon CA. Effect of supplementing pregnant and lactating mothers with n‐3 very‐long‐chain fatty acids on children's IQ and body mass index at 7 years of age. Pediatrics 2008;122(2):e472‐9. [DOI] [PubMed] [Google Scholar]
- Helland IB, Smith L, Saarem K, Saugstad OD, Drevon CA. Maternal supplementation with very‐long‐chain n‐3 fatty acids during pregnancy and lactation augments children's IQ at 4 years of age. Pediatrics 2003;111:e39‐44. [DOI] [PubMed] [Google Scholar]
Horvaticek 2017 {published data only}
- Djelmis J, ISRCTN15203878. The impact of EPA and DHA supplementation on C‐peptide preservation in type 1 diabetic pregnant women. isrctn.com/ISRCTN15203878 (first received 8 September 2016). [ISRCTN15203878]
- Horvaticek M, Djelmis J, Ivanisevic M, Oreskovic S, Herman M. Effect of eicosapentaenoic acid and docosahexaenoic acid supplementation on C‐peptide preservation in pregnant women with type‐1 diabetes: randomized placebo controlled clinical trial. European Journal of Clinical Nutrition 2017; Vol. 71, issue 8:968‐72. [DOI] [PubMed]
Hurtado 2015 {published data only}
- Campos‐Martinez A, Serrano L, Medina M, Ochoa J, Pena‐Caballero M. Levels of docosahexaenoic acid in pregnant women and their children after taking a fish oil enriched diet. Journal of Maternal‐Fetal and Neonatal Medicine 2012;25(S2):92. [Google Scholar]
- Diaz‐Castro J, Moreno‐Fernandez J, Hijano S, Kajarabille N, Pulido‐Moran M, Latunde‐Dada GO, et al. DHA supplementation: a nutritional strategy to improve prenatal Fe homeostasis and prevent birth outcomes related with Fe‐deficiency. Journal of Functional Foods 2015;19:385‐93. [Google Scholar]
- Hurtado JA, Iznaola C, Pena M, Ruiz J, Pena‐Quintana L, Kajarabille N, et al. Effects of maternal omega‐3 supplementation on fatty acids and on visual and cognitive development. Journal of Pediatric Gastroenterology and Nutrition 2015;61:472‐80. [DOI] [PubMed] [Google Scholar]
- Kajarabille N, Hurtado JA, Pena‐Quintana L, Pena M, Ruiz J, Diaz‐Castro J, et al. Omega‐3 LCPUFA supplement: a nutritional strategy to prevent maternal and neonatal oxidative stress. Maternal & Child Nutrition 2017;13(2):e12300. [DOI] [PMC free article] [PubMed] [Google Scholar]
- Kajarabille N, Rodriguez Y, Hurtado J, Pena M, Pena‐Quintana L, Lage S, et al. Effect of DHA supplementation on inflammatory signaling in pregnant women and their neonates. Annals of Nutrition and Metabolism 2013;63(Suppl 1):580. [Google Scholar]
- Ochoa J, NCT01947426. Effect of maternal supplementation with DHA during pregnancy and lactation on the development of the term newborn. clinicaltrials.gov/show/NCT01947426 (first received 20 September 2013). [NCT01947426]
- Pena‐Quintana L, Pena M, Rodriguez‐Santana Y, Hurtado JA, Ochoa J, Sanjurjo P, et al. Consumption of a dairy product enriched with fish oil during pregnancy maintains the DHA status of the mother and increase DHA concentration in cord blood. Journal of Pediatric Gastroenterology and Nutrition 2011;52(Suppl 1):E84. [Google Scholar]
- Rodriguez‐Santana Y, Ochoa JJ, Lara‐Villoslada F, Kajarabille N, Saavedra‐Santana P, Hurtado JA, et al. Cytokine distribution in mothers and breastfed children after omega‐3 LCPUFAs supplementation during the last trimester of pregnancy and the lactation period: a randomized, controlled trial. Prostaglandins, Leukotrienes, and Essential Fatty Acids 2017;126:32‐8. [DOI] [PubMed] [Google Scholar]
Ismail 2016 {published data only}
- Ismail AA, NCT01990690. Role of antioxidants in unexplained oligohydramnios, a randomized trial. clinicaltrials.gov/ct2/show/NCT01990690 (first received 21 November 2013). [NCT01990690]
- Ismail AA, Ramadan MF, Ali MK, Abbas AM, Saman AM, Makarem MH. A randomized controlled study of the efficacy of 4 weeks of supplementation with ω‐3 polyunsaturated fatty acids in cases of unexplained oligohydramnios. Journal of Perinatology 2016;36(11):944‐7. [DOI] [PubMed] [Google Scholar]
Jamilian 2016 {published data only}
- Asemi Z, IRCT201406305623N20. Effect of omega‐3 supplementation on inflammatory factors, biomarkers of oxidative stress and pregnancy outcomes in gestational diabetes. en.search.irct.ir/view/18933 (first received 16 July 2014).
- Jamilian M, Samimi M, Kolahdooz F, Khalaji F, Razavi M, Asemi Z. Omega‐3 fatty acid supplementation affects pregnancy outcomes in gestational diabetes: a randomized, double‐blind, placebo‐controlled trial. Journal of Maternal‐Fetal & Neonatal Medicine 2016;29(4):669‐75. [DOI] [PubMed] [Google Scholar]
Jamilian 2017 {published data only}
- Jamilian M, Samimi M, Afshar Ebrahimi F, Hashemi T, Taghizadeh M, Sanami M, et al. The effects of vitamin D and omega‐3 fatty acid co‐supplementation on glycemic control and lipid concentrations in patients with gestational diabetes. Journal of Clinical Lipidology 2017;11(2):459‐68. [DOI] [PubMed] [Google Scholar]
Judge 2007 {published data only}
- Courville AB, Harel O, Lammi‐Keefe CJ. Consumption of a DHA‐containing functional food during pregnancy is associated with lower infant ponderal index and cord plasma insulin concentration. British Journal of Nutrition 2011;106(2):208‐12. [DOI] [PubMed] [Google Scholar]
- Courville AB, Keplinger MR, Judge MP, Lammi‐Keefe CJ. Plasma or red blood cell phospholipids can be used to assess docosahexaenoic acid status in women during pregnancy. Nutrition Research 2009;29:151‐5. [DOI] [PubMed] [Google Scholar]
- Durham H, Wood JT, Williams JS, Geaghan JP, Makriyannis A, Lammi‐Keefe CJ. How do plasma endocannabinoids and inflammatory markers respond to docosahexaenoic acid (DHA) supplementation in pregnancy?. FASEB Journal 2011;25:777.4. [Google Scholar]
- Judge MP. Impact of maternal docosahexaenoic acid (DHA) supplementation in the form of a functional food during pregnancy on infant neurodevelopment: A comparison of vision, memory, temperament and problem‐solving abilities. Proquest Dissertations Publishing, 2006. [Google Scholar]
- Judge MP, Cong X, Harel O, Courville AB, Lammi‐Keefe CJ. Maternal consumption of a DHA‐containing functional food benefits infant sleep patterning: An early neurodevelopmental measure. Early Human Development 2012;88(7):531‐7. [DOI] [PubMed] [Google Scholar]
- Judge MP, Harel O, Lammi‐Keefe CJ. A docosahexaenoic acid‐functional food during pregnancy benefits infant visual acuity at four but not six months of age. Lipids 2007;42(2):117‐22. [DOI] [PubMed] [Google Scholar]
- Judge MP, Harel O, Lammi‐Keefe CJ. Maternal consumption of a docosahexaenoic acid‐containing functional food during pregnancy: benefit for infant performance on problem‐solving but not on recognition memory tasks at age 9 mo. American Journal of Clinical Nutrition 2007;85(6):1572‐7. [DOI] [PubMed] [Google Scholar]
Judge 2014 {published data only}
- Judge MP, Beck C, Durham H, Lammi‐Keefe C, McKelvey MM. Specific symptoms of postpartum depression (PPD) are decreased in mothers supplemented with docosahexaenoic acid (DHA, 22:6n‐3) during pregnancy. Nursing Research 2013;62(2):E21. [Google Scholar]
- Judge MP, Beck CT, Durham H, McKelvey MM, Lammi‐Keefe CJ. Maternal docosahexaenoic acid (DHA, 22:6n‐3) consumption during pregnancy decreases postpartum depression (PPD) symptomatology. FASEB Journal 2011;25:349.7. [Google Scholar]
- Judge MP, Beck CT, Durham H, McKelvey MM, Lammi‐Keefe CJ. Pilot trial evaluating maternal docosahexanoic acid consumption during pregnancy: decreased postpartum depressive symptomatology. International Journal of Nursing Sciences 2014;1:339‐45. [Google Scholar]
Kaviani 2014 {published data only}
- Azima S. The effect of omega‐3 fatty acid capsules on anxiety and quality of life gravida during pregnancy depression that refer to health clinic in Shiraz, Iran. en.search.irct.ir/view/11938 (first received 3 January 2013).
- Kaviani M, Saniee L, Azima S, Sharif F, Sayadi M. The effect of omega‐3 fatty acid supplementation on maternal depression during pregnancy: a double blind randomized controlled clinical trial. International Journal of Community Based Nursing and Midwifery 2014;2(3):142‐7. [PMC free article] [PubMed] [Google Scholar]
Keenan 2014 {published data only}
- Keenan K, Hipwell A, Bortner J, Hoffmann A, McAloon R. Association between fatty acid supplementation and prenatal stress in African Americans; a randomized controlled trial. Obstetrics and Gynecology 2014;124:1080‐7. [DOI] [PMC free article] [PubMed] [Google Scholar]
- Keenan K, Hipwell B, McAloon R, Hoffmann A Mohanto A, Magee K. The effect of prenatal docosahexaenoic acid supplementation on infant outcomes in African American women living in low‐income environments: a randomized, controlled trial. Psychoneuroendocrinology 2016;71:170‐5. [DOI] [PMC free article] [PubMed] [Google Scholar]
- Keenan K, NCT01158976. Impact of omega‐3 intake during pregnancy on maternal stress and infant outcome. clinicaltrials.gov/show/NCT01158976 (first received 8 July 2010).
Khalili 2016 {published data only}
- Faraji I, Ostadrahimi A, Farshbaf‐Khalili A, Aslani H. The impact of supplementation with fish oil on lipid profile of pregnant mothers: a randomized controlled trial. Crescent Journal of Medical and Biological Sciences 2016;3(3):100‐6. [Google Scholar]
- Farshbaf‐Khalili A, IRCT2013100914957N1. The effect of fish‐oil supplementation on pregnancy outcomes in mother and infant: a randomized controlled trial. en.search.irct.ir/view/15365 (first received 14 February 2014).
- Farshbaf‐Khalili A, Mohammad‐Alizadeh S, Mohammadi F, Ostadrahimi A. Fish‐oil supplementation and maternal mental health: a triple‐blind, randomized controlled trial. Iranian Red Crescent Medical Journal 2017;19(1):e36237. [IRCT2013100914957N1] [Google Scholar]
- Khalili AF, Mohamad‐Alizadeh S, Darabi M, Hematzadeh S, Mehdizadeh A, Shaaker M, et al. The effect of fish oil supplementation on serum phospholipid fatty acids profile during pregnancy: a double blind randomized controlled trial. Women & Health 2017;57(2):137‐53. [DOI: 10.1080/03630242.2016.1159269] [DOI] [PubMed] [Google Scholar]
- Ostadrahimi A, Mohammad‐Alizadeh S, Mirghafourvand M, Farshbaf‐Khalili S, Jafarilar‐Agdam N, Farshbaf‐Khalili A. The effect of fish oil supplementation on maternal and neonatal outcomes: a triple‐blind, randomized controlled trial. Journal of Perinatal Medicine 2017;45(9):1069‐77. [DOI: 10.1515/jpm-2016-0037] [DOI] [PubMed] [Google Scholar]
- Ostadrahimi A, Salehi‐Pourmehr H, Mohammad‐Alizadeh‐Charandabi S, Heidarabady S, Farshbaf‐Khalili A. The effect of perinatal fish oil supplementation on neurodevelopment and growth of infants: a randomized controlled trial. European Journal of Nutrition 2018; Vol. 57, issue 7:2387‐97. [DOI: 10.1007/s00394-017-1512-1] [DOI] [PubMed]
Knudsen 2006 {published data only}
- Knudsen VK, Hansen HS, Osterdal ML, Mikkelsen TB, Mu H, Olsen SF. Fish oil in various doses or flax oil in pregnancy and timing of spontaneous delivery: a randomised controlled trial. BJOG: an international journal of obstetrics and gynaecology 2006;113(5):536‐43. [DOI] [PubMed] [Google Scholar]
Krauss‐Etschmann 2007 {published data only}
- Broekaert I, Campoy C, Iznaola C, Hoffman B, Mueller‐Felber W, Koletzko BV. Visual evoked potentials in infants after dietary supply of docosahexaenoic acid and 5‐methyl‐tetrahydrofolate during pregnancy. Journal of Pediatric Gastroenterology and Nutrition 2004;39(Suppl 1):S33. [Google Scholar]
- Campoy C, Escolano‐Margarit MV, Ramos R, Parrilla‐Roure M, Csabi G, Beyer J, et al. Effects of prenatal fish‐oil and 5‐methyltetrahydrofolate supplementation on cognitive development of children at 6.5 y of age. American Journal of Clinical Nutrition 2011;94(6 Suppl):1880S‐8S. [DOI] [PubMed] [Google Scholar]
- Campoy C, Marchal G, Decsi T, Cruz M, Szabo E, Demmelmair H, et al. Spanish pregnant women's plasma phospholipids LC‐PUFAs concentrations and its influence on their newborns. Journal of Pediatric Gastroenterology and Nutrition 2004;39(Suppl 1):S11. [Google Scholar]
- Catena A, Martinez‐Zaldivar C, Diaz‐Piedra C, Torres‐Espinola FJ, Brandi P, Perez‐Garcia M, et al. On the relationship between head circumference, brain size, prenatal long‐chain PUFA/5‐methyltetrahydrofolate supplementation and cognitive abilities during childhood. British Journal of Nutrition 2017 [Epub ahead of print]:1‐9. [DOI] [PubMed]
- Catena A, Muñoz‐Machicao JA, Torres‐Espínola FJ, Martínez‐Zaldívar C, Diaz‐Piedra C, Gil A, et al. Folate and long‐chain polyunsaturated fatty acid supplementation during pregnancy has long‐term effects on the attention system of 8.5‐y‐old offspring: a randomized controlled trial. American Journal of Clinical Nutrition 2016;103(1):115‐27. [DOI] [PubMed] [Google Scholar]
- Decsi T, Campoy C, Demmelmair H, Szabó E, Marosvölgyi T, Escolano M, et al. Inverse association between trans isomeric and long‐chain polyunsaturated fatty acids in pregnant women and their newborns: data from three European countries. Annals of Nutrtition and Metabolism 2011;59(2‐4):107‐16. [DOI] [PubMed] [Google Scholar]
- Decsi T, Campoy C, Koletzko B. Effect of n‐3 polyunsaturated fatty acid supplementation in pregnancy: the Nuheal trial. Advances in Experimental Medicine & Biology 2005;569:109‐13. [DOI] [PubMed] [Google Scholar]
- Demmelmair H, Klingler M, Campoy C, Decsi T, Koletzko B. Low eicosapentaenoic acid concentrations in fish oil supplements do not influence the arachidonic acid contents in placental lipids. Journal of Pediatric Gastroenterology and Nutrition 2004;39(Suppl 1):S11. [Google Scholar]
- Demmelmair H, Klingler M, Campoy C, Diaz J, Decsi T, Veszpremi B, et al. The influence of habitual diet and increased docosahexaenoic acid intake during pregnancy on the fatty acid composition of individual placental lipids. Journal of Pediatric Gastroenterology & Nutrition 2005;40(5):622‐3. [Google Scholar]
- Dolz V, Campoy C, Molloy A, Scott J, Marchal G, Decsi T, et al. Homocysteine, folate & methylenetetrahydrofolate reductase (MTHFR) 677 ‐ T poly‐morphism in Spanish pregnant woman and in their offspring. Journal of Pediatric Gastroenterology & Nutrition 2005;40(5):623‐4. [Google Scholar]
- Escolano‐Margarit MV, Campoy C, Ramirez‐Tortosa MC, Demmelmair H, Miranda MT, Gil A, et al. Effects of fish oil supplementation on the fatty acid profile in erythrocyte membrane and plasma phospholipids of pregnant women and their offspring: a randomised controlled trial. British Journal of Nutrition 2013;109(9):1647‐56. [DOI] [PubMed] [Google Scholar]
- Escolano‐Margarit MV, Ramos R, Beyer J, Csabi G, Parrilla‐Roure M, Cruz F, et al. Prenatal DHA status and neurological outcome in children at age 5.5 years are positively associated. Journal of Nutrition 2011;141(6):1216‐23. [DOI] [PubMed] [Google Scholar]
- Franke C, Demmelmair H, Decsi T, Campoy C, Cruz M, Molina‐Font JA, et al. Influence of fish oil or folate supplementation on the time course of plasma redox markers during pregnancy. British Journal of Nutrition 2010;103(11):1648‐56. [DOI] [PubMed] [Google Scholar]
- Franke C, Verwied‐Jorky S, Campoy C, Trak‐Fellermeier M, Decsi T, Dolz V, et al. Dietary intake of natural sources of docosahexaenoic acid and folate in pregnant women of three European cohorts. Annals of Nutrition and Metabolism 2008;53:167‐74. [DOI] [PubMed] [Google Scholar]
- Klingler M, Blaschitz A, Campoy C, Cano A, Molloy AM, Scott JM, et al. The effect of docosahexaenoic acid and folic acid supplementation on placental apoptosis and proliferation. British Journal of Nutrition 2006;96(1):182‐90. [DOI] [PubMed] [Google Scholar]
- Koletzko B, NCT01180933. Dietary supply of docosahexaenoic acid (DHA) and 5‐methyl‐tetrahydro‐folate (MTHF) during the second half of pregnancy and early infancy. clinicaltrials.gov/ct2/show/NCT01180933 (first received 12 August 2010).
- Krauss‐Etschmann S, Hartl D, Heinrich J, Thaqi A, Prell C, Campoy C, et al. Association between levels of toll‐like receptors 2 and 4 and CD14 mRNA and allergy in pregnant women and their offspring. Clinical Immunology 2006;118(2‐3):292‐9. [DOI] [PubMed] [Google Scholar]
- Krauss‐Etschmann S, Hartl D, Rzehak P, Heinrich J, Shadid R, Carmen Ramirez‐Tortosa M, et al. Decreased cord blood IL‐4, IL‐13, and CCR4 and increased TGF‐beta levels after fish oil supplementation of pregnant women. Journal of Allergy and Clinical Immunology 2008;121(2):464‐70. [DOI] [PubMed] [Google Scholar]
- Krauss‐Etschmann S, Shadid R, Campoy C, Hoster E, Demmelmair H, Jimenez M, et al. Effects of fish‐oil and folate supplementation of pregnant women on maternal and fetal plasma concentrations of docosahexaenoic acid and eicosapentaenoic acid: a European randomized multicenter trial. American Journal of Clinical Nutrition 2007;85(5):1392‐400. [DOI] [PubMed] [Google Scholar]
- Larque E, Krauss‐Etschmann S, Campoy C, Hartl D, Linde J, Klingler M, et al. Docosahexaenoic acid supply in pregnancy affects placental expression of fatty acid transport proteins. American Journal of Clinical Nutrition 2006;84(4):853‐61. [DOI] [PubMed] [Google Scholar]
- Shoji H, Franke C, Campoy C, Rivero M, Demmelmair H, Koletzko B. Effect of docosahexaenoic acid and eicosapentaenoic acid supplementation on oxidative stress levels during pregnancy. Free Radical Research 2006;40(4):379‐84. [DOI] [PubMed] [Google Scholar]
Krummel 2016 {published data only}
- Escaname EN, Foster BA, Larsen B, Siddiqui SK, Menchaca J, Hale D, et al. Randomized controlled trial of DHA supplementation in pregnancy: results from long term follow up of offspring. Pediatric Academic Societies Annual Meeting; 2016 April 30‐May 3; Baltimore (MD). 2016:3365.8.
- Foster BA, Escaname E, Powell TL, Larsen B, Siddiqui SK, Menchaca J, et al. Randomized controlled trial of DHA supplementation during pregnancy: child adiposity outcomes. Nutrients 2017;9(6):E566. [DOI: 10.3390/nu9060566] [DOI] [PMC free article] [PubMed] [Google Scholar]
- Galindo M, Gaccioli F, Lager S, Ramirez V, Meireles C, Miller E, et al. Omega‐3 supplementation in obese pregnant women reduces placental mTOR activation. Reproductive Sciences 2012;19(3 Suppl):113A. [Google Scholar]
- Krummel DA. DHA supplements to improve insulin sensitivity in obese pregnant women (the omega‐3 pregnancy study). clinicaltrials.gov/ct2/show/NCT00865683 (first received 19 March 2009). [NCT00865683]
- Krummel DA, Kuhn AB, Cassin AM, Davis SL, Walker LE, Khoury JC, et al. Effect of docosahexaenoic acid supplementation on glucose tolerance and markers of inflammation in overweight/obese pregnant women: a double‐blind, randomized, controlled trial. Journal of Pregnancy and Child Health 2016;3:212. [Google Scholar]
- Lager S, Ramirez VI, Acosta O, Meireles C, Miller E, Gaccioli F, et al. Docosahexaenoic acid supplementation in pregnancy modulates placental cellular signaling and nutrient transport capacity in obese women. Journal of Clinical Endocrinology and Metabolism 2017;102(12):4557‐67. [DOI] [PMC free article] [PubMed] [Google Scholar]
- Powell TL, Meireles C, Ramirez VI, Miller E, Hakala KW, Weintraub S, et al. Docosahexaenoic acid supplementation in pregnancy alters placental fatty acid composition. Placenta 2014;35:A70. [Google Scholar]
Laivuori 1993 {published data only}
- Laivuori H, Hovatta O, Viinikka L, Ylikorkala O. Dietary supplementation with primrose oil or fish oil does not change urinary excretion of prostacyclin and thromboxane metabolites in pre‐eclamptic women. Prostaglandins Leukotrienes and Essential Fatty Acids 1993;49:691‐4. [DOI] [PubMed] [Google Scholar]
Makrides 2010 {published data only}
- Ahmed S, Makrides M, Sim N, McPhee A, Quinlivan J, Gibson R, et al. Analysis of hospital cost outcome of DHA‐rich fish‐oil supplementation in pregnancy: evidence from a randomized controlled trial. Prostaglandins, Leukotrienes, and Essential Fatty Acids 2015;102‐103:5‐11. [DOI] [PubMed] [Google Scholar]
- Best K, ACTRN12615000498594. Six year follow up of a randomised controlled trial to compare maternal omega‐3 long chain poly‐unsaturated fatty acids (n‐3 LCPUFA) supplementation versus vegetable oil in pregnancy, on allergic disease outcomes in the school age child. anzctr.org.au/Trial/Registration/TrialReview.aspx?id=367939 (first received 24 April 2015). [ACTRN12615000498594]
- Best K, Sullivan T, Gold M, Kennedy D, Martin J, Palmer D, et al. Six‐year follow up of children at high hereditary risk of allergy, born to mothers supplemented with docosahexaenoic acid (DHA) in the DOMInO trial. Journal of Paediatrics and Child Health 2015;51(Suppl 1):58. [Google Scholar]
- Best KP, Sullivan T, Palmer D, Gold M, Kennedy DJ, Martin J, et al. Prenatal fish oil supplementation and allergy: 6‐year follow‐up of a randomized controlled trial. Pediatrics 2016;137(6):e20154443. [DOI] [PubMed] [Google Scholar]
- Best KP, Sullivan TR, Palmer DJ, Gold M, Martin J, Kennedy D, et al. Prenatal omega‐3 LCPUFA and symptoms of allergic disease and sensitization throughout early childhood ‐ a longitudinal analysis of long‐term follow‐up of a randomized controlled trial. World Allergy Organization Journal 2018;11(1):10. [DOI] [PMC free article] [PubMed] [Google Scholar]
- Gawlik N, Makrides M, Yelland L, Kettler L. Does DHA supplementation during pregnancy improve children's language development? A 4‐year follow‐up of a double‐blind, multicenter, randomized controlled trial. Journal of Paediatrics and Child Health 2014;50(Suppl 1):11. [Google Scholar]
- Gould J, Makrides M, Smithers L. Maternal DHA supplementation during pregnancy and cognitive development: a randomised controlled trial and an assessment of executive functioning in early childhood. Journal of Paediatrics and Child Health 2013;49(Suppl 2):37‐8. [Google Scholar]
- Gould JF, Anderson AJ, Yelland LN, Gibson RA, Makrides M. Maternal characteristics influence response to DHA during pregnancy. Prostaglandins, Leukotrienes and Essential Fatty Acids 2016;108:5‐12. [DOI] [PubMed] [Google Scholar]
- Gould JF, Anderson AJ, Yelland LN, Smithers LG, Skeaff CM, Gibson RA, et al. Association of cord blood vitamin D at delivery with postpartum depression in Australian women. Australian and New Zealand Journal of Obstetrics and Gynaecology 2015;55(5):446‐52. [DOI] [PubMed] [Google Scholar]
- Gould JF, Makrides M, Colombo J, Smithers LG. Randomized controlled trial of maternal omega‐3 long‐chain PUFA supplementation during pregnancy and early childhood development of attention, working memory, and inhibitory control. American Journal of Clinical Nutrition 2014;99(4):851‐9. [DOI] [PMC free article] [PubMed] [Google Scholar]
- Gould JF, Treyvaud K, Yelland LN, Anderson PJ, Smithers LG, Gibson RA, et al. Does n‐3 LCPUFA supplementation during pregnancy increase the IQ of children at school age? Follow‐up of a randomised controlled trial. BMJ Open 2016;6:e011465. [DOI] [PMC free article] [PubMed] [Google Scholar]
- Gould JF, Treyvaud K, Yelland LN, Anderson PJ, Smithers LG, MCPhee AJ, et al. Seven‐year follow‐up of children born to women in a randomized trial of prenatal DHA supplementation. JAMA 2017;317(11):1174‐5. [DOI: 10.1001/jama.2016.21303] [DOI] [PubMed] [Google Scholar]
- Makrides M. DHA supplementation during the perinatal period and neurodevelopment: do some babies benefit more than others?. Prostaglandins Leukotrienes, and Essential Fatty Acids 2013;88(1):87‐90. [DOI] [PubMed] [Google Scholar]
- Makrides M. The 3 and 5 year follow up of children who participated in the DOMInO study: does maternal supplementation with n‐3 long‐chain PUFA in pregnancy influence child growth and insulin resistance?. anzctr.org.au/Trial/Registration/TrialReview.aspx?ACTRN=12611001127998 (first received 26 September 2011). [ACTRN12611001127998]
- Makrides M, ACTRN12610000735055. Early childhood follow up of a randomised controlled trial to compare maternal docosahexanoeic acid (DHA) rich tuna oil versus vegetable oil supplementation in pregnancy on child allergic disease outcomes. anzctr.org.au/ACTRN12610000735055.aspx (first received 2 September 2010). [ACTRN12610000735055]
- Makrides M, ACTRN12611001125910. Does maternal supplementation with n‐3 long‐chain PUFA in pregnancy influence cognitive development in childhood?. anzctr.org.au/Trial/Registration/TrialReview.aspx?ACTRN=ACTRN12611001125910 (first received 26 September 2011). [ACTRN12611001125910]
- Makrides M, ACTRN12614000770662. Does n‐3 LCPUFA supplementation during pregnancy improve the intelligence quotient of children at school age?. anzctr.org.au/Trial/Registration/TrialReview.aspx?ACTRN=12614000770662 (first received 10 July 2014). [ACTRN12614000770662]
- Makrides M, Gibson RA, McPhee AJ, Quinlivan J. Randomised trial of DHA in pregnancy to prevent postnatal depressive symptoms and enhance neurodevelopment in children. anzctr.org.au/Trial/Registration/TrialReview.aspx?ACTRN=12605000569606 (first received 20 September 2005). [ACTRN012605000569606]
- Makrides M, Gibson RA, McPhee AJ, Yelland L, Quinlivan J. Effect of docosahexaenoic acid (DHA) supplementation during pregnancy on neurodevelopment of young children: The domino trial. Journal of Paediatrics and Child Health 2011;47(Suppl 1):49. [Google Scholar]
- Makrides M, Gibson RA, McPhee AJ, Yelland L, Quinlivan J, Ryan P, et al. Effect of DHA supplementation during pregnancy on maternal depression and neurodevelopment of young children: a randomized controlled trial. JAMA 2010;304(15):1675‐83. [DOI] [PubMed] [Google Scholar]
- Makrides M, Gould J, Gawlik N, Anderson P, Smithers L, Muhlhausler B, et al. A randomised clinical controlled trial of DHA supplementation during pregnancy and cognitive development in preschool children. Journal of Paediatrics and Child Health 2014;50(Suppl 1):12. [Google Scholar]
- Makrides M, Gould JF, Gawlik NR, Yelland LN, Smithers LG, Anderson PJ, et al. Four‐year follow‐up of children born to women in a randomized trial of prenatal DHA supplementation. JAMA 2014;311(17):1802‐4. [DOI] [PubMed] [Google Scholar]
- Muhlhausler B, Gibson R, McDermott R, Tapsell L, McPhee A, Ryan P, et al. Maternal DHA supplementation in pregnancy reduces insulin sensitivity in children at 5 years of age: a follow up of the DOMInO study. Journal of Paediatrics and Child Health 2015;51(Suppl 1):58. [Google Scholar]
- Muhlhausler B, Yelland LN, McDermott R, Tapsell L, McPhee A, Gibson RA, et al. DHA supplementation during pregnancy does not reduce BMI or body fat mass in children: follow‐up of the DHA to Optimize Mother Infant Outcome randomized controlled trial. American Journal of Clinical Nutrition 2016;103(6):1489‐96. [DOI] [PubMed] [Google Scholar]
- Muhlhausler BS, Gibson RA, Yelland LN, Makrides M. Heterogeneity in cord blood DHA concentration: towards an explanation. Prostaglandins, Leukotrienes, and Essential Fatty Acids 2014;91:135‐40. [DOI] [PubMed] [Google Scholar]
- Muhlhausler BS, Yelland L, McPhee A, Gibson RA, Ryan P, Makrides M. Maternal DHA supplementation: effects on the fatty acid composition of cord blood. Journal of Paediatrics and Child Health 2011;47(Suppl 1):96. [Google Scholar]
- Palmer DJ, Sullivan T, Gold MS, Prescott SL, Heddle R, Gibson RA. Randomized controlled trial of fish oil supplementation in pregnancy on childhood allergies. Allergy 2013;68(11):1370‐6. [DOI] [PubMed] [Google Scholar]
- Palmer DJ, Sullivan T, Gold MS, Prescott SL, Heddle R, Gibson RA, et al. Effect of n‐3 polyunsaturated fatty acid supplementation in pregnancy on early childhood allergic disease: Randomized controlled trial. Journal of Paediatrics and Child Health 2013;49(Suppl 2):56. [Google Scholar]
- Palmer DJ, Sullivan T, Gold MS, Prescott SL, Heddle R, Gibson RA, et al. Effect of n‐3 long chain polyunsaturated fatty acid supplementation in pregnancy on infants' allergies in first year of life: randomised controlled trial. BMJ 2012;344:e184. [DOI] [PMC free article] [PubMed] [Google Scholar]
- Palmer DJ, Sullivan TR, Skeaff CM, Smithers LG, Makrides M, DOMInO Allergy Follow‐up Team. Higher cord blood 25‐hydroxyvitamin D concentrations reduce the risk of early childhood eczema: in children with a family history of allergic disease. World Allergy Organization Journal 2015;8(1):28. [DOI] [PMC free article] [PubMed] [Google Scholar]
- Ryan P, Griffith E, McDermott B, Makrides M, Gibson R, on behalf of the DOMINO SG. Data management tools in the DOMINO trial: DHA in pregnancy to prevent postnatal depressive symptoms and enhance neurodevelopment in children. Clinical Trials 2007;4(4):426. [Google Scholar]
- Smithers LG, Gibson RA, Makrides M. Maternal supplementation with docosahexaenoic acid during pregnancy does not affect early visual development in the infant: a randomized controlled trial. American Journal of Clinical Nutrition 2011;93(6):1293‐9. [DOI] [PubMed] [Google Scholar]
- Wood K, Mantzioris E, Lingwood B, Couper J, Makrides M, Gibson RA, et al. The effect of maternal DHA supplementation on body fat mass in children at 7 years: follow‐up of the DOMInO randomized controlled trial. Prostaglandins, Leukotrienes and Essential Fatty Acids 2017 [Epub ahead of print]. [DOI: 10.1016/j.plefa.2017.09.013; ACTRN12617000404325] [DOI] [PubMed]
- Yelland LN, Makrides M, McPhee AJ, Quinlivan J, Gibson RA. Importance of adequate sample sizes in fatty acid intervention trials. Prostaglandins Leukotrienes and Essential Fatty Acids 2016;107:8‐11. [ACTRN12605000569606] [DOI] [PubMed] [Google Scholar]
- Zhou SJ, Gibson RA, Yelland L, McPhee A, Quinlivan J, Ryan P, et al. Effect of DHA supplementation during pregnancy on risk of gestational diabetes and other pregnancy outcomes. Journal of Paediatrics and Child Health 2011;47(Suppl 1):29. [Google Scholar]
- Zhou SJ, Yelland L, McPhee AJ, Quinlivan J, Gibson RA, Makrides M. Fish‐oil supplementation in pregnancy does not reduce the risk of gestational diabetes or preeclampsia. American Journal of Clinical Nutrition 2012;95(6):1378‐84. [DOI] [PubMed] [Google Scholar]
- Dijk SJ, Zhou J, Peters TJ, Buckley M, Sutcliffe B, Oytam Y, et al. Effect of prenatal DHA supplementation on the infant epigenome: results from a randomized controlled trial. Clinical Epigenetics 2016;8:114. [DOI] [PMC free article] [PubMed] [Google Scholar]
Malcolm 2003 {published data only}
- Malcolm CA, Hamilton R, McCulloch DL, Montgomery C, Weaver LT. Scotopic electroretinogram in term infants born of mothers supplemented with docosahexaenoic acid during pregnancy. Investigative Ophthalmology & Visual Science 2003;44:3685‐91. [DOI] [PubMed] [Google Scholar]
- Malcolm CA, McCulloch DL, Montgomery C, Shepherd A, Weaver LT. Maternal docosahexaenoic acid supplementation during pregnancy and visual evoked potential development in term infants: a double blind, prospective, randomised trial. Archives of Diseases in Childhood Fetal & Neonatal Edition 2003;90:F383‐90. [DOI] [PMC free article] [PubMed] [Google Scholar]
- McCulloch D, Malcolm CA, Montgomery C, Hamilton RH, Weaver LT. Maternal fish oil supplementation and visual maturation in term infants. Optometry and Vision Science 2002;79(12):296. [Google Scholar]
- Montgomery C, Speake BK, Cameron A, Sattar N, Weaver LT. Maternal docosahexaenoic acid supplementation and fetal accretion. British Journal of Nutrition 2003;90:135‐45. [DOI] [PubMed] [Google Scholar]
Mardones 2008 {published data only}
- Mardones F, Urrutia MT, Villarroel L, Rioseco A, Castillo O, Rozowski J, et al. Effects of a dairy product fortified with multiple micronutrients and omega‐3 fatty acids on birth weight and gestation duration in pregnant Chilean women. Public Health Nutrition 2008;11(1):30‐40. [DOI] [PubMed] [Google Scholar]
Martin‐Alvarez 2012 {published data only}
- Martin Alvarez E, Pena‐Caballero M, Hurtado‐Suazo JA, Kajarabille N, Lara‐Villoslada F, Ochoa JJ. Variability in adipokines profile of newborns and their mothers after DHA supplementation in pregnancy [PS‐053]. Archives Disease in Childhood 2014;99(Suppl 2):A131. [Google Scholar]
- Martin E, Pena M, Kajarabille N, Hurtado JA, Lara‐Villoslada F, Ochoa JJ. Effect of DHA supplementation during pregnancy and lactation on several adipokines in pregnant women and their neonates. Journal of Maternal‐Fetal & Neonatal Medicine 2014;27(Suppl 1):85. [Google Scholar]
- Martin‐Alvarez E, Guerrero‐Montenegro B, Romero‐Paniagua MT, Lara‐Villoslada F, Hurtado‐Suazo JA. Maternal docosahexaenoic acid supplementation during pregnancy and lactation can modulate oxidative stress in the term newborn. Journal of Maternal‐Fetal and Neonatal Medicine 2012;25(S2):40. [Google Scholar]
Miller 2016 {published data only}
- Harris M, Miller S, Baker S, McGirr K, Davalos D. The omega smart baby project; effect of maternal DHA on infant development. FASEB Journal 2014;28(1 Suppl):[abstract no: 269.1]. [Google Scholar]
- Miller SM, Harris MA, Baker SS, Davalos DB, Clark AM, McGirr KA. Intake of total omega‐3 docosahexaenoic acid associated with increased gestational length and improved cognitive performance at 1 year of age. Journal of Nutritional Health & Food Engineering 2016;5(3):00176. [Google Scholar]
Min 2014 {published data only}
- Min Y, Djahanbakhch O, Hutchinson J, Bhullar AS, Raveendran M, Hallot A, et al. Effect of docosahexaenoic acid‐enriched fish oil supplementation in pregnant women with type 2 diabetes on membrane fatty acids and fetal body composition ‐ double‐blinded randomized placebo‐controlled trial. Diabetic Medicine 2014;31:1331‐40. [DOI] [PubMed] [Google Scholar]
- Min Y, ISRCTN68997518. Dietary omega‐3 and omega‐6 fatty acids supplementation in pregnant women with diabetes: a randomised, double‐blind, placebo‐controlled trial. isrctn.com/ISRCTN68997518 (first received 30 July 2010).
Min 2014 [diabetic women] {published data only}
- Min Y, Djahanbakhch O, Hutchinson J, Bhullar AS, Raveendran M, Hallot A, et al. Effect of docosahexaenoic acid‐enriched fish oil supplementation in pregnant women with type 2 diabetes on membrane fatty acids and fetal body composition ‐ double‐blinded randomized placebo‐controlled trial. Diabetic Medicine 2014;31:1331‐40. [DOI] [PubMed] [Google Scholar]
- Min Y, ISRCTN68997518. Dietary omega‐3 and omega‐6 fatty acids supplementation in pregnant women with diabetes: a randomised, double‐blind, placebo‐controlled trial. isrctn.com/ISRCTN68997518 (first received 30 July 2010).
Min 2016 {published data only}
- Min Y, Djahanbakhch O, Hutchinson J, Eram S, Bhullar AS, Namugere I, et al. Efficacy of docosahexaenoic acid‐enriched formula to enhance maternal and fetal blood docosahexaenoic acid levels: randomized double‐blinded placebo‐controlled trial of pregnant women with gestational diabetes mellitus. Clinical Nutrition 2016;35:608‐14. [DOI] [PubMed] [Google Scholar]
Mozurkewich 2013 {published data only}
- Berman D, Clinton C, Limb R, Somers EC, Romero V, Mozurkewich E. Prenatal omega‐3 supplementation and eczema risk among offspring at age 36 months. Insights Allergy Asthma Bronchitis 2016; Vol. 2, issue 1:1. [DOI: 10.21767/2471-304X.100014] [DOI] [PMC free article] [PubMed]
- Berman D, Limb R, Somers E, Clinton C, Romero V, Mozurkewich E. Prenatal omega‐3 supplementation and risk of eczema among offspring at age 36 months: long‐term follow‐up of the mothers, omega‐3, & mental health trial. American Journal of Obstetrics and Gynecology 2015;212(Suppl 1):S162. [Google Scholar]
- Brown ST, Tyner J, Mozurkewich EL, Clinton CM, Schrader R, Marcus S, et al. Fatty acid ratios and depressive symptoms in pregnancy: a secondary analysis of the Mothers, Omega‐3 & Mental Health Study. Reproductive Sciences 2013;20(3 Suppl):92A‐3A. [Google Scholar]
- Jain JA, Tyner JE, Holbrook BD, Williams JA, Mozurkewich EL. Is vitamin D associated with insulin sensitivity in maternal or umbilical cord blood?. Reproductive Sciences 2015;22(Suppl 1):251A. [Google Scholar]
- Mozurkewich E. Does EPA or DHA prevent depressive symptoms in pregnancy and postpartum?. clinicaltrials.gov/ct2/show/record/NCT00711971 (first received 9 July 2008). [NCT00711971]
- Mozurkewich E, Chilimigras J, Klemens C, Keeton K, Allbaugh L, Hamilton S, et al. The mothers, omega‐3 and mental health study. BMC Pregnancy & Childbirth 2011;11:46. [DOI] [PMC free article] [PubMed] [Google Scholar]
- Mozurkewich E, Clinton C, Chilimigras J, Hamilton S, Allbaugh L, Berman D, et al. The Mothers, Omega‐3 & Mental Health Study: a double‐blind, randomized controlled trial. American Journal of Obstetrics and Gynecology 2013;208(1 Suppl):S19‐20. [DOI] [PMC free article] [PubMed] [Google Scholar]
- Mozurkewich E, Greenwood M, Romero V, Berman D, Djuric Z, Qualls C, et al. EPA‐and DHA‐rich fish oil supplementation augments maternal and cord blood resolvin pathway markers: A mothers, omega‐3, & mental health study secondary analysis. American Journal of Obstetrics and Gynecology 2015;212(1 Suppl 1):S383‐4. [Google Scholar]
- Mozurkewich E, Williams J, Romero V, Jain J, Nirgudkar P, Schrader R, et al. Does prenatal DHA supplementation or vitamin d status affect plasma MCP‐1?. Reproductive Sciences 2014;1:314‐5A. [Google Scholar]
- Mozurkewich EL, Berman DR, Vahratian A, Clinton CM, Romero VC, Chilimigras JL, et al. Effect of prenatal EPA and DHA on maternal and umbilical cord blood cytokines. BMC Pregnancy and Childbirth 2018;18(1):261. [DOI] [PMC free article] [PubMed] [Google Scholar]
- Mozurkewich EL, Clinton CM, Chilimigras JL, Hamilton SE, Allbaugh LJ, Berman DR, et al. The Mothers, Omega‐3, and Mental Health Study: a double‐blind, randomized controlled trial. American Journal of Obstetrics and Gynecology 2013;208(4):313.e1‐9. [DOI] [PMC free article] [PubMed] [Google Scholar]
- Mozurkewich EL, Clinton CM, Romero VC, Tyner J, Brown S, Williams JZ, et al. Prenatal omega‐3 fatty acid supplementation reduces pro‐inflammatory cytokine production in umbilical cord blood: a secondary analysis of the Mothers, Omega‐3, & Mental Health Study. Reproductive Sciences 2013;20(3 Suppl):248A. [Google Scholar]
- Mozurkewich EL, Greenwood M, Clinton C, Berman D, Romero V, Djuric Z, et al. Pathway markers for pro‐resolving lipid mediators in maternal and umbilical cord blood: a secondary analysis of the Mothers, Omega‐3, and Mental Health Study. Frontiers in Pharmacology 2016;7:274. [DOI: 10.3389/fphar.2016.00274] [DOI] [PMC free article] [PubMed] [Google Scholar]
- Romero V, Stolberg V, Chensue S, Clinton C, Djuric Z, Berman D, et al. Developmental programming for allergic disease: a secondary analysis of the Mothers, Omega‐3 and Mental Health Study. American Journal of Obstetrics and Gynecology 2013;208(1 Suppl):S24. [DOI] [PMC free article] [PubMed] [Google Scholar]
- Romero VC, Somers EC, Stolberg V, Clinton C, Chensue S, Djuric Z, et al. Developmental programming for allergy: a secondary analysis of the Mothers, Omega‐3, and Mental Health Study. American Journal of Obstetrics and Gynecology 2013;208(4):316.e1‐e.6. [DOI] [PMC free article] [PubMed] [Google Scholar]
- Tyner JE, Jain JA, Williams JA, Holbrook BD, Mozurkewich EL. Analysis of maternal insulin sensitivity and maternal omega‐3 fatty acid levels. Reproductive Sciences 2015;22:259‐60A. [Google Scholar]
- Williams JA, Romero VC, Clinton CM, Vazquez DM, Marcus SM, Chilimigras JL, et al. Vitamin D levels and perinatal depressive symptoms in women at risk: a secondary analysis of the mothers, omega‐3, and mental health study. BMC Pregnancy and Childbirth 2016;16:203. [DOI: 10.1186/s12884-016-0988-7] [DOI] [PMC free article] [PubMed] [Google Scholar]
Mulder 2014 {published data only}
- Friesen RW, Innis SM. Dietary arachidonic acid to EPA and DHA balance is increased among Canadian pregnant women with low fish intake. Journal of Nutrition 2009;139(12):2344‐50. [DOI] [PubMed] [Google Scholar]
- Friesen RW, Innis SM. Linoleic acid is associated with lower long‐chain n‐6 and n‐3 fatty acids in red blood cell lipids of Canadian pregnant women. American Journal of Clinical Nutrition 2010;91(1):23‐31. [DOI] [PubMed] [Google Scholar]
- Innis SM. N‐3 fatty acid requirements for human development. clinicaltrials.gov/ct2/show/NCT00620672 (first received 21 February 2008).
- Innis SM, Friesen RW. Essential N‐3 fatty acids in pregnant women and early visual acuity maturation in term infants. American Journal of Clinical Nutrition 2008;87(3):548‐57. [DOI] [PubMed] [Google Scholar]
- Innis SM, Friesen RW. Maternal DHA supplementation in pregnancy: a double blind randomized prospective trial of maternal N‐3 fatty acid status, human milk fatty acids and infant development. Pediatric Academic Societies Annual Meeting; 2007 May 5‐8; Toronto (Canada). 2007.
- Mulder K, Innis S, Richardson K. Children's docosahexaenic acid (DHA) is associated with psychometric test scores at 5‐6 years of age. FASEB Journal 2014;28(1 Suppl 1):[abstract 124.2]. [Google Scholar]
- Mulder KA, Elango R, Innis SM. Fetal DHA inadequacy and the impact on child neurodevelopment: a follow‐up of a randomised trial of maternal DHA supplementation in pregnancy. British Journal of Nutrition 2018;119(3):271‐9. [DOI] [PubMed] [Google Scholar]
- Mulder KA, Innis SM, Richardson KJ. Cognitive performance of children 5‐6 years of age is associated with children's docosahexaenoic acid (DHA), but not dietary DHA or maternal DHA in pregnancy. Pediatric Academic Societies and Asian Society for Pediatric Research Joint Meeting; 2014 May 3‐6; Vancouver (Canada). 2014:Abstract no: 3680.6.
- Mulder KA, King DJ, Innis SM. Omega‐3 fatty acid deficiency in infants before birth identified using a randomized trial of maternal DHA supplementation in pregnancy. PLOS One 2014;9(1):e83764. [DOI] [PMC free article] [PubMed] [Google Scholar]
Noakes 2012 {published data only}
- Anonymous. Salmon in pregnancy study (SiPS). clinicaltrials.gov/ct2/show/NCT00801502 (first received 3 December 2008).
- Garcia‐Rodriguez C, Helmersson‐Karlqvis J, Mesa M, Miles E, Noakes P, Vlachava M, et al. Increased intake of salmon decreases F2‐isoprostanes in pregnant women. Annals of Nutrition and Metabolism 2011;58(Suppl 3):122‐3. [Google Scholar]
- Garcia‐Rodriguez C, Mesa M, Olza J, Vlachava M, Kremmyda L, Diaper N, et al. Farmed salmon supplementation enhances the enzymatic defence system. Annals of Nutrition and Metabolism 2011;58(Suppl 3):89‐90. [Google Scholar]
- Garcia‐Rodriguez CE, Helmersson‐Karlqvist J, Mesa MD, Miles EA, Noakes PS, Vlachava M, et al. Does increased intake of salmon increase markers of oxidative stress in pregnant women? The salmon in pregnancy study. Antioxidants & Redox Signaling 2011;15(11):2819‐23. [DOI] [PubMed] [Google Scholar]
- Garcia‐Rodriguez CE, Mesa MD, Olza J, Vlachava M, Kremmyda LS, Diaper ND, et al. Does consumption of two portions of salmon per week enhance the antioxidant defense system in pregnant women?. Antioxidants and Redox Signaling 2012;16(12):1401‐6. [DOI] [PubMed] [Google Scholar]
- Garcia‐Rodriguez CE, Olza J, Aguilera CM, Mesa MD, Miles EA, Noakes PS, et al. Plasma inflammatory and vascular homeostasis biomarkers increase during human pregnancy but are not affected by oily fish intake. Journal of Nutrition 2012;142(7):1191‐6. [DOI] [PubMed] [Google Scholar]
- Garcia‐Rodriguez CE, Olza J, Mesa MD, Aguilera CM, Miles EA, Noakes PS, et al. Fatty acid status and antioxidant defense system in mothers and their newborns after salmon intake during late pregnancy. Nutrition 2017;33:157‐62. [DOI] [PubMed] [Google Scholar]
- Helmersson‐Karlqvist J, Miles EA, Vlachava M, Kremmyda LS, Noakes PS, Diaper ND, et al. Enhanced prostaglandin F2alpha formation in human pregnancy and the effect of increased oily fish intake: results from the Salmon in Pregnancy Study. Prostaglandins Leukotrienes, and Essential Fatty Acids 2012;86(1‐2):35‐8. [DOI] [PubMed] [Google Scholar]
- Kremmyda LS, Vlachava M, Noakes PS, Miles EA, Diaper ND, Calder PC. Salmon in pregnancy (SIPS): the effects of increased oily fish intake during pregnancy on maternal peripheral blood mononuclear cell fatty acid composition and cytokine responses. Proceedings of the Nutrition Society 2010;69:E301. [Google Scholar]
- Miles EA, Noakes PS, Kremmyda LS, Vlachava M, Diaper ND, Rosenlund G, et al. The Salmon in Pregnancy Study: study design, subject characteristics, maternal fish and marine n‐3 fatty acid intake, and marine n‐3 fatty acid status in maternal and umbilical cord blood. American Journal of Clinical Nutrition 2011;94(6 Suppl):1986S‐92S. [DOI] [PubMed] [Google Scholar]
- Noakes PS, Vlachava M, Kremmyda LS, Diaper ND, Miles EA, Calder PC. The effects of increased oily fish intake during pregnancy on neonatal immune cells ‐ results from the salmon in pregnancy study (SIPS). Proceedings of the Nutrition Society 2010;69:E230. [Google Scholar]
- Noakes PS, Vlachava M, Kremmyda LS, Diaper ND, Miles EA, Erlewyn‐Lajeunesse M, et al. Increased intake of oily fish in pregnancy: effects on neonatal immune responses and on clinical outcomes in infants at 6 mo. American Journal of Clinical Nutrition 2012;95(2):395‐404. [DOI] [PubMed] [Google Scholar]
- Rossary A, Farges M, Lamas B, Miles EA, Noakes PS, Kremmyda L, et al. Increased consumption of salmon during pregnancy partly prevents the decline of some plasma essential amino acid concentrations in pregnant women. Clinical Nutrition 2014;33(2):267‐73. [DOI] [PubMed] [Google Scholar]
- Rossary A, Farges MC, Vlachava M, Kremmyda LS, Diaper ND, Noakes PS, et al. Does salmon consumption by pregnant women change amino acids availability?. Clinical Nutrition, Supplement 2011;6(1):109. [Google Scholar]
- Urwin HJ, Miles EA, Noakes PS, Kremmyda L, Vlachava M, Diaper ND, et al. Effect of salmon consumption during pregnancy on maternal and infant faecal microbiota, secretory IgA and calprotectin. British Journal of Nutrition 2014;111(5):773‐84. [DOI] [PubMed] [Google Scholar]
- Urwin HJ, Miles EA, Noakes PS, Kremmyda LS, Vlachava M, Diaper ND, et al. Salmon consumption during pregnancy alters fatty acid composition and secretory IgA concentration in human breast milk. Journal of Nutrition 2012;142(8):1603‐10. [DOI] [PubMed] [Google Scholar]
- Vlachava M, Kremmyda LS, Diaper ND, Noakes PS, Miles EA, Calder PC. Salmon in pregnancy study (SIPS): increased oily fish intake during pregnancy, cord blood plasma immunoglobulin E (IgE) and interleukin‐13 (IL‐13) concentrations and clinical outcomes in infants at high risk of atopy. Proceedings of the Nutrition Society 2010;69:E311. [Google Scholar]
- Elsen LW, Noakes PS, Maarel MA, Kremmyda LS, Vlachava M, Diaper ND, et al. Salmon consumption by pregnant women reduces ex vivo umbilical cord endothelial cell activation. American Journal of Clinical Nutrition 2011;94(6):1418‐25. [DOI] [PubMed] [Google Scholar]
Ogundipe 2016 {published data only}
- Ogundipe E. Maternal fish oil supplementation in high risk pregnancies and the effect on the infants' brain MRI findings and neurobehavioural outcomes. isrctn.com/ISRCTN24068733 (first received 13 June 2011). [ISRCTN24068733]
- Ogundipe E, Ghaus K, Wang Y, Talbot I, Johnson MR, Crawford M. FOSS Trial: antenatal maternal DHA and AA lipids and their psycho‐behavioural status. Journal of Maternal‐Fetal & Neonatal Medicine 2014;27(Suppl 1):202. [Google Scholar]
- Ogundipe E, Johnson MR, Wang Y, Crawford MA. Peri‐conception maternal lipid profiles predict pregnancy outcomes. Prostaglandins Leukotrienes and Essential Fatty Acids 2016;114:35‐43. [DOI: 10.1016/j.plefa.2016.08.012] [DOI] [PubMed] [Google Scholar]
- Ogundipe E, Tusor N, Wang Y, Johnson MR, Edwards AD, Crawford MA. Randomized controlled trial of brain specific fatty acid supplementation in pregnant women increases brain volumes on MRI scans of their newborn infants. Prostaglandins, Leukotrienes and Essential Fatty Acids 2018;138:6‐13. [DOI] [PubMed] [Google Scholar]
- Ogundipe E, Wang Y, Johnson MR, Crawford MA. Monounsaturated fatty acids in early pregnancy and preterm birth. Journal of Maternal‐Fetal and Neonatal Medicine 2016;29(Suppl 1):264. [Google Scholar]
- Samuelson S, Johnson MR, Crawford MA, Wang Y, Ogundipe E. Fatty acid profiles at antenatal booking are a predictor of gestational diabetes mellitus. Journal of Maternal Fetal Neonatal Medicine 2016;29:27. [Google Scholar]
Oken 2013 {published data only}
- Oken E, Guthrie LB, Bloomingdale A, Gillman MW, Olsen SF, Amarasiriwardena CJ, et al. Assessment of dietary fish consumption in pregnancy: comparing one‐, four‐ and thirty‐six‐item questionnaires. Public Health Nutrition 2014;17:1949‐59. [DOI] [PMC free article] [PubMed] [Google Scholar]
- Oken E, Guthrie LB, Bloomingdale A, Platek DN, Price S, Haines J, et al. A pilot randomized controlled trial to promote healthful fish consumption during pregnancy: the Food for Thought Study. Nutrition Journal 2013;12:33. [DOI] [PMC free article] [PubMed] [Google Scholar]
Olsen 1992 {published data only}
- Dalby Sorensen J, Olsen SF, Pedersen AK, Boris J, Secher NJ, FitzGerald GA. Effect of fish oil supplementation in the third trimester of pregnancy on prostacyclin and thromboxane production. American Journal of Obstetrics and Gynecology 1993;168:915‐22. [DOI] [PubMed] [Google Scholar]
- Dalby Sorensen J, Secher NJ, Olsen SF. Effects of n‐3 fatty acids on blood pressure in the third trimester of pregnancy. 7th World Congress of Hypertension in Pregnancy; 1990; Perugia (Italy). 1990:343.
- Hansen S, Strom M, Maslova E, Dahl R, Hoffmann HJ, Rytter D, et al. Fish oil supplementation during pregnancy and allergic respiratory disease in the adult offspring. Journal of Allergy and Clinical Immunology 2017;139(1):104‐11. [DOI] [PubMed] [Google Scholar]
- Olsen S, NCT01353807. Impact of fish oil supplementation in 3rd trimester of pregnancy on maternal and offspring health. clinicaltrials.gov/show/NCT01353807 (first received 16 May 2011). [NCT01353807]
- Olsen SF, Dalby Sorensen J, Secher NJ, Hedegaard M, Brink Henriksen T, Hansen HS, et al. Randomised controlled trial of effect of fish‐oil supplementation on pregnancy duration. Lancet 1992;339:1003‐7. [DOI] [PubMed] [Google Scholar]
- Olsen SF, Secher NJ. Fish oil and preeclampsia. 8th World Congress of the International Society for the Study of Hypertension in Pregnancy; 1992 November 8‐12; Buenos Aires (Argentina). 1992:94.
- Olsen SF, Secher NJ, Sorensen JD, Grant A. Gestational age and fish oil supplementation in third trimester: a population‐based randomized controlled trial. Proceedings of 13th World Congress of Gynaecology and Obstetrics (FIGO); 1991 September; Singapore. 1991:31.
- Olsen SF, Sorensen JD, Secher NJ, Hedegaard M, Henriksen TB, Hansen HS, et al. Fish oil supplementation and duration of pregnancy. A randomized controlled trial. Ugeskrift for Laeger 1994;156:1302‐7. [PubMed] [Google Scholar]
- Olsen SF, Østerdal L, Salvig JD, Mortensen LM, Rytter D, Secher NJ, et al. Fish oil intake compared with olive oil intake in late pregnancy and asthma in the offspring: 16 y of registry‐based follow‐up from a randomized controlled trial. American Journal of Clinical Nutrition 2008;88:167‐75. [DOI] [PubMed] [Google Scholar]
- Rytter D, Bech BH, Christensen JH, Schmidt EB, Henriksen TB, Olsen SF. Intake of fish oil during pregnancy and adiposity in 19‐y‐old offspring: follow‐up on a randomized controlled trial. American Journal of Clinical Nutrition 2011;94(3):701‐8. [DOI] [PMC free article] [PubMed] [Google Scholar]
- Rytter D, Christensen JH, Bech BH, Schmidt EB, Henriksen TB, Olsen SF. The effect of maternal fish oil supplementation during the last trimester of pregnancy on blood pressure, heart rate and heart rate variability in the 19‐year‐old offspring. British Journal of Nutrition 2012;108(8):1475‐83. [DOI] [PubMed] [Google Scholar]
- Rytter D, Schmidt EB, Bech BH, Christensen JH, Henriksen TB, Olsen SF. Fish oil supplementation during late pregnancy does not influence plasma lipids or lipoprotein levels in young adult offspring. Lipids 2011;46(12):1091‐9. [DOI] [PMC free article] [PubMed] [Google Scholar]
- Salvig JD, Olsen SF, Secher NJ. Effects of fish oil supplementation in late pregnancy on blood pressure: a randomised controlled trial. British Journal of Obstetrics and Gynaecology 1996;103:529‐33. [DOI] [PubMed] [Google Scholar]
- Sorensen JD, Olsen SF, Pedersen AK, Boris J, Secher NJ, FitzGerald GA. Effects of fish oil supplementation in the third trimester of pregnancy on prostacyclin and thromboxane production. International Journal of Gynecology & Obstetrics 1993;43:229. [DOI] [PubMed] [Google Scholar]
- Sorensen JD, Olsen SF, Secher NJ. Effects of fish oil supplementation in late pregnancy on blood pressure: a randomised controlled study. Acta Obstetricia et Gynecologica Scandinavica Supplement 1995;73:110. [Google Scholar]
- Sorensen JD, Olsen SF, Secher NJ, Jespersen J. Effects of fish oil supplementation in late pregnancy on blood lipids, serum urate, coagulation and fibrinolysis. A randomised controlled study. Fibrinolysis 1994;8:54‐60. [Google Scholar]
- Strom M, Maslova E, Hansen S, Mortensen EL, Olsen SF. Fish oil supplementation during pregnancy and offspring risk of attention deficit/hyperactivity disorder and depression: 14‐20 year follow up of two randomized controlled trials. Acta Obstetricia et Gynecologica Scandinavica 2013;92(Suppl 160):31. [Google Scholar]
- Houwelingen AC, Sorensen JD, Hornstra G, Simonis MM, Boris J, Olsen SF, et al. Essential fatty acid status in neonates after fish‐oil supplementation during late pregnancy. British Journal of Nutrition 1995;74:723‐31. [DOI] [PubMed] [Google Scholar]
Olsen 2000 {published data only}
- Hansen S, Maslova E, Strom M, Secher NJ, Olsen SF. Does mode of delivery modify the association between intake of fish oil during pregnancy and the risk of child asthma? Results from a randomized controlled trial with twin pregnancies. Acta Obstetricia et Gynecologica Scandinavica 2013;92:17. [Google Scholar]
- Olsen S, NCT02229526. Randomised clinical trials of fish oil supplementation in high risk pregnancies. clinicaltrials.gov/show/NCT02229526 (first received 1 September 2014). [NCT02229526]
- Olsen SF, Osterdal ML, Salvig JD, Weber T, Tabor A, Secher NJ. Duration of pregnancy in relation to fish oil supplementation and habitual fish intake: a randomised clinical trial with fish oil. European Journal of Clinical Nutrition 2007;61(8):976‐85. [DOI] [PubMed] [Google Scholar]
- Olsen SF, Secher NJ, Tabor A, Weber T, Walker JJ, Gluud C. Randomised clinical trials of fish oil supplementation in high risk pregnancies. British Journal of Obstetrics and Gynaecology 2000;107:382‐95. [DOI] [PubMed] [Google Scholar]
- Secher NJ, Sorensen JD. Biochemical and epidemiological evidence for the preventive effect of fish oil on pre‐eclampsia. 9th International Congress of the International Society for the Study of Hypertension in Pregnancy; 1994 March 15‐18; Sydney (Australia). 1994:77.
Olsen 2000 [twins] {published data only}
- Hansen S, Maslova E, Strom M, Secher NJ, Olsen SF. Does mode of delivery modify the association between intake of fish oil during pregnancy and the risk of child asthma? Results from a randomized controlled trial with twin pregnancies. Acta Obstetricia et Gynecologica Scandinavica 2013;92:17. [Google Scholar]
- Olsen S, NCT02229526. Randomised clinical trials of fish oil supplementation in high risk pregnancies. clinicaltrials.gov/show/NCT02229526 (first received 1 September 2014). [NCT02229526]
- Olsen SF, Osterdal ML, Salvig JD, Weber T, Tabor A, Secher NJ. Duration of pregnancy in relation to fish oil supplementation and habitual fish intake: a randomised clinical trial with fish oil. European Journal of Clinical Nutrition 2007;61(8):976‐85. [DOI] [PubMed] [Google Scholar]
- Olsen SF, Secher NJ, Tabor A, Weber T, Walker JJ, Gluud C. Randomised clinical trials of fish oil supplementation in high risk pregnancies. British Journal of Obstetrics and Gynaecology 2000;107:382‐95. [DOI] [PubMed] [Google Scholar]
- Secher NJ, Sorensen JD. Biochemical and epidemiological evidence for the preventive effect of fish oil on pre‐eclampsia. 9th International Congress of the International Society for the Study of Hypertension in Pregnancy; 1994 March 15‐18; Sydney (Australia). 1994:77.
Onwude 1995 {published data only}
- Onwude J, Hjartar H, Tuffnell D, Thornton JG, Lilford RJ. Fish oil in high risk pregnancy: a randomised, double blind, placebo‐controlled trial. Proceedings of 26th British Congress of Obstetrics and Gynaecology; 1992 July 7‐10; Manchester (UK). 1992:430.
- Onwude JL, Lilford RJ, Hjartardottir H, Staines A, Tuffnell D. A randomised double blind placebo controlled trial of fish oil in high risk pregnancy. British Journal of Obstetrics and Gynaecology 1995;102:95‐100. [DOI] [PubMed] [Google Scholar]
Otto 2000 {published data only}
- Otto SJ, Houwelingen AC, Hornstra G. The effect of supplementation with docosahexaenoic and arachidonic acid derived from single cell oils on plasma and erythrocyte fatty acids of pregnant women in the second trimester. Prostaglandins Leukotrienes, and Essential Fatty Acids 2000;63:323‐8. [DOI] [PubMed] [Google Scholar]
Pietrantoni 2014 {published data only}
- Pietrantoni E, Chierico F, Rigon G, Vernocchi P, Salvatori G, Manco M, et al. Docosahexaenoic acid supplementation during pregnancy: a potential tool to prevent membrane rupture and preterm labor. International Journal of Molecular Sciences 2014;15:8024‐36. [DOI] [PMC free article] [PubMed] [Google Scholar]
Ramakrishnan 2010 {published data only}
- Barraza‐Villarreal A, Escamilla‐Nunez MC, Hernandez‐Cadena L, Navarro‐Olivos E, Texcalac‐Sangrador JL, Shackleton C, et al. Volatile organic compounds air concentrations and respiratory function in Mexican preschoolers from mothers whose participated in a randomized clinical trial during pregnancy. American Journal of Respiratory Critical Care 2012;185:A6887. [Google Scholar]
- Escamilla‐Nunez MC, Barraza‐Villarreal A, Hernandez‐Cadena L, Navarro‐Olivos E, Sly PD, Romieu I. Omega‐3 fatty acid supplementation during pregnancy and respiratory symptoms in children. Chest 2014;146(2):373‐82. [DOI] [PMC free article] [PubMed] [Google Scholar]
- Gonzalez‐Casanova I, Rzehak P, Hao W, Aryeh S, Barraza‐Villarreal A, Garcia‐Feregrino R, et al. Fatty acid desaturase single nucleotide polymorphisms modify the effect of prenatal supplementation with docosahexaenoic acid on birth weight. FASEB Journal 2015;29(1 Suppl):403.3. [Google Scholar]
- Gonzalez‐Casanova I, Rzehak P, Stein AD, Garcia Feregrino R, Rivera Dommarco JA, Barraza‐Villareal A, et al. Maternal single nucleotide polymorphisms in the fatty acid desaturase 1 and 2 coding regions modify the impact of prenatal supplementation with DHA on birth weight. American Journal of Clinical Nutrition 2016;103(4):1171‐8. [DOI] [PMC free article] [PubMed] [Google Scholar]
- Gonzalez‐Casanova I, Stein A, Hao W, Feregrino R, Romieu I, Barraza‐Villarreal A, et al. Height and BMI at five years of age following prenatal supplementation with docosahexaenoic acid in Mexico. FASEB Journal 2014;28(1 Suppl 1):256.8. [Google Scholar]
- Gonzalez‐Casanova I, Stein AD, Hao W, Garcia‐Feregrino R, Barraza‐Villarreal A, Romieu I, et al. Prenatal supplementation with docosahexaenoic acid has no effect on growth through 60 months of age. Journal of Nutrition 2015;145(6):1330‐4. [DOI] [PMC free article] [PubMed] [Google Scholar]
- Gutierrez‐Delgado RI, Barraza‐Villarreal A, Escamilla‐Nunez C, Hernandez‐Cadena L, Garcia‐Feregrino R, Shackleton C, et al. Effect of omega‐3 fatty acids supplementation during pregnancy on lung function in preschoolers: a clinical trial. Journal of Asthma 2018 [Epub ahead of print]. [DOI] [PubMed]
- Gutierrez‐Gomez Y, Ramakrishnan U, Stein A, Barraza‐Villarreal A, Romieu I, Rivera J. Maternal DHA supplementation during pregnancy and offspring blood pressure at age 5y: Follow‐up of a randomized controlled trial in Mexico. FASEB Journal 2014;28(1 Suppl 1):[Abstract no. 804.21]. [Google Scholar]
- Gutierrez‐Gomez Y, Stein AD, Ramakrishnan U, Barraza‐Villarreal A, Moreno‐Macias H, Aguilar‐Salinas C, et al. Prenatal docosahexaenoic acid supplementation does not affect nonfasting serum lipid and glucose concentrations of offspring at 4 years of age in a follow‐up of a randomized controlled clinical trial in Mexico. Journal of Nutrition 2017;147(2):242‐7. [DOI: 10.3945/jn.116.238329] [DOI] [PMC free article] [PubMed] [Google Scholar]
- Gutierrez‐Gomez YY, Ramakrishnan U, Stein AD, Martorell R, Aguilar‐Salinas C, Romieu I, et al. Maternal DHA supplementation during pregnancy and plasma lipids and glucose levels in offspring at age 4y: Follow‐up of a randomized controlled trial. FASEB Journal 2013;27(Suppl):[Abstract no. 1055.9]. [Google Scholar]
- Hernandez E, Barraza‐Villarreal A, Escamilla‐Nunez MC, Hernandez‐Cadena L, Sly PD, Neufeld LM, et al. Prenatal determinants of cord blood total immunoglobulin E levels in Mexican newborns. Allergy & Asthma Proceedings 2013;34(5):e27‐34. [DOI] [PMC free article] [PubMed] [Google Scholar]
- Imhoff‐Kunsch B, Stein AD, Martorell R, Parra‐Cabrera S, Romieu I, Ramakrishnan U. Prenatal docosahexaenoic acid supplementation and infant morbidity: randomized controlled trial. Pediatrics 2011;128(3):e505‐12. [DOI] [PMC free article] [PubMed] [Google Scholar]
- Imhoff‐Kunsch B, Stein AD, Villalpando S, Martorell R, Ramakrishnan U. Docosahexaenoic acid supplementation from mid‐pregnancy to parturition influenced breast milk fatty acid concentrations at 1 month postpartum in Mexican women. Journal of Nutrition 2011;141(2):321‐6. [DOI] [PMC free article] [PubMed] [Google Scholar]
- Imhoff‐Kunsch BC, Stein AD, Villalpando S, Martorell R, Ramakrishnan U. Docosahexaenoic acid supplementation from mid‐pregnancy through parturition influenced breast milk fatty acid composition at 1 month post‐partum in a double‐blind randomized controlled trial in Mexico. FASEB Journal 2009;23(1 Suppl):344.5. [Google Scholar]
- Lee HS, Barraza A, Hernandez‐Vargas, Sly P, Biessy C, Ramakrishnan U, et al. Modulation of epigenetic states and infant immune system by dietary supplementation with w‐3 PUFA during pregnancy in an intervention study. Annals of Nutrition & Metabolism 2013;63(Suppl 1):501, Abstract no: PO516. [DOI] [PMC free article] [PubMed] [Google Scholar]
- Lee HS, Barraza‐Villarreal A, Biessy C, Duarte‐Salles T, Sly PD, Ramakrishnan U, et al. Dietary supplementation with polyunsaturated fatty acid during pregnancy modulates DNA methylation at IGF2/H19 imprinted genes and growth of infants. Physiological Genomics 2014;46(236):851‐7. [DOI] [PMC free article] [PubMed] [Google Scholar]
- Lee HS, Barraza‐Villarreal A, Hernandez‐Vargas H, Sly PD, Biessy C, Ramakrishnan U, et al. Modulation of DNA methylation states and infant immune system by dietary supplementation with omega‐3 PUFA during pregnancy in an intervention study. American Journal of Clinical Nutrition 2013;98(2):480‐7. [DOI] [PMC free article] [PubMed] [Google Scholar]
- Ramakrishnan U. Effects of prenatal DHA supplements on infant development. clinicaltrials.gov/ct2/show/NCT00646360 (first received 28 March 2008). [NCT00646360]
- Ramakrishnan U, Di A, Schnaas L, Stein AD, Wang M, Martorell R, et al. Effect of prenatal supplementation with docosahexanoic acid on infant development: a randomized placebo‐controlled trial in Mexico. FASEB Journal 2010;24:Abstract no 227.6. [Google Scholar]
- Ramakrishnan U, Gonzalez‐Casanova I, Schnaas L, DiGirolamo A, Quezada AD, Pallo BC, et al. Prenatal supplementation with DHA improves attention at 5 y of age: a randomized controlled trial. American Journal of Nutrition 2016;104:1075‐82. [DOI] [PMC free article] [PubMed] [Google Scholar]
- Ramakrishnan U, Pallo BC, Schnaas L, DiGirolamo A, Feregrino RG, Quezada DA, et al. Effects of prenatal DHA supplementation on child development at age 5 years in Mexico. FASEB Journal 2013;27(Suppl 1):Abstract no: 355.1. [Google Scholar]
- Ramakrishnan U, Schnaas L, DiGirolamo A, Quezada AD, Hao W, Pallo B. Effects of prenatal DHA supplementation on attention and behavior of offspring at age 5 y: randomized controlled trial in Mexico. Annals of Nutrition & Metabolism 2013;63(Suppl 1):450. Abstract no: PO409. [Google Scholar]
- Ramakrishnan U, Stein AD, Parra‐Cabrera S, Wang M, Imhoff‐Kunsch B, Juarez‐Marquez S, et al. Effects of docosahexaenoic acid supplementation during pregnancy on gestational age and size at birth: randomized, double‐blind, placebo‐controlled trial in Mexico. Food and Nutrition Bulletin 2010;31:S108‐16. [DOI] [PubMed] [Google Scholar]
- Ramakrishnan U, Stinger A, DiGirolamo AM, Martorell R, Neufeld LM, Rivera JA, et al. Prenatal docosahexaenoic acid supplementation and offspring development at 18 months: randomized controlled trial. PLOS One 2015;10(8):e0120065. [DOI] [PMC free article] [PubMed] [Google Scholar]
- Ramirez‐Silva C, Rivera‐Dommarco J, Trejo‐Valdivia B, Martorell R, Stein A, Ramakrishman U, et al. Rapid weight gain through age 4 y is associated with increased adiposity, higher blood pressure and insulin alterations at 4‐5 y. FASEB Journal 2014;1(Suppl 1):1024.14. [DOI] [PMC free article] [PubMed] [Google Scholar]
- Ramirez‐Silva I, Rivera JA, Trejo‐Valdivia B, Martorell R, Stein A, Romieu I, et al. Breastfeeding status at age 3 months is associated with adiposity and cardiometabolic markers at age 4 years in Mexican children. Journal of Nutrition 2015;145:1295‐302. [DOI] [PMC free article] [PubMed] [Google Scholar]
- Romieu I, Barraza‐Villarreal A, Hernandez‐Cadena L, Escamilla‐Nunez C, Sly P, Neulfeld L, et al. Supplementation with omega‐3 fatty acids and atopy symptoms in infants: a randomized controlled trial. European Respiratory Society Annual Congress; 2008 October 4‐8; Berlin, Germany. 2008:346s.
- Romieu I, Barraza‐Villarreal A, Hernandez‐Cadena L, Escamilla‐Nunez C, Sly P, Neulfeld L, et al. Supplementation with omega‐3 fatty acids and atopy symptoms in infants: a randomized controlled trial. American Journal of Epidemiology 2008;167(11):S23. [Google Scholar]
- Romieu I, Hernandez E, Barraza‐Villarreal A, Escamilla‐Nunez C, Sly P, Neufeld L, et al. Predictors of cord blood IgE levels in child: preliminary results of a randomized controlled trial of omega‐3 PUFA supplementation during pregnancy. Journal of Allergy and Clinical Immunology 2009;123(2 Suppl 1):S193. [Google Scholar]
- Romieu I, Lee H, Barraza A, Biessy C, Duarte‐Salles T, Sly P, et al. Dietary supplementation with polyunsaturated fatty acid during pregnancy modulates DNA methylation at IGF2/H19 imprinted genes and growth of infants. FASEB Journal 2014;28(1 Suppl 1):1120.3. [DOI] [PMC free article] [PubMed] [Google Scholar]
- Stein AD, Wang M, Martorell R, Neufeld L, Flores‐Ayala R, Rivera J, et al. Postnatal growth following maternal gestational supplementation with docosahexanoic acid (DHA): randomized placebo‐controlled trial in Mexico. FASEB Journal 2010;24(Suppl):Abstract no 277.5. [Google Scholar]
- Stein AD, Wang M, Martorell R, Neufeld LM, Flores‐Ayala R, Rivera JA, et al. Growth to age 18 months following prenatal supplementation with docosahexaenoic acid differs by maternal gravidity in Mexico. Journal of Nutrition 2011;141:316‐20. [DOI] [PMC free article] [PubMed] [Google Scholar]
- Stein AD, Wang M, Rivera JA, Martorell R, Ramakrishnan U. Auditory‐and visual‐evoked potentials in Mexican infants are not affected by maternal supplementation with 400 mg/d docosahexaenoic acid in the second half of pregnancy. Journal of Nutrition 2012;142(8):1577‐81. [DOI] [PMC free article] [PubMed] [Google Scholar]
Ranjkesh 2011 {published data only}
- Lalooha F, Ghaleh TD, Pakniiat H, Ranjkesh F, Gholshahi T, Mashrabi O. Evaluation of the effect of omega‐3 supplements in the prevention of preeclampsia among high risk women. African Journal of Pharmacy and Pharmacology 2012;6(35):2580‐3. [DOI: 10.5897/AJPP11.836] [DOI] [Google Scholar]
- Ranjkesh F. The effect of omega3 supplementation in preeclampsia in pregnant women at risk in Qazvin [IRCT138706061113N1]. en.irct.ir/trial/145 (first received 27 March 2010).
- Ranjkesh F, Laluha F, Pakniat H, Kazemi H, Golshahi T, Esmaili S. Effect of omeg‐3 supplementation on preeclampsia in high risk pregnant women. Journal of Qazvin University of Medical Sciences 2011;15(2):28‐33. [Google Scholar]
Razavi 2017 {published data only}
- Razavi M. Clinical trial of the effect of combined omega‐3 fatty acids and vitamin D supplementation compared with the placebo on metabolic profiles and pregnancy outcomes in patients with gestational diabetes. en.search.irct.ir/view/35656 (first received 9 February 2017). [IRCT201701305623N106]
- Razavi M, Jamilian M, Samimi M, Afshar Ebrahimi F, Taghizadeh M, Bekhradi R, et al. The effects of vitamin D and omega‐3 fatty acids co‐supplementation on biomarkers of inflammation, oxidative stress and pregnancy outcomes in patients with gestational diabetes. Nutrition & Metabolism 2017;14:80. [DOI: 10.1186/s12986-017-0236-9] [DOI] [PMC free article] [PubMed] [Google Scholar]
Razavi 2017 [vit D] {published data only}
- Razavi M. Clinical trial of the effect of combined omega‐3 fatty acids and vitamin D supplementation compared with the placebo on metabolic profiles and pregnancy outcomes in patients with gestational diabetes. en.search.irct.ir/view/35656 (first received 9 February 2017). [IRCT201701305623N106]
- Razavi M, Jamilian M, Samimi M, Afshar Ebrahimi F, Taghizadeh M, Bekhradi R, et al. The effects of vitamin D and omega‐3 fatty acids co‐supplementation on biomarkers of inflammation, oxidative stress and pregnancy outcomes in patients with gestational diabetes. Nutrition & Metabolism 2017;14:80. [DOI: 10.1186/s12986-017-0236-9] [DOI] [PMC free article] [PubMed] [Google Scholar]
Rees 2008 {published data only}
- Rees AM, Austin MP, Parker GB. Omega‐3 fatty acids as a treatment for perinatal depression: randomized double‐blind placebo‐controlled trial. Australian and New Zealand Journal of Psychiatry 2008;42:199‐205. [DOI] [PubMed] [Google Scholar]
Ribeiro 2012 {published data only}
- Ribeiro P, Carvalho FD, Abreu Ade A, Sant'anna Mde T, Lima RJ, Carvalho Pde O. Effect of fish oil supplementation in pregnancy on the fatty acid composition of erythrocyte phospholipids and breast milk lipids. International Journal of Food Sciences & Nutrition 2012;63(1):36‐40. [DOI] [PubMed] [Google Scholar]
Rivas‐Echeverria 2000 {published data only}
- Rivas‐Echeverria CA, Echeverria Y, Molina L, Novoa D. Synergic use of aspirin, fish oil and vitamins C and E for the prevention of preeclampsia. Hypertension in Pregnancy 2000;19:30. [Google Scholar]
Samimi 2015 {published data only}
- Samimi M, Jamilian M, Asemi Z, Esmaillzadeh A. Effects of omega‐3 fatty acid supplementation on insulin metabolism and lipid profiles in gestational diabetes: randomized, double‐blind, placebo‐controlled trial. American Journal of Clinical Nutrition 2015;34:388‐93. [DOI] [PubMed] [Google Scholar]
Sanjurjo 2004 {published data only}
- Sanjurjo P, Ruiz‐Sanz JI, Jimeno P, Aldamiz‐Echevarria L, Aquino L, Matorras R, et al. Supplementation with docosahexaenoic acid in the last trimester of pregnancy: maternal‐fetal biochemical findings. Journal of Perinatal Medicine 2004;32(2):132‐6. [DOI] [PubMed] [Google Scholar]
Smuts 2003a {published data only}
- Colombo J, Kannass KN, Shaddy DJ, Kundurthi S, Maikranz JM, Anderson CJ, et al. Maternal DHA and the development of attention in infancy and toddlerhood. Child Development 2004;75(4):1254‐67. [DOI] [PubMed] [Google Scholar]
- Smuts CM, Huang M, Mundy D, Plasse T, Major S, Carlson SE. A randomized trial of docosahexaenoic acid supplementation during the third trimester of pregnancy. Obstetrics & Gynecology 2003;101:469‐79. [DOI] [PubMed] [Google Scholar]
Smuts 2003b {published data only}
- Borod E, Atkinson R, Barclay WR, Carlson SE. Effects of third trimester consumption of eggs high in docosahexaenoic acid on docosahexaenoic acid status and pregnancy. Lipids 1999;34 Suppl:S231. [DOI] [PubMed] [Google Scholar]
- Smuts CM, Borod E, Peeples JM, Carlson SE. High‐DHA eggs: feasibility as a means to enhance circulating DHA in mother and infant. Lipids 2003;38(4):407‐14. [DOI] [PubMed] [Google Scholar]
Su 2008 {published data only}
- Su K‐P, Huang S‐Y, Chiu T‐H, Huang K‐C, Huang C‐L, Chang H‐C, et al. Omega‐3 fatty acids for major depressive disorder during pregnancy: results from a randomized, double‐blind, placebo‐controlled trial. Journal of Clinical Psychiatry 2008;69(4):644‐51. [DOI] [PubMed] [Google Scholar]
Taghizadeh 2016 {published data only}
- Asemi Z, IRCT201507035623N47. Clinical trial of the effect of combined omega‐3 and vitamin E supplementation on pregnancy outcomes in gestational diabetes. en.search.irct.ir/view/24407 (first received 19 July 2015).
- Jamilian M, Hashemi Dizaji S, Bahmani F, Taghizadeh M, Memarzadeh MR, Karamali M, et al. A randomized controlled clinical trial investigating the effects of omega‐3 fatty acids and vitamin E co‐supplementation on biomarkers of oxidative stress, inflammation and pregnancy outcomes in gestational diabetes. Canadian Journal of Diabetes 2017;41(2):143‐9. [DOI: 10.1016/j.jcjd.2016.09.004] [DOI] [PubMed] [Google Scholar]
- Taghizadeh M, Jamilian M, Mazloomi M, Sanami M, Asemi Z. A randomised‐controlled clinical trial investigating the effect of omega‐3 fatty acids and vitamin E co‐supplementation on markers of insulin metabolism and lipid profiles in gestational diabetes. Journal of Clinical Lipidology 2016;10:386‐93. [DOI] [PubMed] [Google Scholar]
Tofail 2006 {published data only}
- Tofail F, Hamadani JD, Ahmed AZ, Mehrin F, Hakim M, Huda SN. The mental development and behavior of low‐birth‐weight Bangladeshi infants from an urban low‐income community. European Journal of Clinical Nutrition 2012;66(2):237‐43. [DOI] [PubMed] [Google Scholar]
- Tofail F, Kabir I, Hamadani JD, Chowdhury F, Yesmin S, Mehreen F, et al. Supplementation of fish‐oil and soy‐oil during pregnancy and psychomotor development of infants. Journal of Health, Population & Nutrition 2006;24(1):48‐56. [PubMed] [Google Scholar]
Valenzuela 2015 {published data only}
- Valenzuela R, Bascunan K, Chamorro R, Barrera C, Sandoval J, Puigrredon C, et al. Modification of docosahexaenoic acid composition of milk from nursing women who received alpha linolenic acid from chia oil during gestation and nursing. Nutrients 2015;7(8):6405‐24. [DOI] [PMC free article] [PubMed] [Google Scholar]
Van Goor 2009 {published data only}
- Doornbos B, Goor SA, Dijck‐Brouwer DA, Schaafsma A, Kork J, Muskiet FA. Supplementation of a low dose of DHA or DHA+AA does not prevent peripartum depressive symptoms in a small population based sample. Progress in Neuro‐Psychopharmacology & Biological Psychiatry 2009;33(1):49‐52. [DOI] [PubMed] [Google Scholar]
- Goor SA, Dijck‐Brouwer DA, Erwich JJ, Schaafsma A, Mijna Hadders‐Algra M. The influence of supplemental docosahexaenoic and arachidonic acids during pregnancy and lactation on neurodevelopment at eighteen months. Prostaglandins Leukotrienes and Essential Fatty Acids 2011;84(5‐6):139‐46. [DOI] [PubMed] [Google Scholar]
- Goor SA, Dijck‐Brouwer DA, Hadders‐Algra M, Doornbos B, Erwich JJ, Schaafsma A, et al. Human milk arachidonic acid and docosahexaenoic acid contents increase following supplementation during pregnancy and lactation. Prostaglandins Leukotrienes, and Essential Fatty Acids 2009;80(1):65‐9. [DOI] [PubMed] [Google Scholar]
- Goor SA, Muskiet FA. The effect of a high DHA‐fish oil and arachidonic acid (AA) supplementation during pregnancy and lactation on LCP status of mother and child and on the neurological development of the baby. trialregister.nl/trialreg/admin/rctview.asp?TC=366 (first received 19 December 2005.
- Goor SA, Schaafsma A, Erwich JJ, Dijck‐Brouwer DA, Muskiet FA. Mildly abnormal general movement quality in infants is associated with higher Mead acid and lower arachidonic acid and shows a U‐shaped relation with the DHA/AAratio. Prostaglandins Leukotrienes and Essential Fatty Acids 2010;82:15‐20. [DOI] [PubMed] [Google Scholar]
- Goor SA, Dijck‐Brouwer DA, Doornbos B, Erwich JJ, Schaafsma A, Muskiet FA, et al. Supplementation of DHA but not DHA with arachidonic acid during pregnancy and lactation influences general movement quality in 12‐week‐old term infants. British Journal of Nutrition 2010;103(2):235‐42. [DOI] [PubMed] [Google Scholar]
Van Winden 2017 {published data only}
- Winden KR, Montoro M, Silverstein E, Ovalle B, Shulman I, Ouzounian JG. The use of omega‐3 fatty acids to improve insulin sensitivity in pregnancy: a pilot study of safety and tolerability. Obstetrics and Gynecology 2017;129:174S. [Google Scholar]
Vaz 2017 {published data only}
- Vaz JD, Farias DR, Adegboye AR, Nardi AE, Kac G. Omega‐3 supplementation from pregnancy to postpartum to prevent depressive symptoms: a randomized placebo controlled trial. BMC Pregnancy and Childbirth 2017;17(1):180. [DOI: 10.1186/s12884-017-1365-x] [DOI] [PMC free article] [PubMed] [Google Scholar]
References to studies excluded from this review
Escobar 2008 {published data only}
- Escobar G, NCT00691418. DHA administration and length of gestation: a feasibility study. clinicaltrials.gov/show/NCT00691418 (first received 5 June 2008). [NCT00691418]
Fievet 1985 {published data only}
- Fievet P, Tribout B, Castier B, Dieval J, Capiod JC, Delobel J, et al. Effects of evening primrose oil (EPO) on platelet functions during pregnancy in patients with high risk of toxemia. Kidney International 1985;28:234. [Google Scholar]
Gholami 2017 {published data only}
- Gholami SN, IRCT2015072123269N1. Clinical trial to evaluate the effect of fish oil supplementation on pregnancy outcomes in pregnant women. http://en.search.irct.ir/view/24693 (first received 11 June 2017). [IRCT2015072123269N1]
Herrera 1993 {published data only}
- Herrera JA. Nutritional factors and rest reduce pregnancy‐induced hypertension and pre‐eclampsia in positive roll‐over test primigravidas. International Journal of Gynecology & Obstetrics 1993;41:31‐5. [DOI] [PubMed] [Google Scholar]
Herrera 1998 {published data only}
- Herrera JA, Arevalo‐Herrera M, Herrera S. Prevention of preeclampsia by linoleic acid and calcium supplementation: a randomized controlled trial. Obstetrics & Gynecology 1998;91:585‐90. [DOI] [PubMed] [Google Scholar]
Herrera 2004 {published data only}
- Herrera JA, Shahabuddin AK, Ersheng G, Wei Y, Garcia RG, Lopez‐Jaramillo P. Calcium plus linoleic acid therapy for pregnancy‐induced hypertension. International Journal of Gynecology & Obstetrics 2005;91(3):221‐7. [DOI] [PubMed] [Google Scholar]
- Herrera JA, Shahabuddin AK, Faisal M, Ersheng G, Wei Y, Lixia D, et al. Effects of supplementation with oral calcium and linoleic acid in primigravidas at high risk [Efectos de la supplementacion oral con calcio y acido linoleico conjugado en primigravidas de alto riesgo]. Colombia Medica 2004;35(1):31‐7. [Google Scholar]
Lauritzen 2004 {published data only}
- Asserhoj M, Nehammer S, Matthiessen J, Michaelsen KF, Lauritzen L. Maternal fish oil supplementation during lactation may adversely affect long‐term blood pressure, energy intake, and physical activity of 7‐year‐old boys. Journal of Nutrition 2009;139(2):298‐304. [DOI] [PubMed] [Google Scholar]
- Cheatham CL, Nerhammer AS, Asserhoj M, Michaelsen KF, Lauritzen L. Fish oil supplementation during lactation: effects on cognition and behavior at 7 years of age. Lipids 2011;46(7):637‐45. [DOI] [PubMed] [Google Scholar]
- Cheatham CL, Nerhammer S, Asserhoj M, Michaelsen KF, Lauritzen L. Fish oil supplementation during lactation: effects on cognition and behavior at 7 years of age. FASEB Journal 2011;25(Suppl):766.9. [DOI] [PubMed] [Google Scholar]
- Larnkjaer A, Christensen JH, Michaelsen KF, Lauritzen L. Maternal fish oil supplementation during lactation does not affect blood pressure, pulse wave velocity, or heart rate variability in 2.5‐y‐old children. Journal of Nutrition 2006;136(6):1539‐44. [DOI] [PubMed] [Google Scholar]
- Lauritzen L, Halkjaer LB, Mikkelsen TB, Olsen SF, Michaelsen KF, Loland L, et al. Fatty acid composition of human milk in atopic Danish mothers. American Journal of Clinical Nutrition 2006;84(1):190‐6. [DOI] [PubMed] [Google Scholar]
- Lauritzen L, Hoppe C, Straarup EM, Michaelsen KF. Maternal fish oil supplementation in lactation and growth during the first 2.5 years of life. Pediatric Research 2005;58(2):235‐42. [DOI] [PubMed] [Google Scholar]
- Lauritzen L, Jorgensen MH, Mikkelsen TB, Skovgaard M, Straarup EM, Olsen SF, et al. Maternal fish oil supplementation in lactation: effect on visual acuity and n‐3 fatty acid content of infant erythrocytes. Lipids 2004;39(3):195‐206. [DOI] [PubMed] [Google Scholar]
- Lauritzen L, Jorgensen MH, Olsen SF, Straarup EM, Michaelsen KF. Maternal fish oil supplementation in lactation:effect on developmental outcome in breast‐fed infants. Reproduction, Nutrition, Development 2005;45(5):535‐47. [DOI] [PubMed] [Google Scholar]
- Lauritzen L, Kjaer TM, Fruekilde MB, Michaelsen KF, Frokiaer H. Fish oil supplementation of lactating mothers affects cytokine production in 2 1/2‐year‐old children. Lipids 2005;40(7):669‐76. [DOI] [PubMed] [Google Scholar]
- Ulbak J, Lauritzen L, Hansen HS, Michaelsen KF. Diet and blood pressure in 2.5‐y‐old Danish children. American Journal of Clinical Nutrition 2004;79(6):1095‐102. [DOI] [PubMed] [Google Scholar]
Marangell 2004 {published data only}
- Marangell LB, Martinez JM, Zboyan HA, Chong H, Puryear LJ. Omega‐3 fatty acids for the prevention of postpartum depression: negative data from a preliminary, open‐label pilot study. Depression and Anxiety 2004;19:20‐3. [DOI] [PubMed] [Google Scholar]
Morrison 1984 {published data only}
- Morrison RA, O'Brien PMS, Micklewright A. The effect of dietary supplementation with linoleic acid on the development of pregnancy induced hypertension. 4th World Congress of the International Society for the Study of Hypertension in Pregnancy; 1984 June 18‐21; Amsterdam (The Netherlands). 1984:48.
Morrison 1986 {published data only}
- Morrison RA, O'Brien PMS. The effect of dietary supplementation with prostaglandin precursors in pregnancy induced hypertension (PIH). 5th International Congress of the International Society for the Study of Hypertension in Pregnancy; 1986 July 7‐10; Nottingham (UK). 1986.
Nishi 2016 {published data only}
- Nishi D, Su KP, Usada, K, Chiang YJ, Guu TW, Haamazaki K, et al. Omega‐3 fatty acid supplementation for expectant mothers with depressive symptoms in Japan and Taiwan: An open‐label trial. Psychiatry and Clinical Neurosciences 2016;70:253‐5. [DOI] [PubMed] [Google Scholar]
Starling 1990 {published data only}
- Starling M, Gunn T, Stewart F. The control of gestational proteinuric hypertension (GPH) with dietary marine lipids. Australian and New Zealand Journal of Medicine 1990;20:357. [Google Scholar]
Valentine 2013 {published data only}
- Valentine CJ, Morrow G, Pennell M, Morrow AL, Hodge A, Haban‐Bartz A, et al. Randomized controlled trial of docosahexaenoic acid supplementation in midwestern U.S. human milk donors. Breastfeeding Medicine 2013;8(1):86‐91. [DOI: 10.1089/bfm.2011.0126] [DOI] [PMC free article] [PubMed] [Google Scholar]
Velzing‐Aarts 2001 {published data only}
- Velzing‐Aarts FV, Klis FR, Dijs FP, Beusekom CM, Landman H, Capello JJ, et al. Effect of three low‐dose fish oil supplements, administered during pregnancy, on neonatal long‐chain polyunsaturated fatty acid status at birth. Prostaglandins, Leukotrienes, and Essential Fatty Acids 2001;65(1):51‐7. [PUBMED: 11487309] [DOI] [PubMed] [Google Scholar]
Yelland 2016 {published data only}
- Yelland LN, Gajewski BJ, Colombo J, Gibson RA, Makrides M, Carlson SE. Predicting the effect of maternal docosahexaenoic acid (DHA) supplementation to reduce early preterm birth in Australia and the United States using results of within country randomized controlled trials. Prostaglandins, Leukotrienes, and Essential Fatty Acids 2016;112:44‐9. [DOI] [PMC free article] [PubMed] [Google Scholar]
References to studies awaiting assessment
Farahani 2010 {published data only}
- Farahani MD. A clinical trial on effect of omega‐3 fatty acids on pregnancy outcome. en.search.irct.ir/view/2314 (first received 3 June 2010). [IRCT138811173291N1]
Gopalan 2004 {published data only}
- Gopalan S, Patnaik R, Ganesh K. Feasible strategies to combat low birth weight and intra‐uterine growth retardation. Journal of Pediatric Gastroenterology and Nutrition 2004;39(Suppl 1):S37. [Google Scholar]
Jamilian 2018 {published data only}
- Jamilian M, Samimi M, Mirhosseini N, Afshar Ebrahimi F, Aghadavod E, Taghizadeh M, et al. A randomized double‐blinded, placebo‐controlled trial investigating the effect of fish oil supplementation on gene expression related to insulin action, blood lipids, and inflammation in gestational diabetes mellitus‐fish oil supplementation and gestational diabetes. Nutrients 2018;10(2):E163. [DOI] [PMC free article] [PubMed] [Google Scholar]
Kadiwala 2015 {published data only}
- Kadiwala SM, Ramirez V, Miller E, Matula K, Sifford S, Hakala K, et al. Impact of maternal docosahexaenoic acid supplementation on toddler growth and body composition. Journal of Investigative Medicine 2015;63(2):474. [Google Scholar]
Laitinen 2013 {published data only}
- Laitinen K. Nutrition and pregnancy intervention study. clinicaltrials.gov/ct2/show/NCT01922791 (first received 12 August 2013). [NCT01922791]
- Mokkala K, Pussinen P, Houttu N, Koivuniemi E, Vahlberg T, Laitinen K. The impact of probiotics and n‐3 long‐chain polyunsaturated fatty acids on intestinal permeability in pregnancy: a randomised clinical trial. Beneficial Microbes 2018;9(2):199‐208. [DOI] [PubMed] [Google Scholar]
Lazzarin 2009 {published data only}
- Lazzarin N, Vaquero E, Exacoustos C, Bertonotti E, Romanini ME, Arduini D. Low‐dose aspirin and omega‐3 fatty acids improve uterine artery blood flow velocity in women with recurrent miscarriage due to impaired uterine perfusion. Fertility and Sterility 2009;92(1):296‐300. [DOI] [PubMed] [Google Scholar]
Parisi 2013 {published data only}
- Parisi F, Brunetti M, Berti C, Capriata IV, Mazzococo MI, Cetin M. Effects of DHS supplementation during pregnancy on fetal body composition. Reproductive Sciences 2013;20(3 Suppl):244A. [Google Scholar]
Pavlovich 1999 {published data only}
- Pavlovich SV, Burlev VA, Vikhliaeva EM. The effect of n‐3 polyunsaturated fatty acids on the lipid spectrum indices in the 2nd‐3rd pregnancy trimesters [Vliianie n‐3 polinenasyshchennykh zhirnykh kislot na pokazateli lipidnogo spektra vo II‐III trimestrakh beremennosti.]. Eksperimentalnaia i Klinicheskaia Farmakologiia 1999;62(6):35‐8. [PubMed] [Google Scholar]
Sajina‐Stritar 1994 {published data only}
- Sajina‐Stritar B. Prevention of gestational hypertension and its complications with ASA and N‐3 fatty acids (comparative study). 14th European Congress of Perinatal Medicine; 1994; Helsinki (Finland). 1994:182.
Sajina‐Stritar 1998 {published data only}
- Sajina‐Stritar B. The effect of acetylsaliclic acid and N‐3 fatty acids in prevention of complications of hypertension diseases in pregnancy. Zdravstveni Vestnik 1998;67:489‐93. [Google Scholar]
Salvig 2009 {published data only}
- Salvig J, Hjort J, Moeller M, Holmskov A, Weber T, Olsen S, et al. Randomised clinical trial of fish oil for prevention of preterm birth in high risk women. International Journal of Gynecology & Obstetrics 2009;107(Suppl 2):S529. [Google Scholar]
Salzano 2001 {published data only}
- Salzano P, Felicetti M, Laboccetta A, Borrelli P, Domenico A, Borrelli A. Prevention of gestational hypertension with calcium, linoleic acid, mono and polyunsaturated fatty acid supplements. Minerva Ginecologica 2001;53(4):235‐8. [PubMed] [Google Scholar]
Stoutjesdijk 2014 {published data only}
- Stoutjesdijk E. Fish oil supplemental dose needed to reach 1 g% DHA+EPA in mature milk (ZOOG MUM). trialregister.nl/trialreg/admin/rctview.asp?TC=4959 (first received 19 November 2014). [NTR4959]
- Stoutjesdijk E, Schaafsmab A, Dijck‐Brouwera DA, Muskiet FA. Fish oil supplemental dose needed to reach 1 g% DHA+EPA in mature milk. Prostaglandins, Leukotrienes and Essential Fatty Acids 2018;128:53‐61. [DOI] [PubMed] [Google Scholar]
Vahedi 2018 {published data only}
- Vahedi L, Ostadrahimi A, Edalati‐Fard F, Aslani H, Farshbaf‐Khalili A. Is fish oil supplementation effective on maternal serum FBS, oral glucose tolerance test, hemoglobin and hematocrit in low risk pregnant women? A triple‐blind randomized controlled trial. Journal of Complementary & Integrative Medicine 2018 [Epub ahead of print]. [DOI] [PubMed]
Vakilian 2010 {published data only}
- Davod‐Abadi M, Vakilian M, Ranjbar A, Seyed‐Zadeh T. The effect of fish oil in oxidative stress indices in healthy pregnant women. Journal of Shahrekord University of Medical Sciences 2010;11(4 Suppl 1):11. [Google Scholar]
- Vakilian K. The effect of fish oil in oxidative stress indices in healthy pregnant women. en.search.irct.ir/view/2974 (first received 29 May 2010). [IRCT138902091557N3]
Valentine 2014 {published data only}
- Valentine CJ, NCT02137408. Docosahexaenoic acid supplementation of women with hypertension in pregnancy to improve endothelial health and reduce the risks of preterm delivery. clinicaltrials.gov/show/NCT02137408 (first received 2014). [NCT02137408]
Valenzuela 2017 {published data only}
- Valenzuela Baez RW, Barrera C, Bascunan K, Chamorro R, Valenzuela A. Modification of docosahexaenoic acid composition of milk from women who received DHA from a milk formula during the pregnancy and breastfeeding period. Annals of Nutrition and Metabolism 2017;71(Suppl 2):506, Abstract no: 144‐766. [Google Scholar]
References to ongoing studies
Albert 2017 {published data only}
- Albert B. Omega‐3 supplementation during pregnancy to improve metabolic health in children of obese mothers. anzctr.org.au/Trial/Registration/TrialReview.aspx?id=373332 (first received 20 July 2017).
Carlson 2017 ADORE {published data only}
- Carlson SE, Gajewski BJ, Valentine CJ, Rogers LK, Weiner CP, DeFranco EA, et al. Assessment of DHA on reducing early preterm birth: the ADORE randomized controlled trial protocol. BMC Pregnancy and Childbirth 2017;17:62. [DOI: 10.1186/s12884-017-1244-5] [DOI] [PMC free article] [PubMed] [Google Scholar]
Carvajal 2014 {published data only}
- Carvajal J. Docosahexaenoic acid (DHA) supplementation during pregnancy to prevent deep placentation disorders: a randomized clinical trial and a study of the molecular pathways of abnormal placentation prevention. clinicaltrials.gov/show/NCT02336243 (first received 12 January 2015). [NCT02336243]
de Carvalho 2017 {published data only}
- Carvalho Sardinha FL. Impact of fish oil or probiotic intake on maternal obesity and molecular biomarkers in the placenta. clinicaltrials.gov/ct2/show/record/NCT03215784 (first received 12 July 2017). [NCT03215784]
Dos Santos 2018 {published data only}
- Dos Santos LC. Omega‐3 supplementation during pregnancy to prevent postpartum depressive symptoms and possible effect on breastfeeding, child growth and development. ensaiosclinicos.gov.br/rg/RBR‐6gbzw6/ (first received 16 June 2018).
Dragan 2013 {published data only}
- Dragan S, ISRCTN36705743. The impact of EPA and DHA supplementation on the content of lipids in the pregnant women and the fetus. isrctn.com/ISRCTN36705743 (first received 25 October 2016). [ISRCTN36705743]
FOPCHIN {unpublished data only}
- NCT02770456. Fish oil supplementation to prevent preterm delivery in China: a randomized controlled trial. clinicaltrials.gov/ct2/show/NCT02770456 (first received 11 May 2016). [NCT02770456]
Garg 2017 {published data only}
- Garg M, ACTRN12617000177358. Omega‐3 fish oil for the prevention of gestational diabetes: a double‐blind, randomized controlled proof of concept study. anzctr.org.au/Trial/Registration/TrialReview.aspx?id=371580 (first received 30 January 2017).
Garmendia 2015 {published data only}
- Garmendia M, NCT02574767. Diet and physical activity counselling and n3‐long chain (PUFA) supplementation in obese pregnant women (MIGHT). clinicaltrials.gov/ct2/show/NCT02574767 (first received 7 October 2015). [NCT02574767]
- Garmendia ML, Corvalan C, Casanello P, Araya M, Flores M, Bravo A, et al. Effectiveness on maternal and offspring metabolic control of a home‐based dietary counseling intervention and DHA supplementation in obese/overweight pregnant women (might study): a randomized controlled trial‐study protocol. Contemporary Clinical Trials 2018;70:35‐40. [DOI] [PubMed] [Google Scholar]
Ghebremeskel 2014 {published data only}
- Ghebremeskel K, ISRCTN03848493. DHA for PREGnant women: is the current recommendation appropriate for women with very low intake and status?. isrctn.com/ISRCTN03848493 (first received 16 May 2014). [ISRCTN03848493]
Hegarty 2012 {published data only}
- Hegarty B, ACTRN12612000405819. Long‐chain omega‐3 fatty acids for mood stabilization during pregnancy in women with bipolar disorder ‐ a randomized controlled trial. anzctr.org.au/Trial/Registration/TrialReview.aspx?ACTRN=12612000405819 (first received 2012). [ACTRN12612000405819]
Hendler 2017 {published data only}
- Hendler I. The effect of alpha linolenic acid (ALA) supplementation on essential fatty acids profile during pregnancy compared to common supplements and the epigenetic effect on the newborn. clinicaltrials.gov/show/NCT03040856 (first received 2017). [NCT03040856]
Khandelwal 2012 {published data only}
- Khandelwal S. Effect of docosa‐hexaenoic acid (DHA) supplementation during pregnancy on newborn outcomes in India ‐ the DHANI randomized controlled trial. clinicaltrials.gov/ct2/show/NCT01580345 (first received 19 February 2012). [NCT01580345]
- Khandelwal S, Swamy MK, Patil K, Kondal D, Chaudhry M, Gupta R, et al. The impact of docosahexaenoic acid supplementation during pregnancy and lactation on neurodevelopment of the offspring in India (DHANI): trial protocol. BMC Pediatrics 2018;18(1):261. [DOI] [PMC free article] [PubMed] [Google Scholar]
Kodkhany 2017 {published data only}
- Kodkhany B, NCT03072277. Maternal docosa‐hexaenoic acid (DHA) supplementation and offspring neurodevelopment in India (DHANI‐2). clinicaltrials.gov/show/NCT03072277 (first received 7 March 2017). [NCT03072277]
Li 2013 {published data only}
- Li D, NCT01912170. Effect of omega‐3 fatty acids on insulin sensitivity in Chinese gestational diabetic patients. clinicaltrials.gov/ct2/show/NCT01912170 (first received 27 July 2013). [NCT01912170]
Makrides 2013 (ORIP) {published data only}
- Makrides M, ACTRN12613001142729. Omega‐3 fats to reduce the incidence of prematurity in healthy women with a singleton or multiple pregnancy less than 20 weeks gestation. anzctr.org.au/ACTRN12613001142729.aspx (first received 27 September 2009). [ACTRN12613001142729]
- Zhou J, Best K, Gibson R, McPhee A, Yelland L, Quinlivan J, et al. Study protocol for a randomised controlled trial evaluating the effect of prenatal omega‐3 LCPUFA supplementation to reduce the incidence of preterm birth: the ORIP trial. BMJ Open 2017;7(9):e018360. [doi: 10.1136/bmjopen‐2017‐018360] [DOI] [PMC free article] [PubMed] [Google Scholar]
Martini 2014 (CORDHA) {published data only}
- ISRCTN58396079. A randomised controlled trial for the optimization of the viability of stem cells derived from umbilical cord blood after maternal supplementation with DHA during the second or third trimester of pregnancy. isrctn.com/ISRCTN58396079 (first received 8 October 2013). [ISRCTN58396079] [DOI] [PMC free article] [PubMed]
- Martini I, Domenico EG, Scala R, Caruso F, Ferreri C, Ubaldi FM, et al. Optimization of the viability of stem cells derived from umbilical cord blood after maternal supplementation with DHA during the second or third trimester of pregnancy: study protocol for a randomized controlled trial. Trials 2014;15:164. [ISRCTN58396079] [DOI] [PMC free article] [PubMed] [Google Scholar]
Mbayiwa 2016 {published data only}
- Mbayiwa K, NCT02647723. Improving maternal and child health through prenatal fatty acid supplementation: a randomized controlled study in African American women living in low‐income urban environments. clinicaltrials.gov/show/NCT02647723 (first received 6 January 2016). [NCT02647723]
Murff 2017 (FORTUNE) {published data only}
- Murff HJ. Fish oil to reduce tobacco use in expectant mothers study. clinicaltrials.gov/ct2/show/record/NCT03077724 (first received 13 March 2017). [NCT03077724]
Nishi 2015 (SYNCHRO) {unpublished data only}
- Nishi D, NCT02166424. The synchronized trial on expectant mothers with depressive symptoms by omega‐3 PUFAs (SYNCHRO). clinicaltrials.gov/show/NCT02166424 (first received 15 June 2014). [NCT02166424]
- Nishi D, Su KP, Usuda K, Chiang YJ, Guu TW, Hamazaki K, et al. The synchronized trial on expectant mothers with depressive symptoms by omega‐3 PUFAs (SYNCHRO): study protocol for a randomized controlled trial. BMC Psychiatry 2016;16(1):321. [DOI] [PMC free article] [PubMed] [Google Scholar]
Wang 2018 {published data only}
- Wang WJ, NCT03569501. Influence of DHA/oat on maternal and neonatal metabolic health in gestational diabetes mellitus. clinicaltrials.gov/ct2/show/NCT03569501 (first received 26 June 2018).
Zielinsky 2015 {published data only}
- Zielinsky P, NCT02565290. Effect of mother's supplementation omega‐3 in the dynamics of fetal ductus arteriosus: a randomized clinical trial. clinicaltrials.gov/ct2/show/NCT02565290 (first received 30 September 2015). [NCT02565290]
Zimmermann 2018 {published data only}
- Zimmermann JB, RBR‐5kbzdh. Dietary supplementation of omega 3 and the participation in the placentary vascular resistance mechanism in pregnant people: a comparison with normal pregnant women without use of omega, chronic hypertensions in use of AAS and pregnants with thrombophilia and use heparina or AAS. ensaiosclinicos.gov.br/rg/RBR‐5kbzdh/ (first received 13 June 2018).
Additional references
Borge 2017
- Borge TC, Aase H, Brantsaeter AL, Biele G. The importance of maternal diet quality during pregnancy on cognitive and behavioural outcomes in children: a systematic review and meta‐analysis. BMJ Open 2017;7:e016777. [DOI: 10.1136/bmjopen-2017-016777] [DOI] [PMC free article] [PubMed] [Google Scholar]
Brantsaeter 2017
- Brantsaeter AL, Englund‐Ogge L, Haugen M, Birgisdottir BE, Knutsen HK, Sengpiel V, et al. Maternal intake of seafood and supplementary long chain n‐3 poly‐unsaturated fatty acids and preterm delivery. BMC Pregnancy and Childbirth 2017;17:41. [DOI: 10.1186/s12884-017-1225-8] [DOI] [PMC free article] [PubMed] [Google Scholar]
Campoy 2012
- Campoy C, Escolano‐Margarit MV, Anjos T, Szajewska H, Uauy R. Omega 3 fatty acids on child growth, visual acuity and neurodevelopment. British Journal of Nutrition 2012;107:(Suppl 2):S85‐106. [DOI: 10.1017/S0007114512001493] [DOI] [PubMed] [Google Scholar]
Chen 2015
- Chen B, Ji X, Zhang L, Hou Z, Li C, Tong Y. Fish oil supplementation does not reduce risks of gestational diabetes mellitus, pregnancy‐induced hypertension, or pre‐eclampsia: a meta‐analysis of randomized controlled trials. Medical Science Monitor 2015;21:2322‐30. [DOI: 10.12659/MSM.894033] [DOI] [PMC free article] [PubMed] [Google Scholar]
Chen 2016
- Chen B, Ji X, Zhang L, Hou Z, Li C, Tong Y. Fish oil supplementation improves pregnancy outcomes and size of the newborn: a meta‐analysis of 21 randomized controlled trials. Journal of Maternal Fetal Neonatal Medicine 2016;29(12):2017‐27. [DOI: 10.3109/14767058.2015.1072163] [DOI] [PubMed] [Google Scholar]
Conroy 2012
- Conroy S, Pariante CM, Marks MN, Davies HA, Farrelly S, Schacht R, et al. Maternal psychopathology and infant development at 18 months: the impact of maternal personality disorder and depression. Journal of the American Academy of Child Adolescent Psychiatry 2012;51(1):51‐61. [DOI] [PubMed] [Google Scholar]
Dennis 2012
- Dennis CL, Heaman M, Vigod S. Epidemiology of postpartum depressive symptoms among Canadian women: regional and national results from a cross‐sectional survey. Canadian Journal of Psychiatry 2012;57(9):537‐46. [DOI] [PubMed] [Google Scholar]
Gaynes 2005
- Gavin NI, Gaynes BN, Lohr KN, Meltzer‐Brody S, Gartlehner G, Swinson T. Perinatal depression: a systematic review of prevalence and incidence. Obstetrics and Gynecology 2005;106(5 Pt 1):1071‐83. [DOI] [PubMed] [Google Scholar]
Golding 2009
- Golding J, Steer C, Emmett P, Davis JM, Hibbeln JR. High levels of depressive symptoms in pregnancy with low omega‐3 fatty acid intake from fish. Epidemiology 2009;20(4):598‐603. [DOI: 10.1097/EDE.0b013e31819d6a57] [DOI] [PubMed] [Google Scholar]
Gould 2013
- Gould JF, Smithers LG, Makrides M. The effect of maternal omega‐3 (n‐3) LCPUFA supplementation during pregnancy on early childhood cognitive and visual development: a systematic review and meta‐analysis of randomized controlled trials. American Journal of Nutrition 2013;97(3):531‐44. [DOI: 10.3945/ajcn.112.045781] [DOI] [PubMed] [Google Scholar]
Greenberg 2008
- Greenberg JA, Bell SJ, Ausdal W. Omega‐3 fatty acid supplementation during pregnancy. Reviews in Obstetrics and Gynecology 2008;1(4):162‐9. [PMC free article] [PubMed] [Google Scholar]
Gunaratne 2015
- Gunaratne AW, Makrides M, Collins CT. Maternal prenatal and/or postnatal n‐3 long chain polyunsaturated fatty acids (LCPUFA) supplementation for preventing allergies in early childhood. Cochrane Database of Systematic Reviews 2015, Issue 7. [DOI: 10.1002/14651858.CD010085.pub2] [DOI] [PMC free article] [PubMed] [Google Scholar]
Hibbeln 2007
- Hibbeln JR, Davis JM, Steer C, Emmett P, Rogers I, Williams C, et al. Maternal seafood consumption in pregnancy and neurodevelopmental outcomes in childhood (ALSPAC study): an observational cohort study. Lancet 2007;369:578‐85. [DOI] [PubMed] [Google Scholar]
Higgins 2011
- Higgins JP, Green S, editor(s). Cochrane Handbook for Systematic Reviews of Interventions Version 5.1.0 (updated March 2011). The Cochrane Collaboration, 2011. Available from handbook.cochrane.org.
Imhoff‐Kunsch 2012
- Imhoff‐Kunsch B, Briggs V, Goldenberg T, Ramakrishnan U. Effect of n‐3 long‐chain polyunsaturated fatty acid intake during pregnancy on maternal, infant, and child health outcomes: a systematic review. Paediatric and Perinatal Epidemiology 2012;26(Suppl 1):91‐107. [doi: 10.1111/j.1365‐3016.2012.01292.x] [DOI] [PubMed] [Google Scholar]
Jensen 2006
- Jensen CL. Effects of n‐3 fatty acids during pregnancy and lactation. American Journal of Clinical Nutrition 2006;83:1452S‐7S. [DOI] [PubMed] [Google Scholar]
Kar 2016
- Kar S, Wong M, Rogozinska E, Thangaratinam S. Effects of omega‐3 fatty acids in prevention of early preterm delivery: a systematic review and meta‐analysis of randomized studies. European Journal of Obstetrics, Gynecology and Reproductive Biology 2016;198:40‐6. [DOI: 10.1016/j.ejogrb.2015.11.033] [DOI] [PubMed] [Google Scholar]
Koletzko 2007
- Koletzko B, Cetin I, Brenna JT, the Perinatal Lipid Intake Working Group. Consensus statement: dietary fat intakes for pregnant and lactating women. British Journal of Nutrition 2007;98:873‐7. [DOI] [PubMed] [Google Scholar]
Leghi 2016
- Leghi GE, Muhlhausler BS. The effect of n‐3 LCPUFA supplementation on oxidative stress and inflammation in the placenta and maternal plasma during pregnancy. Prostaglandins, Leukotrienes and Essential Fatty Acids 2016;113:33‐9. [DOI] [PubMed] [Google Scholar]
Leventakou 2014
- Leventakou V, Roumeliotaki T, Martinez D, Barros H, Brantsaeter AL, Casas M, et al. Fish intake during pregnancy, fetal growth, and gestational length in 19 European birth cohort studies. American Journal of Clinical Nutrition 2014;99(3):506‐16. [DOI: 10.3945/ajcn.113.067421] [DOI] [PubMed] [Google Scholar]
Li 2017
- Li GL, Chen HJ, Zhang WX, Tong Q, Yan YE. Effects of maternal omega‐3 fatty acids supplementation during pregnancy/lactation on body composition of the offspring: a systematic review and meta‐analysis. Clinical Nutrition 2017:S0261‐5614(17)30269‐8. [DOI: 10.1016/j.clnu.2017.08.002] [DOI] [PubMed] [Google Scholar]
Liu 2016
- Liu L, Oza S, Hogan D, Chu Y, Perin J, Zhu J, et al. Global, regional, and national causes of under‐5 mortality in 2000‐15: an updated systematic analysis with implications for the Sustainable Development Goals. Lancet 2016;388(10063):3027‐35. [DOI: 10.1016/S0140-6736(16)31593-8] [DOI] [PMC free article] [PubMed] [Google Scholar]
Meyer 2016
- Meyer BJ. Australians are not meeting the recommended intakes for omega‐3 long chain polyunsaturated fatty acids: results of an analysis from the 2011–2012 National Nutrition and Physical Activity Survey. Nutrients 2016;8(3):111. [DOI: 10.3390/nu8030111] [DOI] [PMC free article] [PubMed] [Google Scholar]
Mol 2016
- Mol BW, Roberts CT, Thangaratinam S, Magee LA, Groot CJ, Hofmeyr GJ. Pre‐eclampsia. Lancet 2016;387(10022):999‐1011. [DOI: 10.1016/S0140-6736(15)00070-7] [DOI] [PubMed] [Google Scholar]
Newberry 2016
- Newberry SJ, Chung M, Booth M, Maglione M, Tang AM, O'Hanlon CE, et al. Omega‐3 fatty acids and maternal and child health: an updated systematic review. AHRQ Publication No. 16‐E003‐EF. Vol. Evidence Report/Technology Assessment No. 224, Rockville (MD): Agency for Healthcare Research and Quality, 2016. [DOI: ] [DOI] [PubMed] [Google Scholar]
Nordgren 2017
- Nordgren TM, Lyden E, Anderson‐Berry A, Hanson C. Omega‐3 fatty acid intake of pregnant women and women of childbearing age in the United States: potential for deficiency?. Nutrients 2017;9(3):e197. [DOI: 10.3390/nu9030197] [DOI] [PMC free article] [PubMed] [Google Scholar]
Oken 2018
- Oken E. Fish consumption and docosahexaenoic acid (DHA) supplementation in pregnancy. UpToDate (www.uptodate.com) 2018.
Olsen 1985
- Olsen SF, Joensen HD. High liveborn birth weights in the Faroes: a comparison between birth weights in the Faroes and in Denmark. Journal of Epidemiology and Community Health 1985;39(1):27‐32. [DOI] [PMC free article] [PubMed] [Google Scholar]
Olsen 1986
- Olsen SF, Hansen HS, Sørensen TI, Jensen B, Secher NJ, Sommer S, et al. Intake of marine fat, rich in (n‐3)‐polyunsaturated fatty acids, may increase birthweight by prolonging gestation. Lancet 1986;2(8503):367‐9. [DOI] [PubMed] [Google Scholar]
Olsen 1991
- Olsen SF, Hansen HS, Sommer S, Jensen B, Sørensen TI, Secher NJ, et al. Gestational age in relation to marine n‐3 fatty acids in maternal erythrocytes: a study of women in the Faroe Islands and Denmark. American Journal of Obstetrics and Gynecology 1991;164(5 Pt 1):1203‐9. [DOI] [PubMed] [Google Scholar]
Olsen 2002
- Olsen SF, Secher NJ. Low consumption of seafood in early pregnancy as a risk factor for preterm delivery: prospective cohort study. BMJ 2002;324(7355):447. [DOI] [PMC free article] [PubMed] [Google Scholar]
Olsen 2006
- Olsen SF, Østerdal ML, Salvig JD, Kesmodel U, Henriksen TB, Hedegaard M, et al. Duration of pregnancy in relation to seafood intake during early and mid pregnancy: prospective cohort. European Journal of Epidemiology 2006;21(10):749‐58. [DOI] [PubMed] [Google Scholar]
Palmer 2012
- Palmer DJ, Sullivan T, Gold MS, Prescott SL, Heddle R, Gibson RA, et al. Effect of n‐3 long chain polyunsaturated fatty acid supplementation in pregnancy on infants' allergies in first year of life: randomised controlled trial. BMJ 2012;344:e184. [CRSREF: 3195150] [DOI] [PMC free article] [PubMed] [Google Scholar]
Rangel‐Huerta 2018
- Rangel‐Huerta OD, Gil A. Effect of omega‐3 fatty acids on cognition: an updated systematic review of randomized clinical trials. Nutrition Reviews 2018;76(1):1‐20. [DOI: 10.1093it/nux] [DOI] [PubMed] [Google Scholar]
Review Manager 2014 [Computer program]
- The Nordic Cochrane Centre, The Cochrane Collaboration. Review Manager (RevMan). Version 5.3. Copenhagen: The Nordic Cochrane Centre, The Cochrane Collaboration, 2014.
Saccone 2015a
- Saccone G, Berghella V, Maruotti GM, Sarno L, Martinelli P. Omega‐3 supplementation during pregnancy to prevent recurrent intrauterine growth restriction: systematic review and meta‐analysis of randomized controlled trials. Ultrasound Obstetrics and Gynecology 2015;46(6):659‐64. [DOI: 10.1002/uog.14910] [DOI] [PubMed] [Google Scholar]
Saccone 2015b
- Saccone G, Berghella V. Omega‐3 supplementation to prevent recurrent preterm birth: a systematic review and metaanalysis of randomized controlled trials. American Journal of Obstetrics and Gynecology 2015;213(2):135‐40. [DOI] [PubMed] [Google Scholar]
Saccone 2015c
- Saccone G, Berghella V. Omega‐3 long chain polyunsaturated fatty acids to prevent preterm birth: a systematic review and meta‐analysis. Obstetrics and Gynecology 2015;125(3):663‐72. [DOI: 10.1097/AOG.0000000000000668] [DOI] [PubMed] [Google Scholar]
Saccone 2016
- Saccone G, Saccone I, Berghella V. Omega‐3 long‐chain polyunsaturated fatty acids and fish oil supplementation during pregnancy: which evidence?. Journal of Maternal Fetal Neonatal Medicine 2016;29(15):2389‐97. [DOI: 10.3109/14767058.2015.1086742] [DOI] [PubMed] [Google Scholar]
Saigal 2008
- Saigal S, Doyle LW. An overview of mortality and sequelae of preterm birth from infancy to adulthood. Lancet 2008;371(9608):261‐9. [DOI] [PubMed] [Google Scholar]
Shulkin 2018
- Shulkin M, Pimpin L, Bellinger D, Kranz S, Fawzi W, Duggan C, et al. n‐3 fatty acid supplementation in mothers, preterm Infants, and term Infants and childhood psychomotor and visual development: a systematic review and meta‐analysis. Journal of Nutrition 2018;148(3):409‐18. [DOI: 10.1093/jn/nxx031] [DOI] [PMC free article] [PubMed] [Google Scholar]
Stillbirth CRE 2018
- Stillbirth CR. Position statement: detection and management of fetal growth restriction in singleton pregnancies. Stillbirth CR 2018.
Thornton 2008
- Thornton S. Preterm Birth: Causes, Consequences and Prevention; The Obstetrician & Gynaecologist. Wiley, 2008. [DOI: 10.1576/toag.10.4.280b.27453] [DOI] [Google Scholar]
Vaz Jdos 2013
- Vaz Jdos S, Kac G, Emmett P, Davis JM, Golding J, Hibbeln JR. Dietary patterns, n‐3 fatty acids intake from seafood and high levels of anxiety symptoms during pregnancy: findings from the Avon Longitudinal Study of Parents and Children. PLOS One 2013;8(7):e67671. [doi: 10.1371/journal.pone.0067671] [DOI] [PMC free article] [PubMed] [Google Scholar]
Westrupp 2014
- Westrupp EM, Lucas N, Mensah FK, Gold L, Wake M, Nicholson JM. Community‐based healthcare costs for children born low birthweight, preterm and/or small for gestational age: data from the Longitudinal Study of Australian Children. Child Care Health Development 2014;40(2):259‐66. [DOI: 10.1111/cch.12040] [DOI] [PubMed] [Google Scholar]
World Health Organization 2017
- World Health Organization. WHO fact sheet: Preterm birth. www.who.int/mediacentre/factsheets/fs363/en/ (accessed 15 April 2018).
Zhou 2017
- Zhou SJ, Best K, Gibson R, McPhee A, Yelland L, Quinlivan J, et al. Study protocol for a randomised controlled trial evaluating the effect of prenatal omega‐3 LCPUFA supplementation to reduce the incidence of preterm birth: the ORIP trial. BMJ Open 2017;7:e018360. [doi: 10.1136/bmjopen‐2017‐018360] [DOI] [PMC free article] [PubMed] [Google Scholar]
Zhu 2014
- Zhu P, Sun MS, Hao JH, Chen YJ, Jiang XM, Tao RX, et al. Does prenatal maternal stress impair cognitive development and alter temperament characteristics in toddlers with healthy birth outcomes?. Developmental Medicine & Child Neurology 2014;56(3):283‐9. [DOI] [PubMed] [Google Scholar]
References to other published versions of this review
Duley 1995
- Duley L. Prophylactic fish oil in pregnancy. [revised 21 April 1994] In: Enkin MW, Keirse MJ, Renfrew MJ, Neilson JP, Crowther CA, editor(s) Pregnancy and Childbirth Module. The Cochrane Pregnancy and Childbirth Database [database on disk and CDROM]. The Cochrane Collaboration, Issue 2, 1995. Oxford: Update Software.
Makrides 2006
- Makrides M, Duley L, Olsen SF. Marine oil, and other prostaglandin precursor, supplementation for pregnancy uncomplicated by pre‐eclampsia or intrauterine growth restriction. Cochrane Database of Systematic Reviews 2006, Issue 3. [DOI: 10.1002/14651858.CD003402.pub2] [DOI] [PubMed] [Google Scholar]