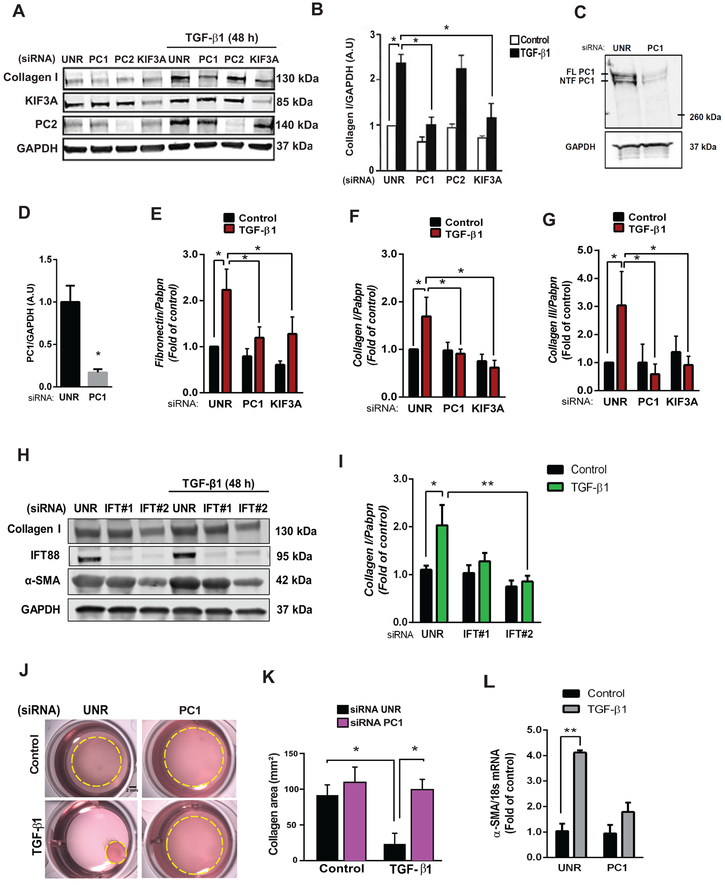
Figure 4. Cilia and PC1 are required for TGF-β1-induced cardiac fibrosis.
(A and B) Cultures of NRCF were prepared, and depletion of PC1, PC2 and KIF3A was accomplished using specific siRNAs versus control (unrelated siRNA, UNR). Cells were then treated with 10 ng/mL TGF-β1 for 48 h and total protein extracts or RNA were isolated. (A) Collagen type I, KIF3A, and PC2 were evaluated by Western blotting. GAPDH was used as loading control. Gels representative of three independent experiments are depicted. Gels shown in (A) were quantified (B). Data are represented as mean ± S.E.M. Two-way ANOVA, followed by Tukey’s post-hoc test. *p < 0.05, n=3 independent cell cultures. (C and D) Knockdown of PC1 in ARCF. (C) PC1 protein levels after knockdown with siRNA (36 h) were evaluated by Western blotting: FL: full length PC1; NTF: N-terminal PC1. (D) Average densitometry from 3 independent cultures. Data are shown as mean ± S.E.M. Unpaired Student’s t-test, *p < 0.05 vs UNR. (E-G) Transcript levels of (E) fibronectin, (F) collagen I and (G) collagen III were analyzed by quantitative RT-PCR, and Pabpn was used as housekeeping gene. Results are normalized to 1, and data are depicted as mean ± S.E.M. Two-way ANOVA followed by Tukey’s post-hoc test. *p < 0.05 (n=5–7). (H and I) Cultures of ARCF were prepared, and depletion of IFT88 with two sequence-independent siRNAs was performed. Cells were then treated with 10 ng/mL TGF-β1 for 48 h and total protein extracts were isolated. (H) Collagen type I, α-SMA and IFT88 levels were evaluated by Western blotting. (I) GAPDH was used as loading control for quantifications. Data are presented as mean ± S.E.M., Two-way ANOVA, followed by Tukey’s post-hoc test, *p < 0.05; **p < 0.01 (n=3 independent cultures). Representative images (J) and quantification (K) of contraction of collagen matrices seeded with NRCF under control conditions (UNR) or following PC1 knockdown with or without TGF-β1 (48 h). Collagen area represents mean ± S.E.M. Two-way ANOVA, followed by Tukey’s post-hoc test, *p < 0.05, n=3 independent cultures (Scale bar 2 mm). (L) Transcript levels of α-SMA were analyzed by quantitative RT-PCR, and 18s was used as housekeeping gene. Results are normalized to 1, and data are depicted as mean ± S.E.M. Two-way ANOVA followed by Tukey’s post-hoc test. *p < 0.05 (n=5–7)

