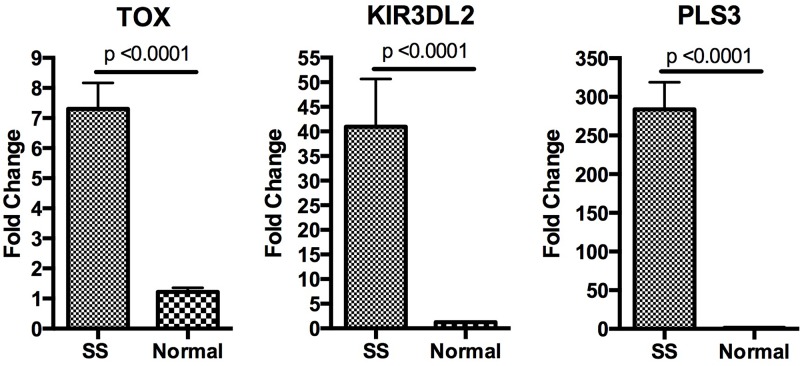
Figure 1. Analysis of gene expression.
Relative expression of PLS3, TOX, and KIR3DL2 as measured by qRT-PCR is shown with fold change representing the average expression level in give SS patients relative to the average expression level in three normal controls. Data are represented as mean +\− SEM. Expression levels were normalized the housekeeping gene B2M. All three genes were upregulated in SS with p-values < 0.0001.

