

Abstract
Background
Work‐related upper limb and neck musculoskeletal disorders (MSDs) are one of the most common occupational disorders worldwide. Studies have shown that the percentage of office workers that suffer from MSDs ranges from 20 to 60 per cent. The direct and indirect costs of work‐related upper limb MSDs have been reported to be high in Europe, Australia, and the United States. Although ergonomic interventions are likely to reduce the risk of office workers developing work‐related upper limb and neck MSDs, the evidence is unclear. This is an update of a Cochrane Review which was last published in 2012.
Objectives
To assess the effects of physical, cognitive and organisational ergonomic interventions, or combinations of those interventions for the prevention of work‐related upper limb and neck MSDs among office workers.
Search methods
We searched the Cochrane Central Register of Controlled Trials (CENTRAL), MEDLINE, CINAHL, Web of Science (Science Citation Index), SPORTDiscus, Embase, the US Centers for Disease Control and Prevention, the National Institute for Occupational Safety and Health database, and the World Health Organization's International Clinical Trials Registry Platform, to 10 October 2018.
Selection criteria
We included randomised controlled trials (RCTs) of ergonomic interventions for preventing work‐related upper limb or neck MSDs (or both) among office workers. We only included studies where the baseline prevalence of MSDs of the upper limb or neck, or both, was less than 25%.
Data collection and analysis
Two review authors independently extracted data and assessed risk of bias. We included studies with relevant data that we judged to be sufficiently homogeneous regarding the interventions and outcomes in the meta‐analysis. We assessed the overall quality of the evidence for each comparison using the GRADE approach.
Main results
We included 15 RCTs (2165 workers). We judged one study to have a low risk of bias and the remaining 14 studies to have a high risk of bias due to small numbers of participants and the potential for selection bias.
Physical ergonomic interventions
There is inconsistent evidence for arm supports and alternative computer mouse designs. There is moderate‐quality evidence that an arm support with an alternative computer mouse (two studies) reduced the incidence of neck or shoulder MSDs (risk ratio (RR) 0.52; 95% confidence interval (CI) 0.27 to 0.99), but not the incidence of right upper limb MSDs (RR 0.73; 95% CI 0.32 to 1.66); and low‐quality evidence that this intervention reduced neck or shoulder discomfort (standardised mean difference (SMD) −0.41; 95% CI −0.69 to −0.12) and right upper limb discomfort (SMD −0.34; 95% CI −0.63 to −0.06).
There is moderate‐quality evidence that the incidence of neck or shoulder and right upper limb disorders were not considerably reduced when comparing an alternative computer mouse and a conventional mouse (two studies; neck or shoulder: RR 0.62; 95% CI 0.19 to 2.00; right upper limb: RR 0.91; 95% CI 0.48 to 1.72), and also when comparing an arm support with a conventional mouse and a conventional mouse alone (two studies) (neck or shoulder: RR 0.91; 95% CI 0.12 to 6.98; right upper limb: RR 1.07; 95% CI 0.58 to 1.96).
Workstation adjustment (one study) and sit‐stand desks (one study) did not have an effect on upper limb pain or discomfort, compared to no intervention.
Organisational ergonomic interventions
There is very low‐quality evidence that supplementary breaks (two studies) reduce discomfort of the neck (MD −0.25; 95% CI −0.40 to −0.11), right shoulder or upper arm (MD −0.33; 95% CI −0.46 to −0.19), and right forearm or wrist or hand (MD ‐0.18; 95% CI ‐0.29 to ‐0.08) among data entry workers.
Training in ergonomic interventions
There is low to very low‐quality evidence in five studies that participatory and active training interventions may or may not prevent work‐related MSDs of the upper limb or neck or both.
Multifaceted ergonomic interventions
For multifaceted interventions there is one study (very low‐quality evidence) that showed no effect on any of the six upper limb pain outcomes measured in that study.
Authors' conclusions
We found inconsistent evidence that the use of an arm support or an alternative mouse may or may not reduce the incidence of neck or shoulder MSDs. For other physical ergonomic interventions there is no evidence of an effect. For organisational interventions, in the form of supplementary breaks, there is very low‐quality evidence of an effect on upper limb discomfort. For training and multifaceted interventions there is no evidence of an effect on upper limb pain or discomfort. Further high‐quality studies are needed to determine the effectiveness of these interventions among office workers.
Plain language summary
Ergonomic interventions for preventing work‐related musculoskeletal disorders of the upper limb and neck among office workers
What is the aim of this review?
The aim of this Cochrane Review was to find out if ergonomic interventions can prevent musculoskeletal pain or discomfort or both (musculoskeletal disorders; MSDs) among office workers. We collected and analysed all relevant studies to answer this question and found 15 studies.
Key messages
We found physical ergonomic interventions, such as using an arm support with a computer mouse based on neutral posture, may or may not prevent work‐related MSDs among office workers. We are still uncertain of the effectiveness of the other physical, organisational and cognitive ergonomic interventions.
What was studied in the review?
We selected office workers in our review, as they are a working population that has a higher risk for developing MSDs of the upper limb and neck. We assessed the effect of using ergonomic principles to improve the workplace and working process. Ergonomic refers to interactions among workers and other elements in the working environment, which includes physical, organisational and cognitive components. Physical ergonomic interventions include improving the equipment and environment of the workplace. The aim of these methods is to reduce the physical strain to the musculoskeletal system, thus reducing risk of injury. Meanwhile, organisational ergonomic interventions consist of allowing optimum workplace and rest time for the musculoskeletal system to recover from fatigue, thus reducing the risk of long‐term injury. Cognitive ergonomic interventions consist of improving mental processes such as perception, memory, reasoning and motor response through modifying work processes and training. The aim of these methods is to reduce mental workload, increase reliability and reduce error, which may have an indirect effect on reducing strain on the musculoskeletal system.
What are the main results of the review?
We found 15 studies that included 2165 workers. Fourteen of the studies conducted and reported their work poorly, and most of the studies had a small number of participants.
Out of the 15 studies, five studies evaluated the effectiveness of physical ergonomic interventions. Four studies evaluated the effectiveness of organisational ergonomic interventions, in the form of breaks or reduced working hours in preventing work‐related MSDs of the upper limb or neck, or both, among office workers. Five studies evaluated the effectiveness of ergonomic training, and one study evaluated multifaceted ergonomic interventions. We did not find any studies evaluating the effectiveness of cognitive ergonomic interventions.
Physical ergonomic interventions
We found that the use of an arm support or a mouse based on neutral posture may or may not prevent work‐related MSDs of the neck and shoulder. Workstation adjustment, and sit‐stand desks do not have an effect on upper limb pain compared to no intervention.
Organisational ergonomic interventions
We found that supplementary breaks may reduce neck and upper limb discomfort among data entry workers (two studies).
Cognitive ergonomic interventions
We found no studies using these methods.
Training interventions
There is no effect on upper limb pain compared to no intervention in five studies.
Mutlifaceted ergonomic interventions
There is no effect on pain or discomfort compared to no intervention in one study.
This means that there remains a need to conduct further studies to assess the effectiveness of ergonomic interventions.
How up‐to‐date is this review?
The review authors searched for studies that had been published up to 10 October 2018.
Summary of findings
Background
Description of the condition
Work‐related musculoskeletal disorders (MSDs) are the most common occupational disorders around the world, and have been recognised as a problem since the 17th century (Ramazzini 1964). Other general terms for these disorders include repetitive strain injury, occupational overuse syndrome and cumulative trauma disorders (Yassi 1997). Work‐related upper limb and neck MSDs are musculoskeletal disorders of the neck and upper limbs, which include the shoulders, upper arms, elbows, forearms, wrists, and hands (Buckle 1999). These are also known as complaints of the arm, neck and/or shoulder (CANS) (Huisstede 2006). MSDs can be divided into specific conditions with clear diagnostic criteria and pathological findings, which include tendon‐related disorders (e.g. tendonitis), peripheral‐nerve entrapment (e.g. carpal tunnel syndrome), neurovascular/vascular disorders (e.g. hand‐arm vibration syndrome), and joint/joint‐capsule disorders (e.g. osteoarthritis) or non‐specific conditions where the main complaint is pain or tenderness, or both, with limited or no pathological findings (Buckle 1997; Su 2013; Yassi 1997).
Based on the Global Burden of Disease 2010 study, the global point prevalence of neck pain was estimated to be 4.9% (95% confidence interval: 4.6 to 5.3), and was ranked fourth highest in terms of disability as measured by years lived with disability (YLDs) and 21st in term of overall burden (Hoy 2014). Moreover the cost of work‐related upper limb MSDs in the European Union (EU) has been reported to be high, with estimates ranging from 0.5% and 2% of gross national product (Buckle 1999). In Australia, disorders of the muscles, tendons, and soft tissue (excluding back pain) were estimated to cost AUD 519 million or 17% of the total health system costs in 1993 and 1994 (Mathers 1999). In the United Kingdom (UK), MSDs were recorded as the second highest reason for sickness certification in 2005, with an average of 22.84 sickness certificates being issued per 1000 person‐years (Wynne‐Jones 2009). In the UK in 2014/15 an estimate of 4.1 million working days were lost due to work‐related upper limb MSDs, which represents around 15% of all days lost due to work related ill‐health (HSE 2015). In the United States, the costs associated with musculoskeletal conditions accounted for 5.73% of GDP and 74% of the total work days lost in 2012. The direct per‐person healthcare costs for those with MSDs were estimated to be 7,104 USD in 2009‐2011 and accounted for around 30% of the injuries involving days absent from work. Those people with MSDs who were absent from work were away for a median of 11 days(USBJI 2015).
Over the past decades there has been an increase in the number of office workers in both developing and developed nations. This has been primarily attributed to the rapid development of knowledge‐based economies, which are directly based on the production, distribution and use of knowledge and information (OECD 1996). The emergence of new technologies, including the proliferation of personal computers, the internet and mobile devices has also contributed to the growth (Powell 2004). The nature of office‐based work has also subsequently changed from administrative and clerical work, to the production, distribution and use of knowledge. The office boundaries have expanded and are not limited to physical space but may include mobile workers and other offices throughout the world due to the ease of communication. Data processing, customer support, sales, and many other office processes may now be performed in developing countries (Subbarayalu 2013). Thus, not only has the office workers’ workforce grown in numbers it has also changed and diversified.
While we were not able to identify any systematic reviews that specifically reported prevalence of MSDs, including work‐related upper limb and/or neck MSDs, among office workers, several large cohort studies have reported these data. A Danish study of 5033 computer users reported the 12‐month prevalence for shoulder MSDs and wrist‐hand MSDs to be 44.7% and 25.8% respectively (Jensen 2003). Moreover, a UK study reported the 12‐month prevalence of neck MSDs to be 58% among data processing workers and 33% among other office workers (Woods 2005), while a Belgian study reported, the 12‐month prevalence of neck MSDs among office workers was 45.5%, (Cagnie 2007) and in Sweden the 12‐month prevalence of neck or shoulder MSDs among visual display terminal workers was 61.5% (Bergqvist 1995). In a large multicentre study involving 18 countries among more than 4000 office workers, the prevalence of disabling wrist and hand pain in the past month ranged from 2.2% in Pakistan and 2.3% in Japan to 31.3% in Brazil and 31.6% in Nicaragua (Coggon 2012; Coggon 2013a). The differences in prevalence rates reported by these studies may be a result of: the absence of a universally accepted definition of MSDs, the use of different diagnostic criteria (e.g. self‐reported or medical examination), and the variation in office work and office environments between these cultures and countries (Buckle 1999; Coggon 2013b; Huisstede 2006 ).
A number of studies have examined risk factors for MSDs and identified a variety of factors. These include individual factors (e.g. inadequate strength, poor posture, mental health, somatisation tendency, work‐causation beliefs, fear‐avoidance beliefs, cultural factors), physical requirements at the workplace (e.g. work requiring prolonged static posture, highly repetitive work, use of vibrating tools), and organisational and psychosocial factors (e.g. poor work‐rest cycle, shift work, low job security, little social support) (Bernard 1997; Buckle 1997; Coggon 2013a; Coggon 2013b; Hoe 2012b; Marras 2009; NIOSH 2001; Shanahan 2006; Yassi 1997).
Description of the intervention
Ergonomics as defined by the International Ergonomics Association (IEA) is the scientific discipline concerned with the understanding of the interactions among humans and other elements of a system. Ergonomics in the workplace refers to interactions among workers and other elements in the working environment. It is essentially about fitting the job to the worker. The IEA categorised ergonomics into three specific domains: physical, organisational and cognitive ergonomics.
The physical domain is concerned with human anatomical, anthropometric, physiological and biomechanical characteristics as they relate to physical activity. This domain consists of work environment and equipment, for example keyboard, mouse, hand tools, workstations, visual display units (VDUs) and lighting that are fitted to the workers.
The organisational domain is concerned with the optimisation of socio‐technical systems, including the organisational structures, policies and processes; for example work pace, work‐rest cycle and worker's participation in decision making.
The cognitive domain is concerned with mental processes, such as perception, memory, reasoning and motor response.
Ergonomic interventions have been heavily promoted for the prevention of work‐related upper limb or neck MSDs, or both (NIOSH 1997; NIOSH 2001). The current review will encompass interventions that focus on all three domains: the physical, organisational and cognitive domains.
How the intervention might work
Many studies have found that ergonomic factors correlate with musculoskeletal symptoms (Bernard 1994; Bonfiglioli 2006; Ortiz‐Hernandez 2003; Szeto 2009; Werner 2005). Adjusting physical, organisational and cognitive ergonomic factors to reduce the physical and mental load on workers is likely to reduce the risk of workers developing work‐related MSDs of the upper limb, neck or both.
Physical ergonomic interventions include providing workspace and equipment based on ergonomic principles and the anthropometry of workers. This will reduce the physical strain to the musculoskeletal system, thus reducing risk of injury. An example is the use of a split keyboard that has been found to reduce the severity of pain in computer users with MSDs (Tittiranonda 1999).
Organisational ergonomic interventions consists of allowing optimum work pace and rest time for the musculoskeletal system to recover from fatigue, thus reducing the risk of long term injury. An example is allowing supplementary breaks for data entry workers (Galinsky 2000). It can also include participatory interventions, where the workers participate in decision making on improvement and changes made at the workplace (Bohr 2000), and training in ergonomic principles and practices (Baydur 2016).
Cognitive ergonomics intervention consists of improving mental processes such as perception, memory, reasoning and motor response through modifying work process and training. This will reduce mental workload, increase reliability and reduce error, this may have an indirect effect in reducing strain on the musculoskeletal system.
Why it is important to do this review
A systematic review of interventions for the prevention and treatment of work‐related upper limb MSDs by Boocock 2007 evaluated studies published between 1999 and 2004. The authors concluded that there is some evidence to support the use of mechanical and modifier interventions for preventing and managing neck or upper extremity musculoskeletal conditions (Boocock 2007). However, there is a limitation in that the authors did not identify specific worker groups. Another systematic review by Kennedy 2010, which focused on the role of occupational health and safety interventions, found that the use of arm supports reduced upper extremity musculoskeletal diseases (MSDs) in office workers. However, Kennedy 2010 did not clearly define their search period. A more recent systematic review by Van Eerd 2016, which is an update of the Kennedy 2010 systematic review (updated search period between 2008 and 2013), found moderate evidence for vibration feedback about static mouse use and forearm supports in preventing work‐related MSDs of the upper limb or neck, or both, in office workers. Van Eerd 2016 also found moderate evidence for no effect for electric myogram (EMG) biofeedback, job stress management training, and office workstation adjustment for work‐related MSDs of the upper limb or neck, or both. However, in addition to randomised controlled trials (RCTs), Boocock 2007, Kennedy 2010 and Van Eerd 2016 included in their reviews other study designs that are at greater risk of bias. What is more, the three systematic reviews did not conduct meta‐analysis.
Our review extends and updates the search period covered by these three reviews and considers all published and unpublished randomised and quasi‐randomised trials investigating the use of physical, organisational and cognitive ergonomic interventions for the prevention of work‐related upper limb MSDs among office workers. We also conducted meta‐analysis of results from studies with comparable interventions and outcomes. Furthermore, this review is an update of our previous Cochrane Review (Hoe 2012a). In our previous review (Hoe 2012a), we included all workplaces and work settings, whereas in this review we focus only on the office setting. Other Cochrane Reviews will examine the effectiveness of interventions in different work settings. One example is Mulimani 2014, which investigates ergonomic interventions among dental care practitioners.
Objectives
To assess the effects of physical, organisational and cognitive ergonomic interventions, or combinations of those interventions for the prevention of work‐related upper limb and neck musculoskeletal disorders (MSDs) among office workers.
Methods
Criteria for considering studies for this review
Types of studies
We included randomised controlled trials (RCTs), quasi‐randomised trials (trials which use methods of allocating participants to a treatment that are not strictly at random, e.g. by date of birth, hospital record number or alternative), cluster‐RCTs (i.e. where the unit of randomisation is a group of people, such as people working in the same office or shift rather than individual workers) and cross‐over trials (i.e. where participants are randomly allocated to a sequence of interventions).
Types of participants
We included studies where participants were office workers at the time of the intervention. Office workers were defined as those working in an office environment where their main tasks involved performing professional, managerial or administrative work. Because this review is focused on prevention of work‐related musculoskeletal disorders (MSDs) of the upper limb or neck or both, the majority of participants (75% or more) were required to be free of MSDs of the upper limb or neck, or both, at the time of the intervention. We only included studies conducted at the workplace.
We excluded studies evaluating treatment interventions for people with established MSDs of the upper limb or neck, or both (there are Cochrane systematic reviews conducted by Aas 2011, and Verhagen 2013, that have already covered workplace interventions for neck pain in workers and conservative interventions for treating work‐related complaints of the arm, neck or shoulder in adults). We also excluded studies that focus on rehabilitation of people with acute or chronic conditions (e.g. trauma, neoplasm, and inflammatory or neurological diseases).
Types of interventions
We included studies that examined at least one physical, organisational or cognitive ergonomic intervention in the workplace, aimed at the prevention of work‐related MSDs of the upper limb or neck, or both, among office workers. We excluded studies that tested ergonomic interventions for the treatment of individuals diagnosed with work‐related MSDs of the upper limb or neck, or both, or for prevention of work‐related MSDs of the upper limb or neck, or both, outside the office environment.
Interventions and specific comparisons
We categorised interventions as:
physical ergonomic interventions, such as the use of a specially designed computer mouse or arm support;
organisational ergonomic interventions, such as a different work‐rest cycle;
cognitive ergonomic interventions, such as job design;
training in ergonomic principles; and
multifaceted interventions that consist of a combination of one or more physical, organisational or cognitive interventions.
We planned the following main comparisons:
physical ergonomic intervention versus no intervention, placebo, or alternative intervention;
organisational ergonomic intervention versus no intervention, placebo, or alternative intervention;
cognitive ergonomic intervention versus no intervention, placebo, or alternative intervention;
training versus no training in ergonomic principles or versus alternative training; and
multifaceted interventions versus a single intervention or a different combination of interventions.
Types of outcome measures
We included studies based on the following primary and secondary outcomes.
Primary outcomes
Number of workers with newly diagnosed or verified MSDs of the upper limb or neck, or both (incident cases).
Presence or severity or intensity of complaints or symptoms of pain or discomfort in the upper limb or neck, or both, using a dichotomised scale (e.g. yes/no), Likert scale, visual analogue scale (VAS), or any similar scale measuring pain or discomfort.
Work‐related function as measured by number of work days lost, loss of or change in job, work disability, and level of functioning. For the level of functioning, we included studies using validated outcome measures e.g. Disability of the Arm, Shoulder, and Hand (DASH) questionnaire (Kitis 2009), and Northwick Park Neck Pain Questionnaire (Leak 1994).
Secondary outcomes
Secondary outcomes included the following.
Time and comfort in work positions or postures.
Change in productivity.
Costs (including costs of implementation of the intervention and treatment).
Compliance (attitude and practice). Compliance is the degree of how well study participants adhere to the prescribed intervention. We considered compliance as a secondary outcome as it indicates the intervention take‐up rate.
We only included studies that reported one or more primary outcomes in this review. If a study only reported one or more secondary outcomes, then we excluded that study from this review.
Search methods for identification of studies
Electronic searches
We systematically searched the following databases:
Cochrane Central Register of Controlled Trials (Issue 9, September 2018) in the Cochrane Library (Appendix 1);
Ovid MEDLINE(R) and In‐Process & Other Non‐Indexed Citations and Daily (1948 to 17 September, 2018 (Appendix 2);
Embase (1980 to 29 May 2017) (Appendix 3);
Web of Science (Search date: 18 September, 2018) (Appendix 4);
CINAHL (EBSCOhost) (Search date: September 18, 2018) (Appendix 5);
SPORTDiscus (1949 to 10 October, 2018) (Appendix 6);
Scopus (Search date: 21 September, 2018, limit to 2017 and 2018 studies) (Appendix 7);
NIOSHTIC‐2 (Search date: 21 September, 2018) (Appendix 8)
From May 2017 onwards we replaced the Embase search with a search in Scopus because of ease of access and because the latter contains everything included in the former.
We searched the following websites and databases for unpublished and ongoing studies:
World Health Organization International Clinical Trials Registry Platform (10 October 2018);
We considered reports published in all languages. The searches were based on the MEDLINE search strategy combined with the sensitivity‐ and precision‐maximising version of the Cochrane Highly Sensitive Search Strategy for identifying RCTs (Lefebvre 2011) (see Appendix 2). We modified the search strategy to use in the other databases.
Searching other resources
We contacted experts in the field to identify theses and unpublished studies. We looked for additional studies by checking the bibliographies of relevant articles.
Data collection and analysis
Selection of studies
Two review authors (VCWH and ENZ) obtained and screened abstracts and citations identified by the systematic searches. The full‐text articles of studies identified as being potentially eligible for the review were retrieved to further determine their inclusion (VCWH and ENZ). We resolved all disagreements by discussion between the review authors to reach a consensus. Where there was uncertainty, we contacted the corresponding author to ascertain whether a potentially relevant study met the inclusion criteria.
Data extraction and management
Two review authors (VCWH and ENZ) performed data extraction independently, with checks for discrepancies and processing as described in the Cochrane Handbook for Systematic Reviews of Interventions (Higgins 2011). We resolved all discrepancies by discussion and consensus. We used a standard data extraction form based on the form recommended by the Cochrane Bone, Joint and Muscle Trauma Group. We performed all statistical analyses using Review Manager 5.3 (RevMan 2014) software.
Assessment of risk of bias in included studies
Two review authors (VCWH and ENZ) assessed the risk of bias of included studies independently using Cochrane's 'Risk of bias' tool (Appendix 9) (Higgins 2011). We assessed each study for risk of bias in each of the following domains: sequence generation, allocation concealment, blinding of participants and personnel (performance bias), blinding of outcome assessment (detection bias), incomplete outcome data, selective outcome reporting, and 'other', such as contamination bias and reliability of instruments. We assessed the risk of bias associated with (a) blinding and (b) completeness of outcomes separately for self‐reported outcomes and objective outcomes. We resolved disagreements between authors regarding the risk of bias for domains by discussion and consensus.
We considered a study to have low risk of bias overall if we judged it to have a low risk of bias in the domains random sequence generation (selection bias), incomplete outcome data (attrition bias), selective reporting (reporting bias) and other forms of bias. We did not include allocation concealment (selection bias), blinding of participants and personnel (performance bias), and blinding of outcome assessment (detection bias) in the criteria for classifying the included studies' overall risk of bias because of the nature of the intervention, which requires fully aware participation of participants and personnel, and because the main outcome, pain, is a subjective symptom (International Association for the Study of Pain).
Measures of treatment effect
We plotted the results of each trial as point estimates, using risk ratios (RRs) for dichotomous outcomes, and means and standard deviations (SDs) for continuous outcomes. When studies reported different outcome measures but measured the same concept, we calculated the standardised mean difference (SMD) with 95% confidence interval (CI). For studies that had reported outcome data for both the right and left upper limb, we only used the outcome data for the right upper limb.
Unit of analysis issues
If studies employed a cluster‐randomised design, but did not take the cluster effect into account, we tried to adjust the data for the effect of clustering by calculating the design effect based on an assumed intra cluster correlation of 0.1.
Dealing with missing data
We dealt with missing data according to the recommendations in the Cochrane Handbook for Systematic Reviews of Interventions (Higgins 2011), that is, we contacted study authors to request missing data.
Assessment of heterogeneity
First, we assessed whether studies were sufficiently homogeneous to be included in one comparison. We based this judgment on the similarity of the type of interventions, what the control condition was, the outcome and when the outcome was measured (short term: three to eight weeks, intermediate: eight weeks to six months, or long‐term: six months or longer).
Second, we tested for statistical heterogeneity by means of the I² statistic as presented in the meta‐analysis graphs generated by the Review Manager 5 software (RevMan 2014). When this test statistic was greater than 50% we considered there to be substantial heterogeneity between studies. In such cases we employed the random‐effects meta‐analysis and we downgraded the quality of evidence according to the GRADE system for the relevant comparisons.
Assessment of reporting biases
If, in future updates of this review, we are able to pool more than ten trials in any single meta‐analysis, we will create and examine a funnel plot to explore possible small study biases.
Data synthesis
We pooled results of studies if they had a similar type of intervention, control conditions, and outcome. When studies were statistically heterogeneous, we used a random‐effects model; otherwise we used a fixed‐effect model. We pooled study results data with Review Manager 5 software (RevMan 2014).
We considered the types of interventions evaluated in each of the studies and found the studies assessing the effectiveness of ergonomic computer mouse or arm support (physical ergonomic interventions), supplementary breaks or reduced work hours (organisational ergonomic interventions), and ergonomic training (cognitive ergonomic interventions) to be sufficiently similar to be pooled for comparison.
We assessed the overall quality of the evidence contributing to the primary outcomes for each important intervention, using the GRADEpro GDT software (GRADEpro GDT).
Our judgement of the quality of the evidence for a specific intervention‐outcome combination was based on performance against the five GRADE domains: limitations of study design, inconsistency, indirectness (inability to generalise), imprecision (insufficient or imprecise data) of results, and publication bias across all studies that measured that particular outcome. The overall quality of the evidence for each outcome is the result of a combination of the assessments in all domains.
There are four grades of evidence:
high‐quality evidence: there are consistent findings among at least 75% of RCTs with no limitations of the study design, consistent, direct and precise data and no known or suspected publication biases. Further research is unlikely to change either the estimate or our confidence in the results;
moderate‐quality evidence: one of the domains is not met. Further research is likely to have an important impact on our confidence in the estimate of effect and might change the estimate;
low‐quality evidence: two of the domains are not met. Further research is very likely to have an important impact on our confidence in the estimate of effect and is likely to change the estimate;
very‐low‐quality evidence: three of the domains are not met. We are very uncertain about the estimate.
Subgroup analysis and investigation of heterogeneity
If, in future updates of this review, we can include a sufficient amount of data we will conduct subgroup analyses based on: type of job, gender, and rigour of outcome measurement.
Sensitivity analysis
If, in future updates of this review, we can include a sufficient amount of data we will undertake sensitivity analyses by excluding the studies we judge to have a high risk of bias. In the current review this was not possible as we judged only one study to have a low risk of bias.
Results
Description of studies
Results of the search
Our search strategy identified 2547 potentially relevant references after duplicates had been removed. Two review authors (VCWH and ENZ) assessed the titles, keywords, and abstracts of these references, and selected 48 potentially eligible references. We obtained the full‐text publications for these 48 references.
We did not identify any additional references by searching the following additional databases: the US Centers for Disease Control and Prevention National Institute for Occupational Safety and Health (NIOSHTIC‐2) database, and the International Occupational Safety and Health Information Centre (CIS) database. Our search for unpublished and ongoing studies, through the World Health Organization International Clinical Trials Registry Platform, identified one additional registered trial (Shariat 2016).
We checked the reference lists of all articles that we retrieved as full‐text papers in order to identify potentially eligible studies. We did not identify any additional studies through this approach. Of the 48 full‐text reports and one registered trial identified, we included 15 studies reported in 17 publications. We excluded 24 studies reported in 30 publications. We also identified two ongoing studies (Johnston 2014; Shariat 2016). See the PRISMA study flow diagram (Figure 1) for our description of the whole study inclusion process.
1.
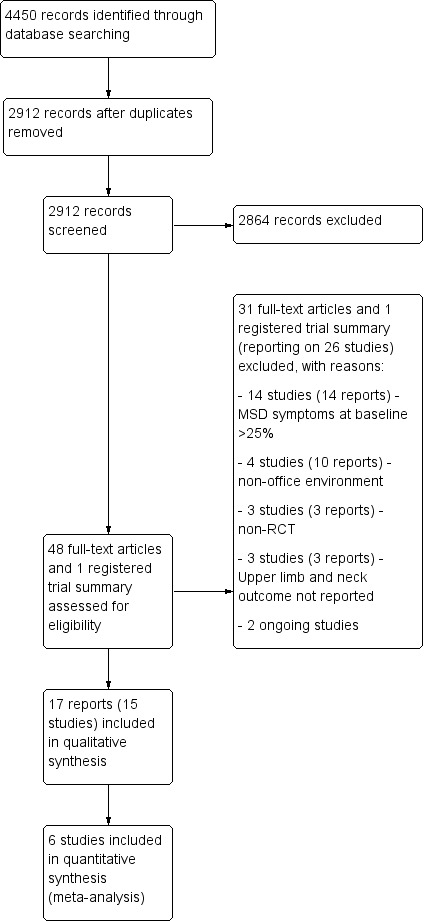
PRISMA study flow diagram
Included studies
We included 15 studies reported in 17 publications. These studies recruited a total of 2165 participants. For further details regarding the study populations and settings, see the Characteristics of included studies table.
Study Design
All of the included studies were randomised controlled trials (RCTs); two used a cluster‐randomised design (Brisson 1999; Baydur 2016), and another two used a cross‐over design (Galinsky 2000; Galinsky 2007).
Location and settings
Nine studies were conducted in the United States (Bohr 2000; Bohr 2002; Conlon 2008; Galinsky 2000; Galinsky 2007; Gatty 2004; Gerr 2005; Greene 2005; Rempel 2006), three were conducted in Canada (Brisson 1999; McLean 2001; King 2013), and the remaining three studies were conducted in Finland (Lintula 2001), the United Kingdom (Graves 2015), and Turkey (Baydur 2016).
Three studies were conducted in data processing or call centres (Galinsky 2000; Galinsky 2007; Rempel 2006), four studies in universities or colleges (Brisson 1999; Gatty 2004; Greene 2005; Graves 2015), two studies in a transportation company (Bohr 2000; Bohr 2002), one study in an aerospace firm (Conlon 2008), one study among office workers in a municipality (Baydur 2016), one study among office employees and researchers (Lintula 2001), one study in a research organisation (King 2013), and two studies involved several sectors (insurance and financial companies, food product producers, government offices, and universities) (Gerr 2005; McLean 2001).
Type of work
All studies were conducted with participants who were using computers or who were conducting data processing in an office environment (Baydur 2016, Bohr 2000; Bohr 2002; Brisson 1999; Conlon 2008; Galinsky 2000; Galinsky 2007; Gatty 2004; Gerr 2005; Graves 2015; Greene 2005; King 2013; Lintula 2001; McLean 2001; Rempel 2006).
Type of interventions
Physical ergonomic interventions
Five studies evaluated physical ergonomic interventions alone, which consisted of alternative computer mouse or arm supports, or both (Conlon 2008; Rempel 2006), arm support alone (Lintula 2001), sit‐stand workstation (Graves 2015) and ergonomic posture intervention (Gerr 2005).
Organisational ergonomic interventions
Four studies evaluated organisational ergonomic interventions in the form of supplementary breaks or reduced work hours (Galinsky 2000; Galinsky 2007; McLean 2001; King 2013). Although the intervention was a biofeedback mouse in one study (King 2013), the objective of the mouse was to ensure workers take breaks from using the mouse.
Cognitive ergonomic interventions
No study specifically addressed cognitive processes.
Training programmes
Five studies evaluated ergonomic training programmes (Baydur 2016; Bohr 2000; Bohr 2002; Brisson 1999; Greene 2005).
Multifaceted ergonomics interventions
One study evaluated a combination of organisational and physical ergonomic interventions (Gatty 2004), which consisted of training, workstation redesign and task modification.
Follow‐up period
Five studies had a short follow‐up period of between four and eight weeks (Galinsky 2000; Galinsky 2007; Graves 2015; Greene 2005; Lintula 2001; McLean 2001). One study had an intermediate‐term follow‐up period of 16 weeks (Gatty 2004), and eight studies had a long‐term follow‐up period of between six and 13 months (Baydur 2016, Bohr 2000; Bohr 2002; Brisson 1999; Conlon 2008; Gerr 2005; King 2013; Rempel 2006).
Outcomes
The incidence of musculoskeletal disorders (MSDs) was measured in three studies (Conlon 2008; Gerr 2005; Rempel 2006), and the prevalence of MSDs was measured in a further three studies (Brisson 1999; Gatty 2004; Greene 2005). The severity, intensity, discomfort, and strain associated with musculoskeletal conditions were measured in 13 studies (Baydur 2016; Bohr 2000; Bohr 2002; Conlon 2008; Galinsky 2000; Galinsky 2007; Gatty 2004; Graves 2015; Greene 2005; King 2013; Lintula 2001; McLean 2001; Rempel 2006).
One study assessed disability (Baydur 2016).
Seven studies assessed compliance to interventions (Bohr 2000; Bohr 2002; Brisson 1999; Gatty 2004; Gerr 2005; Graves 2015; King 2013).
Unit of analysis
Brisson 1999, reported the number of clusters and the intracluster correlation coefficients (ICCs) for the neck or shoulder (0.0161) and for the wrist or hand (0.0007). The design effect of the study is calculated using the formula 1 + (average cluster size −1) x ICC. The results of the design effect are then used to calculate the effective (reduced) sample size. Baydur 2016 also provided us with the number of clusters. Based on the intracluster correlation coefficients of Brisson 1999 we adjusted the effective sample size for this study as well.
Dealing with missing data
We contacted five authors for clarification and additional data relating to six studies (Baydur 2016; Bohr 2000; Bohr 2002; Brisson 1999; Galinsky 2000; Galinsky 2007; McLean 2001), and we were able to use the additional data for four studies (Baydur 2016; Brisson 1999; Galinsky 2000; Galinsky 2007).
For Baydur 2016 we received the additional information that the number of clusters was 16 in the control group with a total of 58 workers and similarly there were 16 clusters in the intervention group with a total of 58 workers. For the cross‐over trials, Galinsky 2000 and Galinsky 2007, we conducted our own paired analysis. For the analysis we received from the author data about the means and standard deviations of discomfort ratings after the intervention and after the control condition. We used the square root of the F‐value as reported by the authors as a best estimate of the T‐value to enable the calculation of the SE of the MD. We also calculated the SE based on assumed correlations of 0.5, 0.7 and 0.9 between the discomfort ratings of the intervention and control condition as proposed in the Handbook chapter 16.4.6. The assumption of a correlation of 0.85 agreed best with the values derived of the F‐value and we took this correlation for imputing the SE values for both studies.
Excluded studies
Altogether we excluded 24 studies published in 30 reports. We excluded 14 studies because more than 25% of the participants reported musculoskeletal symptoms of the upper limb or neck, or both, at baseline (Danquah 2017; Dropkin 2015; Esmaeilzadeh 2014; Fostervold 2006; Ketola 2002; Levanon 2012; Mahmud 2011; Mann 2013; Meijer 2009a; Meijer 2009b; Mekhora 2000; Parry 2015; Ripat 2006; Spekle 2010). We excluded three studies because they were not RCTs (Aaras 1998; Amick 2003; Amick 2012), and a further three studies because they had not measured the effectiveness of interventions on disorders of the upper limb or neck, or both (Chau 2014; De Cocker 2016; Krause 2010). We excluded two more studies (one of which, Thorp 2014, was reported in two reports) because they were conducted in a laboratory setting (Robertson 2013; Thorp 2014). We excluded two studies (one of which, Driessen 2008, was reported in six reports) where the participants consisted of workers other than office workers (Driessen 2008; Faucett 2002). For further details regarding the study populations and settings see the Characteristics of excluded studies table. In addition to the 24 studies excluded in this review update, we also excluded the studies that were not undertaken in office workers that had been included in the previous version of this review (Hoe 2012a): von Thiele 2008 and Yassi 2001.
Risk of bias in included studies
Allocation
Five studies (Conlon 2008; Gerr 2005; Graves 2015; King 2013; Rempel 2006) used a random number table or equivalent for generating a random sequence and therefore we judged them to have a low risk of allocation bias. In Graves 2015, it was indicated that they completed allocation by alternating between intervention and control, and that they did not conceal the allocation, so we judged this study as having high risk of bias. All the other studies did not report using adequate measures for concealing allocation, such as using sealed opaque envelopes, and thus we judged them to have an unclear risk of bias.
Blinding
Blinding of the interventions was not performed in most of the studies, as blinding of physical, organisational and cognitive ergonomic interventions is difficult to achieve. Therefore, we judged 12 studies to have a high risk for performance bias. The remaining three studies assessed organisational ergonomic interventions of work breaks and work hours (Galinsky 2000; Galinsky 2007; McLean 2001). Although complete blinding for breaks was not possible in these studies, the use of a strict protocol for taking breaks by the use of either custom‐made electrical timers, or the 'Ergobreak' computer programme, minimised the risk of bias. Therefore, we judged these three studies to have a low risk of performance bias.
Although in three studies (Brisson 1999; Conlon 2008; Rempel 2006), the physical examination for the detection of MSD was blinded, the examination was only performed on participants who self‐reported symptoms meeting the case definition, which may lead to detection bias. Thus, we rated the risk of detection bias as high for all 15 studies.
Incomplete outcome data
Four studies conducted an intention‐to‐treat (ITT) analysis (Conlon 2008; Gerr 2005; King 2013; Rempel 2006), one study had no loss to follow‐up (Lintula 2001), and four studies had a low drop‐out rate (Baydur 2016; Brisson 1999; Graves 2015; King 2013). We rated these nine studies as having a low risk of attrition bias. We rated five studies (Bohr 2000; Bohr 2002; Galinsky 2000; Galinsky 2007; Gatty 2004) as having a high risk of attrition bias, as they did not conduct ITT analyses. In addition, one of these five studies had an uneven drop‐out rate across the groups (Bohr 2000), and four studies had a high drop‐out rate (Galinsky 2000; Galinsky 2007; Gatty 2004; Bohr 2002). We rated two studies as having an unclear risk of attrition bias as they did not conduct ITT analyses and information on their drop‐out rate was limited (Greene 2005; McLean 2001).
Selective reporting
We judged all 15 included studies to be free of selective reporting because they reported all outcomes described in the methods.
Other potential sources of bias
We judged 11 studies to have a high risk of bias from other potential sources (Baydur 2016; Bohr 2000; Bohr 2002; Brisson 1999; Conlon 2008; Galinsky 2007; Gatty 2004; Gerr 2005; Graves 2015; Lintula 2001; McLean 2001), two studies to have a low risk of other bias (Galinsky 2000; Rempel 2006), and another two studies had an unclear risk of other bias (Greene 2005; King 2013).
Five studies did not report baseline data on the outcome measures (Baydur 2016; Bohr 2000; Brisson 1999; Lintula 2001; McLean 2001). In Gatty 2004, the intervention group had lower average wrist‐hand and upper back ache or pain intensity compared to the control group. In Conlon 2008, the participants who volunteered for the study had higher levels of discomfort than non‐participants. In two studies (Bohr 2000; Bohr 2002), the close proximity of the workstations may have led to contamination of the intervention effect. In another two studies (Gerr 2005; Bohr 2002), there were large numbers of dropouts in the intervention and control groups; and although in Gerr 2005, the authors conducted ITT analysis, the large number of dropouts may have affected the findings. In the two cluster‐RCTs (Brisson 1999; Baydur 2016), the latter did not report cluster size.
Of the two cross‐over RCTs (Galinsky 2000; Galinsky 2007), the latter had potential for a carry‐over effect. The authors did not report if they had a wash‐out period between the two data collection periods.
Overall risk of bias per study
Overall, we found that the risk of bias in the included studies was high. Of the 15 studies, we judged only one study, Rempel 2006, to have a low risk of bias overall. For details on our a priori criteria for assigning ‘Risk of bias’ judgements to studies overall, see Assessment of risk of bias in included studies. See Figure 2 for an overview of our judgements about each 'Risk of bias' item, presented as percentages across all included studies. Figure 3 shows the 'Risk of bias' summary of each 'Risk of bias' item for each included study.
2.
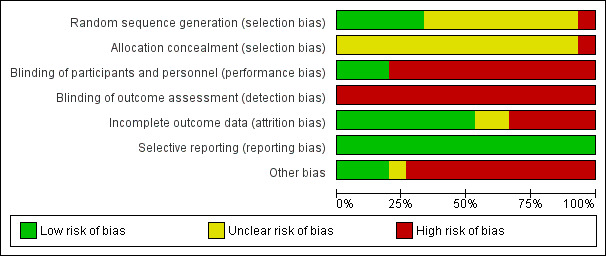
'Risk of bias' graph: review authors' judgements about each 'Risk of bias' item presented as percentages across all included studies.
3.
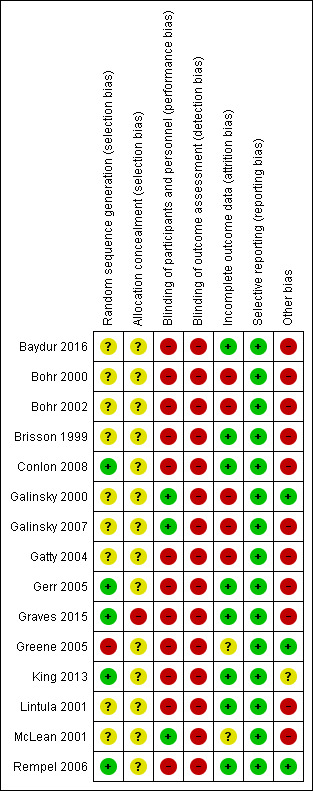
'Risk of bias' summary: review authors' judgements about each 'Risk of bias' item for each included study.
Effects of interventions
See: Table 1; Table 2; Table 3; Table 4; Table 5; Table 6; Table 7; Table 8; Table 9
Summary of findings for the main comparison. Arm support combined with alternative mouse versus conventional mouse alone.
| Patient or population: office workers Settings: office environment using visual display units (> 20 h/week) Intervention: an arm support combined with an alternative computer mouse Comparison: conventional mouse alone (with no arm support) | ||||||
| Outcomes | Illustrative comparative risks* (95% CI) | Relative effect (95% CI) | No of participants (studies) | Quality of the evidence (GRADE) | Comments | |
| Assumed risk | Corresponding risk | |||||
| Conventional mouse alone | Arm support with alternative mouse | |||||
| Incidence of upper body disorders (neck, shoulder, and upper extremity) Questionnaire followed by medical examination Follow‐up: 12 months | 333 per 1000 | 220 per 1000 (140 to 347) | RR 0.66 (0.42 to 1.04) | 191 (2 studies) | ⊕⊕⊕⊝ moderate1 | |
| Incidence of neck or shoulder disorder Questionnaire followed by medical examination Follow‐up: 12 months | 232 per 1000 | 120 per 1000 (63 to 229) | RR 0.52 (0.27 to 0.99) | 186 (2 studies) | ⊕⊕⊕⊝ moderate1 | |
| Incidence of right upper extremity disorder Questionnaire followed by medical examination Follow‐up: 12 months | 174 per 1000 | 127 per 1000 (56 to 289) | RR 0.73 (0.32 to 1.66) | 181 (2 studies) | ⊕⊕⊕⊝ moderate1 | |
| Neck or shoulder discomfort score Questionnaire Follow‐up: 12 months | The mean neck or shoulder discomfort score in the intervention groups was 0.41 standard deviations lower (0.69 to 0.12 lower) 4 | 194 (2 studies) | ⊕⊕⊝⊝ low2,3 | SMD −0.41 (−0.69 to −0.12) clinically meaningful difference | ||
| Right upper extremity discomfort score Questionnaire Follow‐up: 12 months | The mean right upper extremity discomfort score in the intervention groups was 0.34 standard deviations lower (0.63 to 0.06 lower)4 | 194 (2 studies) | ⊕⊕⊝⊝ low2,3 | SMD −0.34 (−0.63 to −0.06) clinically meaningful difference | ||
| Work related function | no data | no data | ||||
| *The basis for the assumed risk (e.g. the median control group risk across studies) is provided in footnotes. The corresponding risk (and its 95% CI) is based on the assumed risk in the comparison group and the relative effect of the intervention (and its 95% CI). CI: confidence interval; RR: risk ratio; VDU: visual display unit;SMD: standardised mean difference | ||||||
| GRADE Working Group grades of evidence High quality: Further research is very unlikely to change our confidence in the estimate of effect. Moderate quality: Further research is likely to have an important impact on our confidence in the estimate of effect and may change the estimate. Low quality: Further research is very likely to have an important impact on our confidence in the estimate of effect and is likely to change the estimate. Very low quality: We are very uncertain about the estimate. | ||||||
1 Downgraded one level because the total number of participants is less than 300 (small sample size for a categorical variable). 2 Downgraded one level because total number of participants is less than 400 (small sample size for a continuous variable). 3 Downgraded one level because of study limitations (measure of outcome was based on subjective symptoms (detection bias)). 4 Lower discomfort score indicates beneficial effects.
Summary of findings 2. Arm support with conventional mouse versus conventional mouse alone.
| Patient or population: office workers Settings: VDU users (more than 20 hours per week) Intervention: arm support board (with conventional computer mouse) Comparison: no arm support board (with conventional mouse) | ||||||
| Outcomes | Illustrative comparative risks* (95% CI) | Relative effect (95% CI) | No of Participants (studies) | Quality of the evidence (GRADE) | Comments | |
| Assumed risk | Corresponding risk | |||||
| No arm support board (with conventional mouse) | Arm support board (with conventional mouse) | |||||
| Incidence of upper body disorders Questionnaire followed by medical examination Follow‐up: 12 months | 333 per 1000 | 290 per 1000 (140 to 600) | RR 0.87 (0.42 to 1.80) | 191 (2 studies) | ⊕⊕⊝⊝ low1,2 | |
| Incidence of neck or shoulder disorder Questionnaire followed by medical examination Follow‐up: 12 months | 232 per 1000 | 211 per 1000 (28 to 1000) | RR 0.91 (0.12 to 6.98) | 186 (2 studies) | ⊕⊕⊝⊝ low1,2 | |
| Incidence of right upper extremity disorders Questionnaire followed by medical examination Follow‐up: 12 months | 185 per 1000 | 195 per 1000 (116 to 308) | OR 1.07 (0.58 to 1.96) | 178 (2 studies) | ⊕⊕⊕⊝ moderate2 | |
| Neck or shoulder discomfort score Questionnaire Follow‐up: 12 months | The mean neck or shoulder discomfort score in the intervention groups was 0.02 standard deviations higher (0.26 lower to 0.3 higher) 5 | 195 (2 studies) | ⊕⊕⊝⊝ low2,3 | SMD 0.02 (−0.26 to 0.30) ‐ no significant difference | ||
| Right upper extremity discomfort score Questionnaire Follow‐up: median 12 months | The mean right upper extremity discomfort score in the intervention groups was 0.07 standard deviations lower (0.35 lower to 0.22 higher) 5 | 195 (2 studies) | ⊕⊕⊝⊝ low2,3 | SMD −0.07 (−0.35 to 0.22) ‐ no significant difference | ||
|
Right upper‐limb strain scale Questionnaire Follow‐up: 6 weeks |
The mean right upper‐limb strain scale in the intervention groups was 3.00 lower (34.47 lower to 28.47 higher) 5 |
14 (1 study) |
⊕⊝⊝⊝ very low2,3,4 | |||
| Work related function | no data | no data | ||||
| *The basis for the assumed risk (e.g. the median control group risk across studies) is provided in footnotes. The corresponding risk (and its 95% confidence interval) is based on the assumed risk in the comparison group and the relative effect of the intervention (and its 95% CI). CI: Confidence interval; RR: Risk ratio; OR: Odds ratio; SMD: standardised mean difference; MD: mean difference | ||||||
| GRADE Working Group grades of evidence High quality: Further research is very unlikely to change our confidence in the estimate of effect. Moderate quality: Further research is likely to have an important impact on our confidence in the estimate of effect and may change the estimate. Low quality: Further research is very likely to have an important impact on our confidence in the estimate of effect and is likely to change the estimate. Very low quality: We are very uncertain about the estimate. | ||||||
1 Downgraded one level because of high I² value (more than 50%), indicating heterogeneity. 2 Downgraded one level because of total number of participants less than 300 (small sample size for a categorical variable). 3 Downgraded one level because of limitations in studies (measure of outcome based on subjective symptoms (detection bias)). 4 Downgraded one level because of there is no information on sequence generation (selection bias). 5 Lower score indicates beneficial effects.
Summary of findings 3. Alternative mouse alone versus conventional mouse alone.
| Patient or population: office workers Settings: VDU users (more than 20 hours per week) Intervention: alternative computer mouse alone (no arm support) Comparison: conventional mouse alone (no arm support) | ||||||
| Outcomes | Illustrative comparative risks* (95% CI) | Relative effect (95% CI) | No of Participants (studies) | Quality of the evidence (GRADE) | Comments | |
| Assumed risk | Corresponding risk | |||||
| Conventional mouse alone (no arm support) | Alternative mouse alone (no arm support) | |||||
| Incidence of upper body disorder (neck, shoulder and upper extremity) Questionnaire followed by medical examination Follow‐up: 12 months | 333 per 1000 | 263 per 1000 (173 to 403) | RR 0.79 (0.52 to 1.21) | 190 (2 studies) | ⊕⊕⊕⊝ moderate1 | |
| Incidence of neck or shoulderdisorder Questionnaire followed by medical examination Follow‐up: 12 months | 232 per 1000 | 144 per 1000 (44 to 463) | RR 0.62 (0.19 to 2) | 182 (2 studies) | ⊕⊕⊝⊝ low1,2 | |
| Incidence of right upper extremity disorder Questionnaire followed by medical examination Follow‐up: 12 months | 185 per 1000 | 168 per 1000 (89 to 318) | RR 0.91 (0.48 to 1.72) | 182 (2 studies) | ⊕⊕⊕⊝ moderate1 | |
| Neck or shoulder discomfort score Questionnaire Follow‐up: 12 months | The mean neck or shoulder discomfort score in the intervention groups was 0.04 standard deviations higher (0.26 lower to 0.33 higher) 5 | 195 (2 studies) | ⊕⊕⊝⊝ low3,4 | SMD 0.04 (−0.26 to 0.33) ‐ no significant difference | ||
| Right upper extremity discomfort score Questionnaire Follow‐up: 12 months | The mean rt upper extremity discomfort score in the intervention groups was 0 standard deviations higher (0.28 lower to 0.28 higher) 5 | 195 (2 studies) | ⊕⊕⊝⊝ low3,4 | SMD 0 (−0.28 to 0.28) ‐ no significant difference | ||
| Work related function | no data | no data | ||||
| *The basis for the assumed risk (e.g. the median control group risk across studies) is provided in footnotes. The corresponding risk (and its 95% confidence interval) is based on the assumed risk in the comparison group and the relative effect of the intervention (and its 95% CI). CI: Confidence interval; RR: Risk ratio; SMD: standardised mean difference | ||||||
| GRADE Working Group grades of evidence High quality: Further research is very unlikely to change our confidence in the estimate of effect. Moderate quality: Further research is likely to have an important impact on our confidence in the estimate of effect and may change the estimate. Low quality: Further research is very likely to have an important impact on our confidence in the estimate of effect and is likely to change the estimate. Very low quality: We are very uncertain about the estimate. | ||||||
1 Downgraded one level because total number of participants less than 300 (small sample size for a categorical variable). 2 Downgraded one level because high I² value (over 50%), indicating heterogeneity. 3 Downgraded one level because limitations in studies (measure of outcome based on subjective symptoms (detection bias)). 4 Downgraded one level because total number of participants less than 400 (small sample size for a continuous variable). 5 Lower discomfort score indicates beneficial effects.
Summary of findings 4. Alternative workstation adjustment compared to no workstation adjustment.
| Patient or population: office workers Settings: administrative work Intervention: alternative workstation adjustment intervention Comparison: no workstation adjustment | ||||||
| Outcomes | Illustrative comparative risks* (95% CI) | Relative effect (95% CI) | No of Participants (studies) | Quality of the evidence (GRADE) | Comments | |
| Assumed risk | Corresponding risk | |||||
| No workstation adjustment | Alternative workstation adjustment intervention | |||||
| Neck or shoulder symptoms Questionnaire Follow‐up: 6 months | 314 per 1000 | 248 per 1000 | RR 1.08 (0.73 to 1.59) | 254 (1 study) | ⊕⊝⊝⊝ very low1,2,3 | |
| Arm or hand pain or discomfort questionnaire Follow‐up: 6 months | 175 per 1000 | 210 per 1000 | RR 0.83 (0.50 to 1.19) | 245 (1 study) | ⊕⊝⊝⊝ very low1,2,3 | |
| Intensity or severity of musculoskeletal pain | no data | no data | ||||
| Work related function | no data | no data | ||||
| *The basis for the assumed risk (e.g. the median control group risk across studies) is provided in footnotes. The corresponding risk (and its 95% confidence interval) is based on the assumed risk in the comparison group and the relative effect of the intervention (and its 95% CI). CI: Confidence interval; HR: Hazard ratio; | ||||||
| GRADE Working Group grades of evidence High quality: Further research is very unlikely to change our confidence in the estimate of effect. Moderate quality: Further research is likely to have an important impact on our confidence in the estimate of effect and may change the estimate. Low quality: Further research is very likely to have an important impact on our confidence in the estimate of effect and is likely to change the estimate. Very low quality: We are very uncertain about the estimate. | ||||||
1 Downgraded one level because of limitations in studies (high risk of bias due to large dropout rate). 2 Downgraded one level because only one study available and thus inconsistency cannot be assessed. 3 Downgraded one level because total number of events (symptoms) is less than 300.
Summary of findings 5. Workstation adjustment according to OSHA/NIOSH recommendation compared to no workstation adjustment.
| Patient or population: office workers Settings: office Intervention: workstation adjustment according to Occupational Safety and Health Administration (OSHA)/Nastinal Institute of Occupational Safety and Health (NIOSH) recommendation Comparison: no workstation adjustment | ||||||
| Outcomes | Illustrative comparative risks* (95% CI) | Relative effect (95% CI) | No of Participants (studies) | Quality of the evidence (GRADE) | Comments | |
| Assumed risk | Corresponding risk | |||||
| No workstation adjustment | Workstation adjustment according to OSHA/NIOSH recommendation | |||||
| Neck or shoulder symptoms questionnaire Follow‐up: 6 months | 295 per 1000 | 248 per 1000 | RR 1.19 (0.79 to 1.79) | 255 (1 study) | ⊕⊝⊝⊝ very low1,2,3 | |
| Arm or hand symptoms Ouestionnaire Follow‐up: 6 month | 192 per 1000 | 210 per 1000 | RR 0.92 (0.56 to 1.50) | 249 (1 study) | ⊕⊝⊝⊝ very low1,2,3, | |
| Intensity or severity of musculoskeletal pain | no data | no data | ||||
| Work related function | no data | no data | ||||
| *The basis for the assumed risk (e.g. the median control group risk across studies) is provided in footnotes. The corresponding risk (and its 95% confidence interval) is based on the assumed risk in the comparison group and the relative effect of the intervention (and its 95% CI). CI: Confidence interval; HR: Hazard ratio | ||||||
| GRADE Working Group grades of evidence High quality: Further research is very unlikely to change our confidence in the estimate of effect. Moderate quality: Further research is likely to have an important impact on our confidence in the estimate of effect and may change the estimate. Low quality: Further research is very likely to have an important impact on our confidence in the estimate of effect and is likely to change the estimate. Very low quality: We are very uncertain about the estimate. | ||||||
1 Downgraded one level because of high risk of bias due to high dropout rate. 2 Downgraded one level because of small sample size (only one study available and thus inconsistency cannot be assessed). 3 Downgraded one level because total number of events (symptoms) is less than 300.
Summary of findings 6. Sit‐stand workstation versus normal workstation.
| Patient or population: office workers Settings: office setting Intervention: sit‐stand workstation versus normal workstation | ||||||
| Outcomes | Illustrative comparative risks* (95% CI) | Relative effect (95% CI) | No of Participants (studies) | Quality of the evidence (GRADE) | Comments | |
| Assumed risk | Corresponding risk | |||||
| Normal workstation | Sit‐stand workstation | |||||
| Incidence or prevalence of musculoskeletal disorders | no data | no data | ||||
| Intensity of neck and shoulder discomfort and pain Self‐reported questionnaire Follow‐up: 8 weeks | The mean discomfort and pain score was 1.9 | The mean intensity of neck and shoulder discomfort and pain in the intervention groups was 0.3 lower (1.69 lower to 1.09 higher)5 | 46 (1 study) | ⊕⊝⊝⊝ very low1,2,3,4 | ||
| Work related function | no data | no data | ||||
| *The basis for the assumed risk (e.g. the median control group risk across studies) is provided in footnotes. The corresponding risk (and its 95% confidence interval) is based on the assumed risk in the comparison group and the relative effect of the intervention (and its 95% CI). CI: Confidence interval; | ||||||
| GRADE Working Group grades of evidence High quality: Further research is very unlikely to change our confidence in the estimate of effect. Moderate quality: Further research is likely to have an important impact on our confidence in the estimate of effect and may change the estimate. Low quality: Further research is very likely to have an important impact on our confidence in the estimate of effect and is likely to change the estimate. Very low quality: We are very uncertain about the estimate. | ||||||
1 Downgraded one level because the allocation of participants to the intervention and control arm were not concealed. 2 Downgraded one level because of limitations in studies (measured of outcome was based on subjective symptoms (detection bias)). 3 Downgraded one level because of limitations in studies (lack of prognostic balance: male/female participants were not distributed equally between intervention and control group). 4 Downgraded one level because of small number of participants (less than 400) in analysis using continuous variables. 5 Lower discomfort score indicates beneficial effects.
Summary of findings 7. Supplementary breaks versus normal breaks.
| Patient or population: office workers Settings: office setting Intervention: supplementary breaks versus normal breaks | ||||||
| Outcomes | Illustrative comparative risks* (95% CI) | Relative effect (95% CI) | No of Participants (studies) | Quality of the evidence (GRADE) | Comments | |
| Assumed risk | Corresponding risk | |||||
| Normal breaks | Supplementary breaks | |||||
| Incidence or prevalence of musculoskeletal disorders | no data | no data | ||||
| After shift discomfort rating for neck (range 1 to 5) Self‐reported questionnaire Follow‐up: 4‐8 weeks | Mean discomfort rating was 1.55 4 | The mean after shifts discomfort rating for neck (4‐8 weeks) in the intervention groups was 0.25 lower (0.40 to 0.11 lower)5 | 186 (2 studies) | ⊕⊝⊝⊝ very low1,2,3 | ||
| After shift discomfort rating for right shoulder or upper arm Self‐reported questionnaire Follow‐up: 4‐8 weeks | Mean discomfort rating was 1.55 4 | The mean after shifts discomfort ratings for right shoulder or upper arm (4‐8 weeks) in the intervention groups was 0.33 lower (0.46 to 0.19 lower)5 | 186 (2 studies) | ⊕⊝⊝⊝ very low1,2,3 | ||
| After shift discomfort rating for right forearm or wrist or hand Self‐reported questionnaire Follow‐up: 4‐8 weeks | Mean discomfort rating was 1.45 4 | The mean after shifts discomfort ratings for right forearm or wrist or hand (4‐8 weeks) in the intervention groups was 0.18 lower (0.29 to 0.08 lower)5 | 186 (2 studies) | ⊕⊝⊝⊝ very low1,2,3 | ||
| Work related function | no data | no data | ||||
| *The basis for the assumed risk (e.g. the median control group risk across studies) is provided in footnotes. The corresponding risk (and its 95% confidence interval) is based on the assumed risk in the comparison group and the relative effect of the intervention (and its 95% CI). CI: Confidence interval; | ||||||
| GRADE Working Group grades of evidence High quality: Further research is very unlikely to change our confidence in the estimate of effect. Moderate quality: Further research is likely to have an important impact on our confidence in the estimate of effect and may change the estimate. Low quality: Further research is very likely to have an important impact on our confidence in the estimate of effect and is likely to change the estimate. Very low quality: We are very uncertain about the estimate. | ||||||
1 Downgraded one level because of limitations in studies (possibility of carry‐over effects of cross‐over trials). 2 Downgraded one level because of limitations in studies (measured of outcome was based on subjective symptoms (detection bias)). 3 Downgraded one level because of small number of participants (less than 400) in analysis using continuous variables. 4 Taken from figure 1 in Galinsky 2007. 5 Lower discomfort rating indicates beneficial effect.
Summary of findings 8. Ergonomic training programme for preventing work‐related musculoskeletal disorders of the upper limb and neck in adults.
| Patient or population: office workers Settings: working 5 hours or more per week with a VDU Intervention: ergonomic training programme versus no training programme | ||||||
| Outcomes | Illustrative comparative risks* (95% CI) | Relative effect (95% CI) | No of Participants (studies) | Quality of the evidence (GRADE) | Comments | |
| Assumed risk | Corresponding risk | |||||
| Control | Ergonomic training program | |||||
|
Prevalence of Neck Musculoskeletal symptoms Questionnaire Follow‐up: at 6‐month |
196 per 1,000 |
149 per 1,000 (96 to 234) |
RR 0.76 (0.47 to 1.21) |
614 (2 studies) | ⊕⊕⊝⊝ low1,2 | |
|
Prevalence of shoulder musculoskeletal symptoms Questionnaire Follow‐up: 6‐10 month |
181 per 1,000 |
150 per 1,000 (107 to 212) |
RR 0.82 (0.59 to 1.17) |
614 (2 RCTs) | ⊕⊕⊝⊝ low1,2 | |
|
Prevalence of hand or wrist musculoskeletal symptoms Questionnaire Follow‐up: 6‐10 month |
75 per 1,000 |
47 per 1,000 (27 to 81) |
RR 0.63 (0.36 to 1.09) |
724 (2 studies) | ⊕⊕⊝⊝ low1,2 | |
|
Prevalence of neck or shoulder MSD Medical examination Follow‐up: 6‐month |
77 per 1,000 |
86 per 1,000 (46 to 161) |
RR 1.12 (0.60 to 2.09) |
455 (1 study) | ⊕⊕⊝⊝ low1,3 | |
|
Prevalence of hand or wrist MSD Medical examination Follow‐up: 6‐month |
14 per 1,000 |
24 per 1,000 (6 to 87) |
RR 1.73 (0.47 to 6.37) |
503 (1 study) | ⊕⊕⊝⊝ low1,3 | |
|
Intensity of upper extremity pain Questionnaire Follow‐up: 3‐week |
The mean intensity of upper extremity pain was 0 | MD 0.08 higher (0.22 lower to 0.38 higher) 4 | ‐ | 82 (1 study) | ⊕⊝⊝⊝ very low1,2,3 | |
|
Frequency of upper extremity pain Questionnaire Follow‐up: 3‐week |
The mean frequency of upper extremity pain was 0 | MD 0.03 lower (0.45 lower to 0.39 higher) 4 | ‐ | 82 (1 study) | ⊕⊝⊝⊝ very low1,2,3 | |
|
Duration of upper extremity pain Questionnaire Follow‐up: 3‐week |
The mean duration of upper extremity pain was 0 | MD 0.13 higher (0.25 lower to 0.51 higher) 4 | ‐ | 82 (1 study) | ⊕⊝⊝⊝ very low1,2,3 | |
| Work related function | no data | no data | ||||
| *The basis for the assumed risk (e.g. the median control group risk across studies) is provided in footnotes. The corresponding risk (and its 95% confidence interval) is based on the assumed risk in the comparison group and the relative effect of the intervention (and its 95% CI). CI: Confidence interval; RR: Risk ratio | ||||||
| GRADE Working Group grades of evidence High quality: Further research is very unlikely to change our confidence in the estimate of effect. Moderate quality: Further research is likely to have an important impact on our confidence in the estimate of effect and may change the estimate. Low quality: Further research is very likely to have an important impact on our confidence in the estimate of effect and is likely to change the estimate. Very low quality: We are very uncertain about the estimate. | ||||||
1 Downgraded one level because of limitations in studies (there is no information on sequence generation (selection bias)). 2 Downgraded one level because of limitations in studies (measured of outcome was based on subjective symptoms (detection bias)). 3 Downgraded one level because only one study available and thus inconsistency cannot be assessed. 4 Lower score indicates beneficial effect.
Summary of findings 9. Biofeedback (vibration) to reduce hand idle time on mouse versus no intervention.
| Patient or population: office workers Settings: working in the office environment with a computer for at least 4 h/day Intervention: biofeedback (vibration) to reduce hand idle time on mouse versus no intervention | ||||||
| Outcomes | Illustrative comparative risks* (95% CI) | Relative effect (95% CI) | No of Participants (studies) | Quality of the evidence (GRADE) | Comments | |
| Assumed risk | Corresponding risk | |||||
| Control | Biofeedback (vibration) to reduce hand idle time on mouse versus no intervention | |||||
| Incidence or prevalence of musculoskeletal disorders | no data | no data | ||||
| Shoulder pain intensity Questionnaire survey Follow‐up: 25 weeks | The mean shoulder pain intensity in the control groups was 1.58 | The mean shoulder pain intensity in the intervention groups was 0.79 lower (2.57 lower to 0.99 higher)4 | 23 (1 study) | ⊕⊕⊝⊝ low1,2,3 | ||
| Upper extremity pain intensity Self‐administered questionnaire Follow‐up: 25 weeks | The mean upper extremity pain intensity in the control groups was 2.94 | The mean upper extremity pain intensity in the intervention groups was 1.64 lower (6.85 lower to 3.57 higher) 4 | 23 (1 study) | ⊕⊕⊝⊝ low1,2,3 | ||
| Work related function | no data | no data | ||||
| *The basis for the assumed risk (e.g. the median control group risk across studies) is provided in footnotes. The corresponding risk (and its 95% confidence interval) is based on the assumed risk in the comparison group and the relative effect of the intervention (and its 95% CI). CI: Confidence interval | ||||||
| GRADE Working Group grades of evidence High quality: Further research is very unlikely to change our confidence in the estimate of effect. Moderate quality: Further research is likely to have an important impact on our confidence in the estimate of effect and may change the estimate. Low quality: Further research is very likely to have an important impact on our confidence in the estimate of effect and is likely to change the estimate. Very low quality: We are very uncertain about the estimate. | ||||||
1 Downgraded one level because of limitations in studies (measure of outcome based on subjective symptoms (detection bias)). 2 Downgraded one level because of total number of participants less than 400 (small sample size for a continuous variable). 3 Downgraded one level because of imprecision (95% confidence interval includes no effect). 4 Lower score indicate beneficial effect.
1. Physical ergonomic interventions
We found five studies that evaluated the effectiveness of interventions involving physical ergonomic interventions (Conlon 2008; Gerr 2005; Graves 2015; Lintula 2001; Rempel 2006) .
1.1 Arm support with an alternative computer mouse versus conventional mouse alone
1.1.1 Outcome: incidence of neck or shoulder disorders and severity/intensity of neck or shoulder discomfort at 12‐month follow‐up
We found low‐quality evidence, based on two studies (Conlon 2008; Rempel 2006), that the use of an arm support together with an alternative mouse decreased neck or shoulder discomfort scores when compared to using a conventional mouse alone (standardised mean difference (SMD) −0.41; 95% confidence interval (CI) −0.69 to −0.12; Analysis 1.1). In the same two studies, there is moderate‐quality evidence that using an arm support with an alternative mouse decreased the incidence of neck or shoulder disorders (risk ratio (RR) 0.52; 95% CI 0.27 to 0.99; Analysis 1.2) when compared with using a conventional mouse alone.
1.1. Analysis.
Comparison 1 An arm support together with an alternative mouse versus a conventional mouse alone, Outcome 1 Neck/shoulder discomfort score at 12‐month follow‐up.
1.2. Analysis.
Comparison 1 An arm support together with an alternative mouse versus a conventional mouse alone, Outcome 2 Incidence of neck/shoulder disorder at 12‐month follow‐up.
1.1.2 Outcome: incidence of right upper limb disorders and severity/intensity of right upper limb discomfort at 12‐month follow‐up
We found low‐quality evidence, from two studies (Conlon 2008; Rempel 2006), that the use of an arm support together with an alternative mouse decreased right upper limb discomfort scores when compared to using a conventional mouse alone (SMD −0.34; 95% CI −0.63 to −0.06; Analysis 1.3). However, the same two studies provided moderate‐quality evidence which showed no considerable difference between the interventions in the incidence of right upper limb disorders (RR 0.73; 95% CI 0.32 to 1.66; Analysis 1.4).
1.3. Analysis.
Comparison 1 An arm support together with an alternative mouse versus a conventional mouse alone, Outcome 3 Right upper extremity discomfort score at 12‐month follow‐up.
1.4. Analysis.
Comparison 1 An arm support together with an alternative mouse versus a conventional mouse alone, Outcome 4 Incidence of right upper limb disorder at 12‐month follow‐up.
1.1.3 Outcome: incidence of upper body disorders at 12‐month follow‐up
We found moderate‐quality evidence, from two studies (Conlon 2008; Rempel 2006), that there is no considerable difference in the incidence of upper body disorders (RR 0.66; 95% CI 0.42 to 1.04; Analysis 1.5) between the group that used an arm support together with an alternative mouse and the group that used a conventional mouse alone.
1.5. Analysis.
Comparison 1 An arm support together with an alternative mouse versus a conventional mouse alone, Outcome 5 Incidence of upper body disorders (neck, shoulder, and upper limb) at 12‐month follow‐up.
1,1,4 Outcome: work‐related function
Data is not available for this outcome measure.
1.1.5 Outcome: change in productivity (secondary outcome)
In one study, Rempel 2006, an arm support together with an alternative mouse produced no significant difference in company‐tracked productivity when compared to using a conventional mouse alone, measured as change in percentage of work time (mean difference (MD) −0.10; 95% CI −5.09 to 4.89; Analysis 1.6), average time it takes to completely process a call (MD 8.00; 95% CI −24.23 to 40.53; Analysis 1.7), and calls per hour (MD −0.20; 95% CI −0.97 to 0.57; Analysis 1.8). The same study did, however, find an improvement in self‐perceived productivity with an arm support together with an alternative mouse compared to a conventional mouse alone (odds ratio (OR) 2.33; 95% CI 1.01 to 5.41; Analysis 1.9).
1.6. Analysis.
Comparison 1 An arm support together with an alternative mouse versus a conventional mouse alone, Outcome 6 Change in percentage of work time.
1.7. Analysis.
Comparison 1 An arm support together with an alternative mouse versus a conventional mouse alone, Outcome 7 Change in average time to completely process a call.
1.8. Analysis.
Comparison 1 An arm support together with an alternative mouse versus a conventional mouse alone, Outcome 8 Change in calls per hour.
1.9. Analysis.
Comparison 1 An arm support together with an alternative mouse versus a conventional mouse alone, Outcome 9 Subject perceived improvement.
1.2 Arm support with a conventional mouse versus conventional mouse alone
1.2.1 Outcome: severity/intensity of neck‐shoulder‐arm musculoskeletal strain at 6‐week follow‐up
We found very low‐quality evidence, based on one study (Lintula 2001), of no considerable change in self‐reported musculoskeletal strain with the use of an arm support versus no arm support (MD −3.00; 95% CI −34.47 to 28.47; Analysis 2.1).
2.1. Analysis.
Comparison 2 An arm support together with a conventional mouse versus a conventional mouse alone, Outcome 1 Right upper‐limb strain scale at 6‐week follow‐up.
1.2.2 Outcome: incidence of neck‐shoulder disorderand severity/intensity of neck‐shoulder discomfort at 12‐month follow‐up
We found low‐quality evidence, based on two studies (Conlon 2008; Rempel 2006), that there is no considerable difference in neck or shoulder discomfort scores when using an arm support with a conventional mouse versus using a conventional mouse alone (SMD 0.02; 95% CI −0.26 to 0.30; Analysis 2.2). The same two studies also produced inconsistent evidence that there is no considerable difference in the incidence of neck or shoulder disorders (RR 0.91; 95% CI 0.12 to 6.98; Analysis 2.3), but the heterogeneity between the two studies was high (I² = 86%), with one study showing a beneficial effect and one study showing a harmful effect. The outcome was included in the meta‐analysis although the heterogeneity was found to be high, as the other outcome measures from the two studies have been included in meta analysis in the other sections and was found to have low heterogeneity.
2.2. Analysis.
Comparison 2 An arm support together with a conventional mouse versus a conventional mouse alone, Outcome 2 Neck/shoulder discomfort score.
2.3. Analysis.
Comparison 2 An arm support together with a conventional mouse versus a conventional mouse alone, Outcome 3 Incidence of neck/shoulder disorder.
1.2.3 Outcome: incidence of right upper limb disorder and severity/intensity of right upper limb discomfort at 12‐month follow‐up
We found low‐quality evidence, based on two studies (Conlon 2008; Rempel 2006), that there is no considerable difference in right upper limb discomfort score when using an arm support with a conventional mouse versus using a conventional mouse alone (SMD −0.07; 95% CI −0.35 to 0.22; Analysis 2.4). The same two studies also produced moderate‐quality evidence of no difference between the interventions in the incidence of right upper limb disorders (RR 1.07; 95% CI 0.58 to 1.96; Analysis 2.5).
2.4. Analysis.
Comparison 2 An arm support together with a conventional mouse versus a conventional mouse alone, Outcome 4 Right upper extremity discomfort score.
2.5. Analysis.
Comparison 2 An arm support together with a conventional mouse versus a conventional mouse alone, Outcome 5 Incidence of right upper extremity disorders.
1.2.4 Outcome: incidence of upper body disorder (neck, shoulder, and upper limb) at 12‐month follow‐up
We found moderate‐quality evidence, based on two studies (Conlon 2008; Rempel 2006), that there is no considerable difference in neck, shoulder, or upper limb disorders when using an arm support with a conventional mouse versus using a conventional mouse alone (RR 0.87; 95% CI 0.42 to 1.80; Analysis 2.6).
2.6. Analysis.
Comparison 2 An arm support together with a conventional mouse versus a conventional mouse alone, Outcome 6 Incidence of upper body disorders (neck, shoulder and upper limb).
1,2,5 Outcome: work‐related function
Data is not available for this outcome measure.
1.2.6 Outcome: change in productivity (secondary outcome)
One study, Rempel 2006, reported that there is no difference in company‐tracked productivity, measured as change in percentage of work time (MD 0.40; 95% CI −3.50 to 4.30; Analysis 2.7) or calls per hour (MD −0.30; 95% CI −0.92 to 0.32; Analysis 2.9) when using an arm support with a conventional mouse versus using a conventional mouse alone. However, the company‐tracked average time to process a call was shorter (MD 29.00; 95% CI 3.80 to 54.20; Analysis 2.8) and self‐perceived productivity improved (OR 2.92; 95% CI 1.25 to 6.81 Analysis 2.10) when using an arm support with a conventional mouse versus using a conventional mouse alone.
2.7. Analysis.
Comparison 2 An arm support together with a conventional mouse versus a conventional mouse alone, Outcome 7 Change in percentage of work time.
2.9. Analysis.
Comparison 2 An arm support together with a conventional mouse versus a conventional mouse alone, Outcome 9 Change in calls per hour.
2.8. Analysis.
Comparison 2 An arm support together with a conventional mouse versus a conventional mouse alone, Outcome 8 Change in average time to completely process a call.
2.10. Analysis.
Comparison 2 An arm support together with a conventional mouse versus a conventional mouse alone, Outcome 10 Subject perceived improvement.
1.3 Arm support for both arms versus no arm support
1.3.1 Outcome: Incidence or prevalence of musculoskeletal disorders (MSDs)
Data is not available for this outcome measure.
1.3.2 Outcome: severity/intensity of neck‐shoulder‐arm musculoskeletal strain at 6‐week follow‐up
We found very low‐quality evidence, based on one study (Lintula 2001), that there is no considerable change in self‐reported musculoskeletal strain when using an arm support for both arms versus not using one (MD 3.00; 95% CI −19.29 to 25.29; Analysis 3.1).
3.1. Analysis.
Comparison 3 Arm support for both arms versus no arm support, Outcome 1 Right upper‐limb strain scale at 6‐week follow‐up.
1,3,3 Outcome: work‐related function
Data is not available for this outcome measure.
1.3.4 Outcome: secondary outcome
Data is not available for this outcome measure.
1.4 Alternative mouse versus conventional mouse
1.4.1 Outcome: incidence of neck or shoulder disorder and severity/intensity of neck or shoulder discomfort at 12‐month follow‐up
We found low‐quality evidence, based on two studies (Conlon 2008; Rempel 2006), that there is no considerable difference in neck or shoulder discomfort scores when using an alternative mouse versus using a conventional mouse (SMD 0.04; 95% CI −0.26 to 0.33; Analysis 4.1). The same two studies reported no considerable difference in the incidence of neck or shoulder disorders (RR 0.62; 95% CI 0.19 to 2.00; Analysis 4.2) but the heterogeneity between the studies was high (I² = 53%).
4.1. Analysis.
Comparison 4 An alternative mouse alone versus a conventional mouse alone, Outcome 1 Neck/shoulder discomfort score.
4.2. Analysis.
Comparison 4 An alternative mouse alone versus a conventional mouse alone, Outcome 2 Incidence of neck/shoulder disorder.
1.4.2 Outcome: incidence of right upper limb disorder and severity/intensity of right upper limb discomfort at 12‐month follow‐up
We found low‐quality evidence, based on two studies (Conlon 2008; Rempel 2006), that there is no difference in right upper limb discomfort scores when using an alternative mouse versus using a conventional mouse (SMD 0.00; 95% CI −0.28 to 0.28; Analysis 4.4). For the same two studies there is no difference in right upper limb disorders (RR 0.91; 95% CI 0.48 to 1.72; Analysis 4.3).
4.4. Analysis.
Comparison 4 An alternative mouse alone versus a conventional mouse alone, Outcome 4 Right upper extremity discomfort score.
4.3. Analysis.
Comparison 4 An alternative mouse alone versus a conventional mouse alone, Outcome 3 Incidence of right upper extremity disorder.
1.4.3 Outcome: incidence of upper body disorder at 12‐month follow‐up
We found moderate‐quality evidence, based on two studies (Conlon 2008; Rempel 2006), that there is no difference in upper body disorders when using an alternative mouse versus using a conventional mouse (RR 0.79; 95% CI 0.52 to 1.21; Analysis 4.5).
4.5. Analysis.
Comparison 4 An alternative mouse alone versus a conventional mouse alone, Outcome 5 Incidence of upper body disorder (neck, shoulder, and upper extremity).
1,4,4 Outcome: work‐related function
Data is not available for this outcome measure.
1.4.5 Outcome: change in productivity (secondary outcome)
One study, Rempel 2006, found no difference in company‐tracked productivity, measured as change in percentage of working time (MD 2.74; 95% CI −1.04 to 6.52; Analysis 4.6), average time it takes to process a call (MD 15.00; 95% CI −7.21 to 37.21; Analysis 4.7), and calls per hour (MD 0.20; 95% CI −0.38 to 0.78; Analysis 4.8). However, self‐perceived productivity improved when using an alternative mouse versus using a conventional mouse (OR 2.33; 95% CI 1.01 to 5.41 Analysis 4.9).
4.6. Analysis.
Comparison 4 An alternative mouse alone versus a conventional mouse alone, Outcome 6 Change in percentage of work time.
4.7. Analysis.
Comparison 4 An alternative mouse alone versus a conventional mouse alone, Outcome 7 Change in average time to completely process a call.
4.8. Analysis.
Comparison 4 An alternative mouse alone versus a conventional mouse alone, Outcome 8 Change in calls per hour.
4.9. Analysis.
Comparison 4 An alternative mouse alone versus a conventional mouse alone, Outcome 9 Subject perceived improvement.
1.5 Workstation adjustment versus usual arrangement
1.4.1 Outcome: Incidence or prevalence of musculoskeletal disorders (MSDs)
Data is not available for this outcome measure.
1.5.2 Outcome: severity/intensity of neck or shoulder symptoms at one‐week follow‐up
We found very low‐quality evidence, based on one study (Gerr 2005), that there is no difference in neck or shoulder symptoms when using an alternative workstation adjustment versus no intervention (RR 1.08; 95% CI 0.73 to 1.59; Analysis 5.1), or when using the Occupational Safety and Health Administration (OSHA), United State Department of Labour or the National Institute of Occupational Safety and Health (NIOSH), Center of Disease Control and Prevention prescribed workstation adjustment versus no intervention (RR 1.19; 95% CI 0.79 to 1.78; Analysis 6.1).
5.1. Analysis.
Comparison 5 An alternative workstation adjustment versus no adjustment, Outcome 1 Incidence of neck and shoulder pain.
6.1. Analysis.
Comparison 6 Workstation adjustment according to OSHA/NIOSH recommendation compared to no workstation adjustment, Outcome 1 Incidence of neck and shoulder pain.
1.5.3 Outcome: severity/intensity of hand or arm symptoms at one‐week follow‐up
We found very low‐quality evidence, based on one study (Gerr 2005), that there is no difference in hand or arm symptoms when using an alternative workstation adjustment versus no intervention (RR 0.83; 95% CI 0.50 to 1.39; Analysis 5.2), or when using OSHA or NIOSH prescribed workstation adjustment versus no intervention (RR 0.92; 95 % CI 0.56 to 1.50; Analysis 6.2).
5.2. Analysis.
Comparison 5 An alternative workstation adjustment versus no adjustment, Outcome 2 Incidence of arm and hand pain.
6.2. Analysis.
Comparison 6 Workstation adjustment according to OSHA/NIOSH recommendation compared to no workstation adjustment, Outcome 2 Incidence of arm and hand pain.
1,5,4 Outcome: work‐related function
Data is not available for this outcome measure.
1.5.5 Outcome: overall compliance to all components of intervention (secondary outcome)
We found very low‐quality evidence, based on one study (Gerr 2005), that the overall compliance with all components of the alternative workstation adjustment was attained in 25.4% to 31.9% of participants at different times of the intervention. The same study provided very low‐quality evidence showing that the overall compliance with all components of the OSHA or NIOSH prescribed workstation adjustment was attained in 37.6% to 42.4% of participants at different times of the intervention.
1.6 Sit‐stand workstation versus sitting desk
1.6.1 Outcome: Incidence or prevalence of musculoskeletal disorders (MSDs)
Data is not available for this outcome measure.
1.6.2 Outcome: severity/intensity of neck and shoulder discomfort at eight‐week follow‐up
We found low‐quality evidence, based on one study (Graves 2015), that using a sit‐stand workstation produced no difference in neck and shoulder discomfort and pain score when compared with usual working conditions (−0.30; 95% CI −1.69 to 1.09; Analysis 7.1).
7.1. Analysis.
Comparison 7 Sit‐stand workstation versus normal workstation, Outcome 1 Intensity of neck and shoulder discomfort and pain.
1,6,3 Outcome: work‐related function
Data is not available for this outcome measure.
1.6.4 Outcome: compliance with intervention (secondary outcome)
One study, Graves 2015, found that the intervention group recorded less sitting time at eight weeks' follow‐up when compared to baseline. Sitting time was 385.9 (SD 57.6) minutes per eight‐hour workday at baseline, versus 322.0 (SD 99.3) minutes at eight weeks' follow‐up (MD −80.20 (95% CI −125.66 to −34.74; Analysis 7.2).
7.2. Analysis.
Comparison 7 Sit‐stand workstation versus normal workstation, Outcome 2 Sitting time at 8‐week.
2. Organisational ergonomic interventions
2.1 Supplementary breaks versus conventional breaks
2.1.1 Outcome: Incidence or prevalence of musculoskeletal disorders (MSDs)
Data is not available for this outcome measure.
2.1.2 Outcome: severity/intensity of neck, right shoulder or upper arm discomfort at two‐month follow‐up
We included data from two studies in this meta‐analysis (Galinsky 2000; Galinsky 2007). We could not enter the data from one study, McLean 2001, into a meta‐analysis as the authors reported no measure of variance and this could not be calculated from the information provided.
We found very low‐quality evidence, based on two studies (Galinsky 2000; Galinsky 2007), that supplementary breaks significantly reduced the scores for neck discomfort (MD −0.25; 95% CI −0.40 to −0.11; Analysis 8.1) and right shoulder or upper arm discomfort (MD −0.33; 95% CI −0.46 to −0.19; Analysis 8.2) when compared with conventional breaks.
8.1. Analysis.
Comparison 8 Supplementary breaks versus normal breaks, Outcome 1 After shift discomfort rating for neck (4‐8 weeks).
8.2. Analysis.
Comparison 8 Supplementary breaks versus normal breaks, Outcome 2 After shift discomfort rating for right shoulder or upper arm (4‐8 weeks).
2.1.3 Outcome: severity/intensity of forearm or wrist or hand discomfort at two‐month follow‐up
We found very low‐quality evidence, based on two studies (Galinsky 2000; Galinsky 2007), that supplementary breaks significantly reduced right forearm or wrist or hand discomfort scores when compared with conventional breaks (MD −0.18; 95% CI −0.29 to −0.08; Analysis 8.3).
8.3. Analysis.
Comparison 8 Supplementary breaks versus normal breaks, Outcome 3 After shift discomfort rating for right forearm or wrist or hand (4‐8 weeks).
2,1,4 Outcome: work‐related function
Data is not available for this outcome measure.
2.1.5 Outcome: change in productivity (secondary outcome)
Two studies reported no significant difference in productivity between supplementary breaks and conventional breaks (Galinsky 2000; McLean 2001). In Galinsky 2000, there is no significant difference between the two groups in productivity as measured by the mean number of keystrokes per hour and mean number of documents entered. In McLean 2001, there is no difference between the groups in productivity measured as the number of words typed.
2.2 Biofeedback mouse for regulating breaks versus no intervention
2.2.1 Outcome: Incidence or prevalence of musculoskeletal disorders (MSDs)
Data is not available for this outcome measure.
2.2.2 Outcome: severity/intensity of shoulder pain at 25‐week follow‐up
We found low‐quality evidence, based on one study (King 2013), that there is no difference in shoulder pain intensity scores when using a vibrating mouse versus no intervention (MD −0.79; 95% CI −2.57 to 0.99; Analysis 9.1).
9.1. Analysis.
Comparison 9 Biofeedback (vibration) to reduce hand idle time on mouse versus no intervention, Outcome 1 Shoulder Pain Intensity.
2.2.3 Outcome: severity/intensity of upper extremity pain at 25‐week follow‐up
We found low‐quality evidence, based on one study (King 2013), that there is no difference in upper extremity pain intensity scores when using a vibrating mouse versus no intervention (MD −1.64; 95% CI −6.85 to 3.57; Analysis 9.2).
9.2. Analysis.
Comparison 9 Biofeedback (vibration) to reduce hand idle time on mouse versus no intervention, Outcome 2 Upper Extremity Pain Intensity.
2,2,4 Outcome: work‐related function
Data is not available for this outcome measure.
2.2.3 Outcome: compliance with intervention (secondary outcome)
In one study (King 2013), the intervention group had a relatively higher use of the mouse compared to total computer use, however the results were not significant (MD 14.80%; 95% CI ‐6.27 to 35.87; Analysis 9.3).
9.3. Analysis.
Comparison 9 Biofeedback (vibration) to reduce hand idle time on mouse versus no intervention, Outcome 3 Relative Mouse Use over Total Computer Use.
3. Cognitive ergonomic interventions
We found no studies that specifically addressed the cognitive domain.
4. Training interventions
4.1 Participatory ergonomic training intervention versus no intervention
4.1.1 Outcome: Incidence of musculoskeletal disorders (MSDs)
Data is not available for this outcome measure.
4.1.2 Outcome: prevalence of neck/shoulder musculoskeletal symptoms (by questionnaire) at six‐month follow‐up
We found very low‐quality evidence, based on two studies (Baydur 2016; Brisson 1999), that an ergonomic training intervention produced no considerable change in shoulder pain compared with no intervention (RR 0.76; 95% CI 0.47 to 1.21; Analysis 10.1). Data from one study, Brisson 1999, on neck or shoulder pain, were was used twice for analysis of shoulder and neck symptoms separately. The two studies showed heterogeneity, which ranged from 40% to 68%, which may be explained by differences in duration of study (the study by Baydur and colleagues was 13 months in duration and that of Brisson and colleagues was only six months).
10.1. Analysis.
Comparison 10 Ergonomic training versus no intervention, Outcome 1 Prevalence of Neck Musculoskeletal symptoms (by questionnaire) at 6‐month follow‐up.
4.1.3 Outcome: prevalence of neck musculoskeletal symptoms (by questionnaire) at six‐month follow‐up
We found very low‐quality evidence, based on two studies (Baydur 2016; Brisson 1999), that an ergonomic training intervention produced no change in neck pain when compared with no intervention (RR 0.82; 95% CI 0.58 to 1.17; Analysis 10.2). For the study by Brisson 1999, we used the same data as those used in Analysis 8.1 and Analysis 8.2, as the study reported only the prevalence of neck and shoulder pain together and did not report them as a separate entity.
10.2. Analysis.
Comparison 10 Ergonomic training versus no intervention, Outcome 2 Prevalence of shoulder musculoskeletal symptoms (by questionnaire) at 6‐month follow‐up.
4.1.4 Outcome: prevalence of wrist/hand musculoskeletal symptoms (by questionnaire) at six‐month follow‐up
We found very low‐quality evidence, based on two studies (Baydur 2016; Brisson 1999), that an ergonomic training intervention produces no change in wrist or hand pain when compared with no intervention (RR 0.63; 95% CI 0.36 to 1.09; Analysis 10.3).
10.3. Analysis.
Comparison 10 Ergonomic training versus no intervention, Outcome 3 Prevalence of hand/wrist musculoskeletal symptoms (by questionnaire) at 6‐month follow‐up at 6‐month follow‐up.
4.1.5 Outcome: prevalence of neck or shoulder pain (by medical examination) at six‐month follow‐up
We found very low‐quality evidence, based on one study (Brisson 1999), that an ergonomic training intervention produced no change in neck or shoulder pain when compared with no intervention (RR 1.12; 95% CI 0.60 to 2.09; Analysis 10.4).
10.4. Analysis.
Comparison 10 Ergonomic training versus no intervention, Outcome 4 Prevalence of neck/shoulder MSD (by medical examination) at 6‐month follow‐up.
4.1.6 Outcome: prevalence of hand/wrist pain (by medical examination) at six‐month follow‐up
We found very low‐quality evidence, based on one study (Brisson 1999), that an ergonomic training intervention produced no change in wrist or hand pain when compared with no intervention (RR 1.73; 95% CI 0.47 to 6.37; Analysis 10.5).
10.5. Analysis.
Comparison 10 Ergonomic training versus no intervention, Outcome 5 Prevalence of hand/wrist MSD (by medical examination) at 6‐month follow‐up.
4.1.7 Outcome: prevalence of disability of shoulder at six‐month follow‐up
We found very low‐quality evidence, based on one study (Baydur 2016), that an ergonomic training intervention reduced disability of the shoulder based on the Quick DASH symptom severity score (OR 0.93; 95% CI 0.85 to 1.02) and Quick DASH work module score (OR 0.90; 95% CI 0.82 to 1.00) when compared with no intervention. The information for outcome 4.17 and 4.18 were obtained directly from the Baydur 2016 report, as the raw scores for disability and Quick DASH measure were not reported.
4.1.8 Outcome: prevalence of disability of neck at six‐month follow‐up
We found very low‐quality evidence, based on one study (Baydur 2016), that an ergonomic training intervention reduced disability of the neck, measured with the Northwick Part Neck Pain Score, when compared with no intervention (OR 0.90; 95% CI 0.82 to 0.98).
4.1.9 Outcome: compliance with intervention (secondary outcome)
We found very low‐quality evidence, based on one study (Brisson 1999), that compliance with the intervention was higher in participants under 40 years of age compared to participants over 40 years of age. The information was obtained directly from the Brisson 1999 report.
4.2 Participatory education intervention versus traditional education
4.2.1 Outcome: Incidence or prevalence of musculoskeletal disorders (MSDs)
Data is not available for this outcome measure.
4.2.2 Outcome: severity/intensity of upper body discomfortat 12‐month follow‐up
We could not combine results data from two studies — Bohr 2000 and Bohr 2002 — in a meta‐analysis as they did not report a measure of variance and it could not be calculated from the information provided. The authors only presented composite scores of pain or discomfort for the control, traditional and participatory education (Bohr 2000), and composite scores of pain or discomfort for the traditional and participatory education (Bohr 2002), at baseline and at 12‐month follow‐up.
4,2,3 Outcome: work‐related function
Data is not available for this outcome measure.
4.2.4 Outcome: compliance with intervention (secondary outcome)
We found very low‐quality evidence, based on the same two studies (Bohr 2000; Bohr 2002), that there were no significant differences between participatory education, traditional education and no intervention in terms of work area configuration, worker postures, or overall observation scores.
4.3 Active ergonomic training versus no intervention
4.3.1 Outcome: Incidence or prevalence of musculoskeletal disorders (MSDs)
Data is not available for this outcome measure.
4.3.2 Outcome: severity or intensity of upper extremity symptoms at three‐week follow‐up
We found very low‐quality evidence, based on one study (Greene 2005), that active ergonomic training produced no significant difference in upper extremity symptom intensity scale (0, mild pain to 4, worst ever) when compared with no intervention (MD 0.08; 95% CI −0.22 to 0.38; Analysis 10.6).
10.6. Analysis.
Comparison 10 Ergonomic training versus no intervention, Outcome 6 Intensity of upper extremity pain at 3‐week follow‐up.
4.3.3 Outcome: frequency of upper extremity symptoms at three‐week follow‐up
We found very low‐quality evidence, based on one study (Greene 2005), that active ergonomic training produced no significant difference in upper extremity symptom frequency scale (1, once per week to 4, daily in the past week) when compared with no intervention (MD −0.03; 95% CI −0.45 to 0.39; Analysis 10.7).
10.7. Analysis.
Comparison 10 Ergonomic training versus no intervention, Outcome 7 Frequency of upper extremity pain at 3‐week follow‐up.
4.3.4 Outcome: duration of upper extremity symptoms at three‐week follow‐up
We found very low‐quality evidence, based on one study (Greene 2005), that active ergonomic training produced no significant difference in upper extremity symptom duration scale (1, less than 1 hour to 4, more than 3 days to 1 week) when compared with no intervention (MD 0.13; 95% CI −0.25 to 0.51; Analysis 10.8).
10.8. Analysis.
Comparison 10 Ergonomic training versus no intervention, Outcome 8 Duration of upper extremity pain at 3‐week follow‐up.
4,3,5 Outcome: work‐related function
Data is not available for this outcome measure.
5. Multifaceted ergonomic interventions
5.1 Combined physical and organisational ergonomic intervention (work injury prevention program) versus no intervention
5.1.1 Outcome: Incidence or prevalence of musculoskeletal disorders (MSDs)
Data is not available for this outcome measure.
5.1.2 Outcome: severity or intensity of neck musculoskeletal symptoms at 16‐week follow‐up
We found very low‐quality evidence, based on one study (Gatty 2004), that a combined physical and organisational ergonomic intervention produced no significant difference in frequency of neck ache or pain when compared with no intervention (MD −1.20; 95% CI −2.77 to 0.37; Analysis 11.1).
11.1. Analysis.
Comparison 11 Work injury prevention programme versus no intervention, Outcome 1 Frequency of neck ache or pain.
5.1.3 Outcome: severity or intensity of shoulder musculoskeletal symptoms at 16‐week follow‐up
We found very low‐quality evidence, based on one study (Gatty 2004), that a combined physical and organisational ergonomic intervention produced no significant difference in frequency of shoulder ache or pain when compared with no intervention (MD −1.10; 95% CI −2.65 to 0.45; Analysis 11.2).
11.2. Analysis.
Comparison 11 Work injury prevention programme versus no intervention, Outcome 2 Frequency of shoulder ache or pain.
5.1.4 Outcome: severity or intensity of wrist or hand musculoskeletal symptoms at 16‐week follow‐up
We found very low‐quality evidence, based on one study (Gatty 2004), that a combined physical and organisational ergonomic intervention produced no significant difference in frequency of wrist or hand ache or pain when compared with no intervention (MD −1.00; 95% CI −2.52 to 0.52; Analysis 11.3).
11.3. Analysis.
Comparison 11 Work injury prevention programme versus no intervention, Outcome 3 Frequency of wrist/hand ache or pain.
5,1,5 Outcome: work‐related function
Data is not available for this outcome measure.
5.1.6 Outcome: compliance with intervention (secondary outcome)
One study, Gatty 2004, assessed the participants' self‐reported compliance with the intervention using a scale from one (never) to four (always). The study reported that compliance in the intervention group was high at the end of the study, with the greatest level of compliance obtained for ergonomic equipment (mean 3.5 (SD 0.55), followed by the performance of modified job duties (mean 2.8 (SD 0.41), and the performance of issued stretches or breaks (mean 2.5 (SD 1.05).
Discussion
Summary of main results
This systematic review identified 15 randomised controlled trials (RCTs) evaluating the effectiveness of workplace ergonomic interventions for the prevention of work‐related musculoskeletal disorders of the upper limb or neck, or both, among office workers.
For physical ergonomic interventions, we found three interventions consisting of a form of arm support, one of alternative computer mouse design, one of alternative workstation design and one of sit‐stand desk (Table 1; Table 3; Table 2; Table 5; Table 4; Table 6). All six interventions were evaluated with, on average, three outcomes. Only one of the 20 intervention‐outcome combinations produced a statistically significant result; this was for the comparison of an arm support with an alternative computer mouse versus an alternative mouse alone. We rated the quality of this evidence as moderate. However, the other comparisons that compared only arm‐support or only an alternative mouse did not yield beneficial results. Therefore, based on the moderate‐ to very low‐quality evidence available, we conclude that there is no considerable effect of physical ergonomic changes on upper limb symptoms.
For organisational ergonomic interventions, there is very low‐quality evidence, based on two studies, that supplementary breaks may reduce discomfort of the neck and right shoulder, upper limb, forearm, wrist or hand (Table 7).
There were no studies on cognitive interventions.
For training interventions, there is low‐ to very low‐quality evidence from five studies that evaluated participatory and active training interventions; this evidence indicated that these interventions may or may not prevent work‐related upper limb or neck musculoskeletal disorders (MSDs), or both (Table 8; Table 9).
For multifaceted interventions there is one study (very low‐quality evidence) that did not show an effect on any of the six upper limb pain outcomes.
Seven studies assessed compliance with the intervention (Bohr 2002; Bohr 2000; Brisson 1999; Gatty 2004, Gerr 2005, Graves 2015; King 2013). Overall these studies found compliance to ergonomic interventions to be low, but two studies noted high compliance (Gatty 2004; Graves 2015).
Overall completeness and applicability of evidence
We found evidence for all classes of ergonomic interventions designed to reduce pain and discomfort in the upper limb and neck except for cognitive ergonomic interventions. Cognitive ergonomic interventions would not be the most applied for preventing musculoskeletal pain. Physical workplace changes, such as arm support and differently designed mouses, would be the most applied interventions. We also found studies about organisational interventions, such as breaks, which would be an intuitive way of decreasing the workload and thus preventing pain. There were also studies about training workers, with the aim that this will lead to better ergonomic conditions and thus to less musculoskeletal pain or discomfort. These studies applied the important concept of participation of the workers in the intervention process. Therefore, we believe that we have covered a range of interventions that are currently applied in practice.
Although we included 15 RCTs overall, the number of studies for each individual intervention was small, with a maximum of two studies per meta‐analysis. A wide range of outcomes was used to evaluate the interventions but this also dispersed the evidence across different intervention‐outcome combinations that we considered too different to be combined. The small sample sizes included in these intervention‐outcome combinations may also have led to a lack of power to detect small differences in outcomes.
There were studies among men and women and among different age groups. However, some studies included only workers that had to enter data as their job, or only call‐centre workers. Thus the evidence might not always be applicable to all types of office workers.
Most studies were more than ten years old and there were only four studies conducted after the year 2010. This might indicate that the interventions are not up‐to‐date given that current office equipment is considerably different from that used 10 to 20 years ago. Where the majority was stationary sitting workstations with a desktop or laptop computers, as compared to mobile office, sit‐stand workstations, and the use of tablets and smart phones for office work currently.
Studies from low‐ and middle‐income countries were missing.
Quality of the evidence
We assessed the quality of evidence for each subtype regardless of whether it was included in meta‐analyses. We assessed the quality of evidence per outcome using the GRADEpro GDT software (GRADEpro GDT).
There is moderate‐ to low‐quality evidence on the effectiveness of physical ergonomic interventions and low‐ to very‐low‐quality evidence on the effectiveness of organisational ergonomic interventions and on organisational combined with physical ergonomic interventions. We downgraded our assessments of the quality of evidence produced by the included studies because of small sample sizes, risk of bias, lack of blinding and use of subjective outcome measures (detection bias), lack of information on sequence generation (selection bias), and lack of information on allocation concealment (selection bias). The main quality concerns were small sample sizes and use of subjective outcome measures (detection bias), which occurred for all the interventions.
Although all the included studies were RCTs, the majority of the studies did not report the methods for random sequence generation and allocation concealment. This has led us to the downgrade the quality of evidence because of the possibility of selection bias. Future studies should be clear about how they generated a random sequence and how they concealed allocation.
Potential biases in the review process
The process of study selection, data extraction, and assessment of risk of bias of included studies was performed by two independent review authors and we resolved disagreements through discussion and consensus. We minimised selection bias in our search by screening references of identified studies and systematic reviews, by contacting experts in the research field, and by not restricting our search strategy by language or publication date. Even though our search strategy was comprehensive, there is always a risk that relevant studies may not have been identified in the review process.
We were unable to assess the risk of publication bias adequately as there was a very limited number of studies assessing similar interventions and outcomes. We avoided duplicate publication bias by using study data only once. However, we found two reports from the same author (Bohr 2000; Bohr 2002), which may be reporting on the same population. We wrote to the author for clarification, however we did not receive a response. In our included studies, there were two studies that were each reported twice. We combined the results from the two reports and only used the data that were appropriate for this review (Gatty 2004). We were able to obtain missing data for four studies (Baydur 2016; Brisson 1999;Galinsky 2000;Galinsky 2007).
We had considerable difficulty in classifying the interventions and we might have been too restrictive in combining studies. However, we believe that the broad categories of ergonomic interventions that we made have resulted in a meaningful categorisation. Thus we believe it is possible to get at least an impression of the effectiveness of interventions in the various categories.
Due to the strict inclusion criteria used in this review, we excluded 13 studies due to the high prevalence of MSDs at baseline. Some of those studies may be able to provide additional evidence on the effectiveness of the intervention. However, given the lesser‐quality study design, this would probably not lead to an increase in the confidence of the results
This review included only RCTs since methodologically weaker designs can easily lead to bias. In the field of occupational health, randomisation is sometimes difficult to perform. From the 'Risk of bias' tables it can be noted that there were a high number of studies with a classification of ‘unclear’ in the sequence generation and allocation concealment domains. This indicates that the primary publication did not supply enough information to assess these biases. We did not seek further information from the authors for reasons of simplicity and lack of resources in conducting the review. Instead, we chose to complete the 'Risk of bias' assessment based on information provided in the published reports.
Agreements and disagreements with other studies or reviews
The findings of this review differ from those of three earlier systematic reviews (Boocock 2007; Kennedy 2010; Van Eerd 2016). Our review focuses on prevention of MSDs, and unlike previous reviews, we excluded studies where more than 25% of the participants had MSDs of the upper limb or neck. Moreover, the three other systematic reviews, Boocock 2007, Kennedy 2010, and Van Eerd 2016, classified interventions differently and also included study designs other than RCTs. Because of their less rigorous inclusion criteria, one review included 31 studies (Boocock 2007), one included 36 studies (Kennedy 2010), and one included 61 studies (Van Eerd 2016). Moreover, the other three reviews did not perform meta‐analyses and included populations other than office workers.
The systematic reviews by Boocock 2007, Kennedy 2010 and Van Eerd 2016 used similar methods to assess the study quality and level of evidence of the included studies. In Boocock 2007, the researchers used the modified version of the Cochrane Musculoskeletal Injuries Group scoring system, in conjunction with the generic appraisal tool for epidemiology (GATE) tool, to provide an overall score for each study from 0 to 26 and to classify each study as low (less than 10), medium (10 to 18) or high quality (19 or more). The quality of evidence was then classified as strong, moderate, some or insufficient evidence based on consistency of the quality scores. Kennedy 2010, and Van Eerd 2016, used the same methods, which involved assessing the quality of the included studies using 16 quality criteria. Each study received a quality ranking score by dividing the weighted score by 41 and then multiplying by 100. The studies were then categorised as high (more than 85%), medium (50% to 85%) or low (less than 50%) quality. The quality of evidence was then categorised as strong, moderate, limited, mixed and insufficient based on quality of the study, number of studies, and consistency of findings (Kennedy 2010; Van Eerd 2016).
In Boocock 2007, they concluded that there is some evidence to support the use of mechanical and modifier interventions for preventing and managing neck or upper extremity musculoskeletal conditions. They found moderate evidence that mouse and keyboard design can lead to positive health benefits in visual display unit workers with neck or upper extremity musculoskeletal conditions.
In Kennedy 2010, the researchers found moderate evidence for arm supports and limited evidence for ergonomic training plus workstation adjustments, new chairs, and rest breaks having beneficial effects on upper‐extremity MSD outcomes. In Van Eerd 2016, they found moderate evidence for mouse‐use feedback and forearm supports, job stress management training, and office workstation adjustment having beneficial effects on MSDs and symptoms. Kennedy 2010 and Van Eerd 2016 included in their evidence for arm support the studies of Lintula 2001, Rempel 2006, and Conlon 2008. These were also included in our study. However, Kennedy and colleagues (Kennedy 2010), and Van Eerd and colleagues (Van Eerd 2016), did not perform a meta‐analysis although the data were comparable, and thus the capacity of these reviews to report a quantitative assessment is limited.
Authors' conclusions
Implications for practice.
There is very low‐ to moderate‐quality evidence that arm supports or an alternatively designed computer mouse may or may not reduce the incidence of neck or shoulder musculoskeletal disorders (MSDs) among office workers.
There is low‐quality evidence showing that supplementary breaks may reduce discomfort of the neck, right shoulder, or upper limb or right forearm or wrist or hand in data entry workers.
While there is very low‐ to low‐quality evidence to suggest that training in ergonomic principles may not prevent work‐related MSDs of the upper limb or neck or both among office workers, this conclusion is limited by the number and heterogeneity of available studies.
Implications for research.
We identified significant heterogeneity between the studies, and only one study had low risk of bias. Consequently, there is a need for more high‐quality randomised controlled trials (RCTs) examining ergonomic interventions for preventing disorders of the upper limb or neck, or both, among office workers. Most of the studies included in our review were conducted in the US, with only four studies from Canada, and one each from Finland and the UK. Studies from other parts of the world, especially from low‐ and middle‐income countries (LMICs), are therefore lacking. It is important to conduct studies of these interventions in developing countries, as differences in culture and work practices need to be considered. Conducting multicentre studies in both high‐income countries and LMICs will further increase the usefulness of the findings.
The main risk of bias that we identified in the included studies was concerning blinding (performance and detection bias). Although blinding of participants and personnel (performance bias) is difficult to achieve for ergonomic interventions, researchers need to consider minimising detection bias by having independent blinded assessors for diagnosing MSDs of the upper limb or neck, or both. Future studies also need to consider including independent medical examinations for diagnosis, or using injury records, workers' compensation records or other injury reporting systems to obtain more objective outcome data and minimise detection bias.
Studies included in this review used a number of different outcomes to measure discomfort and disability. The lack of standardisation in the methods used to assess these outcomes is therefore evident. Future research should therefore use standardised methods and validated instruments, especially when assessing discomfort and disability.
The majority of studies did not report details of random sequence generation or allocation concealment. Future studies should include a clear description of the randomisation process and include both random sequence generation and allocation concealment in their methods to minimise selection bias.
Feedback
Feedback from Traci Galinsky, 29 March 2013
Summary
1. The review evaluated 15 reports out of 937 potentially relevant references and 30 potentially eligible references. Thus, the review evaluated only 1.6 % of the potentially relevant research reports, and only 50% of the potentially eligible reports. It raises the question of whether it is appropriate to apply your RCT review approach to this area of research, in which it is usually not possible to employ randomized controlled trials (RCTs).
2. Evaluating prevention effectiveness, especially in the case of many work‐related musculoskeletal disorders, is not comparable to evaluating treatment effectiveness. In the latter case, researchers can typically measure reactions to treatment using objective, physiological tests over a relatively short period of time. Many work‐related musculoskeletal disorders are associated with accumulation of musculoskeletal trauma over a long period of time in which the worker is chronically exposed to low‐force, repetitive motions and awkward, constrained postures. Evaluating the effectiveness of interventions to prevent such disorders using an RCT approach would require long‐term, prospective studies of large samples of workers, using control groups and clinical diagnostic outcome measures. Since that type of study is in most cases practically impossible to conduct, we have relied on briefer and smaller studies using discomfort ratings as indicators of strain or trauma accumulation (Galinsky 2000; Galinsky 2007).
3. In our publications, we did not describe our studies as RCTs. In the review, however, they were identified as meeting the Cochrane RCT inclusion criteria because our studies were randomized cross‐over trials. No other similar studies were included because no other studies met the inclusion criteria.
4. This Cochrane review re‐analyzed our studies’ data and found that the discomfort ratings under the supplementary rest break schedule were not significantly lower than ratings under the conventional schedule. That finding is in contrast to the results of the more statistically powerful within groups multivariate analyses of variance we conducted, which revealed statistical significance for both the main effects of rest break schedule and the interactions between rest break schedule and rating time. In both publications, we discussed the meaningfulness of these small differences in a theoretical context.
5. We disagree with the statement in the review that the two cross‐over RCTs (Galinsky 2000; Galinsky 2007), had the potential for carry‐over effect because we did not report on the wash‐out period between the two data collection periods. We found that mean discomfort ratings over the course of the four weeks of alternative work‐schedules were very stable and inferred that carry‐over effects were not of concern.
6. For updates of this review in the future, it would be helpful to describe one or more detailed examples of how high‐quality RCTs examining the prevention of MSDs of the upper limb and neck could feasibly be conducted. Since in our experience such studies are generally not feasible.
I agree with the conflict of interest statement below:
I certify that I have no affiliations with or involvement in any organization or entity with a financial interest in the subject matter of my feedback.
Reply
We would like to thank Traci Galinsky for her comments and interest in our review.
1. It is a common misunderstanding that the results of the search could be interpreted as all the available evidence. In fact, the results of the search are more dependent on the sensitivity of the search strategy, which we try to make as sensitive as possible to not miss any relevant research. What we actually wanted to find is the proportion of search results that in the end fulfil our inclusion criteria. The search strategy employed for this review was based on the approach recommended by the Cochrane Collaboration, which is to use a highly sensitive search to retrieve all potential studies. The search retrieved the 937 references from nine electronic databases and five websites. We then included studies that directly addressed our topic of interest and met our inclusion and exclusion criteria. We included studies regardless of their quality. We excluded most of the studies identified with the systematic search as they did not address the topic of interest or did not meet our inclusion and exclusion criteria. For example, some papers assessed a modality of treatment other than ergonomic design and training intervention, examined sites other than the neck or the upper limb, or reported on interventions for treatment, not prevention, of neck and upper limb musculoskeletal disorders. Thus, we reviewed all of the relevant literature after excluding studies that were not focussed on our topic of ergonomic design and training for preventing work‐related musculoskeletal disorders of the upper limb and neck in office workers.
The number of references retrieved with our search strategy was comparable to, and in some cases higher than, other systematic reviews addressing effectiveness of interventions on treatment or prevention of musculoskeletal disorders; e.g. the Karjalainen 2001 review on multidisciplinary biopsychosocial rehabilitation for neck and shoulder pain among working age adults. They retrieved 1808 references and only included two studies (0.11%) in the review. Similarly the Tullar 2010 search strategy for their review on occupational safety and health interventions to reduce musculoskeletal symptoms in the health care sector identified 8,465 articles, and included 16 studies (0.18%) in the review. Whereas the Kennedy 2010 systematic review of the role of occupational health and safety interventions in the prevention of upper extremity musculoskeletal symptoms, signs, disorders, injuries, claims and lost time retrieved 15,279 articles and identified 36 relevant studies (0.24%).
Our review identified 13 studies of which eight were RCTs, three were cluster‐randomised and two used a randomised cross‐over design. We believe that we have shown with the results of our review that randomised trials are feasible and also carried out in practice. Randomised trials can be conducted in the workplace setting to assess the effect of ergonomic interventions on neck and upper‐limb musculoskeletal disorders but the RCT study design is less common in the workplace setting.
2. We agree that work‐related musculoskeletal disorders can be associated with a single traumatic event or accumulation of trauma over a long period, and evaluating the effectiveness of interventions using an RCT approach to prevent such disorders could require long‐term, prospective studies of a large samples of workers, control groups and assessment of clinical diagnostic outcomes. Our review did identify studies that had a follow‐up period of between six and 12 months (Bohr 2000; Brisson 1999; Conlon 2008; Gerr 2005; Rempel 2006; von Thiele 2008; Yassi 2001), and two of those studies (Conlon 2008; Rempel 2006) included physical examination as an outcome measure. We do not consider pain or discomfort ratings as outcomes that are only proxy of some unmeasurable long‐term outcome. In our view, these are the outcomes to be prevented.
3. We included the Galinsky 2000 and Galinsky 2007 studies in our review as they fulfilled the inclusion criteria of a randomised controlled trial. A cross‐over trial is considered a randomised trial if the participants are randomly allocated to the intervention and control groups for the first phase of the trial or, in other words, if the sequence of intervention and control is randomised. Since the Galinsky 2000 and Galinsky 2007 studies allocated the participants randomly to the intervention and control groups, we included them in our review.
4. We agree that the method of analysis used in our 2012 Cochrane review produced different results from those obtained by Galinsky 2000 and Galinsky 2007. We obtained a less sensitive result as we used the unpaired test. With a cross‐over trial the mean difference between the intervention and the control is the same as in another type of trial but the test should be a paired t‐test which is more sensitive than the unpaired test. For the 2018 update of this review we have incorporated the data as provided by the authors.
5. We would like to apologise for not including the additional information provided by Traci Galinsky via email in our review. Although there were several efforts to minimise the carry‐over effect in the Galinsky 2007 study, there is no wash‐out period which is the normal practice for a cross‐over study and this may have the potential of a carry‐over effect. To address this issue, we included Galinsky et al’s additional information of their methods employed to minimise the Hawthorne effect in the 2018 version of the review. However we still consider it possible that there may be a carry‐over effect because essentially we don't know what is the most appropriate wash‐out period and the effects of the first period could last longer and then influence the effects in the second period. This usually leads to an underestimation of the overall effect because for those participants for whom the control condition comes after the intervention the control rates will look more favourable.
6. We believe that it is possible to organise high quality RCTs in the field. We rated one of the RCTs that we included as having a low risk of bias, which means high quality. Also for prevention of other musculoskeletal disorders such as back pain there are numerous examples of high quality intervention and prevention studies with long‐term follow‐up and sufficient number of participants such as Daltroy 1997 and Lavender 2007.
Contributors
Victor Hoe, Donna Urquhart, Helen Kelsall, Malcolm Sim
What's new
| Date | Event | Description |
|---|---|---|
| 10 October 2018 | New search has been performed | We updated the search but found no new studies. |
| 6 June 2017 | New search has been performed | We revised the categorisation of ergonomic interventions to be in line with the International Ergonomics Association (IEA) categories. |
| 6 June 2017 | New citation required and conclusions have changed | We revised and updated the search and found two additional studies. |
| 31 August 2016 | Amended | We revised the inclusion criteria for the participants. Instead of including all workers we now restrict inclusion to studies of office workers only. |
History
Protocol first published: Issue 7, 2010 Review first published: Issue 8, 2012
| Date | Event | Description |
|---|---|---|
| 19 June 2013 | Feedback has been incorporated | Feedback from Traci Galinsky, received on 29 March 2013, has been incorporated and the authors have provided a thorough response. |
| 28 July 2010 | Amended | The order of the authors has been amended. |
Notes
This review is an update of Hoe 2012a. However, while the Hoe 2012a review included all work settings, this current review focuses on office workers.
Acknowledgements
The review authors would like to thank Dr Helen Handoll, Dr Jos Verbeek, Mr Jani Ruotsalainen, and Mrs Lindsey Elstub for their valuable editorial comments on the protocol and review; Mrs Lesley Gillespie for assistance in developing the search strategies; and the editorial staff of the Cochrane Bone, Joint and Muscle Trauma Group and Cochrane Occupational Safety and Health Group for their assistance. The review authors would also like to thank Miranda Cumpston and Jo McKenzie from the Australasian Cochrane Centre for their valuable assistance in the write‐up and statistical input and Mr Jani Ruotsalainen from Cochrane Work and Ms Anne Lawson from Wiley for copy‐editing the text of the protocol and Dr Jos Verbeek, Mr Jani Ruotsalainen and Ms Jessica Sharp, for copy‐editing the text of the review.
Appendices
Appendix 1. Cochrane Database of Systematic Reviews
Issue 10 of 12, October 2018 (Search date: October 10, 2018)
#1 MeSH descriptor: ["Cumulative Trauma Disorders"] explode all trees 727 #2 MeSH descriptor: ["Occupational Diseases"] explode all trees 840 #3 MeSH descriptor: ["Hand‐Arm Vibration Syndrome"] explode all trees 6 #4 MeSH descriptor: ["Occupational Health"] explode all trees 561 #5 ("occupational overuse syndrome" or "tension neck syndrome"):ti,ab 3 #6 ("cumulative trauma*"):ti,ab 28 #7 ("work related"):ti,ab 836 #8 (repetit* next (strain or stress or industr* or motion or movement or trauma)):ti,ab 78 #9 (vibration next (induced or related or syndrome*)):ti,ab 67 #10#1 or #2 or #3 or #4 or #5 or #6 or #7 or #8 or #9 2824 #11 MeSH descriptor: ["Neck Pain"] explode all trees 991 #12 MeSH descriptor: ["Shoulder Pain"] explode all trees 744 #13 MeSH descriptor: ["Hand Injuries"] explode all trees 127 #14 MeSH descriptor: ["Wrist Injuries"] explode all trees 140 #15 MeSH descriptor: ["Musculoskeletal Diseases"] explode all trees 455 #16 (neck* or shoulder* or arm* or "upper limb*" or "upper extremit*" or elbow* or forearm* or wrist* or hand* or finger*):ti,ab130543 #17 ("carpal tunnel syndrome*"):ti,ab 831 #18#11 or #12 or #13 or #14 or #15 or #16 or #17 131369 #19#10 and #18 1191 #20 MeSH descriptor: ["Human Engineering"] explode all trees 2893 #21 MeSH descriptor: [Movement] explode all trees 2433 #22 MeSH descriptor: [Posture] explode all trees 3252 #23 MeSH descriptor: [Lifting] explode all trees 128 #24 MeSH descriptor: [Workload] explode all trees 357 #25 MeSH descriptor: [Workplace] explode all trees 720 #26 MeSH descriptor: ["Equipment Design"] explode all trees 5321 #27 MeSH descriptor: ["User‐Computer Interface"] explode all trees 1227 #28 (ergonom* or biomechanic*):ti,ab 2831 #29 #20 or #21 or #22 or #23 or #24 or #25 or #26 or #27 or #28 17381 #30 #19 and #29 298
Appendix 2. Ovid MEDLINE(R) and In‐Process & Other Non‐Indexed Citations and Daily
1946 to September 17, 2018 (Search date: September 18, 2018)
1 exp Cumulative Trauma Disorders/ 12813
2 Occupational Diseases/ or Hand‐Arm Vibration Syndrome/ 81172
3 Occupational Health/ 30749
4 ((occupational overuse or tension neck) adj syndrome).tw. 44
5 cumulative trauma$.tw. 541
6 work related.tw. 13614
7 (repetit$ adj (strain or stress or industr$ or motion or movement or trauma)).tw. 1383
8 (vibration adj (induced or related or syndrome$)).tw. 1402
9 or/1‐8 128554
10 Neck Pain/ or Shoulder Pain/ or exp Hand Injuries/ or Wrist Injuries/ 32365
11 Musculoskeletal Diseases/ 11425
12 (neck$1 or shoulder$1 or arm$1 or upper limb$1 or upper extremit$ or elbow$1 or forearm$1 or wrist$1 or hand$1 or finger$1).tw. 890123
13 carpal tunnel syndrome$.tw. 7641
14 or/10‐13 911103
15 and/9,14 18735
16 exp Human Engineering/ 53374
17 Biomechanics/ 0
18 Movement/ or Posture/ or Lifting/ 127286
19 Workload/ or Workplace/ or Equipment Design/ or User‐Computer Interface/ 208888
20 (ergonom$ or biomechanic$).tw. 63432
21 or/16‐20 423997
22 and/15,21 4238
23 randomized controlled trial.pt. 467996
24 controlled clinical trial.pt. 92621
25 randomized.ab. 411524
26 placebo.ab. 188690
27 clinical trials as topic.sh. 184712
28 randomly.ab. 291495
29 trial.ti. 183136
30 23 or 24 or 25 or 26 or 27 or 28 or 29 1154131
31 exp animals/ not humans.sh. 4494683
32 30 not 31 1060760
33 and/22,32 402
Appendix 3. EMBASE search strategy
Embase Session Results (29.5.2017)
| No | Query | Results |
| #53 | #35 AND #52 | 638 |
| #52 | #36 OR #37 OR #38 OR #39 OR #40 OR #41 OR# 42 OR #43 OR #44 OR #45 OR #46 OR #47 OR #48 OR #49 OR #50 OR #51 AND [humans]/lim | 1,812,079 |
| #51 | 'rct':ab,ti AND [embase]/lim | 20,686 |
| #50 | ((allocat* OR allot* OR assign* OR divid*) NEAR/3 (condition* OR experiment* OR intervention* OR treatment* OR therap* OR control* OR group*)):ab,ti AND [embase]/lim | 269,690 |
| #49 | crossover*:ab,ti OR (cross NEXT/1 over*):ab,ti AND [embase]/lim | 76,302 |
| #48 | ((singl* OR doubl* OR trebl* OR tripl*) NEAR/7 (blind* OR mask*)):ab,ti AND [embase]/lim | 186,297 |
| #47 | (random* NEAR/7 (allocat* OR allot* OR assign* OR basis* OR divid* OR order*)):ab,ti AND [embase]/lim | 199,419 |
| #46 | ((clinical OR controlled OR comparative OR placebo OR prospective* OR randomi?ed) NEAR/3 (trial OR study)):ab,ti AND [embase]/lim | 877,894 |
| #45 | 'prospective study'/de AND [embase]/lim | 304,540 |
| #44 | 'placebo'/de AND [embase]/lim | 293,411 |
| #43 | 'crossover procedure'/de AND [embase]/lim | 44,454 |
| #42 | 'double blind procedure'/de AND [embase]/lim | 122,521 |
| #41 | 'single blind procedure'/de AND [embase]/lim | 22,239 |
| #40 | 'randomization'/de AND [embase]/lim | 45,797 |
| #39 | 'clinical trial'/de AND [embase]/lim | 749,064 |
| #38 | 'controlled clinical trial'/exp AND [embase]/lim | 482,670 |
| #37 | 'randomized controlled trial'/exp OR 'randomized controlled trial' AND [embase]/lim | 468,251 |
| #36 | 'randomi?ed controlled trial?' AND [embase]/lim | 61,671 |
| #35 | #22 OR #34 | 5,793 |
| #34 | #27 AND #33 | 3,200 |
| #33 | #28 OR #29 OR #30 OR #31 OR #32 | 199,134 |
| #32 | military:ab,ti OR navy:ab,ti OR army:ab,ti OR soldier:ab,ti OR athlet*:ab,ti OR runner*:ab,ti AND [embase]/lim | 78,169 |
| #31 | 'sport'/exp OR 'dancing'/exp AND [embase]/lim | 91,086 |
| #30 | 'sport injury'/de AND [embase]/lim | 17,658 |
| #29 | 'military phenomena'/exp AND [embase]/lim | 42,336 |
| #28 | 'cumulative trauma disorder'/exp AND [embase]/lim | 15,217 |
| #27 | #23 OR #24 OR #25 OR #26 | 8,378 |
| #26 | (('fract*' OR 'injur*') NEAR/3 ('insufficiency' OR 'fatigue' OR 'overuse')):ab,ti AND [embase]/lim | 3,815 |
| #25 | ('bone' NEAR/3 'stress' NEAR/3 'reaction*'):ab,ti AND [embase]/lim | 32 |
| #24 | 'stress fracture*':ab,ti AND [embase]/lim | 3,434 |
| #23 | 'stress fracture'/de AND [embase]/lim | 4,739 |
| #22 | #15 AND #21 | 2,650 |
| #21 | #16 OR #17 OR #18 OR #19 OR #20 | 283,833 |
| #20 | 'ergonom*':ab,ti OR 'biomechanic*':ab,ti AND [embase]/lim | 54,526 |
| #19 | 'workload'/de OR 'workplace'/de OR 'equipment design'/de OR 'human computer interaction'/de OR 'visual display unit'/de OR 'ergonomics'/de AND [embase]/lim | 72,849 |
| #18 | 'movement (physiology)'/de OR 'body posture'/de AND [embase]/lim | 46,096 |
| #17 | 'biomechanics'/de AND [embase]/lim | 58,082 |
| #16 | 'bioengineering'/exp AND [embase]/lim | 96,459 |
| #15 | #9 AND #14 | 14,279 |
| #14 | #10 OR #11 OR #12 OR #13 | 323,735 |
| #13 | 'carpal tunnel syndrome*':ab,ti AND [embase]/lim | 7,105 |
| #12 | 'neck?' OR 'shoulder?' OR 'arm?' OR 'upper limb?' OR 'upper extremit*' OR 'elbow?' OR 'forearm?' OR 'wrist?' OR 'hand?' OR 'finger?' AND [embase]/lim | 264,568 |
| #11 | 'musculoskeletal disease'/de AND [embase]/lim | 19,093 |
| #10 | 'shoulder pain'/de OR 'neck pain'/de OR 'arm injury'/de OR 'hand injury'/exp OR 'shoulder injury'/de OR 'wrist injury'/de OR 'elbow injury'/de AND [embase]/lim | 44,390 |
| #9 | #1 OR #2 OR #3 OR #4 OR #5 OR #6 OR #7 OR #8 | 81,542 |
| #8 | ('vibration' NEXT/1 ('induced' OR 'related' OR 'syndrome*')):ab,ti AND [embase]/lim | 1,123 |
| #7 | ('repetit*' NEXT/1 ('strain' OR 'stress' OR 'industr*' OR 'motion' OR 'movement' OR 'trauma')):ab,ti AND [embase]/lim | 1,347 |
| #6 | 'work related':ab,ti AND [embase]/lim | 10,307 |
| #5 | 'cumulative trauma*':ab,ti AND [embase]/lim | 478 |
| #4 | (('occupational overuse' OR 'tension neck') NEXT/1 syndrome):ab,ti AND [embase]/lim | 33 |
| #3 | 'occupational health'/de OR 'occupational hazard'/de OR 'occupational safety'/de AND [embase]/lim | 41,396 |
| #2 | 'occupational disease'/de OR 'hand arm vibration syndrome'/de OR 'occupational accident'/de AND [embase]/lim | 23,163 |
| #1 | 'cumulative trauma disorder'/exp OR 'cumulative trauma disorder' AND [embase]/lim | 15,251 |
Appendix 4. Web of Science search strategy
Search date: September 18, 2018
#13 #12 AND #11 870
#12 TS=(random* or placebo*) OR TS=((singl* or doubl* or treb* or tripl*) SAME (blind* or mask*)) OR TS=(clinical SAME trial*) OR TI=(trial) 2106450
#11 #10 AND #9 6000
#10 TS=(biomechanic* or engineer* or ergonomic* or support$ or equipment) 2743355
# 9 #8 OR #7 31646
# 8 TS=(carpal tunnel) 10346
# 7 #6 AND #5 22296
# 6 TS=(neck* or shoulder* or arm* or upper limb* or upper extremit* or elbow* or forearm* or wrist* or hand* or finger*) 1666914
# 5 #4 OR #3 OR #2 OR #1 158455
# 4 TS=(vibration SAME (induced or related or syndrome*)) 33579
# 3 TS=(repetit* SAME (strain or stress or industr* or motion or movement or trauma)) 25154
# 2 TS=("work related" or "Hand‐Arm Vibration" or "tension neck" or overuse or "cumulative trauma*") 29506
# 1 TS=(occupation* SAME (health or disease* OR safety OR injur* OR pain)) 78256
Appendix 5. CINAHL (EBSCOhost) search strategy
Search date: September 18, 2018
S36 S22 and S35 414
S35 S23 or S24 or S25 or S26 or S27 or S28 or S29 or S30 or S31 or S32 or S33 or S34 638788
S34 TI (crossover or cross‐over or "cross over") or AB (crossover or cross‐over or "cross over") 9933
S33 TI (singl* N1 blind*) or TI (doubl* N1 blind*) or TI (trebl* N1 blind*) or TI (tripl* N1 blind*) or TI (singl* N1 mask*) or TI (doubl* N1 mask*) or TI (trebl* N1 mask*) or TI (tripl* N1 mask*) or AB (singl* N1 blind*) or AB (doubl* N1 blind*) or AB (trebl* N1 blind*) or AB (tripl* N1 blind*) or AB (singl* N1 mask*) or AB (doubl* N1 mask*) or AB (trebl* N1 mask*) or AB (tripl* N1 mask*) 23249
S32 TI (random* and (allocat* or allot* or assign* or basis* or divid* or order*)) or AB (random* and (allocat* or allot* or assign* or basis* or divid* or order*)) 48651
S31 TI ((clinical or controlled or comparative or placebo or prospective or randomised or randomized) and (trial or study)) or AB ((clinical or controlled or comparative or placebo or prospective or randomised or randomized) and (trial or study)) 357879
S30 PT Clinical Trial 55712
S29 (MH "Random Assignment") 39380
S28 (MH "Placebos") 83930
S27 (MH "Double‐Blind Studies") or (MH "Single‐Blind Studies") or (MH "Triple‐Blind Studies") 32951
S26 (MH "Crossover Design") 11302
S25 (MH "Prospective Studies+") 221559
S24 (MH "Comparative Studies") 107151
S23 (MH "Clinical Trials+") 159326
S22 S15 and S21 1581
S21 S16 or S17 or S18 or S19 or S20 95624
S20 TI (ergonom* or biomechanic*) or AB (ergonom* or biomechanic*) 13359
S19 (MH "Workload") or (MH "Work Environment") or (MH "Equipment Design") or (MH "User‐Computer Interface") 52007
S18 (MH "Movement") or (MH "Posture") or (MH "Lifting") 16110
S17 (MH "Biomechanics") 13501
S16 (MH "Ergonomics+") 16224
S15 S9 and S14 5262
S14 S10 or S11 or S12 or S13 148292
S13 TI (carpal tunnel syndrome*) or AB (carpal tunnel syndrome*) 1507
S12 TI (neck* or shoulder* or arm* or upper limb* or upper extremit* or elbow* or forearm* or wrist* or hand* or finger*) or AB (neck* or shoulder* or arm* or upper limb* or upper extremit* or elbow* or forearm* or wrist* or hand* or finger*) 140250
S11 (MH "Musculoskeletal Diseases") 5467
S10 (MH "Neck Pain") or (MH "Shoulder Pain") or (MH "Arm Injuries") or (MH "Hand Injuries") or (MH "Hand Injuries") or (MH "Finger Injuries") or (MH "Wrist Injuries") or (MH "Shoulder Injuries") 11101
S9 S1 or S2 or S3 or S4 or S5 or S6 or S7 or S8 31914
S8 TI ((vibration N1 induced) or (vibration N1 related) or (vibration N1 syndrome*)) or AB ((vibration N1 induced) or (vibration N1 related) or (vibration N1 syndrome*)) 138
S7 TI ((repetit* N1 strain) or (repetit* N1 stress) or (repetit* N1 industr*) or (repetit* N1 motion) or (repetit* N1 movement) or (repetit* N1 trauma)) or AB ( (repetit* N1 strain) or (repetit* N1 stress) or (repetit* N1 industr*) or (repetit* N1 motion) or (repetit* N1 movement) or (repetit* N1 trauma)) 893
S6 TI (work related) or AB (work related) 7869
S5 TI (cumulative trauma*) or AB (cumulative trauma*) 289
S4 TI ((occupational overuse N1 syndrome) or (tension neck N1 syndrome)) or AB ((occupational overuse N1 syndrome) or (tension neck N1 syndrome)) 18
S3 (MH "Occupational Health") 15183
S2 (MH "Occupational Diseases") 6443
S1 (MH "Cumulative Trauma Disorders+") 4357
Appendix 6. SPORTDiscus (EBSCOhost) search strategy
10 October 2018
| # | Query | Results |
| S29 | S20 and S28 | 159 |
| S28 | S27 or S26 or S25 or S24 or S23 or S22 or S21 | 340,934 |
| S27 | TX placebo* | 25,485 |
| S26 | TX ((allocat* or allot* or assign* or divid*) and (condition* or experiment* or intervention* or treatment* or therap* or control* or group*)) | 148,317 |
| S25 | TX "randomi?ed control* trial*" | 32,860 |
| S24 | TX (cross?over or (cross over)) | 94,099 |
| S23 | TX ((singl* or doubl* or trebl* or tripl*) and (blind* or mask*)) | 43,994 |
| S22 | TX (random* and (allocat* or allot* or assign* or basis* or divid* or order*)) | 100,187 |
| S21 | TX ((clinic$ or controlled or comparative or placebo or prospective or randomised or randomized) and (trial or study)) | 218,322 |
| S20 | S14 and S19 | 414 |
| S19 | S15 or S16 or S17 or S18 | 46,454 |
| S18 | TI ( (ergonom* or biomechanic*) ) or AB ( (ergonom* or biomechanic*) ) | 17,343 |
| S17 | DE "POSTURE" OR DE "SITTING position" OR DE "STANDING position" | 10,214 |
| S16 | DE "BIOMECHANICS" | 29,723 |
| S15 | DE "HUMAN engineering" OR DE "SITUATIONAL awareness" | 292 |
| S14 | S9 and S13 | 2,520 |
| S13 | S10 or S11 or S12 | 161,823 |
| S12 | TI "carpal tunnel syndrome*" or AB "carpal tunnel syndrome*" | 595 |
| S11 | DE "NECK pain" or DE "SHOULDER pain" or DE "WOUNDS & injuries" | 45,985 |
| S10 | TI ( ( (neck* or shoulder* or arm* or upper limb* or upper extremit* or elbow* or forearm* or wrist* or hand* or finger*) ) ) or AB ( ( (neck* or shoulder* or arm* or upper limb* or upper extremit* or elbow* or forearm* or wrist* or hand* or finger*) ) ) | 123,435 |
| S9 | S1 or S2 or S3 or S4 or S5 or S6 or S7 or S8 | 7,767 |
| S8 | TI ( (vibration and (induced or related or syndrome*)) ) or AB ( (vibration and (induced or related or syndrome*)) ) | 458 |
| S7 | TI ( (repetit* and (strain or stress or industr* or motion or movement or trauma)) ) or AB ( (repetit* and (strain or stress or industr* or motion or movement or trauma)) ) | 2,707 |
| S6 | TI "work related" or AB "work related" | 1,676 |
| S5 | TI "cumulative trauma*" or AB "cumulative trauma*" | 67 |
| S4 | TI ( ("occupational overuse" or "tension neck") and syndrome* ) or AB ( ("occupational overuse" or "tension neck") and syndrome* ) " | 2 |
| S3 | DE "OCCUPATIONAL health services" | 900 |
| S2 | DE "OCCUPATIONAL diseases" | 625 |
| S1 | DE "OVERUSE injuries" | 1,824 |
Appendix 7. Scopus
Search date: September 21, 2018
#55 #35 AND #54 AND (LIMIT‐TO (PUBYEAR,2018) OR LIMIT‐TO (PUBYEAR,2017)) 200
#54 #52 AND #53 6874058
#53 TITLE‐ABS‐KEY(human OR humans) 20313997
#52 #36 OR #37 OR #38 OR #39 OR #40 OR #41 OR #42 OR #43 OR #44 OR #45 OR #46 OR #47 OR #48 OR #49 OR #50 OR #51 9962659
#51 TITLE‐ABS‐KEY(rct?) 29038
#50 TITLE‐ABS‐KEY((allocat* OR allot* OR assign* OR divid*) W/3 (condition* OR experiment* OR intervention* OR treatment* OR therap* OR control* OR group*)) 468739
#49 TITLE‐ABS‐KEY(crossover* OR (cross PRE/1 over*)) 156657
#48 TITLE‐ABS‐KEY((singl* OR doubl* OR trebl* OR tripl*) W/7 (blind* OR mask*)) 269677
#47 TITLE‐ABS‐KEY(random* W/7 (allocat* OR allot* OR assign* OR basis* OR divid* OR order*)) 371336
#46 TITLE‐ABS‐KEY((clinical OR controlled OR comparative OR placebo OR prospective* OR randomi?ed) W/3 (trial OR study)) 9491228
#45 TITLE‐ABS‐KEY("prospective stud*") 629992
#44 TITLE‐ABS‐KEY(placebo?) 32354
#43 TITLE‐ABS‐KEY("crossover procedure*") 47615
#42 TITLE‐ABS‐KEY("double blind procedure*") 146618
#41 TITLE‐ABS‐KEY("single blind procedure*") 28713
#40 TITLE‐ABS‐KEY(randomi?ation OR randomi?ed) 1003593
#39 TITLE‐ABS‐KEY("clinical trial*") 1379950
#38 TITLE‐ABS‐KEY("controlled clinical trial*") 432833
#37 TITLE‐ABS‐KEY("randomized controlled trial*" OR "randomized controlled trial*") 680076
#36 TITLE‐ABS‐KEY("randomi?ed controlled trial?") 154606
#35 #22 OR #34 9257
#34 #27 AND #33 5253
#33 #28 OR #29 OR #30 OR #31 OR #32 589428
#32 TITLE‐ABS‐KEY(military OR navy OR army OR soldier* OR athlet* OR runner*) 472685
#31 TITLE‐ABS‐KEY(sport? OR dancing OR dancer?) 161419
#30 TITLE‐ABS‐KEY("sport injur*") 31070
#29 TITLE‐ABS‐KEY("military phenomen*") 1178
#28 TITLE‐ABS‐KEY("cumulative trauma disorder*") 4426
#27 #23 OR #24 OR #25 OR #26 25887
#26 TITLE‐ABS‐KEY((fract* OR injur*) W/3 (insufficiency OR fatigue OR overuse)) 19080
#25 TITLE‐ABS‐KEY(bone W/3 stress W/3 reaction*) 62
#24 TITLE‐ABS‐KEY("stress fracture*") 8112
#23 TITLE‐ABS‐KEY("stress fracture") 8098
#22 #15 AND #21 4107
#21 #16 OR #17 OR #18 OR #19 OR #20 776360
#20 TITLE‐ABS‐KEY(ergonom* OR biomechanic*) 256236
#19 TITLE‐ABS‐KEY(workload? OR workplace? OR "equipment design" OR "human computer interaction?" OR "visual display unit?" OR ergonom*) 233422
#18 TITLE‐ABS‐KEY(movement? OR "body posture?") 335496
#17 TITLE‐ABS‐KEY(biomechanic*) 209007
#16 TITLE‐ABS‐KEY(bioengineering) 30890
#15 #9 AND #14 12164
#14 #10 OR #11 OR #12 OR #13 517036
#13 TITLE‐ABS‐KEY("carpal tunnel syndrome*") 14923
#12 TITLE‐ABS‐KEY(neck? OR shoulder? OR arm? OR "upper limb?" OR "upper extremit*" OR elbow? OR forearm? OR wrist? OR hand? OR finger?) 439515
#11 TITLE‐ABS‐KEY("musculoskeletal disease?") 10922
#10 TITLE‐ABS‐KEY("shoulder pain" OR "neck pain" OR "arm injur*" OR "hand injur*" OR "shoulder injur*" OR "wrist injur*" OR "elbow injur*") 67904
#9 #1 OR #2 OR #3 OR #4 OR #5 OR #6 OR #7 OR #8 194863
#8 TITLE‐ABS‐KEY(vibration PRE/1 (induced OR related OR syndrome*)) 6586
#7 TITLE‐ABS‐KEY(repetit* PRE/1 (strain OR stress OR industr* OR motion OR movement? OR trauma?)) 6101
#6 TITLE‐ABS‐KEY("work related" OR work‐related) 25815
#5 TITLE‐ABS‐KEY("cumulative trauma?") 19
#4 TITLE‐ABS‐KEY(("occupational overuse" OR "tension neck") PRE/1 syndrome?) 7
#3 TITLE‐ABS‐KEY("occupational health" OR "occupational hazard?" OR "occupational safety") 92825
#2 TITLE‐ABS‐KEY("occupational disease?" OR "hand arm vibration syndrome?" OR "occupational accident?") 83261
#1 TITLE‐ABS‐KEY("cumulative trauma disorder?") 4137
Appendix 8. NIOSHTIC‐2
Search date: September 21, 2018
#1 GW{cumulative trauma disorder*} 1583
#2 GW{occupational disease*} 12685
#3 GW{(hand OR arm) AND vibration syndrome} 416
#4 GW{occupational health} 79946
#5 GW{occupational overuse syndrome* or tension neck syndrome*} 126
#6 GW{cumulative trauma*} 1746
#7 GW{work related OR work‐related} 13735
#8 GW{repetit* AND (strain OR stress OR industr* OR motion OR movement OR trauma)} 6064
#9 GW{vibration AND (induced OR related OR syndrome*)} 3944
#10 #1 OR #2 OR #3 OR #4 OR #5 OR #6 OR #7 OR #8 OR #9 104816
#11 GW{neck pain} 230
#12 GW{shoulder pain} 253
#13 GW{hand injur*} 1450
#14 GW{wrist injur*} 113
#15 GW{musculoskeletal disease*} 3178
#16 GW{neck* OR shoulder* OR arm* OR upper limb* OR upper extremit* OR elbow* OR forearm* OR wrist* OR hand* OR finger*} 85491
#17 GW{carpal tunnel syndrome*} 1885
#18 #11 OR #12 OR #13 OR #14 OR #15 OR #16 OR #17 87917
#19 #10 AND #18 18903
#20 GW{human engineering} 2161
#21 GW{movement*} 13603
#22 GW{posture*} 7870
#23 GW{lifting*} 11278
#24 GW{workload*} 5547
#25 GW{workplace*} 60717
#26 GW{equipment* AND design*} 28543
#27 GW{user‐computer interface*} 2
#28 GW{ergonom* OR biomechanic*} 30551
#29 #20 OR #21 OR #22 OR #23 OR #24 OR #25 OR #26 OR #27 OR #28 121445
#30 #19 AND #29 10468
#31 DC{OUNIOS} 59895
#32 #30 AND #31 1469
Appendix 9. 'Risk of bias' tool
| Domain | Description | Review authors' judgement |
| Sequence generation | Describe the method used to generate the allocation sequence in sufficient detail to allow an assessment of whether it should produce comparable groups | Was the allocation sequence adequately generated? Yes/ No/ Unclear |
| Allocation concealment | Describe the method used to conceal the allocation sequence in sufficient detail to determine whether intervention allocations could have been foreseen in advance of, or during, enrolment | Was allocation adequately concealed? Yes/ No/ Unclear |
| Blinding of participants, personnel and outcome assessors (Assessments should be made for each main outcome (or class of outcomes)) | Describe all measures used, if any, to blind study participants and personnel from knowledge of which intervention a participant received. Provide any information relating to whether the intended blinding was effective | Was knowledge of the allocated intervention adequately prevented during the study? Yes/ No/ Unclear |
| Incomplete outcome data (Assessments should be made for each main outcome (or class of outcomes)) | Describe the completeness of outcome data for each main outcome, including attrition and exclusions from the analysis. State whether attrition and exclusions were reported, the numbers in each intervention group (compared with total randomised participants), reasons for attrition/exclusions where reported, and any re‐inclusions in analyses performed by the review authors | Were incomplete outcome data adequately addressed? Yes/ No/ Unclear |
| Selective outcome reporting | State how the possibility of selective outcome reporting was examined by the review authors, and what was found | Are reports of the study free of suggestion of selective outcome reporting? Yes/ No/ Unclear |
| Other sources of bias | State any important concerns about bias not addressed in the other domains in the tool. If particular questions/entries were pre‐specified in the review’s protocol, responses should be provided for each question/entry |
Was the study apparently free of other problems that could put it at a high risk of bias? Yes/ No/ Unclear |
Data and analyses
Comparison 1. An arm support together with an alternative mouse versus a conventional mouse alone.
| Outcome or subgroup title | No. of studies | No. of participants | Statistical method | Effect size |
|---|---|---|---|---|
| 1 Neck/shoulder discomfort score at 12‐month follow‐up | 2 | 194 | Std. Mean Difference (IV, Random, 95% CI) | ‐0.41 [‐0.69, ‐0.12] |
| 2 Incidence of neck/shoulder disorder at 12‐month follow‐up | 2 | 186 | Risk Ratio (M‐H, Random, 95% CI) | 0.52 [0.27, 0.99] |
| 3 Right upper extremity discomfort score at 12‐month follow‐up | 2 | 194 | Std. Mean Difference (IV, Random, 95% CI) | ‐0.34 [‐0.63, ‐0.06] |
| 4 Incidence of right upper limb disorder at 12‐month follow‐up | 2 | 181 | Risk Ratio (M‐H, Random, 95% CI) | 0.73 [0.32, 1.66] |
| 5 Incidence of upper body disorders (neck, shoulder, and upper limb) at 12‐month follow‐up | 2 | 191 | Risk Ratio (M‐H, Random, 95% CI) | 0.66 [0.42, 1.04] |
| 6 Change in percentage of work time | 1 | Mean Difference (IV, Fixed, 95% CI) | Totals not selected | |
| 7 Change in average time to completely process a call | 1 | Mean Difference (IV, Fixed, 95% CI) | Totals not selected | |
| 8 Change in calls per hour | 1 | Mean Difference (IV, Fixed, 95% CI) | Totals not selected | |
| 9 Subject perceived improvement | 1 | Odds Ratio (M‐H, Fixed, 95% CI) | Totals not selected |
Comparison 2. An arm support together with a conventional mouse versus a conventional mouse alone.
| Outcome or subgroup title | No. of studies | No. of participants | Statistical method | Effect size |
|---|---|---|---|---|
| 1 Right upper‐limb strain scale at 6‐week follow‐up | 1 | Mean Difference (IV, Fixed, 95% CI) | Totals not selected | |
| 2 Neck/shoulder discomfort score | 2 | 195 | Std. Mean Difference (IV, Random, 95% CI) | 0.02 [‐0.26, 0.30] |
| 3 Incidence of neck/shoulder disorder | 2 | 186 | Risk Ratio (M‐H, Random, 95% CI) | 0.91 [0.12, 6.98] |
| 4 Right upper extremity discomfort score | 2 | 195 | Std. Mean Difference (IV, Random, 95% CI) | ‐0.07 [‐0.35, 0.22] |
| 5 Incidence of right upper extremity disorders | 2 | 178 | Risk Ratio (M‐H, Random, 95% CI) | 1.07 [0.58, 1.96] |
| 6 Incidence of upper body disorders (neck, shoulder and upper limb) | 2 | 191 | Risk Ratio (M‐H, Random, 95% CI) | 0.87 [0.42, 1.80] |
| 7 Change in percentage of work time | 1 | Mean Difference (IV, Fixed, 95% CI) | Totals not selected | |
| 8 Change in average time to completely process a call | 1 | Mean Difference (IV, Fixed, 95% CI) | Totals not selected | |
| 9 Change in calls per hour | 1 | Mean Difference (IV, Fixed, 95% CI) | Totals not selected | |
| 10 Subject perceived improvement | 1 | Odds Ratio (M‐H, Fixed, 95% CI) | Totals not selected |
Comparison 3. Arm support for both arms versus no arm support.
| Outcome or subgroup title | No. of studies | No. of participants | Statistical method | Effect size |
|---|---|---|---|---|
| 1 Right upper‐limb strain scale at 6‐week follow‐up | 1 | Mean Difference (IV, Fixed, 95% CI) | Totals not selected |
Comparison 4. An alternative mouse alone versus a conventional mouse alone.
| Outcome or subgroup title | No. of studies | No. of participants | Statistical method | Effect size |
|---|---|---|---|---|
| 1 Neck/shoulder discomfort score | 2 | 195 | Std. Mean Difference (IV, Random, 95% CI) | 0.04 [‐0.26, 0.33] |
| 2 Incidence of neck/shoulder disorder | 2 | 182 | Risk Ratio (M‐H, Random, 95% CI) | 0.62 [0.19, 2.00] |
| 3 Incidence of right upper extremity disorder | 2 | 182 | Risk Ratio (M‐H, Random, 95% CI) | 0.91 [0.48, 1.72] |
| 4 Right upper extremity discomfort score | 2 | 195 | Std. Mean Difference (IV, Random, 95% CI) | 0.00 [‐0.28, 0.28] |
| 5 Incidence of upper body disorder (neck, shoulder, and upper extremity) | 2 | 190 | Risk Ratio (M‐H, Random, 95% CI) | 0.79 [0.52, 1.21] |
| 6 Change in percentage of work time | 1 | Mean Difference (IV, Fixed, 95% CI) | Totals not selected | |
| 7 Change in average time to completely process a call | 1 | Mean Difference (IV, Fixed, 95% CI) | Totals not selected | |
| 8 Change in calls per hour | 1 | Mean Difference (IV, Fixed, 95% CI) | Totals not selected | |
| 9 Subject perceived improvement | 1 | Odds Ratio (M‐H, Fixed, 95% CI) | Totals not selected |
Comparison 5. An alternative workstation adjustment versus no adjustment.
| Outcome or subgroup title | No. of studies | No. of participants | Statistical method | Effect size |
|---|---|---|---|---|
| 1 Incidence of neck and shoulder pain | 1 | 234 | Risk Ratio (M‐H, Fixed, 95% CI) | 1.08 [0.73, 1.59] |
| 2 Incidence of arm and hand pain | 1 | 245 | Risk Ratio (M‐H, Fixed, 95% CI) | 0.83 [0.50, 1.39] |
Comparison 6. Workstation adjustment according to OSHA/NIOSH recommendation compared to no workstation adjustment.
| Outcome or subgroup title | No. of studies | No. of participants | Statistical method | Effect size |
|---|---|---|---|---|
| 1 Incidence of neck and shoulder pain | 1 | 255 | Risk Ratio (M‐H, Fixed, 95% CI) | 1.19 [0.79, 1.78] |
| 2 Incidence of arm and hand pain | 1 | 249 | Risk Ratio (M‐H, Fixed, 95% CI) | 0.92 [0.56, 1.50] |
Comparison 7. Sit‐stand workstation versus normal workstation.
| Outcome or subgroup title | No. of studies | No. of participants | Statistical method | Effect size |
|---|---|---|---|---|
| 1 Intensity of neck and shoulder discomfort and pain | 1 | Mean Difference (IV, Fixed, 95% CI) | Totals not selected | |
| 2 Sitting time at 8‐week | 1 | Mean Difference (IV, Fixed, 95% CI) | Totals not selected |
Comparison 8. Supplementary breaks versus normal breaks.
| Outcome or subgroup title | No. of studies | No. of participants | Statistical method | Effect size |
|---|---|---|---|---|
| 1 After shift discomfort rating for neck (4‐8 weeks) | 2 | 186 | Mean Difference (Random, 95% CI) | ‐0.25 [‐0.40, ‐0.11] |
| 2 After shift discomfort rating for right shoulder or upper arm (4‐8 weeks) | 2 | 186 | Mean Difference (Random, 95% CI) | ‐0.33 [‐0.46, ‐0.19] |
| 3 After shift discomfort rating for right forearm or wrist or hand (4‐8 weeks) | 2 | 186 | Mean Difference (Random, 95% CI) | ‐0.19 [‐0.29, ‐0.08] |
Comparison 9. Biofeedback (vibration) to reduce hand idle time on mouse versus no intervention.
| Outcome or subgroup title | No. of studies | No. of participants | Statistical method | Effect size |
|---|---|---|---|---|
| 1 Shoulder Pain Intensity | 1 | Mean Difference (IV, Fixed, 95% CI) | Totals not selected | |
| 2 Upper Extremity Pain Intensity | 1 | Mean Difference (IV, Fixed, 95% CI) | Totals not selected | |
| 3 Relative Mouse Use over Total Computer Use | 1 | Mean Difference (IV, Fixed, 95% CI) | Totals not selected |
Comparison 10. Ergonomic training versus no intervention.
Comparison 11. Work injury prevention programme versus no intervention.
| Outcome or subgroup title | No. of studies | No. of participants | Statistical method | Effect size |
|---|---|---|---|---|
| 1 Frequency of neck ache or pain | 1 | Mean Difference (IV, Fixed, 95% CI) | Totals not selected | |
| 2 Frequency of shoulder ache or pain | 1 | Mean Difference (IV, Fixed, 95% CI) | Totals not selected | |
| 3 Frequency of wrist/hand ache or pain | 1 | Mean Difference (IV, Fixed, 95% CI) | Totals not selected | |
| 4 Intensity of neck ache or pain | 1 | Mean Difference (IV, Fixed, 95% CI) | Totals not selected | |
| 5 Intensity of shoulder ache or pain | 1 | Mean Difference (IV, Fixed, 95% CI) | Totals not selected | |
| 6 Intensity of wrist/hand ache or pain | 1 | Mean Difference (IV, Fixed, 95% CI) | Totals not selected |
11.4. Analysis.
Comparison 11 Work injury prevention programme versus no intervention, Outcome 4 Intensity of neck ache or pain.
11.5. Analysis.
Comparison 11 Work injury prevention programme versus no intervention, Outcome 5 Intensity of shoulder ache or pain.
11.6. Analysis.
Comparison 11 Work injury prevention programme versus no intervention, Outcome 6 Intensity of wrist/hand ache or pain.
Characteristics of studies
Characteristics of included studies [ordered by study ID]
Baydur 2016.
| Methods | The authors analysed the results as if participants had been individually randomised to groups. However, during the allocation process the authors employed cluster sampling of units. In the article the authors state: "For the allocation of the participants into the intervention and control groups, offices were used as cluster sampling units. Each office was stratified by the number of people working there with a simple random method, and then, the clusters were determined as intervention and control groups". | |
| Participants | 116 office workers working in the municipality using computers for at least 10 h, did not have a chronic disease related to the upper body regions, and agreed to participate were included in the study. Not being pregnant was another inclusion criterion for female participants. There was no clear statement on exclusion criteria. We received the additional information from the authors that the number of clusters was 16 in the control group with a total of 58 workers and similarly there were 16 clusters in the intervention group with a total of 58 workers. | |
| Interventions |
Intervention group (n = 58) Participatory ergonomic interventions consisting of two stages Stage 1 Conducted in the third month (after start of study) Provided with 2 h training aiming at the development of basic office ergonomics and individual risk assessment skills
Stage 2 Conducted in the forth month In the second stage, the participants in the intervention group were visited at work. During the visit, each employee used the “Hazard Identification‐Risk Assessment Checklist” developed by the researchers to assess their own risk assessment. The participants assessed their own risks through the checklist and produced solutions for those risks. The researchers and the participants together decided on how to implement these solutions. The solutions were implemented by asking questions of “who, where, when, and how” for each solution proposal. This implementation took approximately 15‐20 min for each participant. Control group (n = 58) An educational brochure developed during the study was handed out to the participants in the control group at the end of the study. |
|
| Outcomes | Participant reported the severity of symptoms using an 11‐point (ranging from 0‐10) symptoms severity scale. It depicts a human figure referring to various points on the upper body. While 0 indicates that there are no symptoms, 10 indicates that the symptoms’ severity is unbearable. Severity of symptoms in any part of the upper body as ≥ 5, it was decided that the symptoms outcomes developed for used analyses. The presence of symptoms was assessed 13 times on a monthly basis. To decide on the presence of symptoms, the participant’s injury should not be an off‐the‐job injury, he/she should work with the computer 1‐2 h per day at least for 10 days in that month, and if the participant is female, she must not be pregnant. To assess disability/symptom, two measurement tools were used. 1. Northwick Park Neck Pain Questionnaire (NPNP) NPNPQ was adapted from the Oswestry Low Back Pain Disability Questionnaire. It has nine items. Each item is scored from 0 to 4. The questionnaire questions neck‐related functional difficulties. Increasing scores indicate disability. 2. Quick Disability of the Arm, Shoulder and Hand Questionnaire (Quick DASH) The quick DASH assessment form questions the ability level to perform daily activities, symptoms, sleep, work, and the limitation in performing daily activities. The disability/symptoms section consists of 11 questions. The response scale ranges from 1 to 5. It also consists of a four question “work module.” Responding to this section is optional. Increasing scores indicate disability. |
|
| Notes | The authors kindly provided the data on the number of clusters (departments) that were randomised as having been 32 altogether, with 16 in the intervention and 16 in the control group. | |
| Risk of bias | ||
| Bias | Authors' judgement | Support for judgement |
| Random sequence generation (selection bias) | Unclear risk | There is no mention of how randomisation was obtained, risk of selection bias. |
| Allocation concealment (selection bias) | Unclear risk | There was no allocation concealment, risk of selection bias. |
| Blinding of participants and personnel (performance bias) All outcomes | High risk | Blinding of participants and personnel was not possible as intervention included participatory approach. The control group was not given any intervention during the study period. |
| Blinding of outcome assessment (detection bias) Musculoskeletal disorders | High risk | There was no blinding of outcome assessment as all the measures are self‐reported, symptoms and disability. |
| Incomplete outcome data (attrition bias) All outcomes | Low risk | There was equal attrition from both the intervention and control group (three from each group). The reason for the attrition was not clearly stated. |
| Selective reporting (reporting bias) | Low risk | All findings were reported. |
| Other bias | High risk | 1. Cross‐contamination of intervention effects may be an issue. The distance between the intervention and control groups were not indicated in the report. 2. The baseline characteristics comparing the intervention group and the control group were not presented. Only the results that the P value is more than 0.05, comparing the two groups on severity of symptoms and disability. 3. The analyses did not take clustering into account which creates a unit of analyses error. |
Bohr 2000.
| Methods | RCT. The participants were randomly assigned to 1 of 3 study groups | |
| Participants | The sample of 154 subjects was selected at random from a list of volunteers who were employed as agents at the centralised reservation facility for a large international transportation company. These individuals used computers at least 5 hours per work day. All of these individuals performed similar work tasks at similar workstations.
|
|
| Interventions | The study compared participatory education interventions, traditional education interventions, and no intervention Participatory Education Interventions It involved active learning sessions, incorporating discussions and problem‐solving exercises to aid the participants in applying ergonomic concepts to the work environment. It should be noted that the content was similar to that provided to the traditional group but the method of presenting the information differed. The educational sessions for this group lasted approximately 2 hours. The first portion of the educational session incorporated hands‐on demonstration of workstation evaluation and modification. Through case studies, the participants used a problem‐solving approach to recognise ergonomic problems and recommend solutions to address the problem. The second portion of the session paired participants and returned them to their work areas to evaluate and modify the areas according to the information received during the first portion of the session. The modifications were made under the supervision of the instructor for the course who provided assistance to ensure that the newly arranged work areas were consistent with the principles taught in the class. Traditional education It involved a 1‐hour education session that consisted of a lecture and informational handouts about office ergonomics. The education for this group included information about basic muscle physiology, ideal neutral postures, basic task analysis, recommended office equipment location, recognition of problems related to incorrect equipment placement, and general wellness information related to exercise, nutrition, and smoking. A brief question and answer session was included at the end of the session. Control group/no intervention The control group did not participate in any education sessions. |
|
| Outcomes |
Primary outcome Upper body pain/discomfort composite scores at baseline and at 3, 6, and 12 months' post‐intervention. The discomfort scores ranged from 1 to 4 for each body part for pain and discomfort during the past week (1 = never, 2 = occasional, 3 = several times per week, 4 = several times per day). The upper body composite score included neck, upper back, shoulder or upper arm, forearm, and wrist/hand. Secondary outcome Compliance ‐ work area configuration composite score at baseline and at 3, 6, and 12 months' post‐intervention |
|
| Notes | ‐ | |
| Risk of bias | ||
| Bias | Authors' judgement | Support for judgement |
| Random sequence generation (selection bias) | Unclear risk | The method of randomisation was not described in the study. The only information provided was: "The participants were randomly assigned to one of three study groups". |
| Allocation concealment (selection bias) | Unclear risk | There was no information on allocation concealment. |
| Blinding of participants and personnel (performance bias) All outcomes | High risk | Blinding of participants and personnel was not possible as intervention included educational sessions. |
| Blinding of outcome assessment (detection bias) Musculoskeletal disorders | High risk | Upper body pain/discomfort composite score was self‐reported and subjective. |
| Incomplete outcome data (attrition bias) All outcomes | High risk | The attrition rate was not even across the 3 groups. No ITT analysis mentioned. The attrition rate for both of the intervention groups was more than double that of the control group (23%–24% for the intervention groups vs 11% for the control group). |
| Selective reporting (reporting bias) | Low risk | Reported on all findings. According to the authors: "there were no significant differences noted across groups for work area configuration, worker postures, or overall observation scores". |
| Other bias | High risk | 1. Cross‐contamination of intervention effects owing to close proximity of the workstations 2. There was no information on baseline characteristics comparing the 2 intervention groups and the control group |
Bohr 2002.
| Methods | RCT. The participants were randomly assigned to either the traditional education intervention group or the participatory education intervention group. | |
| Participants | The sample of 102 participants was selected from a list of workers employed as agents at the centralised reservation facility for a large international transportation company who volunteered to participate in the project. These individuals used computers at least five hours per workday. All of these individuals performed similar work tasks at similar workstations.
|
|
| Interventions |
Traditional Education Intervention “Workers in the traditional education intervention group participated in a one‐hour education session that consisted of lecture and informational handouts about office ergonomics. The education for this group included information about basic muscle physiology, ideal neutral postures, basic task analysis, recommended office equipment location, recognition of problems related to incorrect equipment placement, and general wellness information related to exercise, nutrition, and smoking. A brief question and answer period was included at the end of the session.” Participatory Education Intervention “Workers in the participatory education intervention group were involved in active learning sessions incorporating discussions and problem solving exercises to aid in applying ergonomic concepts to the work environment. It should be noted that the content was similar to that provided to the traditional group but the method of presenting the information differed. The educational sessions for this group lasted approximately two hours. The first part of the educational session incorporated hands‐on demonstration of workstation evaluation and modification. Through case studies, the participants used a problem solving approach to recognize ergonomic problems and recommend solutions. The second portion of the session paired participants and returned them to their work areas to evaluate and modify the areas according to the information received during the first part of the session. The modifications were made under the supervision of the instructor for the course who provided assistance to ensure that the newly arranged work areas were consistent with the principles taught in the class.” |
|
| Outcomes |
Primary outcomes (assessed through self‐reported survey at 0, 3, 6, and 12 months)
Secondary outcome (assessed through observation check‐list by the researcher)
|
|
| Notes | ||
| Risk of bias | ||
| Bias | Authors' judgement | Support for judgement |
| Random sequence generation (selection bias) | Unclear risk | No information on sequence generation; only information was: "The participants were randomly assigned...". |
| Allocation concealment (selection bias) | Unclear risk | There was no information on allocation concealment. |
| Blinding of participants and personnel (performance bias) All outcomes | High risk | Participants were not blinded to the allocation of the intervention group. |
| Blinding of outcome assessment (detection bias) Musculoskeletal disorders | High risk | The main outcome “pain/discomfort” was measured by self‐administered survey questionnaire. |
| Incomplete outcome data (attrition bias) All outcomes | High risk | High as the attrition rate was 28% (Paticipatory Education group) and 25% (Traditional Education group), there was no mentioned of ITT, and the information presented in the report does not indicate any ITT. |
| Selective reporting (reporting bias) | Low risk | No information suggestive of selective reporting, all outcomes were reported in the results section. |
| Other bias | High risk |
|
Brisson 1999.
| Methods | Cluster RCT. Workers were assigned to the experimental or reference group (no intervention) on the basis of the units in which they worked. 40 administrative and geographic units were randomised to the experimental group or reference group. The units were stratified before randomisation on the basis of the number of clerical workers (< 20 and ≥ 20) and type of services (administrative and teaching) in order to ensure equal distribution of these features in each group. | |
| Participants | The study population composed of workers employed in a large university (90%) and in other institutions involved in university services (10%). Eligible workers were those working 5 hours or more per week with a VDU. 627 workers (81% of the people eligible at baseline) participated in both data collection periods (baseline and 6 months). They consists of:
|
|
| Interventions | The study compared PRECEDE intervention vs no intervention. PRECEDE intervention group The ergonomic training programme was developed according to the PRECEDE model. “The objective of the programme was to act on characteristics of the work environment and the workers that determine behaviour in order to motivate and to enable the workers to improve the ergonomic features of their workstation. Predisposing factors relate to knowledge, beliefs, attitudes, and values; enabling factors relate to skills and material resources; and reinforcing factors relate to support provided by the environment.” The programme targeted the following 3 types of behaviour:
The programme composed of 2 sessions of 3 hours each with a 2‐week interval
Reference/no intervention group The reference group did not receive the training until the completion of the study |
|
| Outcomes |
Primary outcome Neck‐shoulder and hand‐wrist musculoskeletal symptoms were assessed using a self‐administered questionnaire and by physical examination by physician. The measurements were performed 2 weeks before and 6 months after the intervention in both groups. The prevalent MSDs on the questionnaire were defined as those that were present on 3 days or more during the last 7 days and for which the intensity of pain was greater than half the visual analogue scale among subjects with no history of inflammatory disease or acute injury at the relevant anatomical site. The physical examination by physician was performed on workers who reported symptoms meeting the case definition. The physical examination was conducted according to a standard protocol by a trained occupational therapist blinded to the participant's assigned group. The physical examination was performed 2 to 5 weeks after the completion of the self‐administered questionnaire. Secondary outcome Compliance with the intervention |
|
| Notes | The information for the neck‐shoulder and hand‐wrist musculoskeletal symptoms was available for the 2 groups (i.e. < 40 years and ≥ 40 years) combined comparing before and after intervention, and for 3 anatomical regions combined (neck or shoulder, wrist/hand and lower back) comparing intervention and reference before and after intervention. No information was available for neck or shoulder and wrist or hand alone comparing the effect of intervention and reference group. The author provided the additional data; i.e. Intracluster Correlation Coeficient (ICC), prevalence of musculoskeletal symptoms for all subjects for each site collected by questionnaire at baseline, and prevalence of musculoskeletal symptoms for all subjects for each site collected by medical examination at baseline and follow‐up. |
|
| Risk of bias | ||
| Bias | Authors' judgement | Support for judgement |
| Random sequence generation (selection bias) | Unclear risk | There was no information on sequence generation. The method for randomisation was clearly described. |
| Allocation concealment (selection bias) | Unclear risk | There was no information on allocation concealment. |
| Blinding of participants and personnel (performance bias) All outcomes | High risk | Participants were not blinded to the allocation as the intervention consisted of training. |
| Blinding of outcome assessment (detection bias) Musculoskeletal disorders | High risk | Although the physical examination was performed by trained occupational therapists blinded to the subjects' assigned group, the examination was only performed on workers who reported symptoms meeting the case definition which was based on self‐reporting/subjective symptoms. |
| Incomplete outcome data (attrition bias) All outcomes | Low risk | Although there was no mention of ITT, the percentages of participants were high at each measurement (88% and 94%). And according to the author "The percentages and reasons for non‐participation were comparable in the experimental and reference groups". |
| Selective reporting (reporting bias) | Low risk | All outcomes were reported in the results. |
| Other bias | High risk | There was no information on baseline characteristics comparing the 2 groups, so the success of randomisation could not be ascertained. |
Conlon 2008.
| Methods | RCT. Participants were randomised into 1 of 4 intervention groups. The randomisation was done by means of a computer‐generated permuted‐block sequence. | |
| Participants | Participants consisted of employees working at a large aerospace engineering firm in California, US that estimated working at a computer for at least 20 hours per week and were employed as an member of the engineering staff (93%) or a professional position supporting engineering (7%) and had completed the health questionnaire and at least 4 weekly surveys. Since 1 of the mouse interventions could only be used right‐handed, only those who agreed to use their right hand for the mouse pointing device intervention were eligible for the study. Out of a total of 437 eligible employees, 206 people volunteered. The participants were randomised into 4 groups:
154 people volunteered for the nerve conduction testing |
|
| Interventions | The study compared 4 different interventions for computer workstations
|
|
| Outcomes |
Primary outcomes
|
|
| Notes | The study was reported in 2 papers (see Conlon 2008). | |
| Risk of bias | ||
| Bias | Authors' judgement | Support for judgement |
| Random sequence generation (selection bias) | Low risk | "Participants were randomised into one of four intervention groups. The randomisation was done by means of a computer‐generated permuted‐block sequence". |
| Allocation concealment (selection bias) | Unclear risk | There was no information on allocation concealment. |
| Blinding of participants and personnel (performance bias) All outcomes | High risk | Blinding of participants not possible given that different equipment was tested in the 4 groups. |
| Blinding of outcome assessment (detection bias) Musculoskeletal disorders | High risk | MSDs: although the examination was performed by 1 physician who was blinded to the intervention status, the pre‐examination criteria for inclusion in the examination was determined by subjective discomfort levels. |
| Incomplete outcome data (attrition bias) All outcomes | Low risk | The analysis followed an ITT protocol. As participant exited the study they completed the exit questionnaire. |
| Selective reporting (reporting bias) | Low risk | All the results for musculoskeletal discomfort, MSDs, and distal motor latency were reported. |
| Other bias | High risk | Those who volunteered for the study were different:
Owing to this the effect may be larger than expected. |
Galinsky 2000.
| Methods | Cross‐over RCT. Data were collected over a 16‐week period. The 16‐week period was divided into 4, 4‐week phases in which participants alternated between the conventional (C) and supplementary (S) rest break schedules. Half of the volunteers from each shifts (day and night) were assigned at random to experience the C‐S‐C‐S order of rest break schedules and the other half were assigned at random to experience the opposite (S‐C‐S‐C) order. As a result of attrition, data from just the first 2 phases of the study were sufficient for analyses (i.e. the C‐S phases). | |
| Participants | Data‐entry operators (seasonal employees) working at an Internal Revenue Service Center. The data‐entry task entailed keying mostly numeric data from paper tax forms using a standard keyboard with a right‐sided numeric keypad. A total of 101 data‐entry operators provided written voluntary, informed consent to participate in the study. Each data‐entry operator had been hired as a 'seasonal' employee under an agreement that the job was temporary. The time at which each operator was released from employment was determined by the workload demands of the facility. | |
| Interventions | The study compared supplementary breaks with conventional breaks
|
|
| Outcomes |
Primary outcome
Secondary outcomes
|
|
| Notes | The author kindly provided additional data on mean and standard deviation for the outcomes after the experimental supplementary breaks condition and after the control condition. | |
| Risk of bias | ||
| Bias | Authors' judgement | Support for judgement |
| Random sequence generation (selection bias) | Unclear risk | There was no information on sequence generation. The only information available was: "A within‐subjects/repeated measures design was used … Half of the volunteers from each shift (day and night) were assigned at random to experience the C‐S‐C‐S order of rest break schedules, and the other half were assigned at random to experience the opposite (S‐C‐S‐C) order". |
| Allocation concealment (selection bias) | Unclear risk | There was no information on allocation concealment. |
| Blinding of participants and personnel (performance bias) All outcomes | Low risk | Blinding not possible, but the risk of performance bias was assessed as low as the intervention consisted of a strict protocol. The study participants "...use custom‐made electrical timers, attached to the top of each video display terminal, to automatically signal their scheduled breaks". |
| Blinding of outcome assessment (detection bias) Musculoskeletal disorders | High risk | The outcome has only subjective symptoms, i.e. musculoskeletal discomfort ratings (feeling state). |
| Incomplete outcome data (attrition bias) All outcomes | High risk | Out of the 101 people who volunteered to participate in the study only 42 participants were included in the final analysis. Only the data from the first (first cross‐over) of the 2 phases were sufficient for analysis. Data from the second phase (second cross‐over) were not analysed. Loss to follow‐up amounted to 38 participants and the reasons cited were release from employment and resignation from employment. Questionnaires from 21 participants were too incomplete for analyses. |
| Selective reporting (reporting bias) | Low risk | The outcomes listed in the methods section were reported in the results. |
| Other bias | Low risk | The authors reported that "to minimize the potential influence of carry‐over effects and 'Hawthorne effects'… Data from the first 2 weeks of each 4‐week phase were excluded from analyses of the feeling state questionnaire items". |
Galinsky 2007.
| Methods | Cross‐over RCT. Approximately half (23) of the volunteers in each exercise condition were assigned at random to work for 4 weeks under conventional schedule and then switch to the supplementary schedule for the second 4‐week phase. The remaining 22 volunteers in each exercise condition were assigned at random to experience the opposite sequence of rest break conditions. | |
| Participants | Data‐entry operators (seasonal employees) working at an Internal Revenue Service centre, Cincinnati, OH, US. The study sample was recruited from 1 area of the centre containing workstations for 101 individuals, 90 of whom volunteered to follow the study protocol. | |
| Interventions | The study compared supplementary breaks with conventional breaks. Half of the 90 volunteers were assigned at random to the stretching exercise condition and half were assigned to the no‐stretching exercise condition. The 8‐week study period was divided into two 4‐week phases in which all participants alternated between the conventional and supplementary rest break schedules
All participants were encouraged to get up and walk away from their workstations during each break, regardless of their assigned break schedule or exercise condition. Under each schedule, a 30‐minute lunch period, additional to the 8 hours of work and break time, occurred in the middle of the shift. Participants in the exercise condition viewed a demonstration of the stretching exercises performed by the principal investigator with opportunities for questions and answers. They also kept a paper copy of exercise instructions at their workstations. They were instructed to do the stretches at the beginning of each break in the order specified in the instructions. The first 6 stretches were performed while seated and the last 3 stretches could be done while standing or walking. The 9 stretches required no more than 2 minutes to complete. |
|
| Outcomes |
Primary outcome Musculoskeletal discomfort ratings (feeling state) for several parts of the body, including the neck, shoulders, upper arms, elbows, forearms, wrists, hands, back, buttocks, and legs. The musculoskeletal discomfort was made using a 5‐point category rating scale in which the whole numbers 1 to 5 indicated ratings of 'none at all', 'a little', 'moderate', 'quite a bit', and 'extreme', respectively. |
|
| Notes | The data for the conventional and supplementary break cycle consists of the combination of participants in both exercise and no exercise groups. The effect of breaks alone cannot be isolated. The author provided additional data on mean and standard deviation. |
|
| Risk of bias | ||
| Bias | Authors' judgement | Support for judgement |
| Random sequence generation (selection bias) | Unclear risk | There was no information on sequence generation. The only information available is that "… the exercise group and the non‐exercise group… were assigned at random to work for 4 weeks under the Conventional schedule and then switched to the Supplementary schedule for the second 4‐week phase" and "approximately half (23) of the volunteers in each exercise condition were assigned at random to work for 4 weeks under the Conventional schedule and then switched to the Supplementary schedule for the second 4‐week phase". |
| Allocation concealment (selection bias) | Unclear risk | There was no information on allocation concealment |
| Blinding of participants and personnel (performance bias) All outcomes | Low risk | Blinding was not possible but the risk of performance bias was deemed low for a rest‐break cycle as the implementation consisted of a strict protocol. The participants "use custom‐made electrical timers, attached to the top of each video display terminal, to automatically signal their scheduled breaks". However, as this study compared 2 exercise regimens that were not blinded, the risk of bias was deemed high for the combination of the 2 interventions. |
| Blinding of outcome assessment (detection bias) Musculoskeletal disorders | High risk | The outcome had only subjective symptoms, i.e. musculoskeletal discomfort ratings (feeling state). |
| Incomplete outcome data (attrition bias) All outcomes | High risk | Out of the 90 who volunteered to follow the study protocol only 51 were deemed to have complete data for analysis. According to the text "An individual's data set was deemed incomplete if more than 4 consecutive days of questionnaires were missing, or if more than a total of 8 days of questionnaires were missing from either the first or second 4‐week period of the study". |
| Selective reporting (reporting bias) | Low risk | The risk of selective reporting (reporting bias) was deemed low as all outcomes were reported, the author reported on non‐significant outcome: "In the stretch group, workers reported stretching during only 25% of conventional breaks and 39% of supplementary breaks, and no significant effects of stretching on discomfort or performance were observed". |
| Other bias | High risk | There was no comparison of the 2 intervention groups. Potential of carry‐over effect, as the authors did not state having used a wash‐out period. |
Gatty 2004.
| Methods | RCT. The participants were randomly assigned to 1 of 2 groups. | |
| Participants | "All participants were female and met the inclusion criteria by being employed as full‐time clerical/office workers at a small western Pennsylvania college, and having no newly (within the last three months) diagnosed MSD". 15 workers participated in the study. | |
| Interventions | The study compared individualised WIPPs vs no intervention Individualised WIPPs (group A) The WIPP were designed by the WIPP team (3 master of occupational therapy students and the principle investigator) was based on the work site analyses. Treatment sessions spanned weeks 1 through to 4. Each participant received 1 hour of treatment per week. During these 4 sessions the workers were actively engaged in education, workstation redesign, and task modification.
No intervention (control) (group B) This group received no intervention. All participants (intervention and control group) received the symptom evaluation measure (measured the reported frequency and intensity of symptoms), stress and energy scale (10‐cm VAS to measure perceived stress energy levels), and follow‐up survey (to identify changes in work status) |
|
| Outcomes |
Primary outcomes
Secondary outcome Compliance survey – for group A (intervention) only ‐ about: how often they used the issued ergonomic equipment, how often they performed recommended stretches and whether or not they performed their job duties differently based on recommendations. Responses were elicited on a 4‐point Likert scale with choices of 1 = never, 2 = sometimes, 3 = usually, 4 = always when I should. |
|
| Notes | The study was reported in 2 papers (see Gatty 2004):
|
|
| Risk of bias | ||
| Bias | Authors' judgement | Support for judgement |
| Random sequence generation (selection bias) | Unclear risk | There was no mention of sequence generation. The only information given was: "This was a two‐phased randomized control pilot study with between and within subject comparisons … Participants were randomly assigned to one of two groups, A (intervention) or B (control)". |
| Allocation concealment (selection bias) | Unclear risk | No information provided on allocation concealment. |
| Blinding of participants and personnel (performance bias) All outcomes | High risk | There was no information on blinding and since the intervention consists of education, workstation redesign, and task modification, there was high risk for bias. |
| Blinding of outcome assessment (detection bias) Musculoskeletal disorders | High risk | The outcome was subjective reporting of symptoms frequency and intensity. |
| Incomplete outcome data (attrition bias) All outcomes | High risk | In group A (intervention), "one non‐compliant worker at week zero remained non‐compliant at week five and was dropped from the study. One person was no longer employed by week 16 and membership decreased to six". In group B (control) "…Although there were originally eight participants, two different workers were non‐compliant with surveys, one at week zero and one at week five. By week 16, one person had left employment". Owing to the small number of participants, i.e. 16, the attrition of 3 participants was considered to induce a high risk of bias. |
| Selective reporting (reporting bias) | Low risk | All the outcomes were reported. |
| Other bias | High risk |
|
Gerr 2005.
| Methods | RCT. Randomisation occurred following evaluation of workplace and ergonomic variables. The use of a random number table assured that each subject entering the study had an equal probability of being assigned to each of the 3 groups. Randomisation was done in blocks of 6 to assure equal numbers of participants in each of the study groups. | |
| Participants | A person eligible for inclusion in this study was: a newly hired worker who: anticipated using a single computer workstation for 15 hours or more per week and anticipated using a computer workstation for at least as many hours per week as in his/her previous job working at insurance and financial companies, food product producers, and universities in metropolitan Atlanta, GA, US who had reported experiencing arm or hand symptoms during the week prior to intervention. Of the 447 eligible for health screening, a total of 379 individuals were eligible for inclusion into 1 or both cohorts (those who did not report experiencing arm or hand pain and neck or shoulder pain during the week prior to the study. 375 people were randomised into the arm and hand cohort and 356 were randomised into the neck and shoulder cohort. |
|
| Interventions | The study compared alternate intervention, conventional intervention, and no intervention A study staff member reconfigured the subject's workstation if the subject was randomly assigned to either the alternative or conventional interventions (groups A or B). Verbal and written instructions describing the desired posture were provided to all group A and B participants. At 3 days and 1 week after the intervention, study staff returned to the participant's workplace to check on continued maintenance of the posture. If the posture had changed from the intervention, additional workstation changes were made and additional instruction given. Group A: alternate intervention The workstation was adjusted according to the following configuration:
Group B: conventional intervention The workstation was adjusted according to the following configuration:
Group C: no intervention Participants instructed to continue keying in their usual posture and no changes were made to their workstations. |
|
| Outcomes |
Primary outcome Time to event: symptoms of pain or discomfort ‐ participants were classified as having experienced musculoskeletal symptoms if they (1) reported musculoskeletal discomfort on any day of the week with a severity of ≥ 6 on the 0 to 10 VAS or (2) reported musculoskeletal discomfort on any day of the week for which they took medication (over‐the‐counter or prescription). Study participants were followed for each outcome separately until they became symptomatic (censored). Development of a symptom in one anatomic area did not stop the collection of data for the other anatomic area. Two separate, overlapping cohorts were then defined to examine separately the risks of neck or shoulder symptoms and the risks of arm or hand symptoms. Secondary outcome Compliance: using a standard checklist, each workstation was evaluated for presence of specific items (e.g. mouse or other pointing device), and the adjustability of specific equipment. Following completion of the checklist, dimensional and angular measurements (e.g. seated elbow height, table surface height, keyboard inner elbow angle) were recorded. |
|
| Notes | Gerr 2005 consisted of two overlapping cohorts. The effect of the intervention was assessed as arm/hand and neck or shoulder pain. | |
| Risk of bias | ||
| Bias | Authors' judgement | Support for judgement |
| Random sequence generation (selection bias) | Low risk | The use of a random number table assured that each subject entering the study had an equal probability of being assigned to each of the 3 groups. Randomisation was done in blocks of 6 to assure equal numbers of participants in each of the study groups. |
| Allocation concealment (selection bias) | Unclear risk | No information on allocation concealment. |
| Blinding of participants and personnel (performance bias) All outcomes | High risk | There was no mention of blinding and the methods of intervention consisted of 2 distinct workstation and postural interventions. |
| Blinding of outcome assessment (detection bias) Musculoskeletal disorders | High risk | Outcomes consisted of subjective symptoms measured with a checklist. |
| Incomplete outcome data (attrition bias) All outcomes | Low risk | Participants contributed data to their assigned intervention group regardless of compliance (i.e. data were analysed by ITT). |
| Selective reporting (reporting bias) | Low risk | Key findings: there were no significant differences in the incidence of musculoskeletal symptoms among the 3 intervention groups. |
| Other bias | High risk | Large number of drop‐outs. "There were a large number of drop‐out/lost to follow‐up in arm/hand cohort – 147 (41% of those followed) were lost during the six month follow up period … No differences were observed in dropout rates (i.e. incomplete follow‐up) across the three intervention groups". Although the drop‐out rates were similar across the 3 randomised groups, there were a large number of drops‐outs in each group (36 to 42 across all 6 groups) for which the authors did not provide a reason. |
Graves 2015.
| Methods | RCT. "Following baseline assessments, participants were assigned by one member of the research team to a treatment arm using a randomised block design and random number table. Departments served as blocks and participants within departments were randomly assigned at the individual‐level to an arm. Assignment of individual participants within each department alternated between arms (i.e. intervention, control, intervention, control… )" | |
| Participants | "Office workers from one organisation (Liverpool John Moores University, Liverpool, UK) ... Consent was sought from 11 departmental managers ... Departments were located across four buildings with varying office layout (open‐plan, individual offices or a combination). Employees within the approached departments were predominantly administrative staff. Inclusion criteria a) full‐time member of staff, b) access to a work telephone and desktop computer with Internet, c) no cardiovascular or metabolic disease, d) not taking any medication, e) not pregnant and, f ) no planned absence >1 week during the trial" 503 emails were sent to invite participants from the 11 departments: 54 responded, 6 were excluded, 1 withdrew for medical reasons, 47 were randomised. |
|
| Interventions | "Treatment arms included a sit‐stand workstation intervention group (each participant received a sit‐stand workstation) and a control group (usual practice)." "A single (manufacturer’s suggested retail price £360) or dual (£375) monitor WorkFit‐A with Worksurface + workstation was installed, dependent on the number of monitors the participant had. The computer monitor(s) and keyboard were housed on the workstation and the workstation could be quickly raised up and down by hand to enable seated or standing work." |
|
| Outcomes |
Primary outcome Levels of discomfort or pain Assessment methods: "Using a questionnaire adapted from a previous trial, participants rated their current level of discomfort or pain at three sites (lower back, upper back, neck and shoulders) on a Likert scale from 0 (no discomfort) to 10 (extremely uncomfortable)." Time of assessment: Baseline and 8‐week Secondary outcome Sitting, standing and walking time Assessment methods: "The EMA diary assessed time spent sitting (primary outcome), standing, walking and in other activities during work hours over 5 days (Monday‐Friday). At 15‐minute intervals participants used a paper‐based diary to record their main behaviour in response to the question: “What are you doing right now?” The behaviour options were sitting, standing, walking or other. If other was selected, participants were instructed to write the activity they were doing." Time of assessment: Baseline, 4‐week and 8 week |
|
| Notes | The level of discomfort and pain is not the main outcome for the study, the study was "Associated effects on vascular and metabolic disease risk markers were evaluated, as was the acceptability and feasibility of sit‐stand workstations in a real office setting." The information presented in this review only consists of level of discomfort of the neck and shoulders. | |
| Risk of bias | ||
| Bias | Authors' judgement | Support for judgement |
| Random sequence generation (selection bias) | Low risk | Randomisation was based on random block design and random number table, "Following baseline assessments, participants were assigned by one member of the research team to a treatment arm using a randomised block design and random number table". |
| Allocation concealment (selection bias) | High risk | The allocation of participants to the intervention and control arm were not concealed; "Assignment of individual participants within each department alternated between arms (i.e. intervention, control, intervention, control… )". |
| Blinding of participants and personnel (performance bias) All outcomes | High risk | Participants were not blinded to the allocation as the intervention consists of installing a new sit‐stand workstation: “After baseline assessments, each participant had a sit‐stand workstation installed on their existing workplace desk”. |
| Blinding of outcome assessment (detection bias) Musculoskeletal disorders | High risk | The main outcome assessment on the discomfort and pain: “Using a questionnaire adapted from a previous trial, participants rated their current level of discomfort or pain at three sites (lower back, upper back, neck and shoulders) on a Likert scale from 0 (no discomfort) to 10 (extremely uncomfortable)”. |
| Incomplete outcome data (attrition bias) All outcomes | Low risk | ITT was only performed as a sensitivity analysis, “For workplace sitting, standing and walking, the per‐protocol analysis was compared with an intention‐to‐treat analysis, as a sensitivity analysis.” However, the attrition rate for the discomfort and pain outcome were low
|
| Selective reporting (reporting bias) | Low risk | No information suggestive of selective reporting, all outcome were reported in the results section |
| Other bias | High risk | The number of males to females in the intervention and control groups was not equally distributed, there were only around 10% (3/26) males in the intervention group as compared to 30% (7/21) in the control groups. |
Greene 2005.
| Methods | RCT. “A prospective two‐group experimental design with a delayed intervention for the control group was used” … “Because the size of the training classes was limited to no more than 25, participants were randomly assigned to one of four training groups. Two training groups were combined to form the intervention group and two training groups formed the control group.” |
|
| Participants | Participants included all employees in the unit who worked at a computer at least 10 hours per week in an organisational unit of a large state university in southeast US. Employees diagnosed by a physician as having an acute musculoskeletal injury or trauma to the trunk or upper extremities within the previous 6 months were excluded from participation. Employees being treated by a healthcare professional for cervical or upper extremity disorders were excluded from participation. 87 employees participated in the study. |
|
| Interventions | The study compared active ergonomic training with no intervention. Active ergonomic training (AET) The AET programme consisted of a total of 6 hours of didactic interactions, discussion, and problem‐based activities. The AET group met on 2 days in the same week for 3 hours per session. The AET programme occurred during working hours and employees participated on company time. Key elements of the AET programme were:
No intervention (control) The participants did not received intervention until week 4 of the study |
|
| Outcomes |
Primary outcomes
|
|
| Notes | The authors reported results for both the randomised and delayed intervention given to the control group (at week 4). From week 0 to week 3 the groups were treated according to their randomisation to the AET programme group and the control group. On week 4 the control group were also given the AET programme. We only included data from week 3. | |
| Risk of bias | ||
| Bias | Authors' judgement | Support for judgement |
| Random sequence generation (selection bias) | High risk | There was no information on sequence generation and the randomisation was not adhered to in the allocation of participants. "After participants were randomly assigned to groups, the physical proximity of participant work locations in the intervention and control groups was assessed. To minimize the diffusion of treatment effects, participants from the same work location were assigned to the same study group (intervention or control)". |
| Allocation concealment (selection bias) | Unclear risk | There was no information on allocation concealment. |
| Blinding of participants and personnel (performance bias) All outcomes | High risk | The participants and personnel were not blinded. The purpose of this study was to evaluate the effectiveness of an (AET programme in computer users. Subjects participated in a 6‐hour training intervention at their workplace. |
| Blinding of outcome assessment (detection bias) Musculoskeletal disorders | High risk | The outcome consists of subjective symptoms of pain or discomfort. |
| Incomplete outcome data (attrition bias) All outcomes | Unclear risk | There was no information on ITT analysis and loss to follow‐up for the RCT part of the study. After the third week the control group were given the same intervention. |
| Selective reporting (reporting bias) | Low risk | No significant differences were found for intensity of symptoms, frequency of symptoms, or duration of symptoms in any body region immediately post intervention. |
| Other bias | Low risk | There was no significance difference between the main outcome measures between intervention and control groups; i.e. intensity, frequency and duration of musculoskeletal symptoms at baseline. |
King 2013.
| Methods | RCT. "Participants were randomly allocated to a control group (n = 12) or an intervention group (n = 11). One month after T0 data collection, participants were allocated to either study group using simple randomisation with a 1:1 ratio." | |
| Participants | Fifty‐six office workers from a research organisation (the Institute for Work & Health, Ontario, Canada) of 74 employees met the inclusion criteria and were invited to participate in the study. Twenty‐three of the 56 invited agreed to participate.
|
|
| Interventions | The Hoverstop1 mouse (Vibramouse 2011) provided feedback to the worker by gently vibrating if the worker’s hand had been idle on the mouse for more than 12s. The vibration lasted for a maximum of 4 s. There was no minimum vibration time. The mouse would vibrate until the hand was removed, a mouse button was clicked, the scroll wheel was activated or the maximum vibration time was met (4 s). The feedback was a reminder to rest the arm in neutral postures when not in use. Unlike other break software, the Hoverstop1 does not deliver break messages to the user visually on the monitor. All participants received the alternative mouse with the vibration mechanism turned off during T0 measurements. The vibration mechanism remained turned off in the control group after baseline measurements. All participants received the corresponding Hoverstop1 monitoring software to monitor individual mouse, keyboard and computer activity continuously. All participants were invited to attend a 1‐h study information session with time for questions and answers; attendance was optional. The vibration mechanism was initiated in the intervention group one month after T0 and remained active until the end of the study. The intervention group members were invited to watch a video produced by the manufacturer about the intervention device at their workstation, via a link provided in an email delivered by the research coordinator. The video suggests resting the arm on the desk in front of you when not actively using the mouse, to decrease muscle activation in the shoulder and arm. |
|
| Outcomes |
Activation: randomisation into intervention and control groups
Pain and discomfort: collected using an online Daily Symptom Survey ‐ Participants were asked to rate their pain at that point in time. The DSS includes a body map with the following areas identified: neck, shoulders, upper back, elbow, lower back, lower arm or wrist or hand, buttock or thighs, knees, lower leg/ankles/feet. Pain and discomfort scores were averaged over the three days of administration for analysis. Mouse use (active hand‐on‐mouse time plus idle hand‐on‐mouse time), Keyboard use (active keyboard time), total computer use (mouse use plus keyboard use), Relative mouse use (RMU: mouse use over the total computer use) were "measured using the Hoverstop ® monitoring software in both the intervention and control groups. An electric‐potential transducer registered when a user’s hand was on or hovered just above the mouse. This feature is believed to give a more accurate measure of exposure to the proposed mechanism of discomfort – static (possibly unsupported) mousing postures – than other collection methods that strictly utilise mouse movements and functions. Keyboard use was measured by the duration of each key compression, while total computer use was determined as the sum of keyboard use and mouse use." |
|
| Notes | ||
| Risk of bias | ||
| Bias | Authors' judgement | Support for judgement |
| Random sequence generation (selection bias) | Low risk | "A statistician not connected to the study used a random number generator in SAS V. 9.2 to generate the random allocation sequence". |
| Allocation concealment (selection bias) | Unclear risk | The methods of allocation were not the mentioned. |
| Blinding of participants and personnel (performance bias) All outcomes | High risk | No blinding of participants: “Participants were not blinded to their groups. Those in the intervention group would have been aware of their group due to the nature of the intervention (the vibrating mouse)”. |
| Blinding of outcome assessment (detection bias) Musculoskeletal disorders | High risk | The main outcome assessment on the “pain and discomfort collected using an online Daily Symptom Survey administered in the afternoon for three consecutive days at each data collection point: T0, T1 and T2. Participants were asked to rate their pain at that point in time”. The participants themselves rate their pain and discomfort. |
| Incomplete outcome data (attrition bias) All outcomes | Low risk | “An intention to treat analysis was conducted”, there was also low loss to follow‐up; “There was a low loss to follow‐up (1/23; one participant from the control group), with an additional loss of mouse use data at T2 for two other participants in the control group (see Figure 2 for participant tracking)”. |
| Selective reporting (reporting bias) | Low risk | No information of selective reporting, all outcomes were reported in the results section. |
| Other bias | Unclear risk | The demographic data of the participants and the pre‐existing musculoskeletal symptoms of the participants were not collected due to ethical consideration; "Confidentiality and voluntary participation were stressed. Demographics (such as age, gender, job type and preexisting symptoms) were not collected due to ethical considerations, since the study was executed within our research institute." The successful randomisation of the participants was not able to be ascertain due to this reason. |
Lintula 2001.
| Methods | RCT. After the first measurements the participants were randomly assigned to 3 groups of 7 participants | |
| Participants | The participants were 21 healthy female VDU users without acute musculoskeletal symptoms. They were office employees and researchers with a mean age of 38 years (range 26 to 54 years). The participants had worked with a VDU for more than 20 hours a week for an average of 5 years (range 4 months to 13 years). All the participants were right‐handed but 3 of them operated their mouse with their left hand. | |
| Interventions | The study compared Ergorest articulating arm supports with no arm support. "Ergorest articulating arm supports (Ergorest Ltd, Finland) were used in this study. The arm supports are attached to the table, and the height of the supports can be adjusted. Both arms are settled in the grooves and there is easy mobility. Ergorest arm supports have been developed particularly to reduce static load in the neck and shoulder area"
|
|
| Outcomes |
Primary outcome Musculoskeletal strain: the participants recorded the severity of their musculoskeletal strain using a VAS, each VAS was reported in millimetres (range 0 to 100 mm with end points of no strain and extreme strain). The mean value of the VAS lines obtained from the 6 body regions (neck, shoulder, upper arm, forearm, wrist, and hand and fingers) were calculated for the right and left sides. |
|
| Notes | ‐ | |
| Risk of bias | ||
| Bias | Authors' judgement | Support for judgement |
| Random sequence generation (selection bias) | Unclear risk | There was no information on sequence generation. The authors only mentioned that: "After the first measurements the participants were randomly assigned to three groups of 7 participants". |
| Allocation concealment (selection bias) | Unclear risk | There was no information on allocation concealment. |
| Blinding of participants and personnel (performance bias) All outcomes | High risk | There was no mention of blinding and it may not even be possible as the intervention included supply of new equipment. |
| Blinding of outcome assessment (detection bias) Musculoskeletal disorders | High risk | The outcome measure was subjective symptoms for muscle strain. |
| Incomplete outcome data (attrition bias) All outcomes | Low risk | There was no loss to follow‐up. |
| Selective reporting (reporting bias) | Low risk | No statistically significant changes were observed in the musculoskeletal strain scores either between the groups or within the groups. |
| Other bias | High risk | No comparison of groups on baseline characteristics specific to the outcome measures. |
McLean 2001.
| Methods | RCT. Participants were randomly assigned to 1 of 3 experimental groups. | |
| Participants | 15 participants were recruited by word of mouth from the accounting (n = 6) and library (n = 6) offices at the University of New Brunswick and from New Brunswick Provincial Government Offices (n = 3) in Fredericton, NB, Canada. All participants were recruited based on their performance of jobs that involved sustained sitting postures in conjunction with keying and data entry tasks. 15 participants participated in the study. | |
| Interventions | The study compared 3 different micro‐break intervals. Upon obtaining informed consent, each participant's workstation was examined for major problems in terms of ergonomic setup and such problems were corrected at least 1 month prior to participation. Ergobreak version 2.2 was installed on each participant's computer at least 2 weeks prior to the data collection period. The programme was set to prompt users to take breaks based on fixed time intervals. Participants were randomly assigned to 1 of 3 experimental groups according to their set time interval between micro‐breaks: all micro‐breaks were of 30 seconds duration. Participants took part in the study over a 4‐week period. For the first 2 weeks of participation (the 'No Break' protocol), subjects performed their usual work while minimising the amount of time spent away from their workstation. For the second 2‐week period of participation each subject performed their assigned micro‐break protocol with the assistance of the Ergobreak software. The programme was set to prompt participants to take breaks at their prescribed time intervals.
|
|
| Outcomes |
Primary outcome Discomfort scores: "based on vertical visual analogue scales (VAS), The vertical scale was 100mm in length, and had no numerical anchors along its length with anchors at the top (Worst Possible Discomfort) and at the bottom (No Discomfort). VAS scores were measured by measuring the distance in millimetres between the 'No Discomfort' anchor and the location of the participant's mark on the line. Four scales were placed on the same page and labelled 'Neck', 'Low Back and Buttock', 'Shoulder and Upper Arm' and 'Forearm, Wrist and Hand'. For each body part, the difference in VAS scores (calculated as the VAS score at each measurement time during the No Breaks protocol minus the VAS score at that time during the Breaks protocol)". Secondary outcome Productivity: the number of words typed (sets of 5 keystrokes) over the course of each 3‐hour myoelectrical signal recording session. Word count data were collected at the end of each recording session only. |
|
| Notes | ‐ | |
| Risk of bias | ||
| Bias | Authors' judgement | Support for judgement |
| Random sequence generation (selection bias) | Unclear risk | There was no information on sequence generation. The only information available is… "Participants were randomly assigned to one of three experimental groups". |
| Allocation concealment (selection bias) | Unclear risk | There was no information on allocation concealment. |
| Blinding of participants and personnel (performance bias) All outcomes | Low risk | There was no mention of blinding but the implementation of the micro‐breaks followed a strict protocol: "Ergobreak version 2.2 was installed on each participant's computer … the program was set to prompt users to take breaks based on fixed time intervals". |
| Blinding of outcome assessment (detection bias) Musculoskeletal disorders | High risk | The discomfort outcome was subjective; "the discomfort score data were collected at 40 min intervals throughout the recording session". |
| Incomplete outcome data (attrition bias) All outcomes | Unclear risk | There was no information on the total participants analysed in each group. Limited information on dropouts and no statistical information on dealing with loss to follow‐up. |
| Selective reporting (reporting bias) | Low risk | All findings were reported including non‐significant findings. For example, "no significant change in the frequency of MNF [mean frequency] cycling was noted at the shoulder" |
| Other bias | High risk | There was no information on the comparability of the VAS score at baseline between the groups and there was no data on the success of randomisation and comparability between the participants. The differences between all participants were presented and they showed very large differences in age and years of experience. "All participants were female (although this was not a requirement for participation), between the ages of 23 and 50 (median age 34). The number of years of experience working at a computer terminal or word processor ranged from two to 18 years (median 10 years)." This is hardly surprising as there were only 15 participants in total. |
Rempel 2006.
| Methods | RCT. This was a 1 year, randomised intervention trial with 4 treatment arms. | |
| Participants | Employees at 2 customer service centre sites (sites A and B) of a large healthcare company were eligible for participation if they performed computer‐based customer service work for more than 20 hours per week and did not have an active workers' compensation claim involving the neck, shoulders, or upper extremities. 182 workers participated in the study. | |
| Interventions | The study compared 4 intervention arms. All the 4 treatment arms included ergonomics training. The ergonomics training involved conventional recommendations, which included maintaining an erect posture while sitting, adjusting the chair height so that the thighs were approximately parallel to the floor, adjusting the arm support and work surface height so that the forearms were approximately parallel to the floor, adjusting the mouse and keyboard location to minimise reaching, adjusting the monitor height so that the centre of the monitor is approximately 15º degrees below the visual horizon and a reminder to take scheduled breaks. The computer workstations used at the sites had independently adjustable keyboard and monitor support surfaces and were typically equipped with a conventional keyboard, computer mouse, and a telephone headset. Use of wrist rests at this workplace was optional. Subjects who were assigned to use the forearm support board could not continue to use a wrist rest owing to the design of the forearm support. Subjects not receiving the forearm support were allowed to continue using a wrist rest if they desired. Chairs were adjustable in height with adjustable height arm rests.
|
|
| Outcomes |
Primary outcomes
Secondary outcome
|
|
| Notes | ‐ | |
| Risk of bias | ||
| Bias | Authors' judgement | Support for judgement |
| Random sequence generation (selection bias) | Low risk | Randomisation: "this was a one year, randomised intervention trial with four treatment arms" Sequence generation: "the randomisation was done by means of a computer generated permuted‐block sequence and administered by a research associate" |
| Allocation concealment (selection bias) | Unclear risk | No information provided |
| Blinding of participants and personnel (performance bias) All outcomes | High risk | There was no blinding of participants or personnel. "This one year, randomised controlled intervention trial evaluated the effects of a wide forearm support surface and a trackball on upper body pain severity and incident musculoskeletal disorders among 182 call centre operators at a large healthcare company. Participants were randomised to receive (1) ergonomics training only, (2) training plus a trackball, (3) training plus a forearm support, or (4) training plus a trackball and forearm support". |
| Blinding of outcome assessment (detection bias) Musculoskeletal disorders | High risk | The outcomes included "worst pain during the preceding seven days". Those who reported "pain intensity level of more than 5, or they used medications for two days" were subjected to a physical "examination protocol focused on the body region of pain and was performed by one physician who was blinded to intervention status." Although the second part was blinded, it depended on the subjective reporting. |
| Incomplete outcome data (attrition bias) All outcomes | Low risk | The analysis followed an ITT approach. The unavailability of 7 participants for a physical examination may have biased the findings. However, the hazard model for incident neck or shoulder disorders was repeated including these 7 participants as incident cases and the conclusions regarding the armboard were unchanged. |
| Selective reporting (reporting bias) | Low risk | Reported on all findings |
| Other bias | Low risk | The baseline characteristics of the participants did not significantly differ by intervention group. |
AET: active ergonomic training; DASH: Disability of the Arm, Shoulder and Hand; h: hour; ITT: intention to treat; LED: light‐emitting diode; MSD: musculoskeletal disorder; PRECEDE: predisposing, reinforcing and enabling causes in educational diagnosis evaluation; RCT: randomised controlled trial; s: second; VAS: visual analogue scale; VDU: visual display unit; vs: versus; WIPP: work injury prevention programme.
Characteristics of excluded studies [ordered by study ID]
| Study | Reason for exclusion |
|---|---|
| Aaras 1998 | Non‐RCT |
| Amick 2003 | Non‐RCT |
| Amick 2012 | Non‐RCT |
| Chau 2014 | Did not report neck and upper limb musculoskeletal outcome |
| Danquah 2017 | > 25% of the participants reported neck‐shoulder pain at baseline (87/171; 50.9%) |
| De Cocker 2016 | Did not report on neck and upper limb musculoskeletal outcome |
| Driessen 2008 | Participants consisted of workers other than office workers: "Participants are workers, both blue and white collar workers, recruited from the departments of four large Dutch companies with at least 3,000 workers each". |
| Dropkin 2015 | > 25% of the participants had musculoskeletal symptoms at baseline. "Additional inclusion criteria were: work at least 4 h/day on a desktop computer, non‐specific neck/ UE musculoskeletal pain (1 or greater on the pain scale described below) at the time of screening". |
| Esmaeilzadeh 2014 | > 25% of the participants had musculoskeletal symptoms at baseline. Study only included participants with Work‐related upper extremity musculoskeletal symptoms (WUEMSS); " ... case definition criteria, 94 of the 311 respondents had WUEMSS and were subsequently included in the interventional study". |
| Faucett 2002 | Study was not conducted in an office environment |
| Fostervold 2006 | > 25% of the participants had neck and shoulder symptoms at baseline. The prevalence of neck and shoulder symptoms at baseline was 73.5% in the intervention group and 75% in the comparison group. |
| Ketola 2002 | > 25% of the participants had neck and shoulder symptoms at baseline. The study included subjects with musculoskeletal symptoms: "One hundred and twenty‐four subjects with musculoskeletal symptoms were selected". |
| Krause 2010 | Did not report on neck and shoulder musculoskeletal symptoms |
| Levanon 2012 | > 25% of the participants had musculoskeletal symptoms at baseline; "as all the participants have at least 1 part of the UE with complaints of pain at baseline". |
| Mahmud 2011 | > 25% of the participants had musculoskeletal symptoms at baseline. The prevalence for of musculoskeletal disorder at baseline for intervention and control groups ranged from 16.3% ‐ 63.6%. |
| Mann 2013 | > 25% of the participants had musculoskeletal symptoms at baseline; "The inclusion criteria of this study was pain, stiffness or tingling in neck and shoulder in the preceding six months affecting the quality of activities of daily living". |
| Meijer 2009a | > 25% of the participants had upper extremity musculoskeletal symptoms at baseline. Prevalence for the control group was 49% and 36% for the intervention group. |
| Meijer 2009b | > 25% of the participants had musculoskeletal symptoms at baseline; 33.3% of the participants have UE complaints at baseline. |
| Mekhora 2000 | > 25% of the participants had musculoskeletal symptoms at baseline; Participants consisted of those with symptoms of above average discomfort: "That is, those with above average discomfort and who had discomfort around the neck and shoulder areas for more than 1 day in the previous year were selected". |
| Parry 2015 | > 25% of the participants had upper extremity musculoskeletal symptoms at baseline. The prevalence of participants reporting musculoskeletal pain in different body regions at baseline ranged from 28‐60%. |
| Ripat 2006 | > 25% of the participants had musculoskeletal symptoms at baseline; "The study population were workers who reported had two or more symptoms of WRUED (i.e. paraesthesia,numbness, loss of strength, shooting sensation or pain, tingling, clumsiness, or night pain)". |
| Robertson 2013 | The intervention was conducted in an laboratory setting, the participants were not performing actual/routine work. |
| Spekle 2010 | > 25% of the participants had musculoskeletal symptoms at baseline; Prevalence of symptoms ‐ 56% , Proximal Symptoms ‐ 46% , Distal Symptoms ‐ 26% at baseline. |
| Thorp 2014 | The intervention was conducted in an laboratory setting, the participants were not performing actual/routine work. |
RCT: randomised controlled trial.
Characteristics of ongoing studies [ordered by study ID]
Johnston 2014.
| Trial name or title | A workplace exercise versus health promotion intervention to prevent and reduce the economic and personal burden of non‐specific neck pain in office personnel: protocol of a cluster‐randomised controlled trial |
| Methods | Cluster‐randomised controlled trial |
| Participants | Office personnel aged over 18 years, who work > 30 hours/week |
| Interventions | Individualised best practice ergonomic intervention plus 3 x 20 minute weekly progressive neck or shoulder girdle exercise group sessions for 12 weeks. |
| Outcomes | Primary (productivity loss) and secondary (neck pain and disability, muscle performance, and quality of life) outcome measures will be collected using validated scales at baseline, immediate post‐intervention and 12 months after commencement. |
| Starting date | 1 June 2013 |
| Contact information | Dr Venerina Johnston (v.johnston@uq.edu.au) |
| Notes |
Shariat 2016.
| Trial name or title | Effective Methods of Reducing Lower Back Neck and Shoulder Pain Among Office Workers |
| Methods | Cluster RCT |
| Participants | 142 Office Workers from Telekom Malaysia |
| Interventions | Training exercise, modified ergonomics, a combination of exercise and ergonomics modification |
| Outcomes | Prevalence of musculoskeletal disorder using Cornell questionnaire |
| Starting date | March 2016 |
| Contact information | Ardalan Shariat, Universiti Putra Malaysia |
| Notes |
LBP: low back pain; NP: neck pain; PE: participatory ergonomics; RCT: randomised controlled trial
Differences between protocol and review
This review is an update of Hoe 2012a. However, while the 2012 review included all work settings, this current review focuses on office workers. The search strategies for this updated review remain the same as for Hoe 2012a, with the exception that in the selection of studies the criteria for office workers was included. Given we used the WHO International Clinical Trials Registry Platform, which includes data from 16 national trials registry databases, we excluded all other trial registries.
We revised the classification of the intervention compared to the classification we had in the protocol with the following four categories: ergonomically designed equipment such as specially designed computer mouse or arm support; ergonomically designed work environment (including workplace and job design); ergonomic training; ergonomic training combined with ergonomic equipment. We believe that the classification that we currently have in the review does more justice to the working mechanism of the interventions.
We added an explanation of the criteria we used for classifying overall risk of bias in the section on Assessment of risk of bias in included studies.
Contributions of authors
The principal author (VCWH) initiated and planned the review and administrated the review process.
Four authors (VCWH, HLK, DMU, and MRS) were involved in writing the protocol. The principal author (VCWH) developed the search strategy in association with Lesley Gillespie of the Cochrane Bone, Joint and Muscle Trauma Group.
Two review authors (VCWH and ENZ) independently conducted the study selection, data extraction, 'risk of bias' assessment and quality assessment. One review author conducted the data synthesis (VCWH). All authors (VCWH, ENZ, HLK, DMU, and MRS) were involved in writing the review.
Sources of support
Internal sources
-
University of Malaya, Kuala Lumpur, Malaysia.
Salary paid to Victor Hoe.
-
Department of Epidemiology & Preventive Medicine, Monash University, Melbourne, Australia.
Salary paid to Malcolm Sim, Helen Kelsall and Donna Urquhart.
External sources
-
Ministry of Higher Education's Academic Training Scheme, Malaysia.
Scholarship received by Victor Hoe to complete his Doctor of Philosophy at Monash University, Australia (Year 2008‐2011), which he used to conduct the first version of this Cochrane review (Hoe 2012a).
-
National Health and Medical Research Council's Public Health Postdoctoral Fellowship, Australia.
Salary paid to Helen Kelsall to work on the first version of this Cochrane review (Hoe 2012a).
-
National Health and Medical Research Council's Public Health Capacity Building Grant, Australia.
Salary paid to Donna Urquhart to work on the first version of this Cochrane review (Hoe 2012a).
-
University of Malaya Postgraduate Research Grant (PG206‐2015A), Malaysia.
RM5,000 grant received by Eva N Zamri to conduct the latest update of this Cochrane review.
-
National Health and Medical Research Council Career Development Fellowship (Level 2, 1142809), Australia.
Salary paid to Donna Urquhart to work for on this Cochrane review.
Declarations of interest
Victor Hoe: None known.
Donna Urquhart: None known.
Helen Kelsall: None known.
Eva Zamri: None known.
Malcolm Sim: None known.
New search for studies and content updated (conclusions changed)
References
References to studies included in this review
Baydur 2016 {published data only}
- Baydur H, Ergor A, Demiral Y, Akalin E. Effects of participatory ergonomic intervention on the development of upper extremity musculoskeletal disorders and disability in office employees using a computer. Journal of Occupational Health 2016;58(3):297‐309. [DOI: 10.1539/joh.16-0003] [DOI] [PMC free article] [PubMed] [Google Scholar]
Bohr 2000 {published data only}
- Bohr PC. Efficacy of office ergonomics education. Journal of Occupational Rehabilitation 2000;10(4):243‐55. [Google Scholar]
Bohr 2002 {published data only}
- Bohr PC. Office ergonomics education: A comparison of traditional and participatory methods. Work 2002;19(2):185‐191. [PubMed] [Google Scholar]
Brisson 1999 {published data only}
- Brisson C, Montreuil S, Punnett L. Effects of an ergonomic training program on workers with video display units. Scandinavian Journal of Work, Environment and Health 1999;25(3):255‐63. [DOI] [PubMed] [Google Scholar]
Conlon 2008 {published data only}
- Conlon CF, Krause N, Rempel DM. A randomised controlled trial evaluating an alternative mouse and forearm support on upper body discomfort and musculoskeletal disorders among engineers. Occupational and Environmental Medicine 2008;65(5):311‐8. [DOI] [PubMed] [Google Scholar]
- Conlon CF, Krause N, Rempel DM. A randomized controlled trial evaluating an alternative mouse or forearm support on change in median and ulnar nerve motor latency at the wrist. American Journal of Industrial Medicine 2009;52(4):304‐10. [DOI] [PubMed] [Google Scholar]
Galinsky 2000 {published and unpublished data}
- Galinsky TL, Swanson NG, Sauter SL, Hurrell JJ, Schleifer LM. A field study of supplementary rest breaks for data‐entry operators. Ergonomics 2000;43(5):622‐38. [DOI] [PubMed] [Google Scholar]
Galinsky 2007 {published and unpublished data}
- Galinsky T, Swanson N, Sauter S, Dunkin R, Hurrell J, Schleifer L. Supplementary breaks and stretching exercises for data entry operators: a follow‐up field study. American Journal of Industrial Medicine 2007;50(7):519‐27. [DOI] [PubMed] [Google Scholar]
Gatty 2004 {published data only}
- Gatty CM, Gatty CM. A comprehensive work injury prevention program with clerical and office workers: Phase II. Work 2004;23(2):131‐7. [PubMed] [Google Scholar]
- Martin SA, Irvine JL, Fluharty K, Gatty CM. A comprehensive work injury prevention program with clerical and office workers: Phase I. Work 2003;21(2):185‐96. [PubMed] [Google Scholar]
Gerr 2005 {published data only}
- Gerr F, Marcus M, Monteilh C, Hannan L, Ortiz D, Kleinbaum D. A randomised controlled trial of postural interventions for prevention of musculoskeletal symptoms among computer users. Occupational and Environmental Medicine 2005;62(7):478‐87. [MEDLINE: ] [DOI] [PMC free article] [PubMed] [Google Scholar]
Graves 2015 {published data only}
- E F Graves L, C Murphy R, Shepherd SO, Cabot J, Hopkins ND. Evaluation of sit‐stand workstations in an office setting: a randomised controlled trial. BMC Public Health 2015;15:1145. [PUBMED: 26584856] [DOI] [PMC free article] [PubMed] [Google Scholar]
Greene 2005 {published data only}
- Greene BL, DeJoy DM, Olejnik S, Greene BL, DeJoy DM, Olejnik S. Effects of an active ergonomics training program on risk exposure, worker beliefs, and symptoms in computer users. Work 2005;24(1):41‐52. [PubMed] [Google Scholar]
King 2013 {published data only}
- King TK, Severin CN, Eerd D, Ibrahim S, Cole D, Amick III B, et al. A pilot randomised control trial of the effectiveness of a biofeedback mouse in reducing self‐reported pain among office workers. Ergonomics 2013;56(1):59‐68. [DOI] [PubMed] [Google Scholar]
Lintula 2001 {published data only}
- Lintula M, Nevala‐Puranen N, Louhevaara V. Effects of Ergorest arm supports on muscle strain and wrist positions during the use of the mouse and keyboard in work with visual display units: a work site intervention. International Journal of Occupational Safety and Ergonomics 2001;7(1):103‐16. [DOI] [PubMed] [Google Scholar]
McLean 2001 {published data only}
- McLean L, Tingley M, Scott RN, Rickards J. Computer terminal work and the benefit of microbreaks. Applied Ergonomics 2001;32(3):225‐37. [DOI] [PubMed] [Google Scholar]
Rempel 2006 {published data only}
- Rempel DM, Krause N, Goldberg R, Benner D, Hudes M, Goldner GU. A randomised controlled trial evaluating the effects of two workstation interventions on upper body pain and incident musculoskeletal disorders among computer operators. Occupational and Environmental Medicine 2006;63(5):300‐6. [DOI] [PMC free article] [PubMed] [Google Scholar]
References to studies excluded from this review
Aaras 1998 {published data only}
- Aaras A, Horgen G, Bjorset HH, Ro O, Thoresen M. Musculoskeletal, visual and psychosocial stress in VDU operators before and after multidisciplinary ergonomic interventions. Applied Ergonomics 1998;29(5):335‐54. [DOI] [PubMed] [Google Scholar]
Amick 2003 {published data only}
- Amick BC, 3rd, Robertson MM, DeRango K, Bazzani L, Moore A, Rooney T, et al. Effect of office ergonomics intervention on reducing musculoskeletal symptoms. Spine (Phila Pa 1976) 2003;28(24):2706‐11. [DOI] [PubMed] [Google Scholar]
Amick 2012 {published data only}
- Amick BC, 3rd, Menéndez CC, Bazzani L, Robertson M, Derango K, Rooney T, et al. A field intervention examining the impact of an office ergonomics training and a highly adjustable chair on visual symptoms in a public sector organization. Applied Ergonomics 2012;43(3):625‐31. [DOI] [PMC free article] [PubMed] [Google Scholar]
Chau 2014 {published data only}
- Chau JY, Daley M, Dunn S, Srinivasan A, Do A, Bauman AE, et al. The effectiveness of sit‐stand workstations for changing office workers' sitting time: results from the Stand@Work randomized controlled trial pilot. The International Journal of Behavioral Nutrition and Physical Activity 2014;11:127. [DOI] [PMC free article] [PubMed] [Google Scholar]
Danquah 2017 {published data only}
- Danquah IH, Kloster S, Holtermann A, Aadahl M, Tolstrup JS. Effects on musculoskeletal pain from "Take a Stand!" ‐ a cluster ‐randomized controlled trial reducing sitting time among office workers. Scandinavian Journal of Work Environment & Health 2017;43(4):350‐7. [DOI: 10.5271/sjweh.3639] [DOI] [PubMed] [Google Scholar]
De Cocker 2016 {published data only}
- Cocker K, Bourdeaudhuij I, Cardon G, Vandelanotte C. The Effectiveness of a Web‐Based Computer‐Tailored Intervention on Workplace Sitting: A Randomized Controlled Trial. Journal of Medical Internet Research 2016;18(5):e96. [DOI] [PMC free article] [PubMed] [Google Scholar]
Driessen 2008 {published data only}
- Driessen M, Proper K, Anema J, Knol D, Bongers P, Beek A. The economic evaluation of a participatory ergonomics programme to prevent low back and neck pain. Work 2012;41 Suppl 1:2315‐2320. [DOI] [PubMed] [Google Scholar]
- Driessen M, Proper K, Anema J, Knol D, Bongers P, Beek A. The effectiveness of participatory ergonomics to prevent low back pain and neck pain: Results of a cluster randomised controlled trial. Occupational and Environmental Medicine 2011;68:A63. [DOI] [PubMed] [Google Scholar]
- Driessen MT, Anema JR, Proper KI, Bongers PM, Beek AJ, Driessen MT, et al. Stay@Work: participatory ergonomics to prevent low back and neck pain among workers: design of a randomised controlled trial to evaluate the (cost‐)effectiveness. BMC Musculoskeletal Disorders 2008;9:145. [DOI] [PMC free article] [PubMed] [Google Scholar]
- Driessen MT, Proper KI, Anema JR, Bongers PM, Beek AJ. Process evaluation of a participatory ergonomics programme to prevent low back pain and neck pain among workers. Implementation Science 2010;5:65. [DOI] [PMC free article] [PubMed] [Google Scholar]
- Driessen MT, Proper KI, Anema JR, Knol DL, Bongers PM van der Beek AJ. The effectiveness of participatory ergonomics to prevent low‐back and neck pain‐‐results of a cluster randomized controlled trial. Scandinavian Journal of Work Environment & Health 2011;37(5):383‐93. [DOI] [PubMed] [Google Scholar]
- Driessen MT, Proper KI, Anema JR, Knol DL, Bongers PM, Beek AJ. Participatory ergonomics to reduce exposure to psychosocial and physical risk factors for low back pain and neck pain: results of a cluster randomised controlled trial. Occupational and Environmental Medicine 2011;68(9):674‐81. [DOI] [PubMed] [Google Scholar]
Dropkin 2015 {published data only}
- Dropkin J, Kim H, Punnett L, Wegman DH, Warren N, Buchholz B. Effect of an office ergonomic randomised controlled trial among workers with neck and upper extremity pain. Occupational & Environmental Health 2015;72(1):6‐14. [DOI] [PubMed] [Google Scholar]
Esmaeilzadeh 2014 {published data only}
- Esmaeilzadeh S, Ozcan E, Capan N. Effects of ergonomic intervention on work‐related upper extremity musculoskeletal disorders among computer workers: a randomized controlled trial. International Archive of Occupational and Environvironmental Health 2012;87(1):73‐83. [PUBMED: 23263694] [DOI] [PubMed] [Google Scholar]
Faucett 2002 {published data only}
- Faucett J, Garry M, Nadler D, Ettare, D. A test of two training interventions to prevent work‐related musculoskeletal disorders of the upper extremity. Applied Ergonomics 2002;33(4):337‐47. [DOI] [PubMed] [Google Scholar]
Fostervold 2006 {published data only}
- Fostervold KI, Aaras A, Lie I. Work with visual display units: long‐term health effects of high and downward line‐of‐sight in ordinary office environments. International Journal of Industrial Ergonomics 2006;36(4):331‐43. [Google Scholar]
Ketola 2002 {published data only}
- Ketola R, Toivonen R, Häkkänen M, Luukkonen R, Takala E‐P, Viikari‐Juntura E, the Expert Group in Ergonomics. Effects of ergonomic intervention in work with video display units. Scandinavian Journal of Work, Environment & Health 2002;28(1):18‐24. [MEDLINE: ] [DOI] [PubMed] [Google Scholar]
Krause 2010 {published data only}
- Krause N, Burgel B, Rempel D. Effort‐reward imbalance and one‐year change in neck‐shoulder and upper extremity pain among call center computer operators. Scandinavian Journal of Work Environment & Health 2010;36(1):42‐53. [DOI] [PubMed] [Google Scholar]
Levanon 2012 {published data only}
- Levanon Y, Gefen A, Lerman Y, Givon U, Ratzon NZ. Multi dimensional system for evaluating preventive program for upper extremity disorders among computer operators. Work 2012;41:669‐75. [DOI] [PubMed] [Google Scholar]
Mahmud 2011 {published data only}
- Mahmud N, Kenny DT, Md Zein R, Hassan SN. Ergonomic Training Reduces Musculoskeletal Disorders among Office Workers: Results from the 6‐Month Follow‐Up. Malaysian Journal of Medical Science 2011;18(2):16‐26. [PMC free article] [PubMed] [Google Scholar]
Mann 2013 {published data only}
- Mann R, Singh A, Singh M, Singh J. Combined effects of stretching and ergonomic advice in computer professionals on the incidence of upper limb disorders. Indian Journal of Physiotherapy & Occupational Therapy 2013;7(4):186‐91. [Google Scholar]
Meijer 2009a {published data only}
- Meijer EM, Sluiter JK, Frings‐Dresen MHW. Effectiveness of a feedback signal in a computer mouse on upper extremity musculoskeletal symptoms: a randomised controlled trial with an 8‐month follow‐up. Occupational and Environmental Medicine 2009;66(5):305‐11. [DOI] [PubMed] [Google Scholar]
Meijer 2009b {published data only}
- Meijer EM, Frings‐Dresen MHW, Sluiter JK. Effects of office innovation on office workers' health and performance. Ergonomics 2009;52(9):1027‐38. [DOI] [PubMed] [Google Scholar]
Mekhora 2000 {published data only}
- Mekhora K, Liston CB, Nanthavanij S, Cole JH. The effect of ergonomic intervention on discomfort in computer users with tension neck syndrome. International Journal of Industrial Ergonomics 2000;26(3):367‐79. [DOI: 10.1016/S0169-8141(00)00012-3] [DOI] [Google Scholar]
Parry 2015 {published data only}
- Parry SP, Straker LM, Gilson ND, Smith AJ. Can participatory workplace interventions aimed at changing sedentary time also reduce musculoskeletal symptoms in office workers?. Physiotherapy (United Kingdom) 2015;101:eS1178‐eS1179. [Google Scholar]
Ripat 2006 {published data only}
- Ripat J, Scatliff T, Giesbrecht E, Quanbury A, Friesen M, Kelso S. The effect of alternate style keyboards on severity of symptoms and functional status of individuals with work related upper extremity disorders. Journal of Occupational Rehabilitation. 2006;16(4):707‐18. [DOI] [PubMed] [Google Scholar]
Robertson 2013 {published data only}
- Robertson MM, Ciriello VM, Garabet AM. Office ergonomics training and a sit‐stand workstation: effects on musculoskeletal and visual symptoms and performance of office workers. Applied Ergonomics 2013;44(1):73‐85. [DOI] [PubMed] [Google Scholar]
Spekle 2010 {published data only}
- Spekle EM, Hoozemans MJ, Blatter BM, Heinrich J, Beek AJ, Knol DL, et al. Effectiveness of a questionnaire based intervention programme on the prevalence of arm, shoulder and neck symptoms, risk factors and sick leave in computer workers: a cluster randomised controlled trial in an occupational setting. BMC Musculoskeletal Disorders 2010;11:99. [DOI] [PMC free article] [PubMed] [Google Scholar]
Thorp 2014 {published data only}
- Thorp AA, Kingwell BA, Owen N, Dunstan DW. Breaking up workplace sitting time with intermittent standing bouts improves fatigue and musculoskeletal discomfort in overweight/obese office workers. Occupational & Environmental Medicine. 2014;71(11):765‐71. [DOI] [PubMed] [Google Scholar]
- Thorp AA, Kingwell BA, Sethi P, Hammond L, Owen N, Dunstan DW. Alternating bouts of sitting and standing attenuate postprandial glucose responses. Medicine and Science in Sports and Exercise 2014;46(11):2053‐61. [DOI] [PubMed] [Google Scholar]
References to ongoing studies
Johnston 2014 {published data only}
- Johnston V, O'Leary S, Comans T, Straker L, Melloh M, Khan A, et al. A workplace exercise versus health promotion intervention to prevent and reduce the economic and personal burden of non‐specific neck pain in office personnel: protocol of a cluster‐randomised controlled trial. Journal of Physiotherapy 2014;60(4):233. [PUBMED: 25306220] [DOI] [PubMed] [Google Scholar]
Shariat 2016 {published data only}
- Effective Methods of Reducing Lower Back Neck and Shoulder Pain Among Office Workers. Ongoing study March 2016.
Additional references
Aas 2011
- Aas RW, Tuntland H, Holte KA, Roe C, Lund T, Marklund S, et al. Workplace interventions for neck pain in workers. Cochrane Database of Systematic Reviews 2011, Issue Cd008160. [DOI: 10.1002/14651858.CD008160.pub2] [DOI] [PMC free article] [PubMed] [Google Scholar]
Bergqvist 1995
- Bergqvist U, Wolgast E, Nilsson B, Voss M. Musculoskeletal disorders among visual display terminal workers: individual, ergonomic, and work organizational factors. Ergonomics 1995;38(4):763‐76. [DOI] [PubMed] [Google Scholar]
Bernard 1994
- Bernard B, Sauter S, Fine L, Petersen M, Hales T. Job task and psychosocial risk factors for work‐related musculoskeletal disorders among newspaper employees. Scandinavian Journal of Work, Environment & Health 1994;20(6):417‐26. [PUBMED: 7701287] [DOI] [PubMed] [Google Scholar]
Bernard 1997
- Bernard BP, editor. Musculoskeletal Disorders and Workplace Factors: A Critical Review of Epidemiologic Evidence for Work‐Related Musculoskeletal Disorders of the Neck, Upper‐Extremity and Low Back. DHHS (NIOSH) Publication No. 97‐141. Cincinnati, OH: US Department of Health and Human Services, 1997. [Google Scholar]
Bonfiglioli 2006
- Bonfiglioli R, Mattioli S, Spagnolo MR, Violante FS. Course of symptoms and median nerve conduction values in workers performing repetitive jobs at risk for carpal tunnel syndrome. Occupational Medicine 2006;56(2):115‐21. [MEDLINE: ] [DOI] [PubMed] [Google Scholar]
Boocock 2007
- Boocock MG, McNair PJ, Larmer PJ, Armstrong B, Collier J, Simmonds M, et al. Interventions for the prevention and management of neck/upper extremity musculoskeletal conditions: a systematic review. Occupational & Environmental Medicine 2007;64(5):291‐303. [MEDLINE: ] [DOI] [PMC free article] [PubMed] [Google Scholar]
Buckle 1997
- Buckle PW. Work factors and upper limb disorders. BMJ 1997;315(7119):1360‐3. [MEDLINE: ] [DOI] [PMC free article] [PubMed] [Google Scholar]
Buckle 1999
- Buckle P, Devereux J. Work‐related neck and upper limb musculoskeletal disorders. Bilbao: European Agency for Safety and Health at Work, 1999. [Google Scholar]
Cagnie 2007
- Cagnie B, Danneels L, Tiggelen D, Loose V, Cambier D. Individual and work related risk factors for neck pain among office workers: a cross sectional study. European Spine Journal 2007;16(5):679‐86. [PUBMED: 17160393] [DOI] [PMC free article] [PubMed] [Google Scholar]
Coggon 2012
- Coggon D, Ntani G, Palmer KT, Felli VE, Harari R, Barrero LH, et al. The CUPID (Cultural and Psychosocial Influences on Disability) Study: Methods of Data Collection and Characteristics of Study Sample. PloS one 2012;7(7):e39820. [DOI] [PMC free article] [PubMed] [Google Scholar]
Coggon 2013a
- Coggon D, Ntani G, Palmer KT, Felli VE, Harari R, Barrero LH, et al. Disabling musculoskeletal pain in working populations: Is it the job, the person, or the culture?. PAIN. 2013;154(6):856‐63. [DOI] [PMC free article] [PubMed] [Google Scholar]
Coggon 2013b
- Coggon D, Ntani G, Palmer KT, Felli VE, Harari R, Barrero LH, et al. Patterns of multi‐site pain and associations with risk factors. Pain 2013;154(9):1769‐77. [DOI: ] [DOI] [PMC free article] [PubMed] [Google Scholar]
Daltroy 1997
- Daltroy LH, Iversen MD, Larson MG, Lew R, Wright E, Ryan J, et al. A controlled trial of an educational program to prevent low back injuries. New England Journal of Medicine 1997;337(5):322‐8. [DOI] [PubMed] [Google Scholar]
GRADEpro GDT [Computer program]
- McMaster University (developed by Evidence Prime). GRADEpro GDT. Version accessed 6 August 2016. Hamilton (ON): McMaster University (developed by Evidence Prime), 2015.
Higgins 2011
- Higgins JPT, Green S, (Eds). Cochrane Handbook for Systematic Reviews of Interventions Version 5.1.0 [updated March 2011]. The Cochrane Collaboration, 2011. Available from www.handbook.cochrane.org.
Hoe 2012b
- Hoe VCW, Kelsall HL, Urquhart DM, Sim MR. Risk factors for musculoskeletal symptoms of the neck or shoulder alone or neck and shoulder among hospital nurses. Occupational and Environmental Medicine 2012;69(3):198‐204. [DOI: 10.1136/oemed-2011-100302] [DOI] [PubMed] [Google Scholar]
Hoy 2014
- Hoy D, March L, Woolf A, Blyth F, Brooks P, Smith E, et al. The global burden of neck pain: estimates from the global burden of disease 2010 study. Annals of the Rheumatic Diseases 2014;73(7):1309‐15. [PUBMED: 24482302] [DOI] [PubMed] [Google Scholar]
HSE 2015
- Health and Safety Executive (HSE). Work‐related Musculoskeletal Disorder (WRMSDs) Statistics, Great Britain, 2015. Health and Safety Executive (HSE) 2015.
Huisstede 2006
- Huisstede BM, Bierma‐Zeinstra SM, Koes BW, Verhaar JA. Incidence and prevalence of upper‐extremity musculoskeletal disorders. A systematic appraisal of the literature. BMC Musculoskeletal Disorders 2006;7:7. [MEDLINE: ] [DOI] [PMC free article] [PubMed] [Google Scholar]
Jensen 2003
- Jensen C. Development of neck and hand‐wrist symptoms in relation to duration of computer use at work. Scandinavian Journal of Work, Environmental & Health 2003;29(3):197‐205. [PUBMED: 12828389] [DOI] [PubMed] [Google Scholar]
Karjalainen 2001
- Karjalainen K, Malmivaara A, Tulder M, Roine R, Jauhiainen M, Hurri H, et al. Multidisciplinary biopsychosocial rehabilitation for neck and shoulder pain among working age adults: a systematic review within the framework of the Cochrane Collaboration Back Review Group. Spine 2001;26(2):174‐81. [DOI] [PubMed] [Google Scholar]
Kennedy 2010
- Kennedy CA, Amick BC, Dennerlein JT, Brewer S, Catli S, Williams, et al. Systematic review of the role of occupational health and safety interventions in the prevention of upper extremity musculoskeletal symptoms, signs, disorders, injuries, claims and lost time. Journal of Occupational Rehabilitation 2010;20(2):127‐62. [DOI] [PubMed] [Google Scholar]
Kitis 2009
- Kitis A, Celik E, Aslan UB, Zencir M. DASH questionnaire for the analysis of musculoskeletal symptoms in industry workers: a validity and reliability study. Applied Ergonomics 2009;40(2):251‐5. [PUBMED: 18555973] [DOI] [PubMed] [Google Scholar]
Lavender 2007
- Lavender S, Lorenz E, Andersson G. Can a new behaviorally oriented training process to improve lifting technique prevent occupationally related back injuries due to lifting?. Spine 2007;32(4):487‐94. [DOI] [PubMed] [Google Scholar]
Leak 1994
- Leak AM, Cooper J, Dyer S, Williams KA, Turner‐Stokes L, Frank AO. The Northwick Park Neck Pain Questionnaire, devised to measure neck pain and disability. British Journal of Rheumatology 1994;33(5):469‐74. [PUBMED: 8173853] [DOI] [PubMed] [Google Scholar]
Lefebvre 2011
- Lefebvre C, Manheimer E, Glanville J. Chapter 6: Searching for studies. In: Higgins JPT, Green S (editors). Cochrane Handbook for Systematic Reviews of Interventions Version 5.1.0 [updated March 2011]. The Cochrane Collaboration, 2011. Available from www.handbook.cochrane.org.
Marras 2009
- Marras WS, Cutlip RG, Burt SE, Waters TR. National occupational research agenda (NORA) future directions in occupational musculoskeletal disorder health research. Applied Ergonomics 2009;40(1):15‐22. [MEDLINE: ] [DOI] [PubMed] [Google Scholar]
Mathers 1999
- Mathers C, Penm R. Health system costs of injury, poisoning and musculoskeletal disorders in Australia 1993‐94. Canberra: Australian Institute of Health and Welfare, 1999. [Google Scholar]
Mulimani 2014
- Mulimani P, Hoe VCW, Hayes MJ, Idiculla JJ, Abas ABL, Karanth L. Ergonomic interventions for preventing musculoskeletal disorders in dental care practitioners. Cochrane Database of Systematic Reviews 2014, Issue 8. [DOI: 10.1002/14651858.CD011261] [DOI] [PMC free article] [PubMed] [Google Scholar]
NIOSH 1997
- The National Institute for Occupational Safety and Health (NIOSH). Elements of ergonomics program: a primer based on workplace evaluation of musculoskeletal disorders. Cincinnati, OH: US Department of Health and Human Services, 1997. [Google Scholar]
NIOSH 2001
- National Institute for Occupational Safety and Health (NIOSH). National Occupational Research Agenda for Musculoskeletal Disorders: Research Topics for the Next Decade. A Report by the NORA Musculoskeletal Disorders Team. DHHS (NIOSH) Publication No. 2001‐117. Cincinnati, OH: US Department of Health and Human Services, 2001. [Google Scholar]
OECD 1996
- OECD. The Knowledge‐Based Economy. Organisation for Economic Co‐operation and Development, 1996. [Google Scholar]
Ortiz‐Hernandez 2003
- Ortiz‐Hernandez L, Tamez‐Gonzalez S, Martinez‐Alcantara S, Mendez‐Ramirez I. Computer use increases the risk of musculoskeletal disorders among newspaper office workers. Archives of Medical Research 2003;34(4):331‐42. [MEDLINE: ] [DOI] [PubMed] [Google Scholar]
Powell 2004
- Powell WW, Snellman K. The Knowledge Economy. Annual Review of Sociology 2004;30(1):199‐200. [Google Scholar]
Ramazzini 1964
- Ramazzini B. Diseases of Workers. Translated from the Latin text De morbis artificum of 1713 by Wilmer Cave Wright. New York: Hafner, 1964. [Google Scholar]
RevMan 2014 [Computer program]
- The Nordic Cochrane Centre, The Cochrane Collaboration. Review Manager (RevMan). Version 5.3. Copenhagen: The Nordic Cochrane Centre, The Cochrane Collaboration, 2014.
Shanahan 2006
- Shanahan EM, Jezukaitis P. Work related upper limb disorders. Australian Family Physician 2006;35(12):946‐50. [MEDLINE: ] [PubMed] [Google Scholar]
Su 2013
- Su AT, Maeda S, Fukumoto J, Darus A, Hoe VC, Miyai N, et al. Dose‐response relationship between hand‐transmitted vibration and hand‐arm vibration syndrome in a tropical environment. Occupational & Environmental Medicine 2013;70(7):498‐504. [PUBMED: 23645621] [DOI] [PubMed] [Google Scholar]
Subbarayalu 2013
- Subbarayalu AV. Occupational Health Problems of Call Center Workers in India: A Cross Sectional Study Focusing on Gender Differences. Journal of Management Science and Practice 2013;1(2):63‐70. [Google Scholar]
Szeto 2009
- Szeto GP, Ho P, Ting AC, Poon JT, Cheng SW, Tsang RC. Work‐related musculoskeletal symptoms in surgeons. Journal of Occupational Rehabilitation 2009;19(2):175‐84. [MEDLINE: ] [DOI] [PubMed] [Google Scholar]
Tittiranonda 1999
- Tittiranonda P, Rempel D, Armstrong T, Burastero S. Effect of four computer keyboards in computer users with upper extremity musculoskeletal disorders. American Journal of Industrial Medicine 1999;35(6):647‐61. [PUBMED: 10332518] [DOI] [PubMed] [Google Scholar]
Tullar 2010
- Tullar JM, Brewer S, Amick BC, Irvin E, Mahood Q, Pompeii LA, et al. Occupational safety and health interventions to reduce musculoskeletal symptoms in the health care sector. Journal of Occupational Rehabilitation 2010;20(2):199‐219. [DOI] [PubMed] [Google Scholar]
USBJI 2015
- United States Bone, Joint Initiative. The Burden of Musculoskeletal Diseases in the United States (BMUS). 3rd Edition. Rosemont, IL: United States Bone and Joint Initiative, 2015. [Google Scholar]
Van Eerd 2016
- Eerd D, Munhall C, Irvin E, Rempel D, Brewer S, Beek AJ, et al. Effectiveness of workplace interventions in the prevention of upper extremity musculoskeletal disorders and symptoms: an update of the evidence. Occupational and Environmental Medicine 2016;73(1):62‐70. [DOI] [PMC free article] [PubMed] [Google Scholar]
Verhagen 2013
- Verhagen AP, Bierma‐Zeinstra SM, Burdorf A, Stynes SM, Vet HC, Koes BW. Conservative interventions for treating work‐related complaints of the arm, neck or shoulder in adults. Cochrane Database of Systematic Reviews 2013, Issue 12. [DOI: 10.1002/14651858.CD008742.pub2] [DOI] [PMC free article] [PubMed] [Google Scholar]
von Thiele 2008
- Thiele SU, Lindfors P, Lundberg U, Thiele Schwarz U, Lindfors P, Lundberg U. Health‐related effects of worksite interventions involving physical exercise and reduced workhours. Scandinavian Journal of Work, Environment and Health 2008;34(3):179‐88. [DOI] [PubMed] [Google Scholar]
Werner 2005
- Werner RA, Franzblau A, Gell N, Hartigan A, Ebersole M, Armstrong TJ. Predictors of persistent elbow tendonitis among auto assembly workers. Journal of Occupational Rehabilitation 2005;15(3):393‐400. [MEDLINE: ] [DOI] [PubMed] [Google Scholar]
Woods 2005
- Woods V. Musculoskeletal disorders and visual strain in intensive data processing workers. Occupational Medicine (London) 2005;55(2):121‐7. [DOI] [PubMed] [Google Scholar]
Wynne‐Jones 2009
- Wynne‐Jones G, Mallen CD, Mottram S, Main CJ, Dunn KM. Identification of UK sickness certification rates, standardised for age and sex. British Journal of General Practice 2009;59(564):510‐6. [MEDLINE: ] [DOI] [PMC free article] [PubMed] [Google Scholar]
Yassi 1997
- Yassi A. Repetitive strain injuries. Lancet 1997;349(9056):943‐7. [MEDLINE: ] [DOI] [PubMed] [Google Scholar]
Yassi 2001
- Yassi A, Cooper JE, Tate RB, Gerlach S, Muir M, Trottier J, Massey K. A randomized controlled trial to prevent patient lift and transfer injuries of health care workers. Spine 2001;26(16):1739‐46. [PUBMED: 11493843] [DOI] [PubMed] [Google Scholar]
References to other published versions of this review
Hoe 2012a
- Hoe VC, Urquhart DM, Kelsall HL, Sim MR. Ergonomic design and training for preventing work‐related musculoskeletal disorders of the upper limb and neck in adults. Cochrane Database of Systematic Reviews 2012, Issue CD008570.pub2. [DOI: 10.1002/14651858.CD008570.pub2] [DOI] [PMC free article] [PubMed] [Google Scholar]