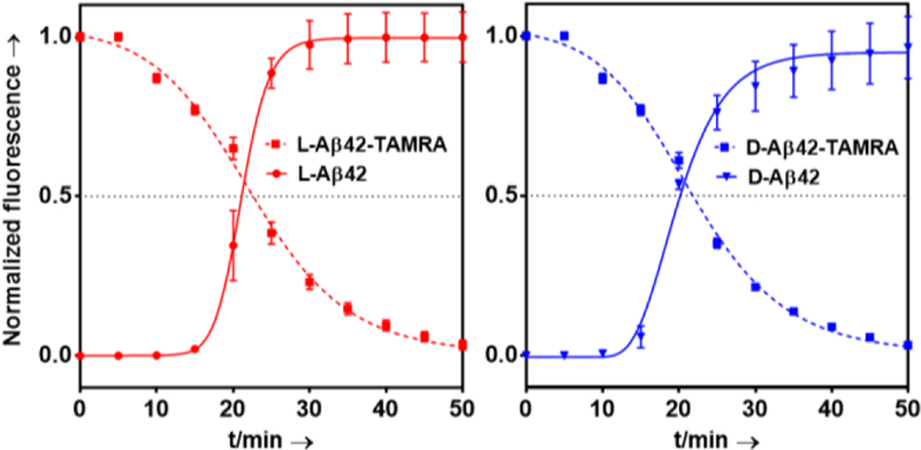
Figure 1.

Fibril formation kinetics of (L/D)-Aβ42 monitored by Thioflavin T (ThT, 20 µM) fluorescence and (L/D)-Aβ42-TAMRA monitored by TAMRA self-quenching at 37 ˚C in PBS (pH 7.4; Aβ at 20 µM in all cases). Each data point is an average of five replicates with error bars representing the standard deviations.
