Abstract
Background
There is currently no consensus on the methodology for quantification of 18F-FDG uptake in inflammation in atherosclerosis. In this study, we explore different methods for quantification of 18F-FDG uptake in carotid atherosclerotic plaques and correlate the uptake values to histological assessments of inflammation.
Methods and Results
Forty-four patients with atherosclerotic stenosis ≥70% of the internal carotid artery underwent 18F-FDG PET/CT. Maximum standardized uptake values (SUVmax) from all plaque-containing slices were collected. SUVmax for the single highest and the mean of multiple slices with and without blood background correction (by subtraction (cSUV) or by division (target-to-background ratio (TBR)) were calculated. Following endarterectomy 30 plaques were assessed histologically. The length of the plaques at CT was 6-32 mm. The 18F-FDG uptake in the plaques was 1.15-2.66 for uncorrected SUVs, 1.16-3.19 for TBRs, and 0.20-1.79 for cSUVs. There were significant correlations between the different uptake values (r = 0.57-0.99, P < 0.001). Methods with and without blood background correction showed similar, moderate correlations to the amount of inflammation assessed at histology (r = 0.44-0.59, P < 0.02).
Conclusions
In large stenotic carotid plaques, 18F-FDG uptake reflects the inflammatory status as assessed at histology. Increasing number of PET slices or background correction did not change the correlation.
Electronic supplementary material
The online version of this article (10.1007/s12350-017-1121-7) contains supplementary material, which is available to authorized users.
Keywords: 18F-FDG PET/CT, carotid plaque, atherosclerosis, inflammation, quantification method
Introduction
Inflammation is a key factor in the pathophysiology of atherosclerosis with regard to progression and destabilization of plaques.1 Patients with unstable carotid plaques have increased risk of plaque rupture and ischemic stroke,2,3 and there is increasing interest in imaging carotid plaque inflammation in order to detect these unstable plaques.
Positron emission tomography (PET) imaging with 2-deoxy-2-(18F)-fluoro-d-glucose (18F-FDG) of inflammation in atherosclerotic plaques has rapidly evolved since Rudd et al first reported 18F-FDG accumulation in macrophage-rich areas of carotid artery plaques over a decade ago.4 In contrast to oncology,5 there is no consensus on methodological guidelines for 18F-FDG PET/CT in atherosclerosis imaging. A recent position paper from the Cardiovascular Committee of the European Association of Nuclear Medicine6 proposed optimized and standardized protocols for the imaging and interpretation of 18F-FDG PET scans in atherosclerosis. However, they admitted that many of the recommendations suffer from the absence of conclusive evidence. Compared to a solid tumor, the cells responsible for 18F-FDG uptake in carotid artery plaques are generally fewer, more dispersed, and spread around parts of the circumference of a tubular vascular structure.3,7 Consequently, limited spatial resolution of the PET scanner and blood background activity are of great concern. Two parallel phenomena are known to influence measured activity in a lesion:8 signal from the lesion lost to the surroundings (spill-out), and signal added to the lesion from the vessel lumen and adjacent anatomic structures (spill-in).8,9
Different acquisition protocols and quantification methods have been suggested.10-17 They all address the same concerns but have diverging solutions. A literature search identified 53 different acquisition protocols, 51 different reconstruction protocols, and 46 different quantification methods used in 49 studies.9 The most common measure is the mean of all the maximum standardized uptake values (SUVs) (mean SUVmax) of the regions of interest (ROIs). The ROIs include the whole plaque (in localized stenosis), or one or more vessel segments (in subclinical/generalized disease). Bural et al calculated the atherosclerotic burden of the aorta by multiplying the mean uptake values for each aorta segment with the vessel wall volume.18 Sub-analysis looking for the most metabolically active areas of a vessel segment have been used in therapy response studies.16 The uptake values are either normalized to the blood background activity,15,17,19,20 corrected for the background activity with subtraction11 or not corrected for background activity.13,21,22 The rationale for background correction has been strongly criticized.9,23
The aim of this study was to explore different methods for the quantification of 18F-FDG uptake in large carotid artery plaques, and to correlate the uptake values to the amount of inflammation on histology.
Methods
Study Population
Forty-four patients referred to the Department of Neurology at our institution for the evaluation of carotid artery disease were included (Table 1). Inclusion criteria were ultrasound-confirmed atherosclerosis with internal carotid artery stenosis ≥ 70% according to consensus criteria of the Society of Radiologists in Ultrasound.24 Exclusion criteria were prior carotid endarterectomy/angioplasty with stenting, carotid occlusion, vasculitis, malignancy, prior radiation therapy to the neck, or immunotherapy. The Regional Committee for Medical and Health Research Ethics approved the study and all patients provided informed written consent.
Table 1.
Patient characteristics (n = 44)
| Age, years; mean ± SD | 66.3±8.4 |
| Sex, male; n (%) | 30 (68.2) |
| Statin therapy; n (%) | 34 (77.3) |
| Blood glucose, mmol L−1; mean ± SD (range) | 6.8 ± 2.2 (4.9-14.9) |
| Bodyweight, kg; mean ± SD (range) | 83.5 ± 16 (55-110) |
| Body mass index, kg/m2; mean ± SD (range) | 27.4 ± 4.5 (19.9-34.8) |
A subgroup of the patient material is included in a previously published study.25
Of the 44 included patients, 38 underwent carotid endarterectomy due to ipsilateral ischemic events or as prophylactic treatment before heart surgery. Eight of these plaques were lost to histological assessment due to logistical reasons.
18F-FDG PET/CT Examination
Following overnight fasting blood glucose level was measured before the patient received i.v. injection of 5 MBq/kg (0.14 mCi/kg). After a mean circulation time of 100 minutes (range 68-156), a 18F-FDG PET/CT scan from the base of the skull to the aortic arch was performed with 15 minutes per bed position using a hybrid PET/CT scanner (Siemens Biograph 64, Siemens Medical Systems, Erlangen, Germany). The PET data were reconstructed to 2-mm slices with a pixel size of 2.67 mm using the ordered subset expectation-maximization 2D algorithm with four iterations (i), eight subsets (s)(4i/8s), and Gaussian post-reconstruction filter with full-width at half maximum of 3.5 mm. For attenuation correction, low-dose CT without the use of i.v. contrast was performed immediately before 18F-FDG PET. For patients without a recent CT angiography of the carotid arteries, this was performed after 18F-FDG PET.
18F-FDG Uptake Quantification
The Hybrid Viewer 2.0 software (Hermes Medical Solutions AB, Stockholm, Sweden) was used for image fusion and 18F-FDG uptake quantification. The CT angiography was used to guide drawing of the ROIs on the fused PET/CT slices. A plaque was defined as vessel wall thickening and a lumen contrast-filling defect on CT angiography (Figure 1).13 An experienced nuclear medicine physician (K.J.) drew ROIs around the entire vessel wall and lumen on all plaque-containing axial PET slices (Figure 2). ROIs were carefully placed to minimize the influence from 18F-FDG uptake in structures close to the plaque (e.g., lymph nodes, paravertebral muscles, or salivary glands). Blood pool activity was obtained from four ROIs placed in the lumen of the jugular vein away from structures with 18F-FDG uptake. Plaque localization in relation to the carotid bifurcation was recorded. The most cranial slice of the common carotid artery before the division was defined as the bifurcation. The pixel values in the PET images were converted into SUV normalized to lean body mass.5
Figure 1.

18F-FDG PET/CT of stenotic plaque in the right internal carotid artery. From left to right: CT angiography, co-registered PET/CT, and 18F-FDG PET. The white box shows the plaque extension craniocaudally with lumen contrast-filling defect and vessel wall thickening on CT angiography (left image)
Figure 2.
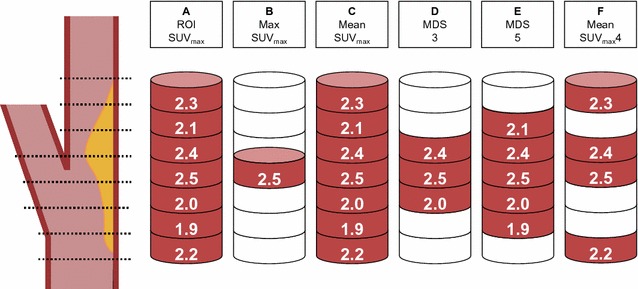
18F-FDG uptake quantification was based on the SUVmax of all the plaque-containing axial PET slices (A): Max SUVmax = the single highest SUVmax (B), mean SUVmax = the mean of all plaque SUVmax (C), MDS3 = the mean SUVmax of the three contiguous slices centered on the slice with the highest SUVmax (D), MDS5 = the mean SUVmax of the five contiguous slices centered on the slice with the highest SUVmax (E), and mean SUVmax4 = the mean SUVmax of the four slices with highest SUVmax within the plaque(F) (based on a figure by Tawakol et al 32)
For all plaque ROIs, SUVmax was obtained and the 18F-FDG uptake was quantified using the following approaches (Figure 2):
Max SUVmax = the single highest SUV,
Mean SUVmax = the mean of all plaque SUVmax,
Most Diseased Segment (MDS)3 = the mean SUVmax of the three contiguous slices centered on the slice with the highest SUVmax,
MDS5 = the mean SUVmax of the five contiguous slices centered on the slice with the highest SUVmax,
Mean SUVmax4 = the mean SUVmax of the four slices with highest SUVmax.
For all blood pool ROIs, SUVmean was obtained. Blood background-corrected values for all the SUV measurements were calculated (target-to-background ratio (TBR); SUV divided by the blood pool activity (mean SUVmean in four venous regions) and corrected SUV (cSUV); blood pool-corrected SUV (subtraction of the blood pool activity (mean SUVmean) from SUV).
A second independent experienced nuclear medicine physician (MER) drew ROIs on the 20 initial patients to assess inter-observer variability of the different quantification methods.
Endarterectomy and Histological Analysis
The mean time between PET/CT and endarterectomy was 6 days (range; 0-116, median; 0). The histological analysis has been described previously.25 In brief, plaques were removed en bloc at carotid endarterectomy, fixed in 4% formaldehyde, decalcified in ethylenediaminetetraacetic acid, and cut into 2- to 3-mm slices. After dehydration, the slices were embedded in paraffin and a 5-µm histological section from each slice was cut and stained with hematoxylin and eosin (H&E). The number of histology sections obtained from each plaque ranged from 2 to 9 (mean 4.9, SD 2.0). The plaques were assessed by a pathologist and a research physician blinded for the clinical and the 18F-FDG PET findings. Inflammation was quantified using a modified version of the method used by Jander et al.3 The sections were evaluated with 120× magnification and the percentage area of inflammatory cells (macrophages and leucocytes) per plaque was obtained (Figure 3): For each section, the total area and the area occupied by inflammatory cells were measured manually. The amount of inflammation per plaque was defined as the sum of all areas with inflammatory cells divided by the total area of all the sections. We performed repeated histopathological assessment on selected sections from this study cohort and found that the amount of inflammatory cells was in the same 5% category at both assessments for 73% of the sections (Kappa = 0.73).25 The amount of inflammation per plaque was 6.8% (SD 4.0; range 0.4-17.9).
Figure 3.

The histological quantification of inflammation was performed on H&E stained samples. The ocular micrometer was used to measure the total plaque area and area occupied by inflammatory cells in all the fields of view from all sections. The amount of inflammation per plaque was defined as the sum of all areas with inflammatory cells divided by the total area of all sections. A: ×200 magnification with inflammatory areas (marked by blue lines) containing mainly lymphocytes (i) and lipid macrophages (ii). B: ×400 magnification of areas with lipid macrophages
Statistical Analysis
The SPSS Statistics software for Windows (IBM, version 21.0; SPSS Inc., Chicago, Ill) was used. Groups of data were compared using two-sided t-test and Pearson correlation for normally distributed variables. For non-normal distributions Mann-Whitney test and Spearman correlation were used. Statistical significance was set to 0.05.
Results
Localization of Plaque and Highest 18F-FDG Uptake
The length of the plaques in the cranio-caudal direction was 6-32 mm (mean 19, SD 7.6) and all included the carotid artery bifurcation (Figure 4). Max SUVmax was located between 14 mm below to 18 mm above the bifurcation (mean 1.2 mm below the bifurcation) (Figure 4).
Figure 4.
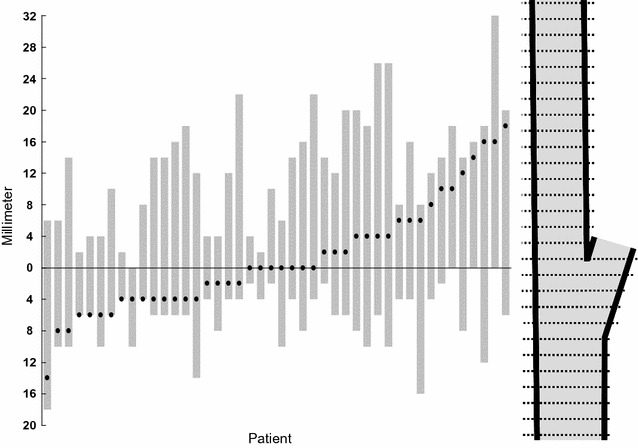
Plaque extension (gray bars) and max SUVmax location (black dots) per patient along the x-axis. The y-axis shows the distance in millimeter from the bifurcation (0) cranially in the internal carotid artery and caudally in the common carotid artery
Inter-observer Variability
The correlation coefficients between 18F-FDG uptakes calculated from plaques delineated by two nuclear medicine physicians independently were 0.96-0.98 for uncorrected SUVs, 0.63-0.68 for TBRs, and 0.90-0.93 for cSUVs. The correlation coefficient for background blood pool activity was 0.75.
Quantification of 18F-FDG Uptake
Mean values, SDs, and ranges for the different quantification methods are summarized in Table 2. The 18F-FDG uptake was significantly different for the different quantification approaches (paired samples t-test, P < 0.004 for all pairs). TBR gave the highest mean values and the widest ranges, whereas the background-subtracted values (cSUV) showed the lowest mean values and the narrowest ranges.
Table 2.
Plaque SUV for different quantification methods (n = 44)
| Uncorrected | TBR | cSUV | |
|---|---|---|---|
| Max SUVmax | 1.76 ± 0.35 (1.18-2.66) | 2.07 ± 0.44 (1.34-3.19) | 0.90 ± 0.33 (0.42-1.79) |
| Mean SUVmax | 1.56 ± 0.28 (1.11-2.28) | 1.83 ± 0.38 (1.16-2.91) | 0.69 ± 0.28 (0.20-1.29) |
| MDS3 | 1.70 ± 0.34 (1.17-2.51) | 2.00 ± 0.43 (1.26-3.16) | 0.83 ± 0.32 (0.33-1.64) |
| MDS5 | 1.66 ± 0.32 (1.15-2.32) | 1.95 ± 0.41 (1.22-3.14) | 0.79 ± 0.31 (0.28-1.45) |
| Mean SUVmax4 | 1.68 ± 0.33 (1.15-2.45) | 1.98 ± 0.42 (1.26-3.16) | 0.82 ± 0.31 (0.32-1.58) |
Data are given as mean ± SD (range)
TBR, target-to-background ratio; SUV, standardized uptake value; cSUV, corrected SUV (background-subtracted SUV); MDS, most diseased segment
18F-FDG uptake for the different quantification methods and corresponding background values for all patients are shown in Figure 5. Mean difference between max SUVmax and mean SUVmax was 0.08 and ranged from 0.02 to 0.66. The effect of background correction is shown in Figure 6. Correlations between 18F-FDG uptake within the groups were 0.93-0.99 for the uncorrected SUV, 0.94-1.0 for TBR, and 0.92-0.99 for cSUV (Table 3).
Figure 5.
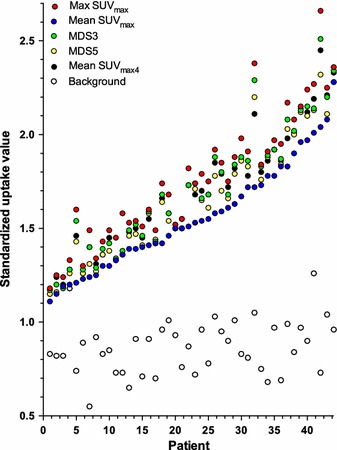
Uncorrected 18F-FDG uptake values for individual patients sorted according to increasing mean SUVmax. Each color represents separate quantification methods. The black dots are the background values (mean SUVmean)
Figure 6.
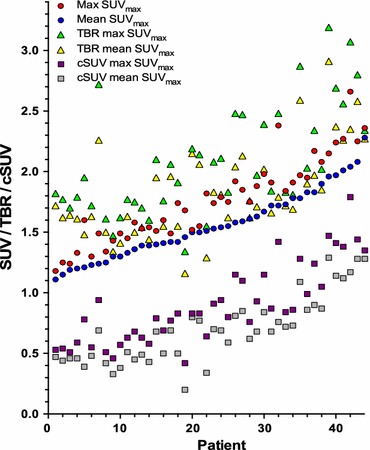
Uncorrected and background-corrected (TBR and cSUV) max and mean SUVmax per patient sorted according to increasing mean SUVmax
Table 3.
Correlation coefficients between different methods for 18F-FDG uptake quantification (n = 44)
| Uncorrected | TBR | cSUV | ||||||||||||
|---|---|---|---|---|---|---|---|---|---|---|---|---|---|---|
| Mean SUVmax | MDS3 | MDS5 | Mean SUVmax4 | Max SUVmax | Mean SUVmax | MDS3 | MDS5 | Mean SUVmax4 | Max SUVmax | Mean SUVmax | MDS3 | MDS5 | Mean SUVmax4 | |
| Uncorrected | ||||||||||||||
| Max SUVmax | .93* | .99* | .99* | .99* | .68* | .57* | .68* | .67* | .65* | .91* | .79* | .89* | .89* | .88* |
| Mean SUVmax | 1 | .96* | .96* | .96* | .64* | .65* | .65* | .66* | .65* | .85* | .87* | .86* | .87* | .86* |
| MDS3 | 1 | .99* | .99* | .69* | .59* | .69* | .68* | .67* | .91* | .81* | .91* | .90* | .89* | |
| MDS5 | 1 | .99* | .67* | .59* | .67* | .68* | .65* | .89* | .81* | .89* | .90* | .88* | ||
| Mean SUVmax4 | 1 | .69* | .62* | .69* | .69* | .68* | .91* | .83* | .90* | .90* | .90* | |||
| TBR | ||||||||||||||
| Max SUVmax | 1 | .94* | .99* | .99* | .99* | .91* | .89* | .92* | .91* | .92* | ||||
| Mean SUVmax | 1 | .96* | .97* | .97* | .82* | .93* | .85* | .86* | .87* | |||||
| MDS3 | 1 | 1.0* | 1.0* | .91* | .90* | .92* | .92* | .93* | ||||||
| MDS5 | 1 | .99* | .90* | .91* | .91* | .92* | .92* | |||||||
| Mean SUVmax4 | 1 | .89* | .90* | .90* | .90* | .92* | ||||||||
| cSUV | ||||||||||||||
| Max SUVmax | 1 | .92* | .99* | .99* | .99* | |||||||||
| Mean SUVmax | 1 | .94* | .95* | .96* | ||||||||||
| MDS3 | 1 | .99* | .99* | |||||||||||
| MDS5 | 1 | .99* | ||||||||||||
| Mean SUVmax4 | 1 | |||||||||||||
SUV, standardized uptake value; MDS, most diseased segment, background-corrected data; TBR, target-to-background ratio; cSUV, background-subtracted SUV
*Correlation is significant at the 0.01 level
Histology and 18F-FDG Uptake
There were significant moderate (0.44-0.59) correlations between the amount of inflammation and all the different 18F-FDG quantification methods (Table 4). The highest correlations were found for mean SUVmax, and the lowest for max SUVmax independent of background correction. Figure 7 shows scatter plots of inflammation versus max and mean SUVmax with and without background correction.
Table 4.
Correlation between 18F-FDG PET uptake values and histology (n = 30)
| 18F-FDG quantification method | Spearman correlation coefficient |
|---|---|
| Max SUVmax | 0.48 (0.008) |
| Mean SUVmax | 0.54 (0.002) |
| MDS3 | 0.48 (0.007) |
| MDS5 | 0.49 (0.006) |
| Mean SUVmax4 | 0.52 (0.003) |
| TBR max SUVmax | 0.44 (0.016) |
| TBR mean SUVmax | 0.58 (0.001) |
| TBR MDS3 | 0.47 (0.009) |
| TBR MDS5 | 0.48 (0.008) |
| TBR mean SUVmax4 | 0.48 (0.007) |
| cSUV max SUVmax | 0.47 (0.009) |
| cSUV mean SUVmax | 0.59 (0.001) |
| cSUV MDS3 | 0.52 (0.004) |
| cSUV MDS5 | 0.52 (0.003) |
| cSUV mean SUVmax4 | 0.54 (0.002) |
Data given as correlation coefficient (P value)
Figure 7.
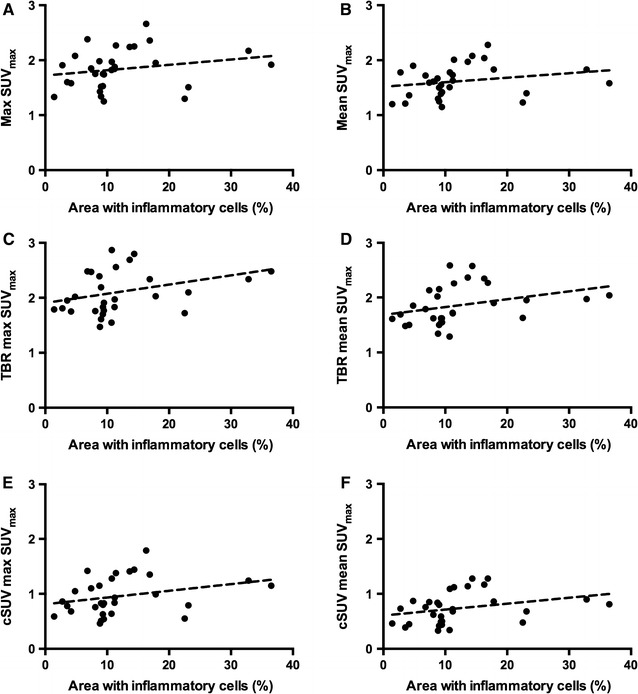
Scatter plots with correlation lines of total area with inflammatory cells versus uncorrected (A, B) and background-corrected (TBR: C, D and cSUV: E, F) max and mean SUVmax
Discussion
In this clinical study, we explored different methods for the quantification of 18F-FDG uptake in carotid plaques causing artery stenosis equal to or above 70%. 18F-FDG uptake was homogenously disseminated throughout the entire plaques. Although there were differences in magnitude, quantification of 18F-FDG uptake with and without background correction showed similar, moderate correlations to inflammation on histology.
Mean max SUVmax (mean of the max SUVmax for the study population) was only 13% higher than mean mean SUVmax (Figure 8), whereas the three other quantification methods gave values in between, increasing with decreasing number of included slices. Homogenous 18F-FDG uptake throughout the plaque contrasts findings from microPET of endarterectomized plaques showing patchy 18F-FDG uptake.26 The presence of macrophages reduces the thickness of the fibrous capsule and therefore an increasing number is likely to correlate to increasing vulnerability. As such, the highest 18F-FDG uptake within a plaque could be the most appropriate parameter for risk assessment. Currently, the most used measure for assessment of plaque inflammation has been the mean SUVmax.17,21,22 No clinical studies have assessed the use of whole plaque max SUVmax. Max SUVmax is easily obtained, highly reproducible, and less influenced by partial-volume effects.8,27 Although max SUVmax is prone to image noise,8 our findings suggest that for atherosclerotic plaque assessment in clinical PET, max SUVmax should be explored further.
Figure 8.
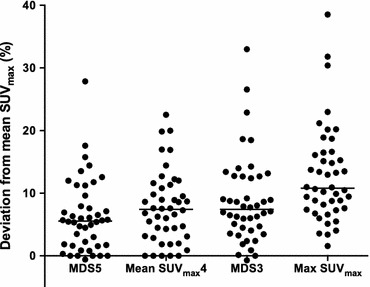
Deviation from the mean SUVmax for different quantification methods for individual patients. The black bar represents the mean values
The strong correlation between the different quantification methods suggests that for this group of patients uncorrected 18F-FDG uptake values may provide similar information as background-corrected values. As such, our findings do not support the superiority of TBR as quantification method as suggested by others.4,10,14-17 For circulation times above one hour, the blood background is low, but highly variable, whereas carotid plaques have consistent uptake over time.11,13 A slight variation in blood background will therefore give significant variability in TBR. From a physics perspective, Huet et al 9 have explained that there is no legitimate rationale for using TBR instead of SUV because blood contamination is an additive and not a multiplicative process. A purely additive process would require subtraction of the mean luminal blood pool activity from the SUVs (cSUVs).
The inter-observer variability analysis of 18F-FDG quantification revealed superior reproducibility of uncorrected SUVmax compared to blood background-corrected SUVs (TBR and cSUV). SUV measurements are highly dependent on the size, shape, and location of the drawn ROI because the ROI can either miss the voxel with the highest intensity or the ROI can inadvertently include contribution from adjacent 18F-FDG-avid organs. The use of contrast-enhanced CT to localize the plaques is likely to have contributed to the low inter-observer variability in the SUVmax in our study. Our correlation coefficient for blood background of 0.75 inevitably increases the inter-observer variability of all background-corrected values. Other 18F-FDG uptake reproducibility studies in localized carotid artery plaques have reported moderate (background corrected)28 to excellent (with and without background correction)22,29 inter-observer agreement. The slightly inferior inter-observer agreement for background-corrected values found in our study could be related to differences in the placement of the ROI in the jugular vein as the diameter of the jugular vein often was small, making the measurement susceptible to image noise. However, this is an inherent limitation of all quantification methods with background correction.
The optimal method should predict plaque vulnerability and clinical outcome. In the present study, all quantification methods for 18F-FDG uptake showed moderate correlation to inflammation on histopathology (Table 4). The correlations were systematically slightly higher when mean SUVmax was used instead of max SUVmax. This was not unexpected as total plaque inflammation score and mean SUVmax are both multi-slice methodologies. Total plaque inflammation score is a well-established method to correlate histology to ischemic symptoms,2,3 or to 18F-FDG uptake.17 When comparing max SUVmax with the slice with the highest percentage inflammatory area, the correlation did not increase (data not shown). This is in accordance with Tawakol et al17 who found slightly higher correlations between overall plaque inflammation and histology than a slice-by-slice comparison of uptake value and histology. How to use histology as a gold standard to imaging is challenging. We know that excised plaques both shrink17 and may be partly damaged.17,25
The strength of our study was the close timing between the PET examinations and the endarterectomies. Our study patients had plaques not only presumed highly inflammatory giving recent symptoms, but also plaques removed prophylactically from asymptomatic patients.
A limitation of our study is the inclusion of patients with elevated blood glucose. Four had blood glucose values > 11 mmol/L (198 mg/dL) and three 7-11 mmol/L (126-198 mg/dL) at the time of the 18F-FDG injection. Elevated blood glucose is known to reduce the uptake of 18F-FDG into metabolic active cells in malignant diseases.30 Guidelines for the clinical use of 18F-FDG in inflammation and infection31 also recommend the reduction of blood glucose to the lowest possible level. In studies on atherosclerosis, there is no consensus on a cut-off value.12 Some studies do not report on blood glucose level, whereas in other studies the cut-off values have ranged from 8 mmol/L (144 mg/dL)21 to 11.1 mmol/L (200 mg/dL).16 Our correlations between histology and the different 18F-FDG quantification methods were slightly increased when excluding the four patients with blood glucose level > 11 mmol/L. We have not excluded patients with high blood glucose in the correlation analysis of the different uptake parameters and thereby we do not know if this has contaminated our results. In the 44 included patients, there was no correlation between blood glucose and background SUVmean. Another limitation is the wide range of circulation times (68-156 minutes) that could have influenced the plaque 18F-FDG uptake by underestimating background-corrected values for patients with shorter circulation times and by overestimating background-corrected values for patients with longer circulation times. However, for 38 of the 44 patients the PET acquisition started between 85 and 115 minutes after 18F-FDG injection, and thus, it is unlikely that difference in circulation time would change the findings in our study.
New Knowledge Gained
Our study showed that SUVs without background correction from large plaques in the carotid artery can be used as inflammatory parameter in atherosclerosis.
Conclusion
In conclusion, in carotid artery stenosis equal to or above 70%, 18F-FDG uptake reflects the inflammatory status as assessed on histology. Increasing number of PET slices or background correction did not improve the correlation.
Electronic Supplementary Material
Below is the link to the electronic supplementary material.
Acknowledgement
The authors thank Trine Hjørnevik, PhD for helping with quantification software and figures.
Disclosure
KJ, KS, TS, MS, DR, and MER report no conflicts of interest.
Abbreviations
- PET
Positron emission tomography
- 18F-FDG
2-deoxy-2-(18F)-fluoro-d-glucose
- SUVmax
Maximum standardized uptake value
- ROI
Region of interest
- MDS
Most diseased segment
- TBR
Target-to-background ratio
- cSUV
Corrected SUV
Footnotes
The authors of this article have provided a PowerPoint file, available for download at SpringerLink, which summarises the contents of the paper and is free for re-use at meetings and presentations. Search for the article DOI on SpringerLink.com
Funding
This project received funding from the South-Eastern Norway Regional Health Authority and the National Association of Public Health.
David Russell and Mona-Elisabeth Revheim have contributed equally to this work.
References
- 1.Libby P. Inflammation in atherosclerosis. Nature. 2002;420:868–874. doi: 10.1038/nature01323. [DOI] [PubMed] [Google Scholar]
- 2.Redgrave JN, Lovett JK, Gallagher PJ, Rothwell PM. Histological assessment of 526 symptomatic carotid plaques in relation to the nature and timing of ischemic symptoms: the Oxford plaque study. Circulation. 2006;113:2320–2328. doi: 10.1161/CIRCULATIONAHA.105.589044. [DOI] [PubMed] [Google Scholar]
- 3.Jander S, Sitzer M, Schumann R, Schroeter M, Siebler M, Steinmetz H, et al. Inflammation in high-grade carotid stenosis: a possible role for macrophages and T cells in plaque destabilization. Stroke. 1998;29:1625–1630. doi: 10.1161/01.STR.29.8.1625. [DOI] [PubMed] [Google Scholar]
- 4.Rudd JH, Warburton EA, Fryer TD, Jones HA, Clark JC, Antoun N, et al. Imaging atherosclerotic plaque inflammation with [18F]-fluorodeoxyglucose positron emission tomography. Circulation. 2002;105:2708–2711. doi: 10.1161/01.CIR.0000020548.60110.76. [DOI] [PubMed] [Google Scholar]
- 5.Boellaard R, Delgado-Bolton R, Oyen WJ, Giammarile F, Tatsch K, Eschner W, et al. FDG PET/CT: EANM procedure guidelines for tumour imaging: version 2.0. Eur J Nucl Med Mol Imaging. 2015;42:328–354. doi: 10.1007/s00259-014-2961-x. [DOI] [PMC free article] [PubMed] [Google Scholar]
- 6.Bucerius J, Hyafil F, Verberne HJ, Slart RH, Lindner O, Sciagra R, et al. Position paper of the Cardiovascular Committee of the European Association of Nuclear Medicine (EANM) on PET imaging of atherosclerosis. Eur J Nucl Med Mol Imaging. 2016;43:780–792. doi: 10.1007/s00259-015-3259-3. [DOI] [PMC free article] [PubMed] [Google Scholar]
- 7.Kolodgie FD, Nakazawa G, Sangiorgi G, Ladich E, Burke AP, Virmani R. Pathology of atherosclerosis and stenting. Neuroimaging Clin N Am. 2007;17:285–301. doi: 10.1016/j.nic.2007.03.006. [DOI] [PMC free article] [PubMed] [Google Scholar]
- 8.Soret M, Bacharach SL, Buvat I. Partial-volume effect in PET tumor imaging. J Nucl Med. 2007;48:932–945. doi: 10.2967/jnumed.106.035774. [DOI] [PubMed] [Google Scholar]
- 9.Huet P, Burg S, Le Guludec D, Hyafil F, Buvat I. Variability and uncertainty of 18F-FDG PET imaging protocols for assessing inflammation in atherosclerosis: suggestions for improvement. J Nucl Med. 2015;56:552–559. doi: 10.2967/jnumed.114.142596. [DOI] [PubMed] [Google Scholar]
- 10.Blomberg BA, Akers SR, Saboury B, Mehta NN, Cheng G, Torigian DA, et al. Delayed time-point 18F-FDG PET CT imaging enhances assessment of atherosclerotic plaque inflammation. Nucl Med Commun. 2013;34:860–867. doi: 10.1097/MNM.0b013e3283637512. [DOI] [PubMed] [Google Scholar]
- 11.Blomberg BA, Thomassen A, Takx RA, Hildebrandt MG, Simonsen JA, Buch-Olsen KM, et al. Delayed 18F-fluorodeoxyglucose PET/CT imaging improves quantitation of atherosclerotic plaque inflammation: results from the CAMONA study. J Nucl Cardiol. 2014;21:588–597. doi: 10.1007/s12350-014-9884-6. [DOI] [PubMed] [Google Scholar]
- 12.Bucerius J, Mani V, Moncrieff C, Machac J, Fuster V, Farkouh ME, et al. Optimizing 18F-FDG PET/CT imaging of vessel wall inflammation: the impact of 18F-FDG circulation time, injected dose, uptake parameters, and fasting blood glucose levels. Eur J Nucl Med Mol Imaging. 2014;41:369–383. doi: 10.1007/s00259-013-2569-6. [DOI] [PMC free article] [PubMed] [Google Scholar]
- 13.Graebe M, Borgwardt L, Hojgaard L, Sillesen H, Kjaer A. When to image carotid plaque inflammation with FDG PET/CT. Nucl Med Commun. 2010;31:773–779. doi: 10.1097/MNM.0b013e32833c365e. [DOI] [PubMed] [Google Scholar]
- 14.Niccoli Asabella A, Ciccone MM, Cortese F, Scicchitano P, Gesualdo M, Zito A, et al. Higher reliability of 18F-FDG target background ratio compared to standardized uptake value in vulnerable carotid plaque detection: a pilot study. Ann Nucl Med. 2014;28:571–579. doi: 10.1007/s12149-014-0850-9. [DOI] [PubMed] [Google Scholar]
- 15.Rudd JH, Myers KS, Bansilal S, Machac J, Pinto CA, Tong C, et al. Atherosclerosis inflammation imaging with 18F-FDG PET: carotid, iliac, and femoral uptake reproducibility, quantification methods, and recommendations. J Nucl Med. 2008;49:871–878. doi: 10.2967/jnumed.107.050294. [DOI] [PubMed] [Google Scholar]
- 16.Tawakol A, Fayad ZA, Mogg R, Alon A, Klimas MT, Dansky H, et al. Intensification of statin therapy results in a rapid reduction in atherosclerotic inflammation: results of a multicenter fluorodeoxyglucose-positron emission tomography/computed tomography feasibility study. J Am Coll Cardiol. 2013;62:909–917. doi: 10.1016/j.jacc.2013.04.066. [DOI] [PubMed] [Google Scholar]
- 17.Tawakol A, Migrino RQ, Bashian GG, Bedri S, Vermylen D, Cury RC, et al. In vivo 18F-fluorodeoxyglucose positron emission tomography imaging provides a noninvasive measure of carotid plaque inflammation in patients. J Am Coll Cardiol. 2006;48:1818–1824. doi: 10.1016/j.jacc.2006.05.076. [DOI] [PubMed] [Google Scholar]
- 18.Bural GG, Torigian DA, Chamroonrat W, Alkhawaldeh K, Houseni M, El-Haddad G, et al. Quantitative assessment of the atherosclerotic burden of the aorta by combined FDG-PET and CT image analysis: a new concept. Nucl Med Biol. 2006;33:1037–1043. doi: 10.1016/j.nucmedbio.2006.08.005. [DOI] [PubMed] [Google Scholar]
- 19.Rudd JH, Myers KS, Bansilal S, Machac J, Rafique A, Farkouh M, et al. (18)Fluorodeoxyglucose positron emission tomography imaging of atherosclerotic plaque inflammation is highly reproducible: implications for atherosclerosis therapy trials. J Am Coll Cardiol. 2007;50:892–896. doi: 10.1016/j.jacc.2007.05.024. [DOI] [PubMed] [Google Scholar]
- 20.Fayad ZA, Mani V, Woodward M, Kallend D, Abt M, Burgess T, et al. Safety and efficacy of dalcetrapib on atherosclerotic disease using novel non-invasive multimodality imaging (dal-PLAQUE): a randomised clinical trial. Lancet. 2011;378:1547–1559. doi: 10.1016/S0140-6736(11)61383-4. [DOI] [PMC free article] [PubMed] [Google Scholar]
- 21.Graebe M, Pedersen SF, Hojgaard L, Kjaer A, Sillesen H. 18FDG PET and ultrasound echolucency in carotid artery plaques. JACC Cardiovasc Imaging. 2010;3:289–295. doi: 10.1016/j.jcmg.2010.01.001. [DOI] [PubMed] [Google Scholar]
- 22.Marnane M, Merwick A, Sheehan OC, Hannon N, Foran P, Grant T, et al. Carotid plaque inflammation on 18F-fluorodeoxyglucose positron emission tomography predicts early stroke recurrence. Ann Neurol. 2012;71:709–718. doi: 10.1002/ana.23553. [DOI] [PubMed] [Google Scholar]
- 23.Chen W, Dilsizian V. PET assessment of vascular inflammation and atherosclerotic plaques: SUV or TBR? J Nucl Med. 2015;56:503–504. doi: 10.2967/jnumed.115.154385. [DOI] [PubMed] [Google Scholar]
- 24.Grant EG, Benson CB, Moneta GL, Alexandrov AV, Baker JD, Bluth EI, et al. Carotid artery stenosis: gray-scale and Doppler US diagnosis—Society of Radiologists in Ultrasound Consensus Conference. Radiology. 2003;229:340–346. doi: 10.1148/radiol.2292030516. [DOI] [PubMed] [Google Scholar]
- 25.Skagen K, Johnsrud K, Evensen K, Scott H, Krohg-Sorensen K, Reier-Nilsen F, et al. Carotid plaque inflammation assessed with (18)F-FDG PET/CT is higher in symptomatic compared with asymptomatic patients. Int J Stroke. 2015;10:730–736. doi: 10.1111/ijs.12430. [DOI] [PubMed] [Google Scholar]
- 26.Masteling MG, Zeebregts CJ, Tio RA, Breek JC, Tietge UJ, de Boer JF, et al. High-resolution imaging of human atherosclerotic carotid plaques with micro 18F-FDG PET scanning exploring plaque vulnerability. J Nucl Cardiol. 2011;18:1066–1075. doi: 10.1007/s12350-011-9460-2. [DOI] [PMC free article] [PubMed] [Google Scholar]
- 27.Lodge MA, Chaudhry MA, Wahl RL. Noise considerations for PET quantification using maximum and peak standardized uptake value. J Nucl Med. 2012;53:1041–1047. doi: 10.2967/jnumed.111.101733. [DOI] [PMC free article] [PubMed] [Google Scholar]
- 28.Kwee RM, Truijman MT, Mess WH, Teule GJ, ter Berg JW, Franke CL, et al. Potential of integrated [18F] fluorodeoxyglucose positron-emission tomography/CT in identifying vulnerable carotid plaques. AJNR Am J Neuroradiol. 2011;32:950–954. doi: 10.3174/ajnr.A2381. [DOI] [PMC free article] [PubMed] [Google Scholar]
- 29.Li X, Heber D, Rausch I, Beitzke D, Mayerhoefer ME, Rasul S, et al. Quantitative assessment of atherosclerotic plaques on (18)F-FDG PET/MRI: comparison with a PET/CT hybrid system. Eur J Nucl Med Mol Imaging. 2016;43:1503–1512. doi: 10.1007/s00259-016-3308-6. [DOI] [PMC free article] [PubMed] [Google Scholar]
- 30.Wahl RL, Henry CA, Ethier SP. Serum glucose: effects on tumor and normal tissue accumulation of 2-[F-18]-fluoro-2-deoxy-d-glucose in rodents with mammary carcinoma. Radiology. 1992;183:643–647. doi: 10.1148/radiology.183.3.1584912. [DOI] [PubMed] [Google Scholar]
- 31.Jamar F, Buscombe J, Chiti A, Christian PE, Delbeke D, Donohoe KJ, et al. EANM/SNMMI guideline for 18F-FDG use in inflammation and infection. J Nucl Med. 2013;54:647–658. doi: 10.2967/jnumed.112.112524. [DOI] [PubMed] [Google Scholar]
- 32.Tawakol A, Singh P, Rudd JH, Soffer J, Cai G, Vucic E, et al. Effect of treatment for 12 weeks with rilapladib, a lipoprotein-associated phospholipase A2 inhibitor, on arterial inflammation as assessed with 18F-fluorodeoxyglucose-positron emission tomography imaging. J Am Coll Cardiol. 2014;63:86–88. doi: 10.1016/j.jacc.2013.07.050. [DOI] [PubMed] [Google Scholar]
Associated Data
This section collects any data citations, data availability statements, or supplementary materials included in this article.


