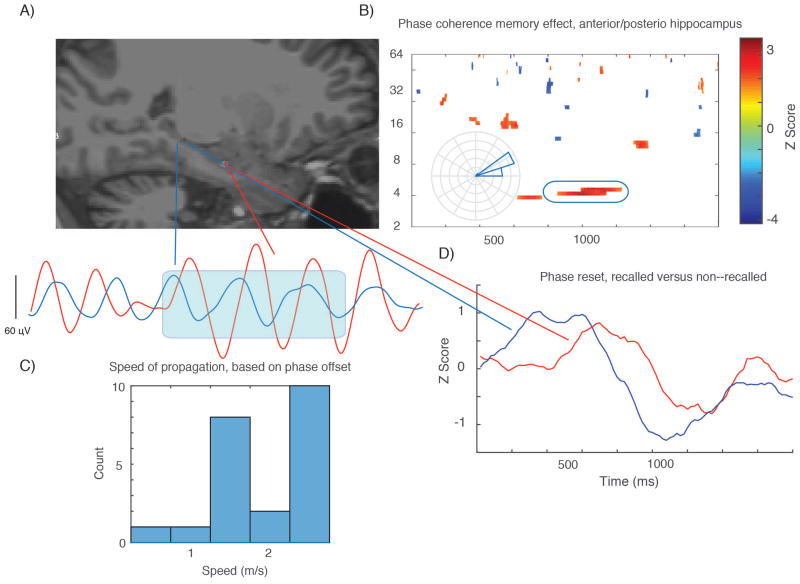
Figure 3. Phase coherence along dorsal–ventral hippocampal axis during item encoding.
A shows electrode locations in dorsal and ventral hippocampus in an experimental subject with single trial slow–theta wave from this same patient plotted below (1800 msec time window). B shows a significant connectivity subsequent memory effect (t–test across 23 subjects, comparing connectivity in recalled versus non–recalled events), with time–frequency points with p < 0.05 for one continuous half cycle of an oscillation). Red color indicates greater connectivity during successful encoding. Inset rose plot shows the mean phase difference for the selected time–frequency window (the blue oval) for an individual electrode pair, consistent with existing data and the example given in panel A. Phase difference of +15 degrees indicates the ventral contacts are ahead of dorsal contacts, consistent with dorsal–ventral direction of propagation. C shows the mean speed of propagation (histogram) for each subject. D shows results of a phase reset SME analysis, comparing phase dispersion during recalled and non–recalled events. SME Z value (t–test across subjects comparing phase reset in recalled versus non–recalled events) is plotted. The SME magnitude is not strong, but the difference in the timing of the maximum phase resent between the two locations is also consistent with dorsal–ventral propagation of a slow theta wave.

