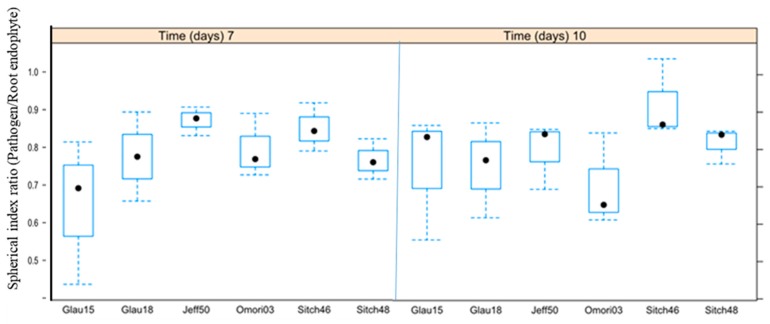
Figure 5.
Ratios of the mean spherical indices of the pathogen over its antagonistic partner from day 7 and day 10 measurements of the antagonism assay visualized side-by-side in box-and-whisker plots (solid black circles—medians). Samples shown here are only those which displayed statistically significant antagonism on both days of measurement.

