

ABSTRACT
Dairy product consumption may decrease colorectal cancer (CRC) risk, but very few studies have evaluated the association between different types of dairy products and CRC location. The aim of this systematic review and meta-analysis was to examine the associations between dairy product consumption and CRC incidence. Summary RRs and ORs with 95% CIs were estimated. A total of 15 cohort studies and 14 case-control studies comprising a total of >22,000 cases were included in the quantitative synthesis. The cohort studies showed a consistent significant decrease in CRC risk associated with higher consumption of total dairy products (RR: 0.80; 95% CI: 0.70, 0.91) and total milk (RR: 0.82; 95% CI: 0.76, 0.88) compared with the CRC risk associated with lower consumption. These studies also showed a significant protective association between low-fat milk consumption and CRC (RR: 0.76; 95% CI: 0.66, 0.88), but only for colon cancer (RR: 0.73; 95% CI: 0.61, 0.87). Cheese consumption was inversely associated with the risk of CRC (RR: 0.85; 95% CI: 0.76, 0.96) and proximal colon cancer (RR: 0.74; 95% CI: 0.60, 0.91). No significant associations with CRC were found for the consumption of low-fat dairy products, whole milk, fermented dairy products, or cultured milk. Most of these associations were not supported by the case-control studies. In conclusion, high consumption of total dairy products and total milk was associated with a lower risk of developing CRC at any anatomic location, including the proximal and distal colon and the rectum. Low-fat milk consumption was associated with a lower risk of CRC, but this association was restricted to colon cancer. Cheese consumption was associated with the prevention of CRC, specifically proximal colon cancer. Further studies on larger samples and with longer follow-up periods, along with appropriately designed and executed clinical trials, are warranted to determine whether dairy product consumption affects CRC development.
Keywords: dairy, milk, yogurt, cheese, colorectal cancer, systematic review, meta-analysis, prospective studies, case-control studies, adults
Introduction
In 2016, there were 1.7 million incident cases of colon and rectal cancer, with 830,000 deaths worldwide (1). Over the next 15 years, the global burden of colorectal cancer (CRC) is expected to increase by 60% and cause 1.1 million deaths (2).
It has been suggested that factors such as body weight/adiposity, physical activity, and diet are leading risk factors for CRC (3). Several studies have shown that a healthy dietary pattern, such as that in the Mediterranean diet, characterized by high intakes of vegetables, fruits, whole grains, nuts, and olive oil; moderate intakes of fish, poultry, and low-fat dairy foods; and low intakes of red meat, processed meat, and sugar-sweetened drinks, may decrease the risk of CRC (4, 5).
Although there is considerable evidence to suggest that the consumption of processed meat and alcohol are risk factors for CRC, evidence for an association between the consumption of dairy products and the risk of CRC is not as strong. The latest report from the Continuous Update Project (CUP), led by the World Cancer Research Fund/American Institute for Cancer Research (WCRF/AICR), concluded that there is strong evidence that the consumption of dairy products may help to protect against CRC (3). However, the risk of CRC associated with the consumption of different types of dairy products (i.e., yogurt, cultured milk, or hard cheese), as well as the consumption of dairy product subtypes and their fat composition (i.e., low-fat or high-fat dairy products, low-fat or full-fat yogurt, and skim/semiskim or whole milk), remains unclear (6–19).
Although most current dietary guidelines advocate the consumption of fat-free or low-fat dairy products in the context of a healthy diet to prevent chronic diseases (20–23), evidence has shown no association between the consumption of full-fat dairy products and either the risk of CRC (6, 12, 19) or a reduction in the risk (14). Therefore, further research on the association between the consumption of milk foods and the risk of CRC should be of considerable interest in terms of public health.
The aim of this systematic review and meta-analysis was to extend the available evidence and combine all the results from prospective cohorts and case-control studies in adults so that the association between the consumption of specific types of dairy products and CRC incidence could be examined. We also investigated whether these associations depended on the CRC subsite (colon or rectal) and colon cancer location (proximal or distal colon).
Methods
Design
This systematic review and meta-analysis study was conducted in accordance with the Cochrane Handbook for Systematic Reviews of Interventions (24). The results are presented following the “Meta-Analysis of Observational Studies in Epidemiology” (25) and the “Preferred Reporting Items for Systematic Reviews and Meta-Analyses: The PRISMA Statement” guidelines (see the PRISMA checklist in the Supplementary Data) (26). The protocol for the systematic review and meta-analysis is available in PROSPERO (www.crd.york.ac.uk; identifier: CRD42017057490).
Study selection
We systematically searched for published case-control and prospective cohort studies evaluating the associations between the consumption of total dairy products (and their subtypes) and the incidence of CRC (total CRC, colon or rectal cancer, and proximal or distal colon cancer). One review author (LB) searched for relevant keywords and medical subject heading terms related to the consumption of dairy products (i.e., “dairy” or “dairy products”) and subtypes of dairy products (i.e., “milk” or “yogurt” or “yoghurt” or “cheese” or “cultured milk products”) in combination with keywords related to CRC events (i.e., “colorectal cancer” or “colorectal neoplasms”). No restrictions on the study design or language of the publication were considered. The MEDLINE (PubMed), Cochrane Library, CINAHL, and ScienceDirect databases were searched up to 4 June, 2018 (see all search strategies in Supplemental Table 1). We also carried out a manual search of the bibliographies of the articles we assessed and contacted the authors of unavailable sources.
All studies that met the following criteria were considered for inclusion in the meta-analysis: 1) those conducted in humans (>18 y old); 2) those written in English, Spanish, or French; 3) those in which the outcome of interest was CRC, colon, or rectal cancer; 4) those that provided estimates of the OR or RR (such as the HR or risk ratio) with the corresponding 95% CIs, or gave sufficient data for these values to be calculated; 5) those in which the estimates were adjusted for age; 6) those that evaluated the consumption of dairy products through the use of validated food questionnaires; and 7) those that assessed the consumption of any subtype or total dairy product (cow, goat, or sheep milk; skim, low-fat, or full-fat milk; total, low-fat, or full-fat yogurt; cheese; and full-fat dairy, sweetened dairy, or other dairy products) as the exposure variable. For the dose-response analysis we required the following criteria to be met: 1) a quantitative measure of intake had to be provided; 2) when there were several publications from the same study, we selected the publication with the largest number of cases; and 3) if all the information required was not provided in the paper, we used the publication that provided enough information for a dose-response analysis to be conducted. The following types of publications were excluded: 1) nonoriginal papers (reviews, commentaries, editorials, or letters); 2) ecologic assessments and correlation studies; 3) cross-sectional studies; 4) meta-analysis studies; 5) non-peer-reviewed articles; 6) off-topic studies; 7) studies on CRC mortality; 8) studies lacking specific CRC data; 9) animal and mechanistic studies; 10) studies conducted in children, adolescents, or pregnant women; 11) supplements to the main manuscript; 12) duplicate publications; and 13) low-quality studies.
Data extraction
First, we removed duplicate works from the databases mentioned above and from the manual search. Second, the titles and abstracts were screened for eligibility independently and in duplicate by 2 researchers (NB and LB) at the Human Nutrition Unit to exclude obviously irrelevant studies. After the primary screening, the full texts of potentially relevant reports were retrieved, and the inclusion and exclusion criteria and the quality of the study were assessed by 2 researchers (NR-E and LB) (see the PRISMA flow diagram, Figure 1) with the use of a data extraction form developed for this study. If the 2 review authors could not reach agreement, a third author (JS-S) was consulted to make a decision.
FIGURE 1.
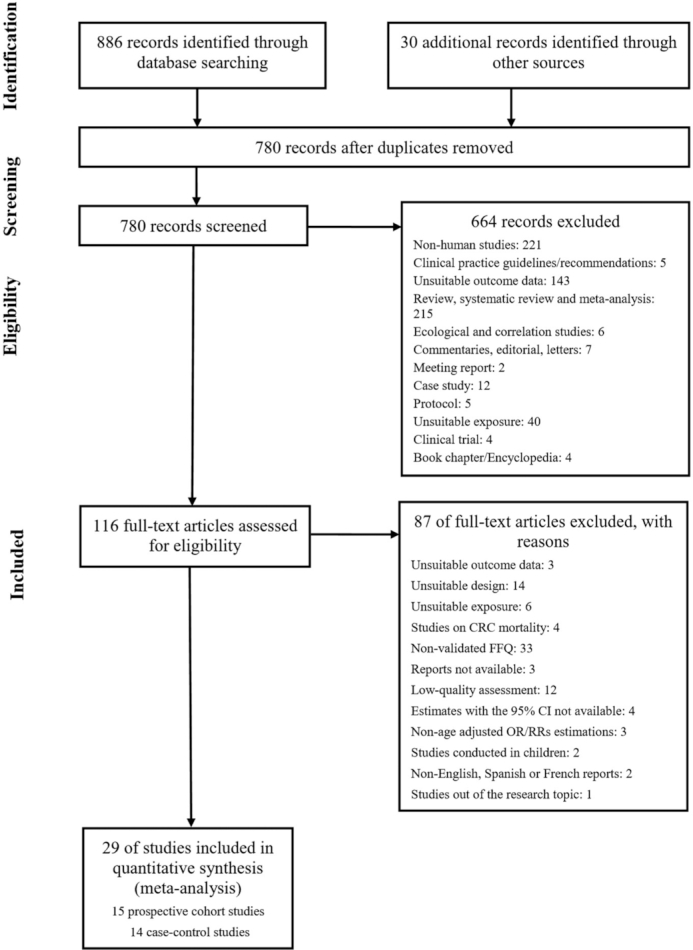
Flow of information through the different phases of the identification and selection of relevant studies examining the associations between the consumption of dairy products and the risk of CRC in adults. Abbreviations: CI, confidence interval; CRC, colorectal cancer; FFQ, food frequency questionnaire; OR, odds ratio; RR, relative risk.
The data extracted for each individual study included the following: first author of the article, name of the journal in which the article was published, year of the study, title of the article, study dates, sample size, population characteristics (age, sex, and health status), country of recruitment, covariates included in the fully adjusted models, dietary assessment method, outcome and outcome assessment method, language of the publication, endpoint variables, exposure variables (type of dairy product consumed and intake range), statistical methods and statistical software used, endpoint data, funding sources, and frequency of data collection. For case-control studies, the length of the study period and the number of cases and controls were collected, and for cohort studies, the follow-up period and number of events were collected.
Study quality assessment
To evaluate the validity of the individual studies, 2 reviewers (NR-E and LB) worked independently to determine the quality of the included studies based on the use of the Newcastle-Ottawa Scale (NOS) for cohort or case-control studies (27). The evaluation was based on the following criteria: 1) the study selection (maximum 4 points); 2) the adequacy of the outcome in cohort studies and the adequacy of the exposure in case-control studies (maximum 3 points); and 3) the comparability of the studies (maximum 2 points). Depending on the score assigned, the studies were categorized as either high quality or low quality. The maximum score was 9, and a high score (≥6) indicated high methodologic quality. A consensus was reached between the reviewers if there were any discrepancies.
Statistical analysis
To calculate the summary risk estimates and 95% CIs for the highest compared with the lowest categories of consumption of dairy products and dairy product subtypes, we conducted both random (≥5 study comparisons) and fixed (<5 study comparisons) effects analyses. We natural log–transformed and pooled the RRs/HRs (cohort studies) and ORs (case-control studies) through the use of the generic inverse variance method. When the highest level of consumption was considered as the reference category, we recalculated the estimate (RR and 95% CI) of the highest category (28). A 2-tailed P < 0.05 was considered statistically significant. The heterogeneity among studies was assessed with the use of Cochran's Q statistic and quantified with the I2 statistic (P < 0.10 was considered significant, and I2 ≥ 50% was interpreted as substantial heterogeneity).
When the results of the studies were stratified by subgroups, such as sex, they were treated as separate studies. We carried out prespecified stratified analyses for the study design (prospective cohort and case-control studies) and outcome (CRC, colon cancer, proximal or distal colon cancer, and rectal cancer).
Analyses were performed with Review Manager (RevMan) version 5.3 (The Nordic Cochrane Center) and STATA version 14.0 (StataCorp LP) software.
We performed linear and nonlinear dose-response analyses with data from the cohort studies. We carried out generalized least-squares trend estimation modeling and spline curve modeling (MKspline STATA command). This method requires at least 3 quantitative exposure levels or quantiles. To impute missing data, such as the number of participants and cases, in each quantile, we used the method of Bekkering et al. (29). For studies that did not include the total number of participants in each quantile but reported the total number of participants, we divided the total sample size by the number of quantiles. When the number of cases in each category was not given, we used the RR to impute the number of cases.
For studies that reported the range of consumption of dairy products but not the mean or median intake, we calculated the midpoint. For those reporting open-ended lower or upper boundaries, we assumed a range equal to the adjacent range. If the consumption of dairy products was given in grams/day, we converted the intake into servings/day based on the use of standard units: 200 g for total dairy products, 200 g for milk (1 glass), 125 g for yogurt (1 commercial serving), and 30 g for cheese. When the intakes were reported in densities (grams · 1000 kcal–1 · day–1), we recalculated the reported intakes by considering the mean energy intake specified in the publication (30). If the study reported the consumption of cheese in slices/day, we regarded each slice as 25 g (17). If the estimated risks for skim and semiskim milk were reported separately, we considered only the measure for skim milk (18) because this is the most widely consumed type of milk. When hard cheese and other types of cheese, such as cottage or cream cheese, were reported individually, we used the estimates for hard cheese (17, 31) so that our results were comparable to the current evidence. When both baseline and repeated measurement analyses were reported, we used the repeated measurements because they more accurately represent changes in dietary consumption (32). When the fully adjusted model was not adjusted for age, we used the age-adjusted estimates (32).
To determine whether our results were robust, we performed a sensitivity analysis by recalculating the summary estimates after excluding 1 study at a time (Supplemental Tables 2 and 3).
Results
Study selection
Figure 1 shows the flow diagram summarizing the identification and selection of the relevant publications. Of the 780 reports remaining after duplicates were removed, 29 studies were included in the meta-analysis: 15 prospective cohort studies (6, 8, 11, 14, 17–19, 30, 32–38) and 14 case-control studies (28, 31, 39–50).
Study characteristics
Tables 1 and 2 show the main characteristics of the studies selected. In total, the cohort studies included 1,371,848 participants (66% women, 31% men, and 3% undefined) with 11,733 cases recorded during follow-up periods that ranged from 4 to 14.8 y (Table 1). The case-control studies included 10,921 cases and 13,398 controls (Table2).
TABLE 1.
Characteristics of the 15 prospective cohort studies included in the meta-analysis examining the associations between the consumption of dairy products and the risk of CRC1
| Study, year (ref.) | Study cohort and characteristics (age, y) | No. of participants (M/W) | No. of incident cases | Follow-up length, y | Exposure | RR | Adjustments to the RR | Funding source | NOS quality score |
|---|---|---|---|---|---|---|---|---|---|
| Bostick et al., 1993 (6) | USA: Iowa Women's Health Study (55–69) | 35,216 W | 212 CC | 5 | Total dairy (milk products, excluding butter): >25 vs <8 servings/wk Fat-containing dairy (excluding butter): >14 vs <4 serving/wk |
CC: 0.72 (95% CI: 0.38, 1.36) CC: 0.78 (95% CI: 0.45, 1.36) |
Age, total energy intake, height, parity, low-fat meat intake, total vitamin E intake, and a total vitamin E × age interaction term | Agency | 6 |
| Kearney et al., 1996 (8) | USA: Health Professionals Follow-up Study (40–75) | 47,935 M | 203 CC | 6 | Milk, whole or skim/low fat: >1/d vs <1/mo (237 mL) Ice cream: >1/d vs <1/mo (1/2 cup) Hard cheese: >1/d vs <1/mo (1 slice) Fermented dairy products (yogurt, sour cream, cottage cheese, cream cheese, hard cheese, Swiss, American, cheddar, etc.): >1/d vs <1/mo (median intake) |
CC: 0.87 (95% CI: 0.52, 1.44) CC: 0.93 (95% CI: 0.42, 2.04) CC: 1.35 (95% CI: 0.67, 2.75) CC: 1.09 (95% CI: 0.70, 1.72) |
Age, total calories, family history of colon cancer, previous polyp, screening, past history of smoking, alcohol consumption, aspirin use, physical activity, BMI, red meat, saturated fat, and dietary fiber intakes | Agency-industry | 6 |
| Gaard et al., 1996 (33) | Norway (20–53) | 25,638/24,897 | 143 CC | 11.4 | Milk (any type): ≥4 vs <1 glasses/d | CC (M): 0.72 (95% CI: 0.25, 2.07) CC (W): 1.24 (95% CI: 0.35, 4.40) |
Age and attained age | Agency | 7 |
| Singh et al., 1998 (34) | USA: Adventist Health Study (25–100) | 32,051 | 157 CC | 6 | Nonfat milk: ≥1 serving/wk vs never Low-fat milk: ≥1 serving/wk vs never Whole milk: ≥1 serving/wk vs never Cheese (excluding cottage cheese): ≥2 servings/wk vs never to <2 servings/mo Cottage cheese: ≥2 servings/wk vs never to <2 servings/mo |
CC: 0.78 (95% CI: 0.48, 1.28) CC: 0.97 (95% CI: 0.66, 1.42) CC: 1.04 (95% CI: 0.69, 1.59) CC: 1.31 (95% CI: 0.84, 2.03) CC: 0.74 (95% CI: 0.49, 1.11) |
Age at baseline, sex, BMI, physical activity, parental history of colon cancer, current smoking, past smoking, alcohol consumption, and aspirin use | Agency | 6 |
| Sellers et al., 1998 (35) | USA: Iowa Women's Health Study (mean of 61.7) | 35,216 W | 241 CC | 10 | Total dairy: >20 vs ≤10 servings/wk High-fat dairy (including whole milk, cream, sour cream, ice cream, cheeses, butter, pizza, cream sauce, and cheese sauce): >9 vs ≤4.5 servings/wk |
CC (NFH): 0.70 (95% CI: 0.40, 1.00) CC (FH): 0.70 (95% CI: 0.40, 1.40) CC (NFH): 0.90 (95% CI: 0.60, 1.30) CC (FH): 0.70 (95% CI: 0.40, 1.30) |
Age at baseline, total energy intake, and history of rectal colon polyps | Agency | 6 |
| Low-fat dairy (includes skim milk, ice milk, and yogurt): >7 vs ≤2.5 servings/wk | CC (NFH): 0.80 (95% CI: 0.50, 1.10) CC (FH): 0.90 (95% CI: 0.50, 1.60) |
||||||||
| Terry et al., 2002 (11) | Sweden: Swedish Mammography Screening Cohort (median 55) | 61,643 W | 572 CRC, 371 CC (164 PC, 121 DC) and 191 R | 11.3 | Total dairy: Q4 vs Q1 | CRC: 0.97 (95% CI: 0.73, 1.29) CC: 1.03 (95% CI: 0.72, 1.47) PC: 1.32 (95% CI: 0.77, 2.28) DC: 0.71 (95% CI: 0.38, 1.30) R: 1.04 (95% CI: 0.64, 1.71) |
Age, BMI, education level, total energy and quartiles of red meat, alcohol, and energy-adjusted folic acid and vitamin C intake. Individual dairy products were mutually adjusted | Agency | 6 |
| Low-fat dairy: Q4 vs Q1 | CRC: 0.94 (95% CI: 0.91, 1.23) CC: 1.01 (95% CI: 0.72, 1.42) PC: 1.00 (95% CI: 0.60, 1.66) DC: 0.84 (95% CI: 0.45, 1.56) R: 0.79 (95% CI: 0.49, 1.27) |
||||||||
| Fermented dairy (yogurt and cultured milk): Q4 vs Q1 | CRC: 0.90 (95% CI: 0.72, 1.13) CC: 0.76 (95% CI: 0.57, 1.01) PC: 0.67 (95% CI: 0.44, 1.03) DC: 0.80 (95% CI: 0.47, 1.35) R: 1.28 (95% CI: 0.87, 1.89) |
||||||||
| Nonfermented dairy (milk and cheese): Q4 vs Q1 | CRC: 0.99 (95% CI: 0.76, 1.29) CC: 1.10 (95% CI: 0.79, 1.52) PC: 1.43 (95% CI: 0.87, 2.37) DC: 0.64 (95% CI: 0.37, 1.10) R: 0.83 (95% CI: 0.53, 1.31) |
||||||||
| McCullough et al., 2003 (36) | USA: Cancer Prevention Study (CPS) II Nutrition Cohort (50–74) | 60,866/66,883 | 683 CRC | ∼4 | Dairy (skim milk, low-fat milk, whole milk, cheese, yogurt and ice-cream): ≥2 servings/d vs <2 servings/wk | CRC (M): 0.96 (95% CI: 0.67, 1.38) CRC (W): 1.11 (95% CI: 0.68, 1.83) CRC (all population): 1.00 (95% CI: 0.75, 1.34) PC (M): 0.49 (95% CI: 0.24, 1.03) DC (M): 1.18 (95% CI: 0.55, 2.57) CC (M): 0.84 (95% CI: 0.54, 1.29) R (M): 1.22 (95% CI: 0.64, 2.33) |
Age, smoking, BMI, education, physical activity, family history of CRC, total energy, percentage saturated fat, fruit intake, vegetable intake, long-term multivitamin use, and HRT use | NA | 6 |
| Milk (skim, low-fat and whole milk): ≥1.1 vs 0 serving/d | CRC (M): 0.86 (95% CI: 0.66, 1.11) CRC (W): 1.18 (95% CI: 0.84, 1.65) CRC (all population): 0.96 (95% CI: 0.78, 1.18) PC (M): 0.68 (95% CI: 0.42, 1.09) DC (M): 0.92 (95% CI: 0.54, 1.58) CC (M): 0.81 (95% CI: 0.60, 1.10) R (M): 0.89 (95% CI: 0.54, 1.47) |
||||||||
| Larsson et al., 2005 (14) | Sweden: Swedish Mammography Cohort (40–76) | 60,708 W | 798 CRC, 543 CC (246 PC, 170 DC, 127 unknown), 249 R and 6 C+R | 14.8 | High-fat dairy food consumption: ≥4 vs <1 serving/d | CRC: 0.59 (95% CI: 0.44, 0.79) PC: 0.84 (95% CI: 0.50, 1.42) DC: 0.28 (95% CI: 0.14, 0.56) R: 0.62 (95% CI: 0.37, 1.02) |
Stratified by age at recruitment and the year of entry into the cohort. Adjusted for age, BMI, education, total energy intake and quintiles of intakes of folate, vitamin B-6, cereal fiber and red meat | Agency | 7 |
| Whole milk: ≥1 serving/d vs never or seldom | CRC: 1.08 (95% CI: 0.90, 1.29) PC: 1.58 (95% CI: 1.15, 2.16) DC: 0.72 (95% CI: 0.47, 1.10) R: 0.99 (95% CI: 0.72, 1.37) |
||||||||
| Full-fat cultured milk: ≥1 serving/d vs never or seldom | CRC: 0.81 (95% CI: 0.66, 1.00) PC: 0.80 (95% CI: 0.56, 1.15) DC: 0.71 (95% CI: 0.44, 1.13) R: 0.91 (95% CI: 0.62, 1.31) |
||||||||
| Cheese: ≥3 vs <1 serving/d | CRC: 0.65 (95% CI: 0.44, 0.96) PC: 0.76 (95% CI: 0.39, 1.50) DC: 0.24 (95% CI: 0.07, 0.82) R: 0.89 (95% CI: 0.46, 1.71) |
||||||||
| Butter: ≥15 g/d vs never or seldom | CRC: 0.80 (95% CI: 0.64, 1.00) PC: 1.10 (95% CI: 0.75, 1.61) DC: 0.63 (95% CI: 0.37, 1.08) R: 0.75 (95% CI: 0.50, 1.11) |
||||||||
| Larsson et al., 2006 (17) | Sweden: Cohort of Swedish Men (45–79) | 45,306 M | 449 CRC, 276 CC (124 PC, 131 DC, 21 unspecified) and 173 R | 6.7 | Total dairy (except butter): ≥7 vs <2 servings/d | CRC: 0.46 (95% CI: 0.30, 0.71) CC: 0.44 (95% CI: 0.25, 0.76) PC: 0.37 (95% CI: 0.16, 0.88) DC: 0.43 (95% CI: 0.20, 0.93) R: 0.48 (95% CI: 0.23, 0.99) |
Stratified by age at baseline. Adjusted for education, family history of CRC, BMI, exercise, history of diabetes, cigarette smoking, aspirin use, multivitamin supplement use, total energy and quartiles of saturated fat, total vitamin D, alcohol, fruit, vegetable, and red meat intake | Agency | 7 |
| Milk (low-fat, medium-fat and whole): ≥1.5 glasses/d vs <2 glasses/d | CRC: 0.67 (95% CI: 0.51, 0.87) CC: 0.65 (95% CI: 0.46, 0.91) PC: 0.76 (95% CI: 0.45, 1.30) DC: 0.53 (95% CI: 0.33, 0.87) R: 0.69 (95% CI: 0.45, 1.06) |
||||||||
| Cultured milk (sour milk and yogurt): ≥1 serving/d vs never | CRC: 1.07 (95% CI: 0.86, 1.34) CC: 1.17 (95% CI: 0.88, 1.56) PC: 1.10 (95% CI: 0.72, 1.69) DC: 1.26 (95% CI: 0.84, 1.91) R: 0.94 (95% CI: 0.66, 1.33) |
||||||||
| Cream and sour cream: ≥2 vs <0.5 serving/wk | CRC: 0.84 (95% CI: 0.65, 1.09) CC: 0.72 (95% CI: 0.52, 1.01) PC: 0.70 (95% CI: 0.42, 1.17) DC: 0.72 (95% CI: 0.45, 1.14) R: 1.12 (95% CI: 0.74, 1.70) |
||||||||
| Hard cheese: ≥3 slices/d vs <4 slices/wk | CRC: 0.79 (95% CI: 0.56, 1.12) CC: 0.78 (95% CI: 0.51, 1.21) PC: 0.76 (95% CI: 0.40, 1.43) DC: 0.87 (95% CI: 0.45, 1.70) R: 0.80 (95% CI: 0.45, 1.41) |
||||||||
| Cottage or cream cheese: ≥1 serving/mo vs never | CRC: 0.68 (95% CI: 0.40, 1.16) CC: 0.88 (95% CI: 0.48, 1.59) PC: 0.98 (95% CI: 0.42, 2.29) DC: 0.93 (95% CI: 0.40, 2.17) R: 0.36 (95% CI: 0.11, 1.15) |
||||||||
| Park et al., 2007 (30) | USA: Multiethnic Cohort Study (45–75) | 85,903/105,108 | 2110 CRC (1138 M, 972 W) | 7.3 | Total dairy: ≥161 vs <33 g · 1000 kcal–1 · d–1Milk: ≥122 vs <11 g · 1000 kcal–1 · d–1 | CRC (M): 0.80 (95% CI: 0.64, 0.99) CRC (W): 0.81 (95% CI: 0.65, 1.00) CRC (M): 0.78 (95% CI: 0.63, 0.96) CRC (W): 0.85 (95% CI: 0.68, 1.06) |
Stratified by ethnicity and time since cohort entry. Adjusted for age at cohort entry, pack-years of cigarette smoking, family history of CRC, physical activity, history of intestinal polyps, use of NSAIDs, BMI, total energy intake, dietary fiber intake, regular multivitamin use and HRT use | Agency | 6 |
| Lee et al., 2009 (37) | China: Shanghai Women's Health Study (SWHS) (40–70) | 73,224 W | 394 CRC (236 CC and 158 R) | 7.4 | Milk: ≥200 vs 0 g/d | CRC: 0.80 (95% CI: 0.50, 1.20) CC: 0.80 (95% CI: 0.40, 1.30) R: 0.80 (95% CI: 0.40, 1.70) |
Age, education, income, survey season, tea consumption, NSAID use, energy intake, and fiber intake | Agency | 8 |
| Pala et al., 2011 (38) | Italy: Italian European Prospective Investigation into Cancer and Nutrition cohort (EPIC-Italy cohort) (mean of 51) | 14,178/31,063 | 289 CRC (215 CC and 74 R) | 12 | Yogurt: T3 vs T1 (median intake) | CRC (entire cohort): 0.65 (95% CI: 0.48, 0.89) CRC (M): 0.47 (95% CI: 0.28, 0.81) CRC (W): 0.69 (95% CI: 0.47, 1.03) |
Stratified by diet questionnaire. Adjusted for energy, animal fat, red meat intake, dietary calcium, dietary fiber, simple sugars, BMI, alcohol consumption, smoking, education level, recreational activity (excluding sports), sporting and type of work. | Agency | 6 |
| Murphy et al., 2013 (18) | 10 European countries (Denmark, France, Germany, Greece, Italy, the Netherlands, Norway, Spain, Sweden, and the United Kingdom): European Prospective Investigation into Cancer and Nutrition (EPIC) (≥35) | 142,141/334,981 | 4513 CRC, 2868 CC (1298 PC, 1266 DC, 304 unspecified or overlapping) and 1645 R | 11 | Total milk (whole-fat, skimmed, semiskim, and not specified): ≥325 vs <9 g/d | CRC: 0.81 (95% CI: 0.73, 0.90) CC: 0.80 (95% CI: 0.70, 0.91) PC: 0.84 (95% CI: 0.69, 1.02) DC: 0.78 (95% CI: 0.63, 0.96) R: 0.84 (95% CI: 0.70, 0.99) |
Stratified by age (1-y categories), sex and center. Adjusted for total energy intake, BMI, physical activity index, smoking status and intensity, education status, ever-use of contraceptive pill, ever-use of HRT, menopausal status, alcohol consumption, intakes of red and processed meat and fiber. | Agency | 6 |
| Cheese (all kinds of fresh, fermented, and matured cheese): ≥56 vs <5 g/d | CRC: 0.87 (95% CI: 0.76, 0.99) CC: 0.83 (95% CI: 0.71, 0.97) PC: 0.73 (95% CI: 0.58, 0.93) DC: 0.91 (95% CI: 0.71, 1.17) R: 0.95 (95% CI: 0.76, 1.18) |
||||||||
| Yogurt (natural and flavored yogurt in all cohorts, and, additionally, fermented milk in Sweden, Norway, and Denmark) | CRC: 0.90 (95% CI: 0.81, 0.99) CC: 0.88 (95% CI: 0.77, 1.00) PC: 0.94 (95% CI: 0.79, 1.13) DC: 0.84 (95% CI: 0.69, 1.02) R: 0.93 (95% CI: 0.79, 1.10) |
||||||||
| Total dairy | CRC: 0.77 (95% CI: 0.70, 0.86) CC: 0.75 (95% CI: 0.66, 0.86) PC: 0.75 (95% CI: 0.62, 0.91) DC: 0.74 (95% CI: 0.61, 0.90) R: 0.81 (95% CI: 0.69, 0.96) |
||||||||
| Whole milk (excluding Norway) | CRC: 0.86 (95% CI: 0.72, 1.02) CC: 0.83 (95% CI: 0.67, 1.03) PC: 0.92 (95% CI: 0.68, 1.26) DC: 0.82 (95% CI: 0.59, 1.14) R: 0.90 (95% CI: 0.68, 1.20) |
||||||||
| Semiskim milk (excluding Norway, Germany, and Greece) | CRC: 0.85 (95% CI: 0.75, 0.97) CC: 0.84 (95% CI: 0.71, 0.99) PC: 0.97 (95% CI: 0.77, 1.22) DC: 0.73 (95% CI: 0.57, 0.95) R: 0.87 (95% CI: 0.70, 1.08) |
||||||||
| Skim milk [excluding Norway, Germany, Greece, Florence (Italy), Varese (Italy), and Turin (Italy)] | CRC: 0.78 (95% CI: 0.67, 0.90) CC: 0.72 (95% CI: 0.60, 0.88) PC: 0.68 (95% CI: 0.51, 0.90) DC: 0.79 (95% CI: 0.59, 1.05) R: 0.87 (95% CI: 0.69, 1.10) |
||||||||
| Barrubés et al., 2018 (19) | Spain: PREDIMED trial (55–80) | 7,216 | 97 CRC | 6 | Total dairy products (all types of milk, yogurt and cheese; custard; whipped cream; butter; and ice-cream): 564 vs 206 g/day | CRC: 0.55 (95% CI: 0.31, 0.99) | Stratified by recruitment center. Adjusted for intervention group, sex, age, leisure time physical activity, smoking status, family history of cancer, education level, history of diabetes, use of aspirin treatment and cumulative average consumption of vegetables, fruits, legumes, cereals, fish, meat, olive oil and nuts, and alcohol. | Agency | 7 |
| Whole-fat dairy products (includes whole-fat milk and whole-fat yogurt): 114 vs 0 g/d | CRC: 1.01 (95% CI: 0.62, 1.64) | ||||||||
| Low-fat dairy products (includes semiskim/skim milk and low-fat yogurt): 495 vs 67 g/d | CRC: 0.62 (95% CI: 0.36, 1,07) | ||||||||
| Total yogurt (low-fat and whole-fat yogurt): 128 vs 8 g/d | CRC: 0.94 (95% CI: 0.56, 1.59) | ||||||||
| Low-fat yogurt: 122 vs 1 g/d | CRC: 1.06 (95% CI: 0.65, 1.73) | ||||||||
| Whole-fat yogurt: 45 vs 0 g/d | CRC: 0.86 (95% CI: 0.51, 1.46) | ||||||||
| Cheese (includes all types of cheese: petit suisse, ricotta, cottage, spreadable, and semicured/cured cheeses): 44 vs 11 g/d | CRC: 1.23 (95% CI: 0.74, 2.06) | ||||||||
| Total milk (semiskim/skim milk and whole milk): 449 vs 117 g/d | CRC: 0.63 (95% CI: 0.36, 1.10) | ||||||||
| Low-fat milk (semiskim and skim milk): 407 vs 15 g/d | CRC: 0.54 (95% CI: 0.32, 0.92) | ||||||||
| Whole milk: 60 vs 0 g/d | CRC: 1.06 (95% CI: 0.64, 1.75) | ||||||||
| Concentrated full-fat dairy products (butter, whipped cream, and all types of cheese): 45 vs 11 g/d | CRC: 1.11 (95% CI: 0.66, 1.86) | ||||||||
| Sugar-enriched dairy products (condensed milk, milkshakes, ice cream, and custard): 14 vs 0 g/d | CRC: 0.98 (95% CI: 0.55, 1.75) | ||||||||
| Fermented dairy products (all types of yogurt and cheeses) 166 vs 36 g/d | CRC: 0.90 (95% CI: 0.53, 1.53) | ||||||||
| Bakken et al., 2018 (32) | Norway: Norwegian Women and Cancer (NOWAC) Cohort Study (median 51) | 81,675 W | 872 CRC (617 CC, 255 R) | 6 | Total milk (whole-fat milk, semiskim milk, extra-semiskim milk, and skim milk from a glass): >240 g/d vs never/seldom | CRC: 0.81 (95% CI: 0.66, 0.98) CC: 0.75 (95% CI: 0.59, 0.95) R: 0.94 (95% CI: 0.67, 1.34) |
Age | No specific grant | 6 |
1CC, colon cancer; CRC, colorectal cancer; DC, distal colon cancer; FH: positive family history of colon cancer; HRT, hormone replacement therapy; M, men; NA, not available; NFH, no family history of colon cancer; NOS, Newcastle-Ottawa Scale; NSAID, nonsteroidal anti-inflammatory drug; PC, proximal colon cancer; PREDIMED, Prevención con Dieta Mediterránea; Q, quartile; R, rectal cancer; ref, reference; T, tertile; W, women.
TABLE 2.
Characteristics of the 14 case-control studies included in the meta-analysis examining the associations between the consumption of dairy products and the risk of CRC1
| Study, year (ref) | Study characteristics (age, y) | No. of cases and endpoint | Sex, no. of cases (M/W) | No. controls and type | Exposure | OR | Adjustments to OR | Funding source | NOS quality score |
|---|---|---|---|---|---|---|---|---|---|
| Lee et al., 1989 (39) | China | 203 CRC (132 CC, 71 R) | 121/82 | 426 H | Total milk (fresh whole milk equivalent, including cheese, condensed and evaporated milk): high vs low intake | CRC: 0.92 (95% CI: 0.60, 1.34)CC: 0.81 (95% CI: 0.49, 1.33)R: 1.12 (95% CI: 0.59, 2.10) | Age, sex, Chinese dialect group, and occupational group | Agency | 6 |
| Centonze et al., 1994 (40) | Italy (34–90) | 119 CRC | 66/53 | 119 C | Dairy products (milk, cheese, and milk products): ≥263 vs 130 g/d | CRC: 0.60 (95% CI: 0.30, 1.18) | Age, sex, level of education, smoking status, and past dietary modification | NA | 6 |
| Milk (fat milk and skim milk): ≥173 vs 6 g/d | CRC: 0.62 (95% CI: 0.23, 1.62) | ||||||||
| Milk products (mozzarella, fior di latte, and fresh curd cheese): ≥70 vs 31 g/d | CRC: 0.91 (95% CI: 0.46, 1.79) | ||||||||
| Cheese (fresh cheese and hard cheese): ≥105 vs 55 g/d | CRC: 0.71 (95% CI: 0.37, 1.37) | ||||||||
| Fresh curd cheese: ≥5 vs 4 g/d | CRC: 1.09 (95% CI: 0.62, 1.94) | ||||||||
| Kampman et al., 1994 (41) | The Netherlands (up to 75 at age of diagnosis) | 232 CC | NA | 259 C | Fermented dairy products (buttermilk, yogurt, curds, and kefir): >242 vs ≤22 g/d | CC: 1.06 (95% CI: 0.61, 1.82) | Age, gender, urbanization level, family history, cholecystectomy, total energy intake, energy-adjusted intake of fat, dietary fiber, vitamin C, and alcohol | Industry | 6 |
| Buttermilk: >113 vs ≤113 g/d | CC: 0.94 (95% CI: 0.59, 1.50) | ||||||||
| Yogurt: >91 g/d vs never | CC: 1.49 (95% CI: 0.89, 2.49) | ||||||||
| Hard cheese: >49 vs ≤19 g/d | CC: 1.18 (95% CI: 0.69, 2.01) | ||||||||
| Unfermented dairy products (whole-fat milk, skim/low-fat milk, custards, evaporated milk, and porridge) | CC: 1.59 (95% CI: 0.89, 2.85) | ||||||||
| Whole milk: >50 g/d vs never | CC: 0.95 (95% CI: 0.54, 1.68) | ||||||||
| Skim/low-fat milk: >185 g/d vs nonusers | CC: 1.15 (95% CI: 0.71, 1.84) | ||||||||
| Boutron et al., 1996 (31) | France (30–75) | 171 CRC | 109/62 | 309 C | Total milk | CRC: 1.20 (95% CI: 0.60, 2.2) | Age, sex, and caloric intake | Agency | 6 |
| Low-fat milk: Q5 vs Q1 | CRC: 1.00 (95% CI: 0.50, 1.90) | ||||||||
| Cheese: Q5 vs Q1 | CRC: 1.20 (95% CI: 0.60, 2.20) | ||||||||
| Cottage cheese: level 3 vs level l | CRC: 1.20 (95% CI: 0.80, 1.90) | ||||||||
| Yogurt: level 3 vs level 1 | CRC: 1.00 (95% CI: 0.60, 1.60) | ||||||||
| Shannon et al., 1996 (42) | USA (30–62) | 424 CC | 238/186 | 414 C | Total dairyM: >3.32 vs 0–1.2 servings/dW: >2.8 vs 0–1.3 servings/d | CC (M): 0.92 (95% CI: 0.49, 1.71)CC (W): 0.40 (95% CI: 0.21, 0.79) | Age at diagnosis and total energy intake | Agency | 6 |
| High-fat dairyM: >1.46 vs 0–0.42 servings/dW: >1.14 vs 0–0.21 servings/d | CC (M): 0.73 (95% CI: 0.41, 1.30)CC (W): 0.92 (95% CI: 0.47, 1.83) | ||||||||
| Low-fat dairyM: >1.42 vs 0–0.14 servings/dW: >1.51 vs 0–0.30 servings/d | CC (M): 1.00 (95% CI: 0.58, 1.71)CC (W): 0.61 (95% CI: 0.34, 1.09) | ||||||||
| YogurtM: >1 vs 0 servings/wkW: >1 vs 0 servings/wk | CC (M): 1.27 (95% CI: 0.69, 2.36)CC (W): 0.65 (95% CI: 0.37, 1.16) | ||||||||
| Boutron-Ruault et al., 1999 (43) | France (30–79) | 171 CRC | 109/62 | 309 C | Milk: Q4 vs Q1 | CRC: 1.0 (95% CI: 0.6, 1.8) | Age and caloric intake, categories established by sex | Agency | 6 |
| Cottage cheese and yogurt: Q4 vs Q1 | CRC: 1.10 (95% CI: 0.60, 1.90) | ||||||||
| Cheese: Q4 vs Q1 | CRC: 0.90 (95% CI: 0.50, 1.50) | ||||||||
| Kampman et al., 2000 (44) | USA (30–79) | 1993 CC | 1095/888 | 2410 C | Total dairyM: 3.5 vs 0.7W: 2.7 vs 0.5 | CC (M): 0.8 (95% CI: 0.6, 1.1)CC (W): 0.7 (95% CI: 0.5, 0.9) | Age, BMI, family history of a first-degree relative with CRC, use of aspirin, use of NSAIDs, energy intake, long-term vigorous physical activity, and dietary fiber intake | Agency | 6 |
| Low-fat dairyM: 2.26 vs 0.04W: 2.06 vs 0.09 | CC (M): 0.8 (95% CI: 0.6, 1.0)CC (W): 0.7 (95% CI: 0.5, 1.0) | ||||||||
| High-fat dairyM: 1.35 vs 0.15W: 0.89 vs 0.11 | CC (M): 1.1 (95% CI: 0.8, 1.5)CC (W): 0.9 (95% CI: 0.6, 1.2) | ||||||||
| CheeseM: 0.52 vs 0.08W: 0.51 vs 0.08 | CC (M): 0.9 (95% CI: 0.7, 1.2)CC (W): 0.8 (95% CI: 0.7, 1.1) | ||||||||
| Yogurt: 0 vs >0 | CC (M): 1.0 (95% CI: 0.8, 1.2)CC (W): 1.1 (95% CI: 0.9, 1.3) | ||||||||
| Satia-Abouta et al., 2004 (45) | USA: North Carolina Colon Cancer Study (NCCCS) (40–80) | 613 CC | 321/292 | 996 C | Dairy productsCaucasian: 21.7 vs 4.2 servings/wkAfrican-American: 14 vs 1.4 servings/wk | CC (Caucasian): 1.0 (95% CI: 0.6, 1.7)CC (African-American): 1.8 (95% CI: 1.0, 3.3) | Stratified by ethnicity. Adjusted for total energy when the total energy met the criteria for covariate inclusion. Other potential confounders examined included age, gender, education, BMI (year prior to diagnosis), smoking history, physical activity, family history of colon cancer, NSAID use, intake of fat, carbohydrates, dietary fiber, vitamin C, vitamin E, β-carotene, calcium, folate, fruits, and vegetables. The set of confounders in the logistic models varied for each food group | Agency | 6 |
| Murtaugh et al., 2006 (28) | USA (30–79) | 1698 CC752 R | CC: 934/764R: 447/305 | 1,861 C (CC) 960 C (R) | Total dairy: low vs high intake | CC (FF): 1.05 (95% CI: 0.78, 1.43)CC (Ff/ff): 0.87 (95% CI: 0.65, 1.17)R (FF): 1.32 (95% CI: 0.83, 2.10)R (Ff/ff): 1.54 (95% CI: 1.00, 2.38) | Race, sex, age, lifetime physical activity, BMI, smoking, and energy, calcium, and fiber intake | Agency | 6 |
| High-fat dairy: low vs high intake | CC (FF): 0.85 (95% CI: 0.66, 1.11)CC (Ff/ff): 0.65 (95% CI: 0.51, 0.82)R (FF): 0.97 (95% CI: 0.65, 1.45)R (Ff/ff): 1.19 (95% CI: 0.83, 1.71) | ||||||||
| Low-fat dairy: low vs high intake | CC (FF): 1.32 (95% CI: 0.98, 1.78)CC (Ff/ff): 0.90 (95% CI: 0.68, 1.19)R (FF): 1.16 (95% CI: 0.75, 1.80)R (Ff/ff): 1.41 (95% CI: 0.94, 2.11) | ||||||||
| Mizoue et al., 2008 (46) | Japan: Fukuoka Colorectal Cancer Study (median of 61) | 836 CRC | 502/334 | 831 C | Total dairy foods: ≥300 vs <50 g/d | CRC: 0.76 (95% CI: 0.48, 1.18) | Residence, sex, age, job, parental history of CRC, smoking, alcohol drinking, BMI, leisure-time physical exercise, and intakes of energy, vegetable, fruit, and red meat | Agency | 6 |
| Milk: ≥200 vs <50 g/d | CRC: 0.60 (95% CI: 0.40, 0.91) | ||||||||
| Dairy foods other than milk: ≥100 vs <10 g/d | CRC: 1.39 (95% CI: 0.95, 2.02) | ||||||||
| Williams et al., 2009 (47) | USA: North Carolina Colon Cancer Study-Phase II (40–79) | Caucasian: 720 R | Caucasian: 418/302 | Caucasian: 800 C | Total dairyCaucasian: 17.4 vs 3.6 servings/wkAfrican-American: 13.3 vs 1.5 servings/wk | Caucasian (R): 0.47 (95% CI: 0.32, 0.69)African-American (R): 1.18 (95% CI: 0.53, 2.62) | Stratified by race. Adjusted for age, sex, education, income, BMI 1 year previous, physical activity, family history, NSAID use, and total energy intake | Agency | 6 |
| African-American: 225 R | African-American: 117/108 | African-American: 159 C | CheeseCaucasian: 5.9 vs 0.6 servings/wkAfrican-American: 4.6 vs 0.2 servings/wk | Caucasian (R): 0.73 (95% CI: 0.50, 1.06)African-American (R): 1.04 (95% CI: 0.44, 2.46) | |||||
| MilkCaucasian: 12.7 vs 1.4 servings/wkAfrican-American: 8.6 vs 0.6 servings/wk | Caucasian (R): 0.66 (95% CI: 0.46, 0.95)African-American (R): 0.90 (95% CI: 0.41, 1.95) | ||||||||
| Yogurt: consumers vs nonconsumers | Caucasian (R): 0.69 (95% CI: 0.53, 0.89)African-American (R): 1.08 (95% CI: 0.62, 1.87) | ||||||||
| Sun et al., 2011 (48) | Canada (20–74) | 1760 CRC (488 from NL and 1272 from ON) | NA | 2481 C (651 from NL and 1830 from ON) | Total dairy products (all foods in dairy categories)NL: 25.9 vs 2.4 servings/wkON: 25.5 vs 3.1 servings/wk | NL (CRC): 0.89 (95% CI: 0.55, 1.45)ON (CRC): 0.78 (95% CI: 0.60,1.00) | Stratified by province. Adjusted for total energy intake, age, sex, BMI, physical activity, first-degree relatives with CRC, polyps, diabetes, reported colon screening procedure, cigarette smoking, alcohol drinking, education attainment, household income, marital status, regular use of NSAID, regular use of multivitamin supplements, reported HRT (females only), and intakes of fruits, vegetables, and red meat | Agency | 7 |
| Milk (nonfat or skim milk, low-fat milk and whole milk)NL: 17 vs 0 servings/wkON: 14.9 vs 0.6 servings/wk | NL (CRC): 0.96 (95% CI: 0.58, 1.57)ON (CRC): 0.78 (95% CI: 0.60, 1.00) | ||||||||
| Nonmilk dairy products (yogurt, cheese, and cream)NL: 11.4 vs 0.3 servings/wkON: 11.5 vs 1.1 servings/wk | NL (CRC): 1.12 (95% CI: 0.67, 1.89)ON (CRC): 0.98 (95% CI: 0.76, 1.26) | ||||||||
| YogurtNL: 5 vs 0 servings/wkON: 3.5 vs 0 servings/wk | NL (CRC): 1.02 (95% CI: 0.75, 1.39)ON (CRC): 0.85 (95% CI: 0.68, 1.07) | ||||||||
| CheeseNL: 7 vs 0 servings/wkON: 10 vs 0.5 servings/wk | NL (CRC): 1.25 (95% CI: 0.76, 2.05)ON (CRC): 0.90 (95% CI: 0.70, 1.14) | ||||||||
| Green et al., 2014 (49) | Australia: Western Australian Bowel Health Study (WABOHS) (40–79) | 854 CRC (281 PC, 260 DC, 313 R) | 526/328 | 948 C | Total milk: ≥2 vs <1 cup/d | CRC: 1.02 (95% CI: 0.71, 1.46)PC: 0.96 (95% CI: 0.57, 1.62)DC: 0.85 (95% CI: 0.49, 1.49)R: 1.24 (95% CI: 0.77, 1.98) | Age group, sex, energy intake from food, alcohol intake, smoking status, use of multivitamins, diabetes, physical activity during the ages of 19–34 y, BMI at age 40 y, socioeconomic status, tea and coffee intake | Agency | 6 |
| Chun et al., 2015 (50) | Korea (20–80) | 150 CRC | 94/56 | 116 C | Milk and dairy products: 5.3 vs <1.1 servings/wk | CRC: 2.42 (95% CI: 1.10, 5.31) | Energy intake, sex, age, household income, education, smoking, alcohol consumption frequency, exercise frequency, dietary fiber and red meat | NA | 6 |
1C, community controls; CC, colon cancer; CRC, colorectal cancer; DC, distal colon; FF, FF FokI genotype; Ff/ff, Ff/ff FokI genotype; H, hospital controls; HRT, hormone replacement therapy; M, men; NA, not available; NL, subjects in Newfoundland and Labrador; NOS, Newcastle-Ottawa Scale; NSAID, nonsteroidal anti-inflammatory drug; ON, subjects in Ontario; PC, proximal colon; Q, quantile; R, rectal cancer; ref, reference; W, women.
Of the cohort studies, 6 were conducted in the United States, 2 in Norway, 3 in Sweden, 1 in China, 1 in Italy, 1 in Spain, and 1 in each of 10 different European countries. The case-control studies were conducted in 9 countries (China, Italy, the Netherlands, France, the United States, Japan, Canada, Australia, and Korea).
All cohort and case-control studies were conducted in adults. Most of the studies obtained funding only from agencies, but 1 study was agency-industry funded, 1 reported industry funding, 3 did not report the funding source, and 1 did not report receiving a specific grant.
High consumption compared with low consumption analyses
Prospective cohort studies
Total dairy products
Eight cohort study comparisons (11, 17–19, 30, 36) were used to assess the association between the highest and the lowest consumption of total dairy products and CRC risk; 910,047 individuals and 8424 cases were included. The summary RR for CRC was 0.80 (95% CI: 0.70, 0.91; I2 = 45%; P-heterogeneity = 0.08) (Figure 2 and Supplemental Figure 1). Significant inverse associations were also observed for colon cancer (summary RR: 0.76; 95% CI: 0.66, 0.87; I2 = 14%; P-heterogeneity = 0.33; n = 7) (Figure 3 and Supplemental Figure 2), proximal colon cancer (summary RR: 0.75; 95% CI: 0.63, 0.89; I2 = 63%; P-heterogeneity = 0.04; n = 4) (Figure 4), distal colon cancer (summary RR: 0.73; 95% CI: 0.62, 0.88; I2 = 10%; P-heterogeneity = 0.34; n = 4) (Figure 4), and rectal cancer (summary RR: 0.83; 95% CI: 0.71, 0.96; I2 = 32%; P-heterogeneity = 0.22; n = 4) (Figure 5).
FIGURE 2.

Summary estimates (RRs for cohort studies and ORs for case-control studies, with the corresponding 95% CIs; log scale) examining the associations between the consumption of dairy products and the risk of CRC. The meta-analysis included prospective cohort and case-control studies analyzing the consumption of total dairy products, high-fat dairy products, low-fat dairy products, total milk, whole milk, low-fat milk, fermented dairy products, total yogurt, cultured milk or cheese. Abbreviations: CI: confidence interval; CRC, colorectal cancer, OR: odds ratio; RR, relative risk.
FIGURE 3.

Summary estimates (RRs for cohort studies and ORs for case-control studies, with the corresponding 95% CIs; log scale) examining the associations between the consumption of dairy products and the risk of colon cancer. The meta-analysis included prospective cohort and case-control studies analyzing the consumption of total dairy products, high-fat dairy products, low-fat dairy products, total milk, whole milk, low-fat milk, fermented dairy products, total yogurt, cultured milk or cheese. Abbreviations: CI: confidence interval, OR: odds ratio; RR, relative risk.
FIGURE 4.

Summary estimates (RRs with 95% CIs; log scale) examining the associations between the consumption of dairy products and the risk of colon cancer by subsite (proximal or distal colon). The meta-analysis included prospective cohort studies analyzing the consumption of total dairy products, high-fat dairy products, low-fat dairy products, total milk, whole milk, low-fat milk, fermented dairy products, total yogurt, cultured milk or cheese. Abbreviations: CI: confidence interval, OR: odds ratio, RR, relative risk.
FIGURE 5.

Summary estimates (RRs for cohort studies and ORs for case-control studies, with the corresponding 95% CIs; log scale) examining the associations between the consumption of dairy products and the risk of rectal cancer. The meta-analyses included prospective cohort and case-control studies analyzing the consumption of total dairy products, high-fat dairy products, low-fat dairy products, total milk, whole milk, low-fat milk, fermented dairy products, total yogurt, cultured milk, or cheese.
High-fat dairy products
Two cohort studies (14, 19), comprising 67,924 participants and 895 cases, were used to analyze the effects of the highest compared with the lowest consumption of high-fat dairy products on CRC risk. The pooled RR was 0.68 (95% CI: 0.53, 0.87), with substantial heterogeneity (I2 = 71%; P-heterogeneity = 0.06) (Figure 2). The summary RR for colon cancer was 0.82 (95% CI: 0.62, 1.08; I2 = 0%; P-heterogeneity = 0.77; n = 3) (Figure 3).
Low-fat dairy products
Two cohort studies, comprising 68,859 participants and 669 cases (11, 19), were used in the meta-analysis of the effects of the highest compared with the lowest consumption of low-fat dairy products on CRC risk. The overall RRs for CRC (summary RR: 0.91; 95% CI: 0.79, 1.06; I2 = 52%; P-heterogeneity = 0.15) (Figure 2) and colon cancer (summary RR: 0.91; 95% CI: 0.72, 1.15; I2 = 0%; P-heterogeneity = 0.68; n = 3) (Figure 3) were not statistically significant.
Total milk
The analysis of the association of the highest compared with the lowest consumption of total milk on CRC risk included 9 cohort study comparisons (1,003,303 individuals and 9118 cases) (17–19, 30, 32, 36, 37). We found evidence of a significant inverse association with the summary RR of CRC (summary RR: 0.82; 95% CI: 0.76, 0.88; I2 = 2%; P-heterogeneity = 0.42) (Figure 2 and Supplemental Figure 3). A significant inverse association with no significant heterogeneity was also observed for colon cancer (summary RR: 0.79; 95% CI: 0.72, 0.87; I2 = 0%; P-heterogeneity = 0.96; n = 8) (Figure 3 and Supplemental Figure 4), proximal colon cancer (summary RR: 0.81; 95% CI: 0.68, 0.96; I2 = 0%; P-heterogeneity = 0.70; n = 3) (Figure 4), distal colon cancer (summary RR: 0.75; 95% CI: 0.63, 0.90; I2 = 25%; P-heterogeneity = 0.26; n = 3) (Figure 4), and rectal cancer (summary RR: 0.84; 95% CI: 0.73, 0.97; I2 = 0%; P-heterogeneity = 0.84; n = 5) (Figure 5).
Whole milk
Three cohort studies (14, 18, 19) were used to compare the effects of the highest and the lowest consumption of whole milk on CRC risk (545,046 individuals and 5198 cases). The pooled risk estimate showed an RR of 0.97 (95% CI: 0.86, 1.09), with moderate heterogeneity among the studies (I2 = 40%; P-heterogeneity = 0.19) (Figure 2). We did not observe a significant inverse association with colon cancer risk in the analysis of the highest compared with the lowest consumption (summary RR: 0.87; 95% CI: 0.72, 1.05; I2 = 0%; P-heterogeneity = 0.35; n = 2) (Figure 3), proximal colon cancer (summary RR: 1.20; 95% CI: 0.96, 1.49; I2 = 83%; P-heterogeneity = 0.02; n = 2) (Figure 4), distal colon cancer (summary RR: 0.78; 95% CI: 0.60, 1.01; I2 = 0%; P-heterogeneity = 0.64; n = 2) (Figure 4), or rectal cancer (summary RR: 0.94; 95% CI: 0.76, 1.16; I2 = 0%; P-heterogeneity = 0.66; n = 2) (Figure 5).
Low-fat milk
The combined RR for CRC for the highest compared with the lowest consumption of low-fat milk (18, 19) was 0.76 (95% CI: 0.66, 0.88; I2 = 42%; P-heterogeneity = 0.19) (Figure 2). The analysis considered 2 cohorts with a total of 484,338 participants and 3507 cases. The overall RR for colon cancer was 0.73 (95% CI: 0.61, 0.87; I2 = 0%; P-heterogeneity = 0.77; n = 2) (Figure 3).
Fermented dairy products
Two cohort studies (11, 19) (68,859 individuals and 669 cases) were included in the meta-analysis of the association between the highest and lowest consumption of fermented dairy products and CRC risk. The summary RR was 0.90 (95% CI: 0.73, 1.11; I2 = 0%; P-heterogeneity = 1.00) (Figure 2). The association for colon cancer was not statistically significant (summary RR: 0.84; 95% CI: 0.66, 1.07; I2 = 43%; P-heterogeneity = 0.18; n = 2) (Figure 3).
Total yogurt
Four cohort studies, with a total of 529,579 and 4899 cases (18, 19, 38), were used to compare the overall risk of CRC between the groups with the highest and lowest consumption of total yogurt. The summary RR was 0.87 (95% CI: 0.79, 0.96; I2 = 57%; P-heterogeneity = 0.07) (Figure 2).
Cultured milk
Two cohort studies (14, 17), with a total of 106,014 participants and 1247 cases, were used to analyze the association between the highest and lowest consumption of cultured milk and CRC risk. The summary RR was 0.92 (95% CI: 0.79, 1.07; I2 = 69%; P-heterogeneity = 0.07) (Figure 2). Similarly, for proximal and distal colon cancer (Figure 4) and rectal cancer (Figure 5), the inverse associations were not significant (the P-values were 0.52 for proximal colon cancer, 0.92 for distal colon cancer, and 0.55 for rectal cancer).
Cheese
Four prospective cohort studies (14, 17–19) (590,352 participants and 5857 cases) were used to analyze the association between the highest and lowest consumption of cheese and CRC risk. The pooled RR was 0.85 (95% CI: 0.76, 0.96), with no significant heterogeneity between the studies (I2 = 27%; P-heterogeneity = 0.25) (Figure 2). However, the inverse relationship was not statistically significant for colon cancer (summary RR: 0.88; 95% CI: 0.77, 1.01; I2 = 44%; P-heterogeneity = 0.15; n = 4) (Figure 3). The RR for proximal colon cancer showed a significant inverse association (summary RR: 0.74; 95% CI: 0.60, 0.91; I2 = 0%; P-heterogeneity = 0.99; n = 3) (Figure 4). The inverse relationships for distal colon cancer (summary RR: 0.86; 95% CI: 0.69, 1.09; I2 = 54%; P-heterogeneity = 0.11; n = 3) (Figure 4) and rectal cancer (summary RR: 0.93; 95% CI: 0.76, 1.13; I2 = 0%; P-heterogeneity = 0.85; n = 3) (Figure 5) were not statistically significant.
Case-control studies
Total dairy products
Five case-control study comparisons were used to assess the associations between the highest and lowest consumption of total dairy products and the risk of CRC (40, 46, 48, 50). The summary OR was 0.87 (95% CI: 0.64, 1.20), with moderate heterogeneity among the studies (I2 = 52%; P-heterogeneity = 0.08) (Figure 2). The pooled OR was 0.84 (95% CI: 0.71, 1.00) for colon cancer (Figure 3) and 0.63 (95% CI: 0.50, 0.80) for rectal cancer (Figure 5), with no significant heterogeneity (P-heterogeneity = 0.11 and 0.15, and n = 8 and 4, respectively) among the studies.
High-fat dairy products
We used 6 case-control study comparisons to analyze the association between colon cancer and the highest and lowest intakes of high-fat dairy products (28, 42, 44). The summary OR for colon cancer was 1.11 (95% CI: 0.90, 1.37), with moderate heterogeneity (I2 = 53%; P-heterogeneity = 0.06) (Figure 3). For rectal cancer, the OR was 0.92 (95% CI: 0.71, 1.20; I2 = 0%; P-heterogeneity = 0.45; n = 2) (Figure 5).
Low-fat dairy products
We used 6 case-control study comparisons to analyze the association between colon cancer and the highest and lowest intakes of low-fat dairy products (28, 42, 44). The summary OR for colon cancer was 0.85 (95% CI: 0.71, 1.02; I2 = 24%; P-heterogeneity = 0.26) (Figure 3). For rectal cancer, the summary OR was 0.78 (95% CI: 0.58, 1.04; I2 = 0%; P-heterogeneity = 0.53; n = 2) (Figure 5).
Total milk
Eight case-control study comparisons (31, 39, 40, 43, 46, 48, 49) were used to analyze the association between the highest and lowest intakes of total milk and CRC risk. We observed a significant inverse association (OR: 0.85; 95% CI: 0.73, 0.99) for CRC, with no important heterogeneity (I2 = 0%; P-heterogeneity = 0.50) (Figure 2). The summary OR for rectal cancer was not statistically significant (OR: 0.88; 95% CI: 0.69, 1.13; I2 = 40%; P-heterogeneity = 0.17; n = 4) (Figure 5).
Total yogurt
In the analysis of the highest compared with the lowest intake of total yogurt, the pooled risk estimate for CRC was not significant (OR: 0.92; 95% CI: 0.77, 1.09; I2 = 0%; P-heterogeneity = 0.60). This analysis included 3 case-control study comparisons (31, 48) (Figure 2). For the analysis of colon cancer risk, the summary OR was 1.06 (95% CI: 0.90, 1.25; I2 = 25%; P-heterogeneity = 0.26; n = 5) (Figure 3). The association for rectal cancer was statistically significant (OR: 0.75; 95% CI: 0.59, 0.95; I2 = 52%; P-heterogeneity = 0.15, n = 2) (Figure 5).
Cheese
The combined OR for CRC in the analysis of the highest compared with the lowest consumption of cheese included 5 case-control study comparisons (31, 40, 43, 48). The pooled OR was 0.95 (95% CI: 0.79, 1.14; I2 = 0%; P-heterogeneity = 0.62) (Figure 2). Similarly, we found no evidence of a significant association between colon cancer risk (OR: 0.87; 95% CI: 0.74, 1.02; I2 = 0%; P-heterogeneity = 0.40; n = 3) (Figure 3) or rectal cancer (OR: 0.77; 95% CI: 0.55, 1.09; I2 = 0%; P-heterogeneity = 0.46; n = 2) and the highest and lowest consumption of cheese (Figure 5).
Dose-response analyses
Total dairy products
The linear RR for CRC per 1 serving increment of total dairy products was 0.92 (95% CI: 0.88, 0.96; P < 0.001) (Supplemental Figure 5). This inverse association was significant for colon cancer (RR: 0.91; 95% CI: 0.88, 0.95; P < 0.001) (Supplemental Figure 6) but not for proximal colon cancer (P = 0.094) (Supplemental Figure 7). The inverse associations for distal colon cancer (RR: 0.88; 95% CI: 0.84, 0.93; P < 0.001) (Supplemental Figure 8) and rectal cancer (RR: 0.94; 95% CI: 0.88, 0.99; P = 0.023) (Supplemental Figure 9) were also significant.
Total milk
The linear RR of CRC per 1 serving increment of total milk was 0.90 (95% CI: 0.86, 0.93; P < 0.001) (Supplemental Figure 10). There was also a significant linear association for colon cancer (RR: 0.88; 95% CI: 0.84, 0.93; P < 0.001) (Supplemental Figure 11) and rectal cancer (RR: 0.91; 95% CI: 0.84, 0.97; P = 0.005) (Supplemental Figure 12).
Total yogurt
The combined linear RR for CRC for an increment of one serving of yogurt was 0.72 (95% CI: 0.47, 1.10; P = 0.128) (Supplemental Figure 13).
Cheese
We detected a significant linear RR for CRC per 1 serving increment of cheese (RR: 0.93; 95% CI: 0.88, 0.98; P = 0.006). The linear RR for colon cancer per 1 serving increment was also significant (RR: 0.91; 95% CI: 0.84, 0.99; P = 0.030) (Supplemental Figures 14 and 15).
Sensitivity analyses
To detect whether the exclusion of a particular study modified the associations observed, we excluded 1 study at a time from the analyses of highest compared with lowest consumption for both the cohort and the case-control studies (Supplemental Tables 2 and 3, respectively). For the cohort studies, after the study by Murphy et al. (18) was removed, the inverse associations between the consumption of total dairy products and the risk of proximal colon, distal colon, and rectal cancer were no longer significant. Likewise, the removal of the same study (18) also decreased the summary RR for proximal colon and rectal cancer for total milk consumption and the pooled RR for CRC for cheese consumption.
In the analysis of total dairy products, the study by Larsson et al. (17) explained most of the observed heterogeneity (I2 = 8%; P-heterogeneity = 0.36). After the study by Terry et al. (11) was excluded, the heterogeneity was reduced (I2 = 44%; P-heterogeneity = 0.17). The study by Pala et al. (38) explained most of the heterogeneity among the studies when the association between the consumption of total yogurt and CRC risk (I2 = 0%; P-heterogeneity = 0.43) was assessed.
For the case-control studies, the heterogeneity in the association between the consumption of total dairy products and CRC risk was no longer significant after the study by Chun et al. (50) was removed (I2 = 0%; P-heterogeneity = 0.84). The case-control study conducted by Murtaugh et al. (28) accounted for most of the heterogeneity in the analysis of high-fat dairy products and colon cancer risk (I2 = 0%; P-heterogeneity = 0.52).
Discussion
In this meta-analysis of 29 prospective cohort and case-control studies including >22,000 CRC cases, prospective cohort studies showed an association between a higher consumption of total dairy products and total milk and a consistently and significantly decreased risk of CRC across all CRC subsites. High low-fat milk and cheese consumption was also associated with a decreased risk of CRC. However, this inverse association for low-fat milk was restricted to colon cancer, whereas after stratification by CRC subsite, cheese had a significant association only with proximal colon cancer. Although the high consumption of high-fat dairy products and total yogurt showed a significant inverse association with CRC risk, there was substantial heterogeneity among the few studies that had been conducted. Therefore, these observations should be interpreted cautiously. No significant associations were found between CRC risk and the consumption of low-fat dairy products, whole milk, fermented dairy products, or cultured milk. Most of the associations found were not supported by the case-control studies. This discrepancy may be largely explained by the differences in study design between cohort and case-control studies, differences in categorizing the frequency of dairy product consumption and the amounts of dairy products consumed, and differences in the covariates considered as potential confounders in the statistical models.
Our results are in line with those of a pooled analysis of 10 cohort studies (51) and previous meta-analyses of case-control and cohort studies (52, 53). Likewise, systematic reviews and meta-analyses of prospective studies (54–57) showed a reduced risk of CRC associated with the consumption of total dairy products, milk, or a combination. Our findings are also in accordance with the conclusion of the latest WCRF/AICR report (3).
In our meta-analysis, the consumption of total dairy products and milk was associated with a significant decrease in the risk of both colon and rectal cancers, although these inverse associations were slightly higher for colon cancer. In contrast, most systematic reviews and meta-analyses have shown that the inverse associations between CRC risk and the consumption of milk and total dairy products (54–57) are mainly restricted to colon cancer. To our knowledge, no previous systematic reviews or meta-analyses have assessed the link between CRC risk and the consumption of low-fat and whole milk. Furthermore, the associations between the consumption of dairy products with different fat contents and CRC risk were not documented in the latest report by the CUP panel (3). On the one hand, we found that the consumption of low-fat milk is associated with a 24% and 27% reduction in the risk of colorectal and colon cancer, respectively, with no significant heterogeneity among the studies. On the other hand, we did not observe a significant association between whole-milk consumption and CRC risk. These results are, therefore, of great importance, because despite the lack of scientific evidence, most dietary recommendations encourage the consumption of low-fat dairy products.
We found that cheese consumption may decrease the risk of CRC, particularly proximal colon cancer. These results are consistent with the conclusions of the latest CUP report (3). We also augmented the current evidence for these associations by our finding of a linear relationship between cheese consumption and CRC. Ralston et al. (55) found no evidence of a significant inverse relationship between solid cheese consumption and CRC. These discrepancies could be explained by the inclusion of 2 large cohort studies assessing cheese consumption, and because CRC risk was included in our study but not in Ralston's systematic review and meta-analysis (18, 19).
The protective association we found between yogurt consumption and CRC risk is inconsistent with other evidence (54, 55). As previously mentioned, this result should be taken with caution since there was substantial heterogeneity among the studies analyzed. Similarly, the inverse association between high-fat dairy products and CRC risk showed substantial heterogeneity, and the summary risk estimate included only 2 studies (14, 19).
The mechanisms involved in the possible decrease in CRC risk are unclear. The most-studied chemopreventive agent in dairy products is calcium, because dairy products are one of the main contributors of calcium in the diet. According to the hypothesis of Newmark et al. (58), fatty acids and bile acids in the colon may play an important role in the initial steps of colorectal carcinogenesis. Calcium might protect against CRC by the colonic sequestration of secondary bile acids such as deoxycholic acid and phospholipids. These components have been shown to promote colorectal tumors in animal models, probably by regulating protein kinase C (59, 60). On the other hand, calcium could lead to differentiation in normal cells and apoptosis in transformed cells (61, 62). Conjugated linoleic acid, which is naturally present in dairy products, might also have a protective effect against CRC by inhibiting cell proliferation, modifying the fluidity of cell membranes, decreasing the production of inflammatory mediators, and stimulating the immune response (63–66). Other components, such as butyric acid (62, 67), lactoferrin (68), and vitamin D (52, 69), in fortified dairy foods might also have protective effects.
Our systematic review and meta-analysis has several strengths: 1) we identified prospective cohort and case-control studies through a systematic search; 2) we used a quantitative NOS scale to exclude low-quality studies; and 3) all of the studies in our analysis used a validated food-frequency questionnaire to assess dairy product consumption.
Despite the high quality of the studies we analyzed, we also acknowledge some limitations, such as potential residual confounding because of the observational nature of the studies included or the possibility that not all the studies were adjusted for important dietary variables. Moreover, some of the dietary assessments were self-reported, which may affect the reliability of the reported intakes. However, the use of validated food-frequency questionnaires could reduce this bias. Although some heterogeneity among studies was observed, this heterogeneity was explained by the removal of individual studies. For studies reporting both skim and semiskim milk and different types of cheese separately, we considered only the values for skim milk and hard cheese, so the risk estimates might be somewhat overestimated. Since we were not able to search all available databases, we cannot ignore the possibility that some references may have been missed. Finally, given the observational nature of the present meta-analysis, our results cannot support causal relationships between dairy product consumption and CRC risk.
Conclusions
Our systematic review and meta-analysis of observational studies shows a consistent inverse association between higher consumption of dairy products and total milk and the risk of CRC at all sites. Low-fat milk consumption was associated with a decreased risk of CRC, although this inverse association was restricted to the colon. This systematic review and meta-analysis is the first to evaluate the association between subtypes of milk and CRC risk. An inverse association between cheese consumption and the risk of CRC, particularly proximal colon cancer, was also found. No harmful effects associated with the consumption of any type of dairy product, including whole-fat dairy products, were observed. Therefore, it seems reasonable to claim that the consumption of dairy foods, especially low-fat milk and cheese, might be related to a lower risk of CRC. Further prospective studies with large samples and long follow-up periods, as well as clinical trials that take into account the long latency period of CRC, known difficulties with dietary compliance, and other complexities such as the high economic cost, are needed to clarify the associations between CRC, including the differences in CRC risk across subsites, and the fat and sugar contents of dairy products.
Supplementary Material
Acknowledgments
LB, NB, NB-T, NR-E and JS-S had full access to all of the data in the study and take responsibility for the integrity of the data and the accuracy of the data analysis and drafted the manuscript; NB ans JS-S: study concept and design; LB: statistical analyses; LB, NB, NB-T, NR-E and JS-S: critically revised the manuscript for important intellectual content and read and approved the final manuscript.
Notes
This supplement was sponsored by the Interprofessional Dairy Organization (INLAC), Spain.
The sponsor had no role in the design of the studies included in the supplement; in the collection, analyses, or interpretation of the data; in the writing of the manuscripts; or in the decision to publish the results. Publication costs for this supplement were defrayed in part by the payment of page charges. The opinions expressed in this publication are those of the authors and are not attributable to the sponsors or the publisher, Editor, or Editorial Board of Advances in Nutrition.
Centro de Investigación Biomédica en Red Fisiopatología de la Obesidad y Nutrición (CIBEROBN) is an initiative of the Instituto de Salud Carlos III (ISCIII) of Spain, which is financed by the European Regional Development Fund (ERDF) (CB06/03). LB has received grants from the Spanish Ministry of Education, Culture and Sports (FPU 16/00165). None of the funding sources played a role in the study design; in the collection, analysis or interpretation of the data; or in the decision to submit the manuscript for publication. The costs of publication and English revision were sponsored by INLAC Spain.
Author disclosures: NB declares that she received payments from Danone SA for the purposes of scientific and technical consulting but not for preparing this study. In addition, she is one of the members of the Scientific Advisory Board of the EU program for the promotion of milk and milk products within the framework of appropriate dietary practices. JS-S declares that he is a member of Danone SA's Advisory Board and a member of the Danone Institute and that he received payments from Danone SA for the purposes of scientific and technical consulting but not for preparing this study. The other authors declare that they have no conflicts of interest.
Supplemental Data, Supplemental Tables 1–3, and Supplemental Figures 1–15 are available from the “Supplementary data” link in the online posting of the article and from the same link in the online table of contents at https://academic.oup.com/advances/.
References
- 1. Fitzmaurice C, Akinyemiju TF, Al Lami FH, Alam T, Alizadeh-Navaei R, Allen C, Alsharif U, Alvis-Guzman N, Amini E, Anderson BO et al.. Global, regional, and national cancer incidence, mortality, years of life lost, years lived with disability, and disability-adjusted life-years for 29 cancer groups, 1990 to 2016. JAMA Oncol. 2018;4(11):1553–68. [DOI] [PMC free article] [PubMed] [Google Scholar]
- 2. Arnold M, Sierra MS, Laversanne M, Soerjomataram I, Jemal A, Bray F. Global patterns and trends in colorectal cancer incidence and mortality. Gut. 2017;66:683–91. [DOI] [PubMed] [Google Scholar]
- 3. World Cancer Research Fund/American Institute for Cancer Research. Diet, nutrition, physical activity and cancer: a global perspective. Continuous Update Project Expert Report. 2018. [Google Scholar]
- 4. Schwingshackl L, Hoffmann G. Adherence to Mediterranean diet and risk of cancer: an updated systematic review and meta-analysis of observational studies. Cancer Med. 2015;4:1933–47. [DOI] [PMC free article] [PubMed] [Google Scholar]
- 5. Feng Y-L, Shu L, Zheng P-F, Zhang X-Y, Si C-J, Yu X-L, Gao W, Zhang L. Dietary patterns and colorectal cancer risk. Eur J Cancer Prev. 2017;26:201–11. [DOI] [PubMed] [Google Scholar]
- 6. Bostick RM, Potter JD, Sellers TA, McKenzie DR, Kushi LH, Folsom AR. Relation of calcium, vitamin D, and dairy food intake to incidence of colon cancer among older women. The Iowa Women's Health Study. Am J Epidemiol. 1993;137:1302–17. [DOI] [PubMed] [Google Scholar]
- 7. Kampman E, Goldbohm RA, Brandt PA Van Den, Van P. Fermented dairy products, calcium, and colorectal cancer in the Netherlands Cohort Study. Cancer Res. 1994;54(12):3186–90. [PubMed] [Google Scholar]
- 8. Kearney J, Giovannucci E, Rimm EB, Ascherio A, Stampfer MJ, Colditz GA, Wing A, Kampman E, Willett WC. Calcium, vitamin D, and dairy foods and the occurrence of colon cancer in men. Am J Epidemiol. 1996;143:907–17. [DOI] [PubMed] [Google Scholar]
- 9. Pietinen P, Malila N, Virtanen M, Hartman TJ, Tangrea JA, Albanes D, Virtamo J. Diet and risk of colorectal cancer in a cohort of Finnish men. Cancer Causes Control. 1999;10:387–96. [DOI] [PubMed] [Google Scholar]
- 10. Järvinen R, Knekt P, Hakulinen T, Aromaa A. Prospective study on milk products, calcium and cancers of the colon and rectum. Eur J Clin Nutr. 2001;55:1000–7. [DOI] [PubMed] [Google Scholar]
- 11. Terry P, Baron JA, Bergkvist L, Holmberg L, Wolk A. Dietary calcium and vitamin D intake and risk of colorectal cancer: a prospective cohort study in women. Nutr Cancer. 2002;43:39–46. [DOI] [PubMed] [Google Scholar]
- 12. Lin J, Zhang SM, Cook NR, Lee I-M, Buring JE. Dietary fat and fatty acids and risk of colorectal cancer in women. Am J Epidemiol. 2004;160:1011–22. [DOI] [PubMed] [Google Scholar]
- 13. Sanjoaquin MA, Appleby PN, Thorogood M, Mann JI, Key TJ. Nutrition, lifestyle and colorectal cancer incidence: a prospective investigation of 10 998 vegetarians and non-vegetarians in the United Kingdom. Br J Cancer. 2004;90:118–21. [DOI] [PMC free article] [PubMed] [Google Scholar]
- 14. Larsson SC, Bergkvist L, Wolk A. High-fat dairy food and conjugated linoleic acid intakes in relation to colorectal cancer incidence in the Swedish Mammography Cohort. Am J Clin Nutr. 2005;82:894–900. [DOI] [PubMed] [Google Scholar]
- 15. Lin J, Zhang SM, Cook NR, Manson JE, Lee I-M, Buring JE. Intakes of calcium and vitamin D and risk of colorectal cancer in women. Am J Epidemiol. 2005;161:755–64. [DOI] [PubMed] [Google Scholar]
- 16. Kesse E, Boutron-Ruault MC, Norat T, Riboli E, Clavel-Chapelon F. Dietary calcium, phosphorus, vitamin D, dairy products and the risk of colorectal adenoma and cancer among French women of the E3N-EPIC prospective study. Int J Cancer. 2005;117:137–44. [DOI] [PubMed] [Google Scholar]
- 17. Larsson SC, Bergkvist L, Rutegård J, Giovannucci E, Wolk A. Calcium and dairy food intakes are inversely associated with colorectal cancer risk in the Cohort of Swedish Men. Am J Clin Nutr. 2006;83:667–73. [DOI] [PubMed] [Google Scholar]
- 18. Murphy N, Norat T, Ferrari P, Jenab M, Bueno-de-Mesquita B, Skeie G, Olsen A, Tjønneland A, Dahm CC, Overvad K et al.. Consumption of dairy products and colorectal cancer in the European Prospective Investigation into Cancer and Nutrition (EPIC). PLoS One. 2013;8:e72715. [DOI] [PMC free article] [PubMed] [Google Scholar]
- 19. Barrubés L, Babio N, Mena-Sánchez G, Toledo E, Ramírez-Sabio JB, Estruch R, Ros E, Fitó M, Arós F, Fiol M et al.. Dairy product consumption and risk of colorectal cancer in an older Mediterranean population at high cardiovascular risk. Int J Cancer. 2018;143(6):1356–66. [DOI] [PubMed] [Google Scholar]
- 20. Eckel RH, Jakicic JM, Ard JD, Hubbard VS, de Jesus JM, Lee IM, Lichtenstein AH, Loria CM, Millen BE, Houston Miller NAmerican College of Cardiology American/Heart Association Task Force on Practice Guidelines et al.. American College of Cardiology American/Heart Association Task Force on Practice Guidelines. 2013 AHA/ACC guideline on lifestyle management to reduce cardiovascular risk: a report of the American College of Cardiology American/Heart Association Task Force on Practice Guidelines. Circulation. 2014;129(25 Suppl 2):S76–99. [DOI] [PubMed] [Google Scholar]
- 21. National Health and Medical Research Council. Australian Dietary Guidelines. Canberra: National Health and Medical Research Council; 2013. [Google Scholar]
- 22. US Department of Health and Human Services and US Department of Agriculture. 2015–2020 Dietary Guidelines for Americans. [Internet]. 8th ed 2015. Available from: http://health.gov/dietaryguidelines/2015/guidelines/. [Google Scholar]
- 23. Aranceta Bartrina J, Arija Val V, Maíz Aldalur E, Martínez de la Victoria Muñoz E, Ortega Anta RM, Pérez-Rodrigo C, Quiles Izquierdo J, Rodríguez Martín A, Román Viñas B, Salvador i Castell G, et al.. Guías alimentarias para la población española (SENC, 2016); la nueva pirámide de la alimentación saludable. Nutr Hosp. 2016;33:1–48. [Google Scholar]
- 24. Higgins JPT, Green S, Cochrane Handbook for Systematic Reviews of Interventions. Version 5.1.0. [Internet]. Oxford: Cochrane Collaboration; 2011. Available from: www.handbook.cochrane.org. [Google Scholar]
- 25. Stroup DF, Berlin JA, Morton SC, Olkin I, Williamson GD, Rennie D, Moher D, Becker BJ, Sipe TA, Thacker SB. Meta-analysis of observational studies in epidemiology: a proposal for reporting. JAMA. 2000;283(15):2008–12. [DOI] [PubMed] [Google Scholar]
- 26. Moher D, Liberati A, Tetzlaff J, Altman DG; PRISMA Group. Preferred reporting items for systematic reviews and meta-analyses: the PRISMA Statement. PLoS Med. 2009;6:e1000097. [DOI] [PMC free article] [PubMed] [Google Scholar]
- 27. Wells G, Shea B, O'Connel D. The Newcastle-Ottawa Scale (NOS) for assessing the quality of nonrandomised studies in meta-analyses. Ottawa Hospital Research Institute; 2014. [Google Scholar]
- 28. Murtaugh MA, Sweeney C, Ma K-N, Potter JD, Caan BJ, Wolff RK, Slattery ML. Vitamin D receptor gene polymorphisms, dietary promotion of insulin resistance, and colon and rectal cancer. Nutr Cancer. 2006;55:35–43. [DOI] [PubMed] [Google Scholar]
- 29. Bekkering GE, Harris RJ, Thomas S, Mayer A-MB, Beynon R, Ness AR, Harbord RM, Bain C, Smith GD, Sterne JAC. How much of the data published in observational studies of the association between diet and prostate or bladder cancer is usable for meta-analysis?. Am J Epidemiol. 2008;167:1017–26. [DOI] [PubMed] [Google Scholar]
- 30. Park S-Y, Murphy SP, Wilkens LR, Nomura AMY, Henderson BE, Kolonel LN. Calcium and vitamin D intake and risk of colorectal cancer: the Multiethnic Cohort Study. Am J Epidemiol. 2007;165:784–93. [DOI] [PubMed] [Google Scholar]
- 31. Boutron MC, Faivre J, Marteau P, Couillault C, Senesse P, Quipourt V. Calcium, phosphorus, vitamin D, dairy products and colorectal carcinogenesis: a French case-control study. Br J Cancer. 1996;74:145–51. [DOI] [PMC free article] [PubMed] [Google Scholar]
- 32. Bakken T, Braaten T, Olsen A, Hjartåker A, Lund E, Skeie G. Milk and risk of colorectal, colon and rectal cancer in the Norwegian Women and Cancer (NOWAC) Cohort Study. Br J Nutr. 2018;119:1274–85. [DOI] [PubMed] [Google Scholar]
- 33. Gaard M, Tretli S, Løken EB. Dietary factors and risk of colon cancer: a prospective study of 50,535 young Norwegian men and women. Eur J Cancer Prev. 1996;5:445–54. [PubMed] [Google Scholar]
- 34. Singh PN, Fraser GE. Dietary risk factors for colon cancer in a low-risk population. Am J Epidemiol. 1998;148:761–74. [DOI] [PubMed] [Google Scholar]
- 35. Sellers TA, Bazyk AE, Bostick RM, Kushi LH, Olson JE, Anderson KE, Lazovich D, Folsom AR. Diet and risk of colon cancer in a large prospective study of older women: an analysis stratified on family history (Iowa, United States). Cancer Causes Control. 1998;9:357–67. [DOI] [PubMed] [Google Scholar]
- 36. McCullough ML, Robertson AS, Rodriguez C, Jacobs EJ, Chao A, Carolyn J, Calle EE, Willett WC, Thun MJ. Calcium, vitamin D, dairy products, and risk of colorectal cancer in the Cancer Prevention Study II Nutrition Cohort (United States). Cancer Causes Control. 2003;14:1–12. [DOI] [PubMed] [Google Scholar]
- 37. Lee S-A, Shu XO, Yang G, Li H, Gao Y-T, Zheng W. Animal origin foods and colorectal cancer risk: a report from the Shanghai Women's Health Study. Nutr Cancer. 2009;61:194–205. [DOI] [PMC free article] [PubMed] [Google Scholar]
- 38. Pala V, Sieri S, Berrino F, Vineis P, Sacerdote C, Palli D, Masala G, Panico S, Mattiello A, Tumino R et al.. Yogurt consumption and risk of colorectal cancer in the Italian European prospective investigation into cancer and nutrition cohort. Int J Cancer. 2011;129:2712–9. [DOI] [PubMed] [Google Scholar]
- 39. Lee HP, Gourley L, Duffy SW, Estève J, Lee J, Day NE. Colorectal cancer and diet in an Asian population—a case-control study among Singapore Chinese. Int J Cancer. 1989;43:1007–16. [DOI] [PubMed] [Google Scholar]
- 40. Centonze S, Boeing H, Leoci C, Guerra V, Misciagna G. Dietary habits and colorectal cancer in a low‐risk area. Results from a population‐based case‐control study in southern Italy. Nutr Cancer. 1994;21:233–46. [DOI] [PubMed] [Google Scholar]
- 41. Kampman E, van ’t Veer P, Hiddink GJ, van Aken-Schneijder P, Kok FJ, Hermus RJ. Fermented dairy products, dietary calcium and colon cancer: a case-control study in the Netherlands. Int J Cancer. 1994;59:170–6. [DOI] [PubMed] [Google Scholar]
- 42. Shannon J, White E, Shattuck AL, Potter JD. Relationship of food groups and water intake to colon cancer risk. Cancer Epidemiol Biomarkers Prev. 1996;5:495–502. [PubMed] [Google Scholar]
- 43. Boutron-Ruault MC, Senesse P, Faivre J, Chatelain N, Belghiti C, Méance S. Foods as risk factors for colorectal cancer: a case-control study in Burgundy (France). Eur J Cancer Prev. 1999;8:229–35. [DOI] [PubMed] [Google Scholar]
- 44. Kampman E, Slattery ML, Caan B, Potter JD. Calcium, vitamin D, sunshine exposure, dairy products and colon cancer risk (United States). Cancer Causes Control. 2000;11:459–66. [DOI] [PubMed] [Google Scholar]
- 45. Satia-Abouta J, Galanko JA, Martin CF, Ammerman A, Sandler RS. Food groups and colon cancer risk in African-Americans and Caucasians. Int J Cancer. 2004;109:728–36. [DOI] [PubMed] [Google Scholar]
- 46. Mizoue T, Kimura Y, Toyomura K, Nagano J, Kono S, Mibu R, Tanaka M, Kakeji Y, Maehara Y, Okamura T et al.. Calcium, dairy foods, vitamin D, and colorectal cancer risk: the Fukuoka Colorectal Cancer Study. Cancer Epidemiol Biomarkers Prev. 2008;17:2800–7. [DOI] [PubMed] [Google Scholar]
- 47. Williams CD, Satia JA, Adair LS, Stevens J, Galanko J, Keku TO, Sandler RS. Dietary patterns, food groups, and rectal cancer risk in whites and African-Americans. Cancer Epidemiol Biomarkers Prev. 2009;18:1552–61. [DOI] [PMC free article] [PubMed] [Google Scholar]
- 48. Sun Z, Wang PP, Roebothan B, Cotterchio M, Green R, Buehler S, Zhao J, Squires J, Zhao J, Zhu Y et al.. Calcium and vitamin D and risk of colorectal cancer: results from a large population-based case-control study in Newfoundland and Labrador and Ontario. Can J Public Heal. 2011;102:382–9. [DOI] [PMC free article] [PubMed] [Google Scholar]
- 49. Green CJ, de Dauwe P, Boyle T, Tabatabaei SM, Fritschi L, Heyworth JS. Tea, coffee, and milk consumption and colorectal cancer risk. J Epidemiol. 2014;24:146–53. [DOI] [PMC free article] [PubMed] [Google Scholar]
- 50. Chun YJ, Sohn S-K, Song HK, Lee SM, Youn YH, Lee S, Park H. Associations of colorectal cancer incidence with nutrient and food group intakes in Korean adults: a case-control study. Clin Nutr Res. 2015;4:110. [DOI] [PMC free article] [PubMed] [Google Scholar]
- 51. Cho E, Smith-Warner SA, Spiegelman D, Beeson WL, van den Brandt PA, Colditz GA, Folsom AR, Fraser GE, Freudenheim JL, Giovannucci E et al.. Dairy foods, calcium, and colorectal cancer: a pooled analysis of 10 cohort studies. J Natl Cancer Inst. 2004;96:1015–22. [DOI] [PubMed] [Google Scholar]
- 52. Norat T, Riboli E. Dairy products and colorectal cancer. A review of possible mechanisms and epidemiological evidence. Eur J Clin Nutr. 2003;57:1–17. [DOI] [PubMed] [Google Scholar]
- 53. Huncharek M, Muscat J, Kupelnick B. Colorectal cancer risk and dietary intake of calcium, vitamin D, and dairy products: a meta-analysis of 26,335 cases from 60 observational studies. Nutr Cancer. 2009;61:47–69. [DOI] [PubMed] [Google Scholar]
- 54. Aune D, Lau R, Chan DSM, Vieira R, Greenwood DC, Kampman E, Norat T. Dairy products and colorectal cancer risk: a systematic review and meta-analysis of cohort studies. Ann Oncol. 2012;23:37–45. [DOI] [PubMed] [Google Scholar]
- 55. Ralston RA, Truby H, Palermo CE, Walker KZ. Colorectal cancer and nonfermented milk, solid cheese, and fermented milk consumption: a systematic review and meta-analysis of prospective studies. Crit Rev Food Sci Nutr. 2014;54:1167–79. [DOI] [PubMed] [Google Scholar]
- 56. Vieira AR, Abar L, Chan D, Vingeliene S, Polemiti E, Stevens C, Greenwood D, Norat T. Foods and beverages and colorectal cancer risk: a systematic review and meta-analysis of cohort studies, an update of the evidence of the WCRF-AICR Continuous Update Project. Ann Oncol Off J Eur Soc Med Oncol. 2017;28(08):1788–802. [DOI] [PubMed] [Google Scholar]
- 57. Schwingshackl L, Schwedhelm C, Hoffmann G, Knüppel S, Laure Preterre A, Iqbal K, Bechthold A, De Henauw S, Michels N, Devleesschauwer B et al.. Food groups and risk of colorectal cancer. Int J Cancer. 2018;142:1748–58. [DOI] [PubMed] [Google Scholar]
- 58. Newmark HL, Wargovich MJ, Bruce WR. Colon cancer and dietary fat, phosphate, and calcium: a hypothesis. J Natl Cancer Inst. 1984;72:1323–5. [PubMed] [Google Scholar]
- 59. Govers MJ, Termont DS, Lapré JA, Kleibeuker JH, Vonk RJ, Van der Meer R. Calcium in milk products precipitates intestinal fatty acids and secondary bile acids and thus inhibits colonic cytotoxicity in humans. Cancer Res. 1996;56:3270–5. [PubMed] [Google Scholar]
- 60. Holt PR, Moss SF, Whelan R, Guss J, Gilman J, Lipkin M. Fecal and rectal mucosal diacylglycerol concentrations and epithelial proliferative kinetics. Cancer Epidemiol Biomarkers Prev. 1996;5:937–40. [PubMed] [Google Scholar]
- 61. Lamprecht SA, Lipkin M. Cellular mechanisms of calcium and vitamin D in the inhibition of colorectal carcinogenesis. Ann N Y Acad Sci. 2001;952:73–87. [DOI] [PubMed] [Google Scholar]
- 62. Pufulete M. Intake of dairy products and risk of colorectal neoplasia. Nutr Res Rev. 2008;21:56–67. [DOI] [PubMed] [Google Scholar]
- 63. Parodi PW. Cows’ milk fat components as potential anticarcinogenic agents. J Nutr. 1997;127:1055–60. [DOI] [PubMed] [Google Scholar]
- 64. Kritchevsky D. Antimutagenic and some other effects of conjugated linoleic acid. Br J Nutr. 2000;83:459–65. [PubMed] [Google Scholar]
- 65. Bassaganya-Riera J, Hontecillas R, Beitz DC. Colonic anti-inflammatory mechanisms of conjugated linoleic acid. Clin Nutr. 2002;21:451–9. [DOI] [PubMed] [Google Scholar]
- 66. Bassaganya-Riera J, Hontecillas R, Horne WT, Sandridge M, Herfarth HH, Bloomfeld R, Isaacs KL. Conjugated linoleic acid modulates immune responses in patients with mild to moderately active Crohn's disease. Clin Nutr. 2012;31:721–7. [DOI] [PubMed] [Google Scholar]
- 67. Williams L, Williams EA, Coxhead JM, Mathers JC. Anti-cancer effects of butyrate: use of micro-array technology to investigate mechanisms. Proc Nutr Soc. 2017;62:107–15. [DOI] [PubMed] [Google Scholar]
- 68. Tsuda H, Kozu T, Iinuma G, Ohashi Y, Saito Y, Saito D, Akasu T, Alexander DB, Futakuchi M, Fukamachi K et al.. Cancer prevention by bovine lactoferrin: from animal studies to human trial. BioMetals. 2010;23:399–409. [DOI] [PubMed] [Google Scholar]
- 69. Garland CF, Gorham ED. Dose-response of serum 25-hydroxyvitamin D in association with risk of colorectal cancer: a meta-analysis. J Steroid Biochem Mol Biol. 2017;168:1–8. [DOI] [PubMed] [Google Scholar]
Associated Data
This section collects any data citations, data availability statements, or supplementary materials included in this article.