Abstract
We demonstrate the first microfluidic-based on-chip liquefaction device for human sputum samples. Our device is based on an acoustofluidic micromixer using oscillating sharp edges. This acoustofluidic sputum liquefier can effectively and uniformly liquefy sputum samples at a throughput of 30 μL min−1. Cell viability and integrity are maintained during the sputum liquefaction process. Our acoustofluidic sputum liquefier can be conveniently integrated with other microfluidic units to enable automated on-chip sputum processing and analysis.
Introduction
Effective processing and analysis of sputum samples are critical to the development of diagnostic platforms and personalized treatment approaches for pulmonary diseases, ranging from asthma1,2 to tuberculosis (TB).3,4 The current sputum processing and analysis techniques involve labor-intensive procedures that are typically performed only at specialized research and clinical centers. Given the complexity of sputum processing and analysis protocols, appropriate training and quality control are required of the staff that perform the tests. The need for highly trained personnel, however, limits the widespread utilization of the current sputum processing and analysis approaches for the care of patients with pulmonary diseases. Furthermore, since the processing and analysis of induced sputum samples is operator-dependent, the possibility of error or inter-operator variability can potentially confound the results. Moreover, all human specimens, even from healthy individuals, may be infectious. Conventional sputum processing and analysis assays also have biosafety concerns because in these approaches, sputum samples need to be handled manually by the operator and run through several instruments. Therefore, there is a pressing need for a new approach that can liquefy and analyze sputum in a closed liquid environment within a single device in an automated manner. This type of approach will not only enable biohazard containment but will also promote standardization and reproducibility of liquefaction relative to the traditional, operator-dependent method.
Microfluidics is ideally suited to the development of a next-generation sputum liquefaction and analysis platform. Microfluidic-based approaches5–16 are advantageous for this application due to their automation, biohazard containment, fast reactions, reduced reagent consumption, and low cost of manufacture. Thus far, microfluidic-based approaches for sputum analysis have been developed;17–21 however, microfluidic-based sputum liquefaction has not yet been reported. Developing a microfluidic-based sputum liquefier is challenging because human sputum samples are highly viscous and the Reynolds number in a microfluidic sputum liquefier is extremely low.
In this work, we demonstrate for the first time, to the best of our knowledge, the microfluidic liquefaction of human sputum samples. Our approach is built upon an acoustofluidic (i.e., the fusion of acoustics and microfluidics22–33) micromixer that we developed previously.34,35 This acoustofluidic micromixer realizes rapid, homogeneous mixing of two fluids by exploiting the acoustic streaming effects36–38 induced by oscillating sharp-edges inside a microfluidic channel (Video S1†).34,35 Using this approach, we were able to consistently liquefy human sputum samples without compromising cell viability or sample integrity. Furthermore, as the viscosity of clinical sputum samples can vary between patients with different levels of disease activity, our device’s ability to liquefy sputum samples with a wide range of viscosities is valuable. The controllability and tunability of our acoustofluidic sputum liquefier enables us to liquefy sputum samples of a wide range of viscosities by adjusting the voltage applied to a piezoelectric transducer. Our acoustofluidic device features advantages such as simplicity of use, automation, low cost and flexibility; these advantages are ideal for the future development of an automated, all-in-one, on-chip sputum processing and analysis device.
Standard liquefaction procedure
The standard procedure for the liquefaction of sputum39 is comprised of two steps. First, the sputum sample is uniformly mixed with an equal volume of 0.1% dithiotreitol (DTT) (Sputolysin® reagent, Cat# 560000, EMD Millipore, Billerica, MA, USA) using a vortex mixer for 30 seconds and incubated at room temperature for 15 minutes. Second, the sample is filtered through a sterile cell strainer with a 100 μm mesh size (Cat# 22363549, Fisher Scientific Inc., USA) to isolate a uniform single-cell suspension. Lastly, the liquefied sputum sample is then centrifuged at 1500 rpm for 5 minutes, and the pelleted cells are re-suspended in PBS (Cat# 10010–049, Life Technologies, NY, USA) or medium such as RPMI 1640 (Cat# 11875–093, Life Technologies, NY, USA), for further analysis.
Working concept
Fig. 1a illustrates the working concept of our acoustofluidic sputum liquefier. Samples of sputum and an equal volume of DTT solution were co-injected into the acoustofluidic device where they mixed uniformly in the presence of an acoustic field. The yield is equivalent to a standard sputum-liquefaction procedure using a vortex mixer. As an example of mixing two different solutions, Fig. 1b shows an unmixed laminar flow of two different solutions (DI water and fluorescein) when a piezoelectric transducer (PZT) was inactive, whereas Fig. 1c shows uniform mixing of the two solutions when the PZT was active. Mixing performance of the two solutions at different regions in the channel can be found in Fig. S1 (ESI†).
Fig. 1.
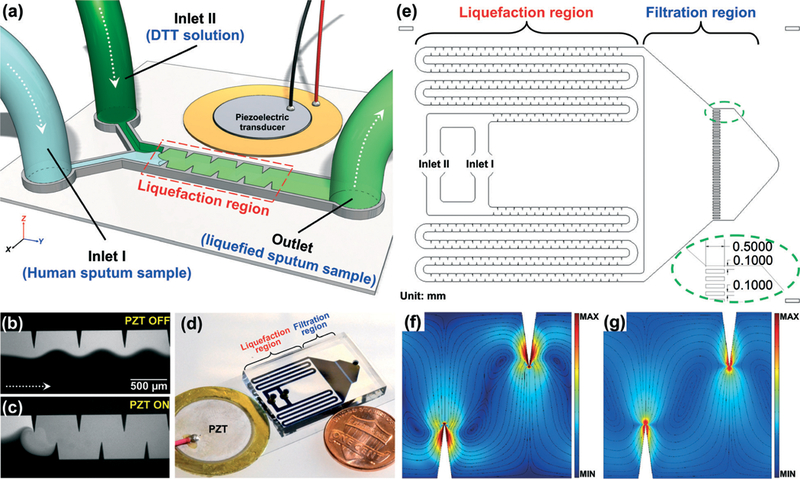
(a) Schematic of the acoustofluidic sputum liquefier. Experimental images showing the mixing of fluorescein and DI water when (b) PZT was off: a laminar flow pattern was observed; (c) PZT was on: excellent mixing of two fluids was achieved. (d) Photograph of our acoustofluidic sputum liquefier. (e) Drawing showing the detailed design of our acoustofluidic sputum liquefier. Simulated results showing the Lagrangian mean flow velocity when the fluid is (f) water and (g) a high viscosity fluid (such as sputum) with a viscosity ten times that of the water. Circular streamlines are observed in both cases indicating excellent mixing in both cases.
In the standard procedure for sputum liquefaction, a sputum sample is mixed with DTT solution using a vortex mixer for 30 seconds. By comparison, our acoustofluidic liquefaction device is composed of serpentine microchannels with sharp-edges, called the “liquefaction region” as diagrammed in Fig. 1e. By doing so, we repeatedly, uniformly mixed the sputum sample and the sputolysin for as long as 30 seconds.
We were concerned that microchannels might be easily clogged by viscous sputum samples. Therefore, we designed our acoustofluidic device with two parallel sputum-liquefying channels on a single device to prevent the channels from clogging. As a result, even if one of the channels is blocked with sputum, the other will still function. In the standard sputum liquefaction process, sterile cell strainers with a 100 μm mesh size are used to isolate cells from liquefied sputum samples and obtain a uniform single-cell suspension. To perform this filtration step on-chip, instead, a series of parallel, narrow 100 μm wide channels were designed and constructed at a downstream region, named the “filtration region” as diagrammed in Fig. 1e. These narrow channels not only isolate cells in the liquefied sputum sample, but also prevent the particularly viscous portions of the sputum sample from collecting at the outlet. Additionally, they filter debris from the sputum.
Numerical simulation was also conducted to prove the concept of liquefying high viscous fluids using our acoustofluidic sputum liquefier. Fig. 1f–g show the comparison of mean Lagrangian flow velocity for fluids of different viscosities, simulated with COMSOL (Multiphysics 5.0, COMSOL Inc.) by a numerical method that we reported previously.35 Fig. 1f shows the mean Lagrangian flow velocity for water, while Fig. 1g shows the velocity for a fluid of viscosity 10 times that of water. Circular streamlines spanning the width of the channel were observed in both cases, indicating good mixing capability. However, the magnitude of mean Lagrangian velocity is found to decrease with increasing viscosity for the same vibration amplitude, necessitating greater input power for mixing of high viscosity fluids. A similar trend has been reported for bulk acoustic wave devices by Muller et al.40 Thus, the numerical results shown in Fig. 1f–g confirm the capability of our acoustofluidic device to mix high viscosity fluid. High velocities near sharp edges result from the large values of Stokes drift near the sharp edge (Fig. 1f–g); the acoustic streaming speeds in the bulk of the channel are much lower.
Materials and methods
Device fabrication and operation
Fig. 1d represents a photograph of our acoustofluidic device for sputum liquefaction. A single-layer PDMS device was bonded to a 150 μm thick glass slide (Cat# 48404–454, VWR, USA). A piezoelectric transducer (Part# 81–7BB-27–4L0, Murata Electronics, Japan) was bonded adjacent to the PDMS device on the same glass slide using a thin layer of epoxy (Part# G14250, DEVCON, MA, USA). The activation of the piezoelectric transducer was controlled by amplified square-wave signals from a function generator (AFG3011C, Tektronix, OR, USA) and an amplifier (25A250A, Amplifier Research, WA, USA). The PDMS device was 100 μm in channel depth, and 600 μm in channel width for those channels in liquefaction region.
The sputum sample and the DTT solution were infused into our acoustofluidic sputum liquefaction device by two separate inlets through two separate 1 mL syringes (McKesson, CA, USA), which were controlled by one automated syringe pump (neMESYS, Germany). The liquefied sputum sample was then collected through the outlet to a 1.5 mL centrifuge tube. Every 15 minutes, a 1.5 mL centrifuge tube filled with approximately 500 μL of liquefied sputum sample was replaced by an empty 1.5 mL centrifuge tube, to continue the collection of liquefied samples for further sample characterization and analysis.
Before conducting liquefaction experiments with sputum samples, all of our acoustofluidic devices were experimentally tested with DI water and fluorescein to determine the optimized working frequencies of PZT to achieve uniform mixing of these two solutions. Based on these tests, 5.50 kHz was determined to be the working frequency for all our liquefaction devices; all the liquefaction experiments were conducted at this frequency. Detailed procedures to determine the optimized working frequency for the piezoelectric transducer can be found in ESI† (Fig. S2).
Human sputum samples
To establish reproducibility in this initial work, we analyzed four separate sputum samples from a single asthmatic patient using our acoustofluidic device. The sputum samples were collected at the National Institute of Health (NIH) once a week from a patient who had provided informed consent to participate in protocol 99-H-0076. After collection, sputum samples were placed on ice and immediately transported from NIH to our lab at The Pennsylvania State University, for liquefaction experiments performed on the same day. Due to the time for transportation and experimental set-up, the sputum samples were typically processed after an interval of approximately 8 hours. Upon arrival at our lab, each sample was divided into two portions of roughly equal volume. One portion was liquefied using our acoustofluidic device, and the other was liquefied using a vortex mixer. Both liquefied portions were further divided into three aliquots for characterization, which included cell viability, modified Wright-Giemsa staining, and flow cytometry analysis.
Cell viability
Cell viability was assessed to evaluate the biocompatibility of our liquefaction device for processing clinical human samples. Cells from sputum samples liquefied using our acoustofluidic micromixer (experimental group) were stained with the cell-permeant dye, Calcein-AM (Life Technologies, NY, USA), to determine the number of live cells, and propidium iodide (Sigma-Aldrich, MO, USA), to identify dead cells. As a control group, cell viability was also assessed for sputum samples that were liquefied using a vortex mixer. For both the experimental and control groups, four independent experiments were performed.
Modified Wright–Giemsa staining
A thin layer of sputum cells was prepared by centrifugation using a Cytospin™ 3 cytocentrifuge (Thermo Scientific, USA) at 600 rpm for 10 minutes and then allowed to air-dry before modified Wright–Giemsa staining. The slides were stained with a commercial staining kit (Shandon™ Kwik-Diff™, Thermo Scientific, USA) as follows: (1) 25 seconds in fixative solution (green); (2) 30 seconds in solution I (red); (3) 30 seconds in solution II (blue); (4) rinse the slides with DI water. After staining, the cytospin slides were examined under an inverted microscope (Eclipse Ti, Nikon, Japan) with a 100x objective lens, and images were captured using a digital camera (D3s, Nikon, Japan).
Statistical analysis
Data were presented as group mean ± standard deviation (SD), and were analyzed by student’s t-test using Prism 6.0 (GraphPad Software Inc., CA, USA). A p-value of less than 0.05 was considered statistically significant.
Results and discussion
Visual comparison
The raw sputum sample and the DTT solution were each injected into the channel at a flow rate of 15 μL min–1, yielding a liquefaction throughput of 30 μL min–1. Upon the activation of a piezoelectric transducer with an input voltage of 40 VPP, the sputum samples and the DTT solution were repeatedly and uniformly mixed for a sufficient amount of time (30 seconds). The uniform, liquefied mixture of sputum and DTT solution was collected over a 15 minutes interval to a 1.5 mL centrifuge tube through the outlet. Concurrently, we manually liquefied the same sputum sample using a vortex mixer (MINI230 V, VWR, USA) followed by 15 minutes of incubation.
Next, we visually compared the difference in appearance between non-liquefied samples (i.e., the raw sputum sample), and liquefied sputum samples. In Fig. 2, R, V and A denote, respectively, the non-liquefied sputum sample, the sputum sample liquefied using a vortex mixer, and the sputum sample liquefied using our acoustofluidic device. As shown in Fig. 2, the non-liquefied sputum sample was cloudy and contained visible clumps of mucus. The liquefied sputum samples, however, were translucent, presenting as a uniform mixture with a negligible amount of viscous mucus sputum.
Fig. 2.
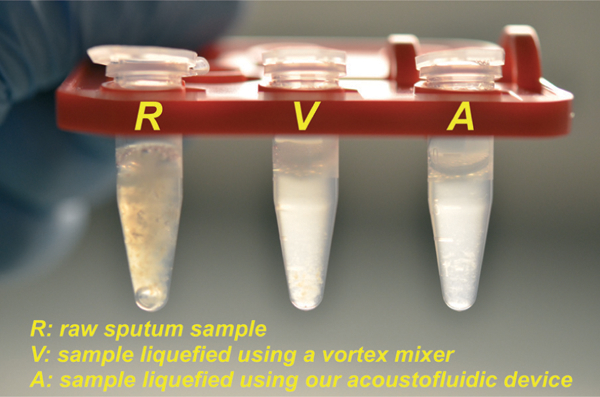
Photograph showing the visual comparison of human sputum samples: (R) an un-liquefied raw sputum sample; (V) a sputum sample liquefied using a vortex mixer; (A) a sputum sample liquefied using our acoustofluidic device.
It is encouraging that the sputum sample liquefied using our acoustofluidic device appeared similar to those liquefied using a vortex mixer, as they demonstrate that on-chip liquefaction may be achieved with our acoustofluidic approach. Though the four sputum samples used in this work were all provided by the same asthmatic patient, the viscosity varied among the samples, which were collected on different days. In four independent liquefaction experiments, all samples were uniformly liquefied, appearing similar to those shown in Fig. 2. These results demonstrate that our acoustofluidic liquefaction device can liquefy sputum samples over a range of viscosities.
We observed that when a volume of sputum was mixed with a greater volume of DTT solution, liquefaction was more uniform; however, this higher volume of DTT solution may affect the cell viability and further cellular analysis.41,42 As a result, the volume of DTT solution must be considered when liquefying the sputum samples for downstream analyses.
Viability of cells in liquefied sputum samples
As shown in Fig. 3a–d, both dead and live cells were observed in sputum samples liquefied using both the vortex mixer and our acoustofluidic device. After counting the number of live and dead cells, we were able to statistically compare the viability obtained after each approach. There were over 1500 cells considered for both of the groups. As shown in Fig. 3e, the viabilities were calculated to be 41.5 ± 17.7% and 36.7 ± 8.9% for the sputum samples liquefied, respectively, using the vortex mixer and our micromixer. The results are statistically similar, with a p-value of 0.692 (p > 0.05). In other words, our acoustofluidic device preserves cell viability similar to a vortex mixer, demonstrating that our acoustofluidic device is biocompatible with clinical samples.
Fig. 3.
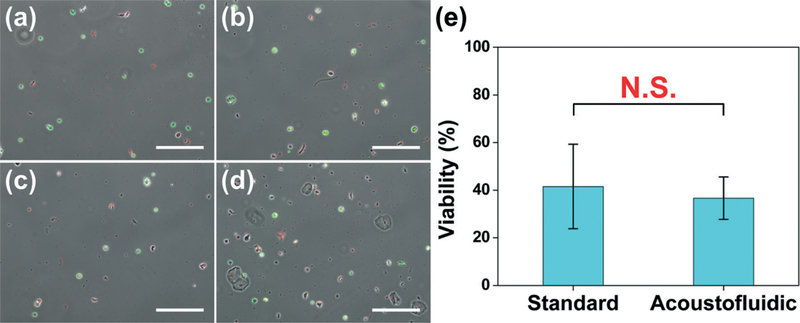
Cell viability of sputum samples liquefied using: (a)–(b) a standard sputum-liquefaction procedure; (c)–(d) our acoustofluidic sputum liquefier. (e) Statistical analysis showing the comparison of cell viability of two liquefaction procedures. Data represent an average of n = 3 to 4 independent experiments per group. In each independent experiment, over 500 cells were counted to assess cell viability. N.S. represents groups that are not statistically different (p > 0.05). Data are presented as group means ± standard deviation (SD). Scale bar: 200 μm.
The relatively low cell viability in these two samples may stem from the sample transportation and storage. In this work, the human sputum samples were transported from NIH (Bethesda, Maryland, USA) to our lab at The Pennsylvania State University (State College, Pennsylvania, USA) on the same day they were liquefied. Each sputum sample prior to experimentation was stored on ice for at least 8 hours during transportation & setup. A cell viability in the 60% range is typically observed when sputum samples are processed right after collection without transportation. As such, cell viability will likely be improved when samples are analyzed at a single site.
Cells morphology and identification of immune cells
To verify if immune cells present in liquefied sputum samples can be preserved and recovered, modified Wright–Giemsa staining was used to inspect cellular morphology and identify inflammatory cell types. Fig. 4a–c and Fig. 4d–f are stained cells from the sputum samples liquefied, respectively, using the vortex mixer and the acoustofluidic sputum liquefier. In Fig. 4a–c, inflammatory cells, such as eosinophils (yellow arrows) and neutrophils (red arrows), which are commonly present in sputum samples from asthmatic patients, were recovered intact after liquefaction using the vortex mixer. As shown in Fig. 4d–f, intact eosinophils and neutrophils were also seen in sputum samples liquefied using our acoustofluidic device.
Fig. 4.
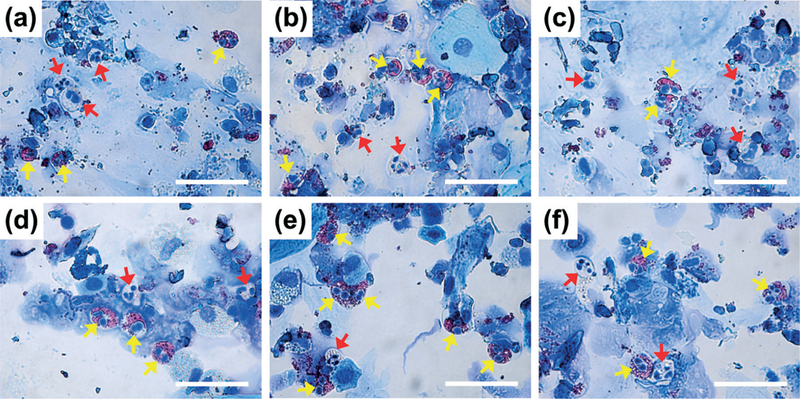
Representative of optical images (100x) showing modified Wright–Giemsa staining results of cell samples obtained from sputum samples liquefied using (a)–(c) a vortex mixer or (d)–(f) our acoustofluidic sputum liquefier. Inflammatory cells, such as eosinophils (yellow) and neutrophils (red), are indicated by colored arrows. Scale bar: 50 μm.
In addition to eosinophils and neutrophils, macrophages and lymphocytes were also present in samples liquefied using either the vortex mixer or our acoustofluidic device. The modified Wright–Giemsa staining results demonstrate that our device uniformly liquefies clinical sputum samples, without sacrificing cellular integrity.
Flow cytometry analysis
Flow cytometry was next performed to quantitatively characterize the liquefied sputum samples and evaluate the performance of our acoustofluidic sputum liquefier. A commercial bench-top flow cytometer (FC 500, Beckman Coulter, USA) was used to conduct the flow cytometry analysis. Cells in liquefied sputum samples were stained with Alexa Fluor 488-labelled anti-human CD45 antibody (Biolegend, CA, USA) to identify leukocytes, and PE-labelled CD15 antibody (Biolegend, CA, USA) to identify both eosinophils and neutrophils, which are common inflammatory cells present in sputum from asthmatic subjects (Fig. 5). The percentage of CD45+/CD15+ eosinophils and neutrophils were 20.4% and 24.9%, respectively, for samples that were liquefied using the vortex mixer and our acoustofluidic device. These results show that key inflammatory cells in sputum may be recovered and identified, which thereby demonstrates that our acoustofluidic device is an effective tool for the clinical liquefaction of human sputum.
Fig. 5.
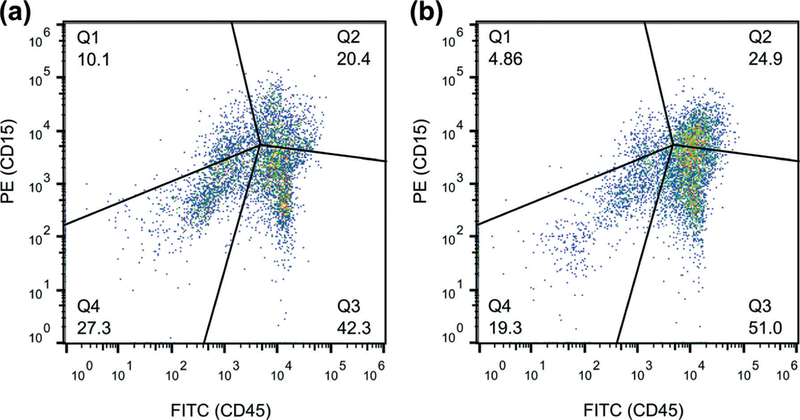
Fluorescence (CD45) vs. fluorescence (CD15) plot of the cell samples obtained from the sputum samples liquefied by (a) a standard sputum-liquefaction procedure and by (b) our acoustofluidic sputum liquefier. The percentage of co-population of eosinophils and neutrophils are 20.4% and 24.9% for (a) and (b), respectively.
Conclusions
Using a sharp-edge-based acoustofluidic micromixer, we have demonstrated the first microfluidic-based sputum liquefaction of human sputum. Furthermore, we show that sputum samples liquefied using our acoustofluidic device were comparable to samples that were liquefied using a vortex mixer based on analyses of cell viability, modified Wright–Giesma staining and flow cytometry. Our results reveal the potential of our acoustofluidic device for liquefying clinical sputum samples on-chip. Our device can liquefy sputum samples at a throughput of 30 μL min–1, a value that will be improved with further design optimization. When integrated with our acoustofluidic pump,43 our acoustofluidic sputum liquefier will be able to liquefy sputum samples in an automated fashion. Compared to the standard approach for sputum liquefaction, the acoustofluidic approach is advantageous not only in cost, simplicity, and automation, but also in flexibility and integrability.
Together, our findings suggest that our acoustofluidic sputum liquefier is a promising candidate for incorporation with other on-chip components that will enable the development of a fully integrated, self-contained sputum processing and analysis platform. Moreover, our demonstration of liquefying sputum samples opens the gate for applications that require the processing of highly viscous fluids.
Supplementary Material
Acknowledgements
This research was supported by the American Asthma Foundation (AAF) Scholar Award, the National Science Foundation (IIP-1346440) and the NHLBI Division of Intramural Research. Components of this work were conducted at the Penn State node of the NSF-funded National Nanotechnology Infrastructure Network.
Footnotes
Electronic supplementary information (ESI) available: Video1-mixing of two fluids when a piezoelectric transducer was alternately switched on and off. See DOI: 10.1039/c5lc00539f
References
- 1.Vidal S, Bellido-Casado J, Granel C, Crespo A, Plaza V and Juárez C, Immunobiology, 2012, 217, 692–697. [DOI] [PubMed] [Google Scholar]
- 2.Simpson JL, Scott R, Boyle MJ and Gibson PG, Respirology, 2006, 11, 54–61. [DOI] [PubMed] [Google Scholar]
- 3.McNerney R, Maeurer M, Abubakar I, Marais B, McHugh TD, Ford N, Weyer K, Lawn S, Grobusch MP, Memish Z, Squire SB, Pantaleo G, Chakaya J, Casenghi M, Migliori GB, Mwaba P, Zijenah L, Hoelscher M, Cox H, Swaminathan S, Kim PS, Schito M, Harari A, Bates M, Schwank S, O’Grady J, Pletschette M, Ditui L, Atun R and Zumla A, J. Infect. Dis, 2012, 205, S147–S158. [DOI] [PubMed] [Google Scholar]
- 4.Zumla A, Nahid P and Cole ST, Nat. Rev. Drug Discovery, 2013, 12, 388–404. [DOI] [PubMed] [Google Scholar]
- 5.Su W, Gao X, Jiang L and Qin J, J. Chromatogr. A, 2015, 1377, 13–26. [DOI] [PubMed] [Google Scholar]
- 6.Chang W-H, Wang C-H, Yang S-Y, Lin Y-C, Wu J-J, Lee MS and Lee G-B, Lab Chip, 2014, 14, 3376–3384. [DOI] [PubMed] [Google Scholar]
- 7.Au AK, Lee W and Folch A, Lab Chip, 2014, 14, 1294–1301. [DOI] [PMC free article] [PubMed] [Google Scholar]
- 8.Rane TD, Chen L, Zec HC and Wang T-H, Lab Chip, 2015, 15, 776–782. [DOI] [PMC free article] [PubMed] [Google Scholar]
- 9.Zec H, Rane TD and Wang T-H, Lab Chip, 2012, 12, 3055–3062. [DOI] [PMC free article] [PubMed] [Google Scholar]
- 10.Lee W, Kwon D, Chung B, Jung GY, Au A, Folch A and Jeon S, Anal. Chem, 2014, 86, 6683–6688. [DOI] [PMC free article] [PubMed] [Google Scholar]
- 11.Hashmi A, Heiman G, Yu G, Lewis M, Kwon H-J and Xu J, Microfluidics and Nanofluidics, 2013, 14, 591–596. [Google Scholar]
- 12.Neuži P, Giselbrecht S, Länge K, Huang TJ and Manz A, Nat. Rev. Drug Discovery, 2012, 11, 620–632. [DOI] [PMC free article] [PubMed] [Google Scholar]
- 13.Ding X, Lin S-CS, Lapsley MI, Li S, Guo X, Chan CY, Chiang I-K, Wang L, McCoy JP and Huang TJ, Lab Chip, 2012, 12, 4228–4231. [DOI] [PMC free article] [PubMed] [Google Scholar]
- 14.Li P, Stratton ZS, Dao M, Ritz J and Huang TJ, Lab Chip, 2013, 13, 602–609. [DOI] [PMC free article] [PubMed] [Google Scholar]
- 15.Chen Y, Li P, Huang P-H, Xie Y, Mai JD, Wang L, Nguyen N-T and Huang TJ, Lab Chip, 2014, 14, 626–645. [DOI] [PMC free article] [PubMed] [Google Scholar]
- 16.Chan CY, Huang P-H, Guo F, Ding X, Kapur V, Mai JD, Yuen PK and Huang TJ, Lab Chip, 2013, 13, 4697–4710. [DOI] [PMC free article] [PubMed] [Google Scholar]
- 17.Fang X, Chen H, Xu L, Jiang X, Wu W and Kong J, Lab Chip, 2012, 12, 1495–1499. [DOI] [PubMed] [Google Scholar]
- 18.Hung L-Y, Huang T-B, Tsai Y-C, Yeh C-S, Lei H-Y and Lee G-B, Biomed. Microdevices, 2013, 15, 539–551. [DOI] [PMC free article] [PubMed] [Google Scholar]
- 19.Kim J-H, Yeo W-H, Shu Z, Soelberg SD, Inoue S, Kalyanasundaram D, Ludwig J, Furlong CE, Riley JJ, Weigel KM, Cangelosi GA, Oh K, Lee K-H, Gao D and Chung J-H, Lab Chip, 2012, 12, 1437–1440. [DOI] [PubMed] [Google Scholar]
- 20.Liong M, Fernandez-Suarez M, Issadore D, Min C, Tassa C, Reiner T, Fortune SM, Toner M, Lee H and Weissleder R, Bioconjugate Chem, 2011, 22, 2390–2394. [DOI] [PMC free article] [PubMed] [Google Scholar]
- 21.Liong M, Hoang AN, Chung J, Gural N, Ford CB, Min C, Shah RR, Ahmad R, Fernandez-Suarez M, Fortune SM, Toner M, Lee H and Weissleder R, Nat. Commun, 2013, 4, 1752. [DOI] [PMC free article] [PubMed] [Google Scholar]
- 22.Wu TT, Chen YT, Sun JH, Lin SCS and Huang TJ, Appl. Phys. Lett, 2011, 98, 171911. [Google Scholar]
- 23.Wiklund M, Lab Chip, 2012, 12, 2018–2028. [DOI] [PubMed] [Google Scholar]
- 24.Hashmi A, Yu G, Reilly-Collette M, Heiman G and Xu J, Lab Chip, 2012, 12, 4216–4227. [DOI] [PubMed] [Google Scholar]
- 25.Bruus H, Lab Chip, 2012, 12, 20–28. [DOI] [PubMed] [Google Scholar]
- 26.Chen Y, Ding X, Steven Lin S-C, Yang S, Huang P-H, Nama N, Zhao Y, Nawaz AA, Guo F, Wang W, Gu Y, Mallouk TE and Huang TJ, ACS Nano, 2013, 7, 3306–3314. [DOI] [PMC free article] [PubMed] [Google Scholar]
- 27.Ding X, Li P, Lin S-CS, Stratton ZS, Nama N, Guo F, Slotcavage D, Mao X, Shi J, Costanzo F and Huang TJ, Lab Chip, 2013, 13, 3626–3649. [DOI] [PMC free article] [PubMed] [Google Scholar]
- 28.Chen Y, Nawaz AA, Zhao Y, Huang P-H, McCoy JP, Levine SJ, Wang L and Huang TJ, Lab Chip, 2014, 14, 916–923. [DOI] [PMC free article] [PubMed] [Google Scholar]
- 29.Ding X, Peng Z, Lin S-CS, Geri M, Li S, Li P, Chen Y, Dao M, Suresh S and Huang TJ, Proc. Natl. Acad. Sci. U. S. A, 2014, 111, 12992–12997. [DOI] [PMC free article] [PubMed] [Google Scholar]
- 30.Li P, Mao Z, Peng Z, Zhou L, Chen Y, Huang P-H, Truica CI, Drabick JJ, El-Deiry WS, Dao M, Suresh S and Huang TJ, Proc. Natl. Acad. Sci. U. S. A, 2015, 112, 4970–4975. [DOI] [PMC free article] [PubMed] [Google Scholar]
- 31.Guo F, Li P, French JB, Mao Z, Zhao H, Li S, Nama N and Fick JR, Proc. Natl. Acad. Sci. U. S. A, 2015, 112, 43–48. [DOI] [PMC free article] [PubMed] [Google Scholar]
- 32.Huang P-H, Ian Lapsley M., Ahmed D, Chen Y, Wang L and Jun Huang T., Appl. Phys. Lett, 2012,101,141101. [DOI] [PMC free article] [PubMed] [Google Scholar]
- 33.Wiklund M, Green R and Ohlin M, Lab Chip, 2012, 12, 2438–2451. [DOI] [PubMed] [Google Scholar]
- 34.Huang P-H, Xie Y, Ahmed D, Rufo J, Nama N, Chen Y, Chan CY and Huang TJ, Lab Chip, 2013, 13, 3847–3852. [DOI] [PMC free article] [PubMed] [Google Scholar]
- 35.Nama N, Huang P-H, Huang TJ and Costanzo F, Lab Chip, 2014, 14, 2824–2836. [DOI] [PMC free article] [PubMed] [Google Scholar]
- 36.Mao X, Juluri BK, Lapsley MI, Stratton ZS and Huang TJ, Microfluid. Nanofluid, 2009, 8, 139–144. [Google Scholar]
- 37.Ahmed D, Mao X, Shi J, Juluri BK and Huang TJ, Lab Chip, 2009, 9, 2738–2741. [DOI] [PubMed] [Google Scholar]
- 38.Ahmed D, Muddana HS, Lu M, French JB, Ozcelik A, Fang Y, Butler PJ, Benkovic SJ, Manz A and Huang TJ, Anal. Chem, 2014, 86, 11803–11810. [DOI] [PMC free article] [PubMed] [Google Scholar]
- 39.Efthimiadis A, Spanevello A, Hamid Q, Kelly MM, Linden M, Louis R, Pizzichini MMM, Pizzichini E, Ronchi C, Van Overvel F and Djukanovic R, Eur. Respir. J, 2002, 37, 19s–23s. [DOI] [PubMed] [Google Scholar]
- 40.Muller PB, Barnkob R, Jensen MJH and Bruus H, Lab Chip, 2012, 12, 4617–4627. [DOI] [PubMed] [Google Scholar]
- 41.Beier J, Beeh KM, Kornmann O and Buhl R, J. Lab. Clin. Med, 2004, 144, 38–44. [DOI] [PubMed] [Google Scholar]
- 42.Woolhouse IS, Bayley DL and Stockley RA, Thorax, 2002, 57, 667–671. [DOI] [PMC free article] [PubMed] [Google Scholar]
- 43.Huang P-H, Nama N, Mao Z, Li P, Rufo J, Chen Y, Xie Y, Wei C-H, Wang L and Huang TJ, Lab Chip, 2014, 14, 4319–4323. [DOI] [PMC free article] [PubMed] [Google Scholar]
Associated Data
This section collects any data citations, data availability statements, or supplementary materials included in this article.


