
Figure 3.
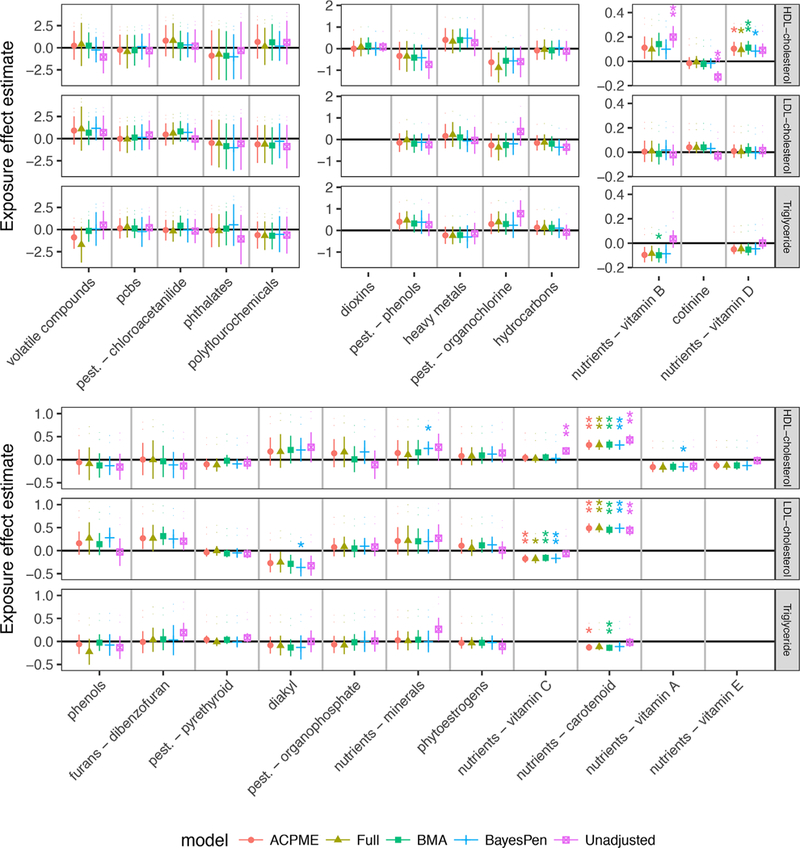
Point estimates and 95% credible intervals of the association between the multivariate exposure Z and each of the three outcome adjusted by the exposure to the other 23 groups and baseline covariates. Results are reported under the ACPME model, the full model (α = 1), the unadjusted model (α = 1), BMA, and BayesPen. Omitted estimates were flagged for potentially selection bias. The black asterisks indicate 0.05 (*) and 0.01 (**) significance levels after Bonferroni adjustment for multiple comparisons. Omitted estimates were flagged for potentially selection bias (see Web Appendix D for details). The four panels have different y-axis scales. This figure appears in color in the electronic version of this article.