

Abstract
In sickle cell disease (SCD), sickle hemoglobin (HbS) polymerizes upon deoxygenation, resulting in sickling of red blood cells (RBCs). These sickled RBCs have strongly reduced deformability, leading to vaso‐occlusive crises and chronic hemolytic anemia. To date, there are no reliable laboratory parameters or assays capable of predicting disease severity or monitoring treatment effects. We here report on the oxygenscan, a newly developed method to measure RBC deformability (expressed as Elongation Index ‐ EI) as a function of pO2. Upon a standardized, 22 minute, automated cycle of deoxygenation (pO2 median 16 mmHg ± 0.17) and reoxygenation, a number of clinically relevant parameters are produced in a highly reproducible manner (coefficients of variation <5%). In particular, physiological modulators of oxygen affinity, such as, pH and 2,3‐diphosphoglycerate showed a significant correlation (respectively R = ‑0.993 and R = 0.980) with Point of Sickling (PoS5%), which is defined as the pO2 where a 5% decrease in EI is observed during deoxygenation. Furthermore, in vitro treatment with antisickling agents, including GBT440, which alter the oxygen affinity of hemoglobin, caused a reproducible left‐shift of the PoS, indicating improved deformability at lower oxygen tensions. When RBCs from 21 SCD patients were analyzed, we observed a significantly higher PoS in untreated homozygous SCD patients compared to treated patients and other genotypes. We conclude that the oxygenscan is a state‐of‐the‐art technique that allows for rapid analysis of sickling behavior in SCD patients. The method is promising for personalized treatment, development of new treatment strategies and could have potential in prediction of complications.
1. INTRODUCTION
In sickle cell disease (SCD) a single point mutation in the gene encoding for β‐globin chain underlies the production of the abnormal hemoglobin S (HbS). HbS polymerizes upon deoxygenation which results in the formation of hemoglobin polymers and eventually gives the red blood cell (RBC) its characteristic sickled shape. Exacerbating the hypoxia‐induced polymerization is the inherent low‐affinity of HbS, presumably due to high levels of 2,3‐diphosphoglycerate (2,3‐DPG) present in sickle RBCs.1 These sickled RBCs have strongly reduced deformability and show increased adherence to vascular endothelium, leading to vaso‐occlusive crises.2, 3, 4 Hydroxyurea (HU), regular blood transfusion, and L‐glutamine are the main treatment options in SCD, with allogeneic hematopoietic stem cell transplantation being the only curative therapy currently available.5 Remarkably, clinical severity varies considerably despite the fact that all SCD patients carry the same homozygous point mutation in the β‐globin gene. To date there is no reliable laboratory or clinical parameter available to predict severity and/or complications.
An individual patient's tendency to “sickle” can be tested in vitro using a so‐called sickling assay: RBCs are incubated under hypoxic conditions and manually or digitally counted using a light microscope. This assay is still widely applied in research, and many preclinical and early phase pharmacologic and gene therapy trials use this assay as outcome variable to predict clinical effect.6, 7, 8, 9, 10, 11 However, there are many disadvantages: It is time consuming, it has low sensitivity and high variability, and the process is not automated. More importantly, morphological characteristics of sickle cells may not correlate well with physiologic characteristics, such as deformability.12
RBC deformability at normoxic conditions is compromised in patients with SCD due to irreversibly sickled cells, as well as altered hydration causing a decrease in surface/volume ratio.12, 13, 14 Osmotic gradient ektacytometry, in which deformability is measured as a function of a continuous change in osmolarity, is a well‐established method, in particular in hereditary disorders of the red cell membrane.15, 16, 17, 18 In SCD, osmotic gradient ektacytometry showed that increasing HbF induces a better surface‐to‐volume ratio thereby improving deformability in untransfused patients with SCD.19 RBC deformability during normoxic conditions as a marker for complications has also been investigated in the past, and a negative correlation was found between an increase in RBC deformability and osteonecrosis or painful sickle cell crises.20, 21, 22 In contrast to these findings, RBC deformability was found to be decreased during an acute vaso‐occlusive crises when compared to steady state values.23 Thus, in itself, RBC deformability during normoxic conditions gives inconsistent results which makes it unsuitable to be used as predictive biomarker.
Therefore, an assay that investigates sickling during deoxygenation is required to monitor treatment and disease state in patients with SCD. Importantly, this assay could identify individuals who are at increased risk for certain complications, and potentially predict response to therapy. Finally, it contributes to a better understanding of the clinical effect of new antisickling agents. In this study, we evaluate the oxygenscan, which investigates RBC deformability as a function of continuously changing pO2, allowing us to characterize individual sickling behavior in SCD patients.
2. METHODS
2.1. Blood specimens
University Medical Center Utrecht (UMCU): Whole blood of patients with SCD who were included in 2 different clinical studies (Netherlands Trial Register [NTR] identifier, NTR 6779 and NTR 6462) was used. Additional samples were collected from discarded anonymized EDTA blood of patients with SCD who visited outpatient clinic. Whole blood from healthy controls was collected through the Mini Donor Service, which is approved by the ethical committee of the UMCU and in accordance to the declaration of Helsinki.
The Children's Hospital of Philadelphia (CHOP): Leftover EDTA blood samples from individuals with SCD after routine clinical visits were utilized for the traditional antisickling studies. The use of such samples, with informed consent, is in accordance to an approved IRB protocol.
2.2. Oxygen gradient ektacytometry: the oxygenscan
The Laser Optical Rotational Red Cell Analyzer (Lorrca, RR Mechatronics, Zwaag, The Netherlands) is a next generation ektacytometer that measures different qualitative aspects of RBC deformability expressed as Elongation Index (EI). The pO2scan is a new add‐on of the Lorrca, allowing the measurement of red cell deformability as a function of a continuously changing gradient of O2 tension. In brief, a couette system is used to apply shear stress on the RBCs, which are diluted in a viscous solution (Iso Oxy), consisting of polyvinylpyrrolidone (PVP) with characteristics of whole blood (ie, osmolarity and pH). Between a static cylinder (bob) and rotating cylinder (cup), there is a small gap in which the blood suspension is injected (Figure 1A). Light from the laser beam is scattered by the presence of RBCs and this diffraction pattern is projected and analyzed. In healthy controls, the diffraction pattern is circular at rest and elliptical shaped at higher shear stress (Figure 1B).15
Figure 1.
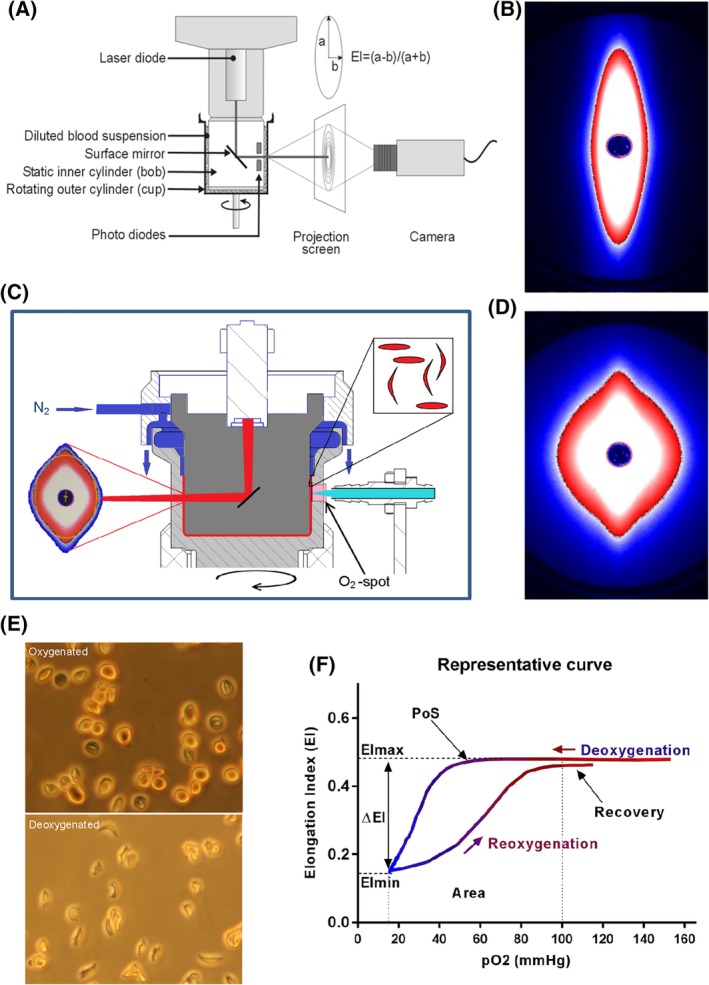
Experimental setup of the Lorrca with the oxygenscan module and representative oxygenscan curve. (A) Experimental setup of the Lorrca. (B) The diffraction pattern of healthy RBCs is elliptical when shear stress of 30 Pa is applied. (C) Schematic graph of the oxygenscan add‐on which shows deoxygenation with nitrogen gas (N2), the O2‐spot and LED‐fiber, a device to measure oxygen tension. (D) Upon deoxygenation and shear stress (30 Pa) the diffraction pattern changes from an ellipse to a rhomboid shape. (E) Sickle RBCs fixated after a similar round of deoxygenation show change in shape, control sickle RBCs, without nitrogen gas, show no change in shape. (F) A representative curve of the oxygenscan. Maximum Elongation Index (EImax) represents baseline position, and shows overall deformability of the total RBC population. Minimum EI (EImin) represents minimal deformability which is caused by change in shape and orientation of RBCs upon deoxygenation. DeltaEI (difference in EI between EImax and EImin) shows how many cells can sickle during one round of deoxygenation. Point of sickling (PoS5%, pO2 at 5% EI decrease) embodies the oxygen tension when the first RBCs start to sickle. The area under the curve (from minimum pO2‐100 mmHg) is calculated in the parameter Area and this summarizes EImax, EImin, and PoS. The capacity of sickled cells to unsickle during reoxygenation is represented in the parameter Recovery (percentage of EImax reached during reoxygenation). To aid interpretation, we connected all data points in every individual experiment by a line in the graphical presentation of the results
To carry out the oxygenscan, 50μL of whole blood, standardized to a fixed RBC count of 200 × 106 is suspended into 5 mL Iso Oxy (osmolarity 282‐286 mOsm/kg, pH 7.35‐7.45) at room temperature (± 22°C). Approximately 2 mL of the sample solution is slowly injected into the gap between the cup and bob until a fixed level is attained (Figure 1C). The bob is maintained at a constant temperature of 37°C. Inlet of nitrogen gas from above facilitates deoxygenation (Figure 1C). O2 tension is measured every 20 seconds by means of a small oxygen (O2)‐spot which is covered with luminophore that is present in the wall of the cup. The pO2 is calculated from the amount of quenching of the signal that is sent from the fiber to the O2‐spot. One oxygenscan consists of approximately 80 measurements of EI, during one round of deoxygenation (1300 seconds), and followed by reoxygenation (280 seconds). Shear stress is fixed at 30 Pa. Ambient air pO2 in the cup was about 160 mmHg and is gradually lowered to below 20 mmHg (2.7 kPa, 2,9%) O2. Reoxygenation occurs due to passive diffusion of ambient air.
2.3. Oxygenscan parameters
When considering a typical oxygenscan curve (Figure 1F), 6 parameters are considered to reflect various features of the process of HbS polymerization or sickling: EImax: maximum EI before deoxygenation that represents baseline position and shows overall deformability of the total RBC population. EImin: minimum EI, representing minimal deformability resulting from changes in shape and orientation of (sickle) RBCs upon deoxygenation (Figure 1D). DeltaEI: difference between EImax and EImin, indicating sickling capacity during one round of deoxygenation. Point of Sickling 5% (PoS 5% ): pO2 (mmHg) at which 5% decrease of EImax during deoxygenation is observed. This indicates the pO2 where sickling starts. Area: area under the curve which is defined by an integral calculation of the EI and pO2 measurements between minimum pO2 and 100 mmHg. This is the result of EImax, EImin, and PoS. Recovery: percentage of EI after reoxygenation compared to EI just before deoxygenation measured at the pO2 between 100 and 120 mmHg. This represents the capacity of sickled cells to unsickle during reoxygenation.
2.4. Digital microscopy
Smears of peripheral blood of patients were analyzed using the CellaVision digital microscope DM96 (software 5.0.1build11), the traditional neural network of which classifies sickle cells based on manually designed features, such as shape, color, and texture features. Sickle cell counts were expressed as percentage of absolute cell count analyzed by digital microscopy.24
2.5. In vitro addition of HbAA blood to HbSS blood, mimicking red cell transfusions
To investigate the effect of adding RBCs of healthy donors, ABO and rhesus matched RBCs of a healthy donor was mixed with whole blood of a patient with SCD to reach the following percentages of HbS blood: 100%, 75%, 50%, 25%, and 0%.
2.6. Influence of 2,3‐DPG levels, pH, and temperature
To assess the influence of 2,3‐DPG levels on oxygenscan parameters, complete blood count and oxygenscans were performed within 10 minutes after blood collection, and after 24 hours. Whole blood was kept either at 4°C, room temperature (± 22°C) and 37°C for 24 hours. 2,3‐DPG was measured by spectrophotometry (SpectraMax M2e, Molecular Devices, Sunnyvale, CA) using the 2,3‐DPG assay kit (Roche). 2,3‐DPG levels were normalized to hemoglobin levels.
To assess the influence of temperature, oxygenscans were carried out with bob temperatures of 35, 37, 39, 41, and 43°C.
To investigate the influence of pH, the pH of the Iso Oxy was set to 6.9, 7.1, 7.3, 7.7, and 7.9 before being used in the oxygenscan.
2.7. In vitro incubation with antisickling agents GBT440, 5‐PMFC, and INN312
GBT440, 5‐PMFC, and INN312 are a class of antisickling aromatic aldehyde agents that modulate hemoglobin oxygen affinity by stabilizing the higher oxygen affinity relaxed state (R‐state) of hemoglobin and/or destabilizing the low oxygen affinity tense state (T‐state) of hemoglobin. GBT440 (2‐hydroxy‐6 ((2‐(1‐isopropyl‐1H‐pyrazol‐5‐yl) pyridin‐3‐yl)‐methoxy) benzaldehyde, MedChemExpress, Sollentuna, Sweden) is a novel, orally bioavailable agent currently in clinical trials for SCD.9, 25 5‐PMFC (5‐[Phenoxymethyl]‐2‐furan carbaldehyde) is an aryl ether derivative of 5‐(hydroxymethyl)furfural (5‐HMF), with a potent antisickling effect.10 Designated International Nonproprietary Name‐312 (INN312) is a designed and synthesized derivate of vanillin.8, 26
Whole blood (20% hematocrit) was added to N‐[Tris(hydroxymethyl)methyl]‐2‐aminoethanesulfonic acid (TES)‐buffer (pH 7,4), which contained 30 mM TES‐sodium salt and 30 mM TES‐free acid (both Merck KGaA, Darmstadt, Germany), supplemented with 130 mM NaCl, 5 mM KCl, 10 mM glucose, and 0.2% bovine serum albumin. These suspensions were incubated with the agents for 1 hour at 37°C at normoxia. Concentrations used for incubation were 1 mM and 2 mM of GBT440, and 1 and 5 mM of 5‐PMFC and INN‐312.7, 10 Antisickling agents were dissolved in dimethyl sulfoxide (DMSO), while incubation with DMSO alone was used as a negative control.
2.8. Morphological analysis after in vitro incubation with antisickling agents
To compare the outcome of the effect of the agents mentioned earlier, sickling was also measured using previously reported methodology with slight modifications.7, 10, 27 Briefly, whole blood was suspended (20% hematocrit) in isotonic Hemox buffer (TCS Scientific Corp), pH 7.4, supplemented with 10 mM glucose and 0.2% bovine serum albumin and incubated at normoxia in varying concentrations of GBT440 (1, 2 and 5 mM), 5‐PMFC (1 and 5 mM), and INN312 (1 and 5 mM) at 37°C for 1 hour. Next, suspensions were incubated under hypoxic condition (2.5% Oxygen gas/97.5% Nitrogen gas) at 37°C for 1 hour. Cells were fixed and analyzed by light microscopy.
2.9. Statistical analysis
Experiments were mainly carried out in duplicates, mean, SD, and coefficient of variation (CV) were calculated. Statistical analysis was performed using IBM Statistics SPSS (v21) and Graphpad Prism. One‐way anova (post‐hoc Tukey's test or Dunnett's test) or a Kruskal‐Wallis test (post‐hoc Dunn's test) was used when appropriate. We normalized results in the experiments with 2,3‐DPG because of known individual differences in 2,3‐DPG levels. Results of incubation with antisickling agents was normalized to enable the comparison of DeltaEI at 18 mmHg with the classical, microscopy‐based sickling assay. Pearson's correlation was used to determine correlations of oxygenscan parameters with laboratory and clinical parameters. A P‐value of <0.05 was considered statistical significant.
3. RESULTS
3.1. The oxygenscan reproducibly characterizes red blood cell sickling
To validate the technique whole blood samples of 21 individuals with SCD, 5 individuals with sickle cell trait, and 8 healthy donors were used. A representative oxygenscan and its derived parameters is shown in Figure 1F. Importantly, parameters from duplicate measurements generally had a CV <5% (median 1.83%). In case a CV >5% was obtained, a third measurement was performed. The parameters EImax and Recovery appeared to be the most robust with median CVs <1%.
Measurements of pO2 and EI are not performed at the same position in the cup. This ensures a better discrimination between the deoxygenation and reoxygenation curves and, hence, a better interpretation of them.
In order to confirm that the change in diffraction pattern during deoxygenation reflects sickling, cells were deoxygenated outside the Lorrca, under comparable conditions, fixed and analyzed by light microscopy as described. Compared to oxygenated conditions sickling is clearly induced upon deoxygenation (Figure 1E and Supporting Information).
Upon storage of whole blood at 4°C oxygenscan curves shifted slightly upward. When stored for 24 hours at 4°C curves remained stable, with minor increases in EImax (1.7%), PoS (2,7%), DeltaEI (9.2%), and Area (6.7%). Minor decreases of 6.7% in EImin and 0.6% in Recovery were observed under these conditions. Upon longer storage, oxygenscans shifted upward. (Supporting Information Table S1).
3.2. The oxygenscan can adequately assess the effect of blood transfusion
In order to investigate the direct effects of blood transfusions on sickling behavior, RBCs of a healthy control (HC) was mixed with whole blood of a SCD patient in different amounts (Supporting Information Figure S2A). Supporting Information Figure S2B and S2G shows that EImax and EImin shifted toward normal upon increasing percentages of HbAA blood. At the same time the PoS shifted to the left (Supporting Information Figure S2D), whereas DeltaEI decreased and Area increased (Supporting Information Figure S2C and S2E). Recovery also increased to 100% (Supporting Information Figure S2F).
All oxygenscan parameters correlated significantly with the percentage of whole blood. EImin showed a striking linear correlate of r = 0.998, P < 0.0001 (pooled data of 3 patients, individual correlations were above r = 0.987 and P < 0.01, Supporting Information Figure S2G‐L).
3.3. Oxygenscan parameters reflect the influence of physiologic modulators of the Hb‐dissociation curve
Temperature, pH and 2,3‐DPG are important cellular modulators of the O2 affinity of hemoglobin and thereby of sickling. These parameters are therefore expected to exert effect on the oxygenscan. Oxygenscans and 2,3‐DPG were essentially unchanged after 24 hours at 4°C (Supporting Information Figure S2A‐G). When kept at room temperature or 37°C, 2,3‐DPG had decreased after 24 hours (normalized and pooled data are shown in Supporting Information Figure S2B). 2,3‐DPG showed a strong correlation with PoS (r = 0.980, P = 0.020, Supporting Information Figure S2F and S2K) and EImin (Supporting Information Figure S2D and S2I).
Upon lowering the pH of Iso Oxy, an increase of EImax, DeltaEI, and PoS was observed, and EImin, Area, and Recovery decreased (Supporting Information Figure S3A‐G). Upon increasing the pH, the opposite effect was observed (Supporting Information Figure S3A‐G). PoS appeared to correlate best with pH change (r = −0.993, P < 0.001 (pooled data, Supporting Information Figure S3K), indicating that lowering pH results in sickling that starts at higher pO2.
Next, we performed series of oxygenscans of a single sample at different cup and bob temperatures. Results were similar as those found with pH adjustments (Supporting Information Figure S4). EImax decreased upon increased temperature and correlated best (linear correlate r = 0.996, P < 0.001), indicating RBC deformability at normoxic conditions is temperature dependent (Supporting Information Figure S4G).
3.4. The oxygenscan provides a means to evaluate the efficacy of antisickling agents
Currently several new drugs for SCD are being tested in clinical trials. With blood of 6 SCD patients we investigated 3 of those drugs (GBT440, 5‐PMFC, and INN312) for their efficacy on directly preventing hypoxia‐induced sickling using the oxygenscan as readout. GBT440 showed a large improvement in oxygenscan parameters at a concentration of 1 mM and an even larger effect at 2 mM (Figure 2A). After incubation with GBT440, EImax slightly decreased. In contrast, EImin increased with increasing doses of GBT440, which was significant for 2 and 5 mM (P = 0.005 and 0.001, Figure 2B). Similar to these findings, DeltaEI and PoS significantly improved with increasing GBT440 concentration (P < 0.001, Figure 2C and D). Area significantly improved as well (P < 0.001). The same pattern was observed with 5‐PMFC and INN312, with the latter showing the higher efficacy of the two (Figure 2B‐E). However, at dosages of 1 mM the effect of these 2 compounds was lower compared to GBT440 (Figure 2B‐E): EImin increased with 1 mM and significantly increased with 5 mM (P < 0.001), DeltaEI decreased significantly with 5‐PMFC 5 mM (P < 0.001) and INN312 1 and 5 mM (P < 0.01). PoS decreased in both concentrations of 5‐PMFC and INN312, with 5 mM being significant in both (P < 0.001).
Figure 2.
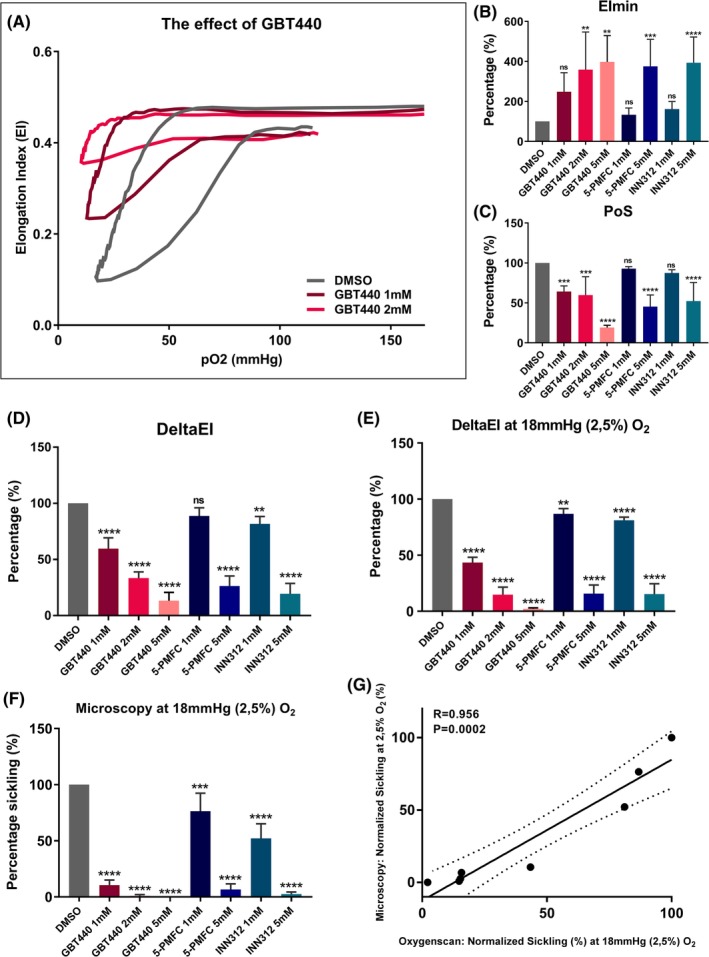
Effect of pharmacologic modulators of HbS polymerization on Oxygenscan parameters. Incubations were carried out with n = 3 in case of 2 and 5 mM GBT440, n = 6 in other incubations). (A) Representative graph of effect of in vitro treatment of RBCs of patients with SCD with GBT440 1 and 2 mM. (B) Normalized means of minimum Elongation Index (EImin) of RBCs incubated in absence or presence with different concentrations of antisickling agents. (C) Normalized means of Point of Sickling (PoS). (D) Normalized means of DeltaEI (difference between EImax and EImin) which represents sickling capacity. (E) Normalized means of DeltaEI at the specific pO2 tension of 18 mmHg (2.5% O2). (F) Normalized sickling after incubation in absence or presence of antisickling agents, measured by microscopy, after deoxygenation at 18 mmHg (2.5% O2). G, Linear correlation between Oxygenscan measured sickling by DeltaEI and microscopy. Error bar represents SD. ****P < 0.0001, ***P < 0.001, ** P < 0.01, *P < 0.05., ns, not significant. Dashed lines represent 95% confidence intervals
Importantly, when oxygenscan parameters were compared with the conventional sickling assay (microscopy), the results showed similar patterns and were correlated (r = 0.934 P = 0.002, Figure 2F and G). However at a lower concentration of GBT440, and to lesser extent also 5‐PMFC and INN312, a slightly larger antisickling effect was observed with the conventional sickling assay (Figure 2F).
3.5. The oxygenscan is able to discriminate between different genotypes and treatment regimens
In order to investigate if the oxygenscan can detect differences between genotypes and treatment regimens, oxygenscans were performed with whole blood of 21 individuals with SCD, 5 individuals with HbS trait, and 5 healthy controls (HC). Homozygous patients without treatment (HbSS untreated, n = 7) were compared to HbSS patients treated with HU (n = 5), HbSS patients treated with exchange transfusion (n = 3), HbS/βothalassemia (n = 1), HbSS patients with α‐thalassemia (n = 2), hemoglobin SC disease patients (HbSC, n = 3), HbS traits (n = 5) and HC (n = 5). Representative curves of groups with 3 or more patients are shown in Figure 3A‐D, with the mean of the different groups of EImax, EImin, PoS, and Recovery shown in Figure 3E‐H. Absolute values of all oxygenscan parameters are reported in Supporting Information Table S2. A significant decrease of PoS was seen in all groups compared to untreated HbSS patients, except HbSS individuals who had been recently transfused. Recovery was significantly lower in HbSC patients compared to all the other groups. These results show that the oxygenscan is able to discriminate between different genotypes and treatment regimens.
Figure 3.
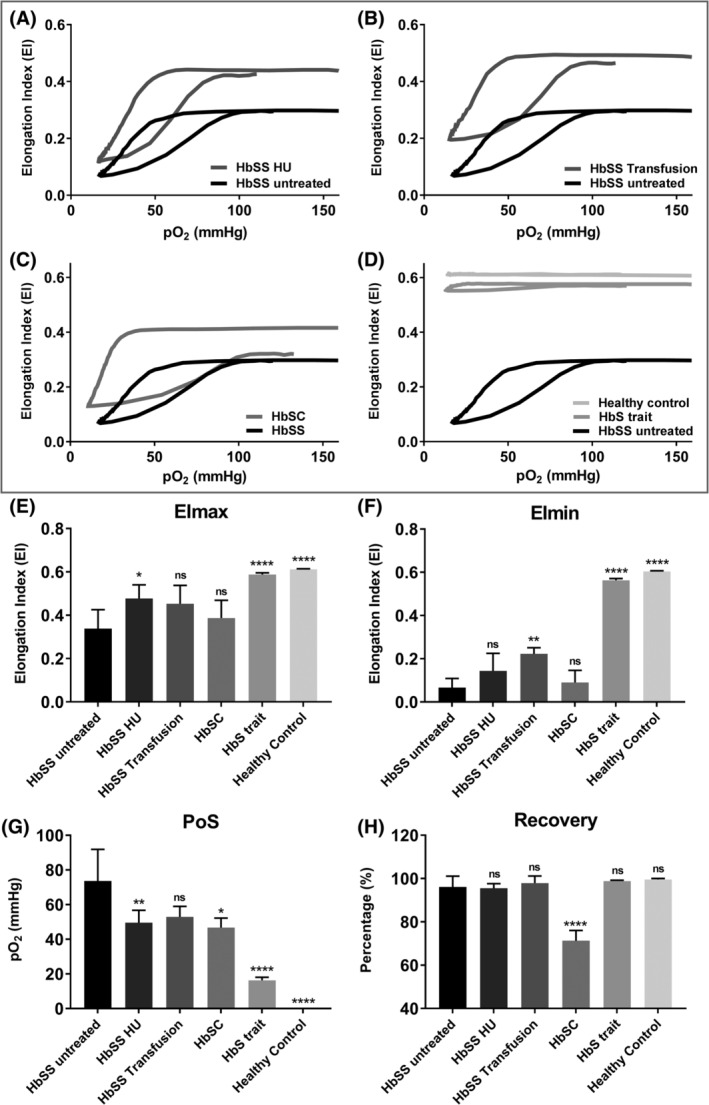
Oxygenscan parameters in relation to different genotypes and treatment of patients with SCD. (A) Representative graph of RBCs of Hydroxyurea treated homozygous SCD patients (HbSS HU) in relation to untreated HbSS patients. (B) Representative graph of RBCs of HbSS patients treated with blood transfusion (HbSS transfusion). (C) Representative graph of RBCs of patients with Hemoglobin SC Disease (HbSC). (D) Representative graph of RBCs of HbS carriers (HbS trait) and healthy controls. (E) Means of maximum Elongation Index (EImax) in various conditions mentioned earlier. (F) Means of minimum EI (EImin) in various conditions. (G) Means of Point of Sickling (PoS, pO2 when 5% decrease in EI is reached) in various conditions. (H) Means of Recovery (% of start EI) in various conditions. Error bar represents SD. ****P < 0.0001, ***P < 0.001, ** P < 0.01, *P < 0.05., ns, not significant
When levels of HbF and HbS of patients with HbSS, HbSβ0, HbSS/α‐thalassemia with/without HU, were correlated with oxygenscan parameters, EImin showed the strongest correlations (r = 0.833 and r = −0.852, both P < 0.001, Figure 4A‐B and Supporting Information Figure S5). Digital microscopy findings of these patients were also correlated with oxygenscan parameters. EImax showed the strongest correlation with sickled cells at normoxia (r = 0.596, P = 0.019, Figure 4C).
Figure 4.
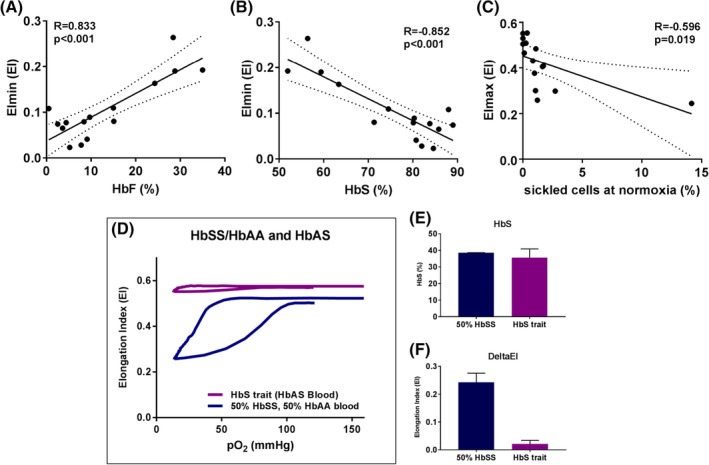
Oxygenscan parameters are associated with HbF, HbS, and sickled cells at normoxia. (A) Linear correlation of minimum Elongation Index (EImin) and HbF. (B) Linear correlation of EImin and %HbS. (C) Linear correlation of maximum EI (EImax) and % sickled cells at normoxia measured with digital microscopy. (D) Representative curve of the effect of addition of 50% HBAA blood to 50% HbSS blood and a representative curve of HbS trait. (E) Percentage HbS in the mixture of 50% HbSS blood with 50% HbAA blood (n = 2) and HbS trait (n = 5). (F) DeltaEI in both groups mentioned earlier. Dashed lines represent 95% confidence intervals. Error bar represents SD
4. DISCUSSION
The oxygenscan is a rapid and reproducible technique, that is developed to assess RBC sickling under automated continuous deoxygenation and reoxygenation. We report for the first time on the potential of the oxygenscan to monitor clinical conditions and parameters that influence HbS polymerization. We found strikingly strong correlations of oxygenscan parameters with physiological and pharmacological modulators of HbS polymerization that are much stronger than in previously reported assays.11 Importantly, diverse physiologic and pharmacologic conditions correlated best with particular oxygenscan parameters. This underlines the specificity of the various oxygenscan parameters: Conditions mimicking exchange blood transfusion were found to specifically affect EImin, similarly to HbF and HbS levels (Figure 4A‐B). Physiological modulators of oxygen affinity predominantly affected PoS (Supporting Information Figures S2 and S3). Regarding in vivo treatment of SCD, our findings show that RBCs of untreated HbSS patients start to sickle at higher oxygen tensions. Treatment with either HU or transfusion lowers the PoS indicating a lower pO2 at which cells start to sickle. In case of HbSC patients, Recovery is significantly lower compared to the other groups indicating distinct processes of unsickling.28 We speculate that this reduced capacity to recover could be involved in the distinct vaso‐occlusive phenotype of HbSC patients.
4.1. EImin is a reliable biomarker of the efficacy of blood transfusion
Our results show a strong correlation of EImin with the distribution of HbS, HbF, and HbA, and their effect on polymerization (Figure 2B, 3F, and 4A‐B). EImin shows the deformability at the point of minimal pO2 during an oxygenscan and reflects how many cells are sickled. The physiological ranges of intravascular pO2 tension differ between tissues and blood vessel diameters, with the lowest values found in the bone marrow of live animals (ie, 17.7 mmHg).29, 30 Oxygenscans curves reach at least 20 mmHg in >95% of measurements, with a mean of 15.9 mmHg (SEM 0.17). The minimal pO2 during the oxygenscan is yet another relevant functional characteristic. In contrast to other sickling assays, in which a nonphysiologically low pO2 is used, often during several hours. Other assays use sodium metabisulfite, which depletes RBCs fully from oxygen. Both techniques result in full sickling of RBCs, even in sickle cell trait. The fact that oxygenscans of individuals with sickle cell trait do not show any significant sickling behavior compared to patients with SCD underlines the physiological applicability of the oxygenscan (Figure 3A‐D and F).
EImin therefore is a potent parameter for assessing the direct effects of blood transfusion and distribution of HbS, HbF, and HbA. We suggest EImin is mostly predicted by the percentage of cells that are not able to sickle at all and therefore is most influenced by blood transfusion and F‐cells.
4.2. The potency of antisickling agents is captured by DeltaEI
DeltaEI can be used as outcome parameter in the assessment of the efficacy of new treatments that inhibit sickling. As shown by the experiments mimicking blood transfusion (Supporting Information Figure S1), DeltaEI reflects the percentage of RBCs that sickle upon deoxygenation and as such is comparable with the conventional sickling assays (microscopy). In our experiments with the antisickling agents GBT440, 5‐PMFC, and INN312, data of the conventional assay were compared to DeltaEI and a similar pattern was observed (Figure 2E‐F). Overall, the effects were more pronounced in the conventional assay, which could be due to a longer exposure to hypoxic conditions in the latter. This results in a higher amount of sickled cells at the start, and thus a more pronounced effect of antisickling agents. Importantly, cells that sickle instantly do not have the “sickle” shape but a more irregularly shaped or “star” shaped appearance, also called “mosaic” cells.31 These cells have a different orientation in the flow in the Lorrca than fully sickled RBCs and, hence, behave differently in deformability measurements. Moreover, such cells are regarded as sickled cells but they likely are still able to deform to a certain extent. This could account for the less pronounced effect of antisickling agents as determined by the oxygenscan.
DeltaEI has a strong correlation with percentage HbSS blood (Supporting Information Figure S1J) and can distinguish between a mixture of HbSS and HbAA RBCs and a population of HbAS RBCs (HbS trait, Supporting Information Figure S1C, S3D and 4D‐F). A feature that could be very helpful for upcoming gene‐therapy trials in which an assay is needed that discriminates between mixed chimerism of fully corrected cells (50% HbAA and 50%HbSS) and fully engraftment of half corrected (100% HbAS) cells. Therefore DeltaEI is an useful parameter, in particular in the evaluation of individuals with HbS trait and the development of new treatment strategies.
4.3. PoS discriminates between genotypes and different treatment regimens
We show that PoS correlates with 2,3‐DPG levels and other modulators that have an effect on the hemoglobin dissociation curve, such as pH and temperature (Supporting Information Figure S2A, B, F, and J). PoS is unique in its ability to determine the pO2 at which RBCs start to sickle, and is therefore of high value in the development and clinical testing of new drugs, in particular antisickling agents. When considering individuals with HbS trait, PoS has a distinct value in this group compared to controls and SCD patients (Figure 3G). PoS also is the most informative parameter when considering different treatment in groups of SCD patients.
Based on these observations we conclude that PoS likely reflects properties of an individual's hemoglobin dissociation curve.
4.4. EImax reflects percentage of sickled cells at normoxia and RBC hydration
In whole blood, the percentage of sickled cells at normoxia compared to relatively healthy cells seems to have the most pronounced effect on EImax. The number of sickled cells at normoxia correlated to EImax (Figure 4C), indicating that already sickled cells lower the overall deformability and thereby EImax. We suggest that EImax reflects the percentage of nondeformable cells at ambient air, which are the dense cells containing HbS polymer and sickled cells at normoxia.
4.5. Comparison with other hypoxic deformability assays
In the past several approaches to measure RBC deformability under hypoxic conditions have been developed. All but one were based on a deoxygenation step that took place outside the ektacytometer.32, 33, 34, 35 In contrast to the oxygenscan, these approaches involved either a deoxygenation or reoxygenation step, or used hypoxia and normoxia as different conditions. A very recent study demonstrated a strong effect of GBT440 on RBC deformability, but no pO2 could be determined and related to the measurements.36 The oxygenscan allows now for the first time the study of sickling behavior during both automated deoxygenation and reoxygenation in a reproducible and fast manner.
One of the strengths of the oxygenscan is that deformability is measured at a whole range of different oxygen tensions. Furthermore, the technique has an excellent reproducibility, the time to perform an oxygenscan measurement is relatively short and it takes only a small amount of whole blood. More importantly, the oxygenscan is a functional assay that determines various aspects of the sickling process, each represented by different parameters.
A limitation of the technique is that measurements are performed on the total RBC population. Therefore, individual differences in cellular behavior or subpopulations of cells are not considered and, consequently, outcome parameters always reflect the mean behavior of all cells. Also, the minimal pO2 during deoxygenation does not reach 0 mmHg. Although this pO2 is not a physiologically relevant value, it would be of interest to measure in order to see how much the EI would further decrease.
Our data show that apart from the influence of HbF, HbS, and HbA, this assay also takes individual hemoglobin dissociation curves and percentage of sickled cells at normoxia into account. Therefore, the oxygenscan is an assay which simultaneously determines a number of clinically important factors involved in SCD pathophysiology. As such it may represent a better alternative for the conventional sickling assay and fill the clinical need for a reliable biomarker. Current studies are aimed at investigating the applicability of the oxygenscan in the determination of clinical severity and vaso‐occlusive crisis, as well as a more comprehensive analysis of the effect of current and new treatment strategies.
CONFLICT OF INTEREST
The authors declare no conflicts of interest.
AUTHOR CONTRIBUTIONS
Study design: Rab, van Oirschot, van Beers, and van Wijk
Performed experiments: Rab, van Oirschot, Bos, Merkx, van Wesel, Abdulmalik, Versluijs, Houwing, Riedl
Provided new drugs: Safo, Abdulmalik
Data analysis: Rab, van Beers, van Wijk
Manuscript writing: Rab, van Beers, van Wijk, van Oirschot, Abdulmalik, Safo, Houwing, Cnossen, Bartels, Schutgens, Pasterkamp
Supporting information
Appendix S1: Supplemental Methods
ACKNOWLEDGMENTS
This research has been funded in part by Eurostars grant estar18105 and by an unrestricted grant provided by RR Mechatronics. This work was supported in part by NIH/NIMHD grant MD009124 (MKS).
The authors would like to thank Jan de Zoeten and Sisto Hendriks of RR Mechatronics for the technical support of the oxygenscan.
Rab MAE, van Oirschot BA, Bos J, et al. Rapid and reproducible characterization of sickling during automated deoxygenation in sickle cell disease patients. Am J Hematol. 2019;94:575–584. 10.1002/ajh.25443
Funding information Eurostars, Grant/Award Number: estar18105; NIH/NIMHD Grant, Grant/Award Number: MD009124; RR Mechatronics, Grant/Award Number: unrestricted grant
REFERENCES
- 1. Poillon WN, Kim BC, Labotka RJ, Hicks CU, Kark JA. Antisickling effects of 2,3‐diphosphoglycerate depletion. Blood. 1995;85(11):3289‐3296. [PubMed] [Google Scholar]
- 2. Mohandas N, Evans E. Adherence of sickle erythrocytes to vascular endothelial cells: requirement for both cell membrane changes and plasma factors. Blood. 1984;64(1):282‐287. [PubMed] [Google Scholar]
- 3. Mohandas N, Evans E. Sickle cell adherence to vascular endothelium: morphologic correlates and the requirement for divalent cations and collagen‐ binding plasma proteins. J Clin Invest. 1985;76(4):1605‐1612. [DOI] [PMC free article] [PubMed] [Google Scholar]
- 4. Papageorgiou DP, Abidi SZ, Chang H‐Y, et al. Simultaneous polymerization and adhesion under hypoxia in sickle cell disease. Proc Natl Acad Sci. 2018;115(38):9473–9478. [DOI] [PMC free article] [PubMed] [Google Scholar]
- 5. Kato GJ, Piel FB, Reid CD, et al. Sickle cell disease. Nat Rev Dis Prim. 2018;4:1‐22. 10.1038/nrdp.2018.10. [DOI] [PubMed] [Google Scholar]
- 6. Antoniani C, Meneghini V, Lattanzi A, et al. Induction of fetal hemoglobin synthesis by CRISPR/Cas9‐mediated editing of the human β‐globin locus. Blood. 2018;131(17):1960‐1973. [DOI] [PubMed] [Google Scholar]
- 7. Abdulmalik O, Ghatge MS, Musayev FN, et al. Crystallographic analysis of human hemoglobin elucidates the structural basis of the potent and dual antisickling activity of pyridyl derivatives of vanillin. Acta Crystallogr Sect D Biol Crystallogr. 2011;67(12):1076. [DOI] [PMC free article] [PubMed] [Google Scholar]
- 8. Oder E, Safo MK, Abdulmalik O, Kato GJ, Discovery D. New developments in anti‐sickling agents: can drugs directly prevent the polymerization of sickle Haemoglobin in vivo? Br J Haematol. 2016;175(1):24‐30. [DOI] [PMC free article] [PubMed] [Google Scholar]
- 9. Oksenberg D, Dufu K, Patel MP, et al. GBT440 increases haemoglobin oxygen affinity, reduces sickling and prolongs RBC half‐life in a murine model of sickle cell disease. Br J Haematol. 2016;175(1):141‐153. [DOI] [PubMed] [Google Scholar]
- 10. Xu GG, Pagare PP, Ghatge MS, et al. Design, synthesis, and biological evaluation of Ester and Ether derivatives of Antisickling agent 5‐HMF for the treatment of sickle cell disease. Mol Pharm. 2017;14(10):3499‐3511. [DOI] [PMC free article] [PubMed] [Google Scholar]
- 11. van Beers EJ, Samsel L, Mendelsohn L, et al. Imaging flow cytometry for automated detection of hypoxia‐induced erythrocyte shape change in sickle cell disease. Am J Hematol. 2014;89(6):598‐603. [DOI] [PMC free article] [PubMed] [Google Scholar]
- 12. Smith C, Kuettner J, Tukey D, White J. Variable deformability of irreversibly sickled erythrocytes. Blood. 1981;58(1):71‐78. [PubMed] [Google Scholar]
- 13. Clark MR, Mohandas N, Shohet SB. Deformability of oxygenated irreversibly sickled cells. J Clin Invest. 1980;65(1):189‐196. [DOI] [PMC free article] [PubMed] [Google Scholar]
- 14. Clark M, Mohandas N, Embury S. Lubin B. A simple laboratory alternative to irreversibly sickled (ISC) counts. Blood. 1982;60(3):659‐663. [PubMed] [Google Scholar]
- 15. DaCosta L, Suner L, Galimand J, et al. Blood cells , molecules and diseases diagnostic tool for red blood cell membrane disorders : assessment of a new generation ektacytometer. Blood Cells . Mol Dis. 2016;56(1):9‐22. [DOI] [PMC free article] [PubMed] [Google Scholar]
- 16. Lazarova E, Gulbis B, Van Oirschot B, Van Wijk R. Next‐generation osmotic gradient ektacytometry for the diagnosis of hereditary spherocytosis: Interlaboratory method validation and experience. Clin Chem Lab Med. 2017;55(3):394‐402. [DOI] [PubMed] [Google Scholar]
- 17. Llaudet‐Planas E, Vives‐Corrons JL, Rizzuto V, et al. Osmotic gradient ektacytometry: a valuable screening test for hereditary spherocytosis and other red blood cell membrane disorders. Int J Lab Hematol. 2018;40(1):94‐102. [DOI] [PubMed] [Google Scholar]
- 18. Zaninoni A, Fermo E, Vercellati C, et al. Use of laser assisted optical rotational cell analyzer (LoRRca MaxSis) in the diagnosis of RBC membrane disorders, enzyme defects, and congenital dyserythropoietic anemias: a monocentric study on 202 patients. Front Physiol. 2018;9(APR):1‐12. [DOI] [PMC free article] [PubMed] [Google Scholar]
- 19. Parrow NL, Tu H, Nichols J, et al. Measurements of red cell deformability and hydration reflect HbF and HbA2in blood from patients with sickle cell anemia. Blood Cells Mol Dis. 2017;65:41‐50. [DOI] [PubMed] [Google Scholar]
- 20. Lemonne N, Lamarre Y, Romana M, et al. Does increased red blood cell deformability raise the risk for osteonecrosis in sickle cell anemia? Blood. 2013;121(15):3054‐3057. [DOI] [PMC free article] [PubMed] [Google Scholar]
- 21. Ballas SK, Larner J, Smith ED, Surrey S, Schwartz E, Rappaport EF. Rheologic predictors of the severity of the painful sickle cell crisis. Blood. 1988;72(4):1216‐1223. [PubMed] [Google Scholar]
- 22. Lande WM, Andrews DL, Clark MR, et al. The incidence of painful crisis in homozygous sickle cell disease: correlation with red cell deformability. Blood. 1988;72(6):2056‐2059. [PubMed] [Google Scholar]
- 23. Ballas SK, Smith ED. Red blood cell changes during the evolution of the sickle cell painful crisis. Blood. 1992;79(8):2154‐2163. [PubMed] [Google Scholar]
- 24. Huisjes R, Solinge WW, Levin MD, Wijk R, Riedl JA. Digital microscopy as a screening tool for the diagnosis of hereditary hemolytic anemia. Int J Lab Hematol. 2017;40(2):159‐168. [DOI] [PubMed] [Google Scholar]
- 25. Metcalf B, Chuang C, Dufu K, et al. Discovery of GBT440, an orally bioavailable R‐state stabilizer of sickle cell hemoglobin. ACS Med Chem Lett. 2017;8(3):321‐326. [DOI] [PMC free article] [PubMed] [Google Scholar]
- 26. Pagare PP, Ghatge MS, Musayev FN, et al. Rational design of pyridyl derivatives of vanillin for the treatment of sickle cell disease. Bioorganic Med Chem. 2018;26(9):2530‐2538. [DOI] [PMC free article] [PubMed] [Google Scholar]
- 27. Abdulmalik O, Safo MK, Chen Q, et al. 5‐Hydroxymethyl‐2‐furfural modifies intracellular sickle haemoglobin and inhibits sickling of red blood cells. Br J Haematol. 2005;128(4):552‐561. [DOI] [PubMed] [Google Scholar]
- 28. Nagel RL, Fabry ME, Steinberg MH. The paradox of hemoglobin SC disease. Blood Rev. 2003;17(3):167‐178. [DOI] [PubMed] [Google Scholar]
- 29. Spencer JA, Ferraro F, Roussakis E, et al. Direct measurement of local oxygen concentration in the bone marrow of live animals. Nature. 2014;508(7495):269‐273. [DOI] [PMC free article] [PubMed] [Google Scholar]
- 30. Intaglietta M, Johnson PC, Winslow RM. Microvascular and tissue oxygen distribution. Cardiovasc Res. 1996;32(4):632‐643. [PubMed] [Google Scholar]
- 31. Asakura T, Mayberry J. Relationship between morphologic characteristics of sickle cells and method of deoxygenation. J Lab Clin Med. 1984;104(6):987‐994. [PubMed] [Google Scholar]
- 32. Bessis M, Feo C, Jones E. Quantitation of red cell deformability during progressive deoxygenation and oxygenation in sickling disorders (the use of an automated Ektacytometer). Blood Cells. 1982;8(1):17‐28. [PubMed] [Google Scholar]
- 33. Sorette MP, Lavenant MG, Clark MR. Ektacytometric measurement of sickle cell deformability as a continuous function of oxygen tension. Blood. 1987;67(6):1600‐1606. [PubMed] [Google Scholar]
- 34. Huang Z, Hearne L, Irby CE, King SB, Ballas SK, Kim‐Shapiro DB. Kinetics of increased deformability of deoxygenated sickle cells upon oxygenation. Biophys J. 2003;85(4):2374‐2383. [DOI] [PMC free article] [PubMed] [Google Scholar]
- 35. Lu X, Chaudhury A, Higgins JM, Wood DK. Oxygen‐dependent flow of sickle trait blood as an in vitro therapeutic benchmark for sickle cell disease treatments. Am J Hematol. 2018;93(10):1227‐1235. [DOI] [PMC free article] [PubMed] [Google Scholar]
- 36. Dufu K, Patel M, Oksenberg D, Cabrales P. GBT440 improves red blood cell deformability and reduces viscosity of sickle cell blood under deoxygenated conditions. Clin Hemorheol Microcirc. 2018;70(1):95‐105. [DOI] [PMC free article] [PubMed] [Google Scholar]
Associated Data
This section collects any data citations, data availability statements, or supplementary materials included in this article.
Supplementary Materials
Appendix S1: Supplemental Methods