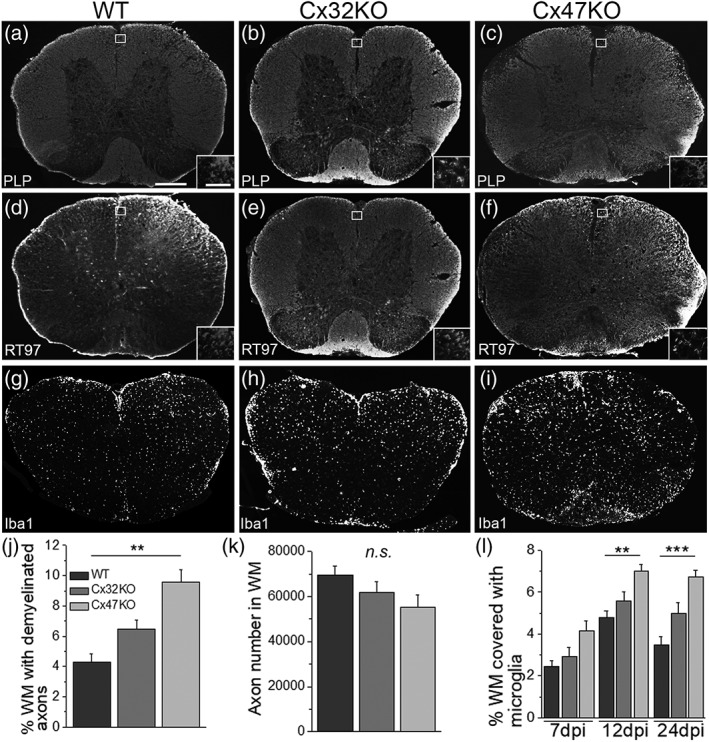
Figure 2.

Pathological features of EAE in connexin mutants. These are representative images of whole lumbar spinal cord sections from EAE mice at 24 dpi, stained as indicated with antibodies to myelin marker PLP (a–c) to quantify myelin loss and with axonal neurofilament marker RT97 to quantify axonal loss (d,e), or for microglial marker Iba‐1 (g–i). Areas exhibiting loss of myelin as well as diffuse microglia activation appear more extensive in connexin deficient mice, especially in the Cx47KO. Insets show areas near the lesions at higher magnification. (j) Quantification of myelin loss (% of WM with lack of PLP immunoreactivity) (n = 4 mice per genotype at 24 dpi) showed significantly more myelin loss in Cx47KO compared with WT group, but not between WT and Cx32KO or between Cx32KO and Cx47KO groups. (k): Counts of axons (total number of axons in WM; n = 4 mice per group) show a trend for more severe loss in Cx47KO than in Cx32KO than in WT EAE mice, but these differences were not statistically significant. (l) Quantification of % WM area covered with Iba1 immunofluorescence at 7, 12, and 24 dpi shows more activated microglia in the Cx47KO compared with either the WT or Cx32KO EAE groups at all time points; these differences reach statistical significance at 12 and 24 dpi, but not at 7 dpi (data in j–l data represent mean ± SEM); Student's t‐test with Bonferroni correction and statistical threshold adjusted to *p < .0167; **p < .01; ***p < .001; only statistically significant differences are shown). Scale bars: In a = 100 μm; in inset (a) =30 μm
