

Abstract
Background
Human papillomavirus (HPV)‐positive oropharyngeal squamous cell carcinoma (OPSCC) is a highly immunogenic tumor and differences in tumor microenvironment might contribute to the improved survival of HPV‐positive OPSCC patient.
Methods
A comprehensive multivariate analysis with clinical and immune variables (human leukocyte antigen [HLA] I/II, programmed death ligand 1 (PD‐L1), programmed death receptor 1 (PD1), T cells, and macrophages) was performed in 142 OPSCC patients.
Results
We found an inverse correlation between the expression of HLA class II molecules on tumor cells and CD68+ CD163+ tumor‐associated macrophages (TAMs). High HLA‐DP/DQ/DR expression and low number of TAMs were associated with longer disease‐specific survival and disease‐free survival (DFS). Furthermore, a new population of CD8+ FoxP3+ T cells was correlated with shorter DFS in multivariate analysis.
Conclusions
\We identified new prognostic markers for patients with oropharyngeal cancer, which can be used for selecting patients that can benefit from immunotherapy.
Keywords: HLA‐II, HPV infection, microenvironment, oropharyngeal cancer, TAMs
Abbreviations
- DFS
disease‐free survival
- DSS
disease‐specific survival
- HPV
human papillomavirus
- OPSCC
oropharyngeal squamous cell carcinoma
- OS
overall survival
- TAMs
tumor‐associated macrophages
1. INTRODUCTION
Head and neck cancer is the 6th most common cancer worldwide and about 90% of the head and neck cancers are squamous cell carcinomas (HNSCC).1 The most important etiological factors of HNSCCs are the genetic predisposition, the use of tobacco and/or alcohol, and the infection with high‐risk human papillomavirus (HPV) subtypes, most notably HPV16.2 HPV‐positivity is predominantly associated with oropharyngeal squamous cell carcinoma (OPSCC). In these patients, HPV status, smoking history, tumor (T) and lymph node (N) stage represent strong prognostic markers for treatment outcome.3
HPV‐positive OPSCCs have longer disease‐free survival (DFS) and disease‐specific survival (DSS) compared to HPV‐negative OPSCCs.4 There is strong indication that the tumor microenvironment plays a pivotal role in the pathogenesis and clinical behavior of various malignancies5 and that the increased immune reactivity of HPV‐positive OPSCCs might contribute to a favorable clinical outcome.6, 7, 8 Although several studies previously addressed the role of specific subsets of immune cells in OPSCC development and progression,9, 10, 11, 12 there is still a need for comprehensive analyses of the heterogeneity and complexity of the tumor microenvironment.
In the tumor microenvironment, various subsets of immune cells interact together to either promote or suppress tumor cells growth.13 Tumor cells expressing the human leukocyte antigen I (HLA‐I) complex are recognized by CD8+ T cells promoting T‐cell‐specific tumor cytotoxicity.14 Furthermore, expression of HLA‐II on antigen‐presenting cells (APCs) promotes the CD4+ T‐helper‐mediated activation of B cells as well as cytotoxic CD8+ T cells.15 Importantly, numbers of CD8+ tumor‐infiltrating T cells have been recently described as markers for improved prognosis in oropharyngeal cancer.16
By contrast, several mechanisms were proposed to promote tumor growth. Tumor cells, indeed, can escape killing by expressing the programmed death ligand 1 (PD‐L1), which, upon binding to the PD1 receptor on T cells, leads to suppression of T‐cell activation and cytotoxicity.17, 18 However, PD‐L1 expression is not only limited to tumor cell as the presence of PD‐L1+ tumor‐associated macrophages (TAMs) was shown to be associated with functionally anergic CD4+ T cells in HNSCC.
Furthermore, increased numbers of CD4+ FoxP3+ regulatory T cells were associated with an unfavorable prognosis,19, 20, 21 however, results were controversial as other studies observed opposite results.22, 23 The complexity of the CD4+ FoxP3+ population was also elucidated in colorectal cancer, where instability of FoxP3 was associated with less immunosuppressive T‐cell phenotypes.24
In addition, CD68+ TAMs, commonly identified by the expression of CD163, CD206, or CD204,25 also sustain the development and progression of many tumors, including oropharyngeal cancer, by suppressing the cytotoxic activity of CD8+ T cells, and promoting angiogenesis and tumor cell migration.26, 27, 28
In this retrospective study, we aim to obtain a comprehensive “immune signature” of the HPV‐negative and HPV‐positive OPSCCs using immunohistochemistry (IHC) and immunofluorescence (IF) techniques for HLA expression, the presence of innate and adaptive immune cells and explore their correlation with clinical outcome. Ultimately, with the implementation of univariate and multivariate analysis, we aim to find independent prognostic factors for DFS and DSS of OPSCC patients.
2. PATIENTS AND METHODS
2.1. Patient and tumor characteristics
This study was undertaken with the written consent of all patients. The study was performed in accordance with the Code of Conduct of the Federation of Medical Scientific Societies in the Netherlands. A total of 142 patients diagnosed with OPSCC treated at the Dutch Cancer Institute Antoni van Leeuwenhoek hospital in Amsterdam, the Netherlands, between 1998 and 2007 were included in this study. Two hundred patients were initially included in our cohort. Selection was based on treatment (radiotherapy [RT] or chemoradiotherapy [CRT]). Out of 200 patients, 30 could not be included in the study due to the limitation of the material and 28 samples could not be used for automatic scoring of IF staining due to the low quality of the tissue. Included were patients diagnosed with a T1‐4N1‐3M0 OPSCC (7th AJCC edition) treated with RT or CRT in a curative setting. Archival diagnostic FFPE tumor specimens taken at the time of diagnosis were retrieved from the Core Facility Molecular Pathology (CFMP).
Clinical data were collected retrospectively by reviewing patients' medical files. Disease‐free survival (DFS) was calculated as time from date of diagnosis and time to local or regional recurrence, distant metastasis, or death. Disease‐specific survival (DSS) was calculated as time from date of diagnosis and time of death due to the disease (eg, evidence of recurrence, metastasis, patient refused treatment, no more treatments available, or compliance of the disease). Overall survival (OS) included any cause of death. Death due to other causes included: no evidence of disease, failures, other disease or unknown reasons. Minimal follow‐up time was 3 years.
2.2. Treatment
Prior to definitive RT, an excision biopsy was performed in 13 patients by tonsillectomy (n = 11), uvula resection (n = 1) and anterior pharyngeal wall excision (n = 1). Three patients received a selective neck dissection and 27 patients a (modified) radical neck dissection. Consecutively, 51 (36%) patients were treated with RT alone, 1 patient was treated with concurrent cetuximab (400 mg/m2 loading dose, 250 mg/m2 weekly). All other patients were treated with platinum‐based concurrent CRT. Multiple dose regimens have been administered both intravenous and intra‐arterial, for example, low dose (6 mg/m2 daily or 40 mg/m2 weekly, n = 26), high dose cisplatin i.v. 100 mg/m2 on day 1, 21, and 43 (n = 43) and 150 mg/m2 i.a. weekly in the first 4 weeks of treatment (n = 21). Patients were treated with 3D conformal RT between 1998 and 2005. Intensity‐modulated radiotherapy was gradually introduced in 2006. Radiation treatment consisted of an elective irradiation dose of 46 Gy in 23 fractions (sequential) or 54.25 Gy in 35 fractions (concomitant) followed by a boost to the primary tumor and the involved nodes resulting in a total dose of 70 Gy.
2.3. Immunohistochemical staining
Standard IHC was applied on whole slide tissue sections taken from archival formalin‐fixed, paraffin embedded (FFPE) tumor samples. IHC was performed on a BenchMark Ultra autostainer (Ventana Medical Systems, Mountain View, California). FFPE sections were cut at 3 μm, heated at 75°C for 28 minutes and deparaffinized in the instrument with EZ prep solution. Heat‐induced antigen retrieval was carried out using cell conditioning 1 for 32 minutes at 95°C or 64 minutes at 95°C.
The antibodies used for staining are shown in Supporting Information Table S1. Incubation was performed at 37°C for 32 minutes for all the antibodies except PD‐L1, which was incubated for 64 minutes at room temperature.
Bound antibodies were detected using the OMap anti‐Rb HRP or OMap anti‐Ms HRP for 12 minutes at 37°C, after which the ChromoMap DAB Kit was applied. Slides were counterstained with Hematoxylin and Bluing Reagent.
For p16, signal amplification was applied using the Optiview Amplification Kit. Bound antibody was detected using the OptiView DAB Detection Kit. Slides were counterstained with Hematoxylin II and Bluing Reagent. All reagents were purchased from Ventana Medical Systems. Antibodies used for IHC were: HLA‐HCA2, HLA‐HC10, β2‐microglobulin, HLA‐DRA, HLA‐DP/DQ/DR, PD1, PD‐L1, P53, and P16. Antibodies used for IF were CD4, CD8, CD68, FoxP3, CD163, and panCK. Details can be found in Supporting Information Table S1.
2.4. Multiplex IF staining
Paraffin sections were cut at 3 μm and heated for 30 minutes at 69°C and subsequently deparaffinized and rehydrated using a Multistainer (Leica, ST5020, Amsterdam, The Netherlands). Afterwards, slides were fixed using neutrally buffered formalin for 20 minutes. After rinsing in distilled water, antigen retrieval was performed using AR9 solution (Perkin Elmer, AR900, Rotterdam, The Netherlands). Antibodies used for the multiplex IF are listed in Supporting Information Table S1. All antibodies were incubated for 30 minutes at room temperature except CD4 and CD8, which were incubated for 2 hours and 1 hours, respectively. Opal Polymer HRP Ms + Rb (Perkin Elmer, ARH1001EA, 10 minutes. at RT) was used as secondary antibody. Visualization of antibody binding was performed using Opal520, Opal540, Opal570, Opal620, Opal650, or Opal690. Stripping of the antibody complex in between staining cycles was performed using microwave treatment for 15 minutes at 100°C in AR6 (Perkin Elmer, AR600) or AR9 buffer solution as appropriate. Slides were counterstained with DAPI (Perkin Elmer, FP1490) and rinsed with distilled water and mounted with ProLong Diamond Antifade Mounting Medium (Molecular Probes, P36970). The antibodies used for staining are listed in Supporting Information Table S1.
2.5. Human papillomavirus detection
IHC detection of p16ink4a and p53 was used for HPV status assessment as proposed previously,29 P16 was scored as positive or negative with a cutoff of intense diffuse nuclear or cytoplasmic staining of >70%, whereas p53 staining was scored as “wild‐type” expression or “mutation pattern.”30 As FFPE material was old, no further HPV16 molecular testing could be performed due to the low quality of DNA.
2.6. Scoring system for immunohistochemical staining
HLA‐I (HCA2, HC10, β2‐microglobulin), HLA‐II (DRA, DP/DP/DR), and PD‐L1 expression were scored manually by two researchers (Bianca Cioni and Katherine Tan) together with a dedicated head and neck pathologist (Stefan Willems). All were blinded to patient clinical status and treatment outcome. For PD‐1 scoring an automated scoring was performed (see below).
Molecules of the HLA‐I complex were scored on tumor cells only, whereas HLA‐DRA and HLA‐DP/DQ/DR were scored on tumor cells and stromal cells surrounding the tumor (further referred as “tumor” and “stroma”). PD‐L1 was scored on tumor cells in the center of the tumor (PD‐L1 tumor), at the invasive margins of the tumor (PD‐L1 margins) and in the tumor surrounding stromal cells (PD‐L1 stroma). PD1 was scored on tumor surrounding stromal cells (PD1 stroma). The format of the output results was expressed as categorical data.
2.6.1. HLA‐I and II
HLA‐I and II scoring was performed as previously described.31 Briefly, HLA status was scored in two ways: (1) the number of positive cells (%) and (2) the staining intensity. The number of positive cells was categorized as: 0 = <1%, 1 = 1‐5%, 2 = 6‐25%, 3 = 26‐50%, 4 = 51‐75%, and 5 = >75%. The intensity of the staining was categorized as 1 = absent, 2 = weak and 3 = strong. The two scores of the number of positive cells and intensity of the staining were summed up and integrated into four categories: (1) Negative (1), (2) “weak expression” (2‐4), (3) “moderate expression” (5‐6), and (4) “high expression” (7‐8). Of note, for HLA‐I, weak and moderate expression were combined and further defined as “downregulated.” In addition, a “negative” HLA‐I staining is further referred to as “loss.”32 For HLA‐II and β2‐microglobulin (β2M) scoring was divided into “negative” (negative and weak) and “positive” (moderate and high).
2.6.2. PD‐L1 and PD1
PD‐L1 expression was scored as number of positive cells in either tumor, margins or tumor‐associated stroma (with a cutoff value of 5%).17 PD1 staining was used for optimization of the scoring system using the Vectra 3.0 automated imaging system (PerkinElmer, Hopkinton, MA), and InForm software version 2.2 (PerkinElmer, Hopkinton, MA). Representative analysis was performed on 11% of the total stromal area in 20× magnification. Regions of interest were selected by an experienced pathologist (Stefan Willems) and an algorithm was created to identify nuclei in the tumor or in the surrounding stroma separately. Results obtained were percentage of positive cells in the tumor‐associated stroma compared to the total area. The median value was used as a cutoff for positive or negative cases. For 15 random sections, the data obtained from the score of 11% of the tissue was compared with the data obtained from the score of the entire tissue and no differences were observed in terms of percentage of positive cells (data not shown).
2.7. Quantification of the multiplex staining
Whole slide scans were taken at 4× magnification using Vectra 3.0 automated imaging system (PerkinElmer, Hopkinton, MA). Afterwards, stromal or tumorous regions were selected by an experienced pathologist (Stefan Willems). Selected regions were scanned at 20× magnification and analyzed using InForm software version 2.2 (PerkinElmer, Hopkinton, MA). An algorithm was created to allow batch analysis of all distinct phenotypes. Obtained results were verified (Stefan Willems). Data are expressed as number of positive cells per surface area (mm2) in the tumor area or in the tumor‐associated stromal area. Results were represented as continuous data. Tumor area was identified with the help of the pathologist and segmented in tails (containing tumor or in proximity of the tumor). Segmentation of the tissue in “tumor” and “tumor‐associated stroma” was performed in each tail and markers were scored in both regions (data not shown).
2.8. Statistical analysis
Patients and tumor characteristics were compared between HPV groups using Wilcoxon matched‐pairs test or Chi‐square test. To evaluate the impact of clinical, immunohistochemical, and IF measurements on progression, univariate analysis and two types of multivariate analyses were used: Cox proportional hazards regression model (with preselected variables with P < .1 from univariate analysis), as well as competing risks models based upon subdistribution functions.33 In order to correct for differences between treatment arms, models were fitted using treatment stratification. Analyses were run in R using the packages “survival” and “cmprsk.” In all cases, a significance level of 5% was used to consider tests as statistically significant. Multivariate analysis with clinical and IHC variables included HPV status, gender, smoking, T classification, HLA‐HC10, HLA‐HCA2, β2M, HLA‐DRA (stroma and tumor), HLA‐DR/DP/DQ (stroma and tumor), PD‐L1 (stroma, tumor, and margins), PD1 (stroma and tumor). Multivariate analysis with clinical and IF variables included HPV, gender, smoking, T classification, CD163 (stroma and tumor), CD4 (stroma and tumor), CD4+ FoxP3+ (stroma and tumor), CD68 (stroma and tumor), CD68+ CD163+ (stroma and tumor), CD8 (stroma and tumor), and CD8+ FoxP3+ (stroma and tumor).
Spearman test was used for correlation analysis (competing risks model). Interaction terms were added to the regression model to understand the relationships among selected variables.
3. RESULTS
3.1. Patients and tumor characteristics
A total of 142 patients with oropharyngeal cancer were included in this study (Table 1), of whom 82 (57.7%) had HPV‐negative tumors and 60 (42.3%) had HPV‐positive tumors. For both groups, the tumor was predominantly found at the base of the tongue and tonsil (combined: 67.1% for HPV‐negative tumors and 96.7% for HPV‐positive tumors). The proportion of men was significantly higher in the HPV‐positive group compared to HPV‐negative, 85% and 68.3%, respectively (P = .02). T classification at time of diagnosis was higher in patients with HPV‐negative tumors (P < .01) as T3‐4 stage tumor was determined in 64.6% of the HPV‐negative and in 31.7% of the HPV‐positive tumors. Tumors were differently distributed in the five different locations (base of the tongue, vallecular, tonsil, posterior wall, and soft palate) (P < .01) in HPV‐negative and HPV‐positive tumors; however, none of the different tumor locations were significantly correlated with survival (data not shown).
Table 1.
Patient, tumor, and treatment characteristics. Clinicopathological characteristics of the entire cohort of patients and patients with HPV‐positive and HPV‐negative tumor separately
| Entire OPSCCs cohort | HPV‐negative OPSCCs | HPV‐positive OPSCCs | ||||||
|---|---|---|---|---|---|---|---|---|
| No. of patients | % | No. of patients | % | No. of patients | % | P‐valuea | ||
| Patients | Number | 142 | 82 | 57.7 | 60 | 42.3 | ||
| Age | Median | 58.5 | 60 | 55.5 | .26c | |||
| Mean | 58.4 (10.3b) | 59.57 (9.5b) | 56.8 (11.2b) | |||||
| Sex | l:Male | 107 | 75.4 | 56 | 68.3 | 51 | 85 | .02 |
| 2:Female | 35 | 24.6 | 26 | 31.7 | 9 | 15 | ||
| Site | Base of tongue | 46 | 32.4 | 19 | 23.2 | 27 | 45 | <.01 |
| Vallecula | 5 | 3.5 | 3 | 3.7 | 2 | 3.3 | ||
| Tonsil | 67 | 47.2 | 36 | 43.9 | 31 | 51.7 | ||
| Posterior wall | 9 | 6.3 | 9 | 11 | 0 | |||
| Soft palate | 15 | 10.6 | 15 | 18.3 | 0 | |||
| T classification | 1 | 29 | 20.4 | 9 | 11 | 20 | 33.3 | <.01 |
| 2 | 41 | 28.9 | 20 | 24.4 | 21 | 35 | ||
| 3 | 34 | 23.9 | 25 | 30.5 | 9 | 15 | ||
| 4 | 38 | 26.8 | 28 | 34.1 | 10 | 16.7 | ||
| N classification | 0 | 27 | 19 | 18 | 22 | 9 | 15 | .46 |
| 1 | 23 | 16.2 | 15 | 18.3 | 8 | 13.3 | ||
| 2 | 79 | 55.6 | 41 | 50 | 38 | 63.3 | ||
| 3 | 13 | 9.2 | 8 | 9.8 | 5 | 8.3 | ||
| Smoking status | l:Currently smoking | 103 | 72.5 | 70 | 85.4 | 33 | 55 | <.01 |
| 2:Quit <5 years | 9 | 6.3 | 7 | 8.5 | 2 | 3.3 | ||
| 3:Quit >5 years | 17 | 12 | 4 | 4.9 | 13 | 21.7 | ||
| 4:Never smoked | 13 | 9.2 | 1 | 1.2 | 12 | 20 | ||
| Treatment | l:Radiotherapy | 51 | 35.9 | 26 | 31.7 | 25 | 41.7 | .22 |
| 2:Chemoradiotherapy | 91 | 64.1 | 56 | 68.3 | 35 | 58.3 | ||
| Loco‐regional recurrence | Yes | 18 | 12.6 | 13 | 15.8 | 5 | 8.3 | .18 |
| No | 124 | 87.3 | 69 | 84.1 | 55 | 91.6 | ||
| Distant metastasis | Yes | 31 | 21.8 | 24 | 29.3 | 7 | 11.7 | .01 |
| No | 111 | 78.2 | 58 | 70.7 | 53 | 88.3 | ||
| Death of the disease | Yes | 48 | 34.3 | 36 | 45 | 12 | 20 | <.01 |
| No | 92 | 65.7 | 44 | 55 | 48 | 80 | ||
| Death due to any cause | Yes | 96 | 68.5 | 68 | 85 | 28 | 46.6 | <.0001 |
| No | 44 | 31.5 | 12 | 25 | 32 | 53.4 | ||
| Follow‐up (alive) | Median | 82.0 (29.9b) | 96.7 (38.2b) | 81.9 (26.4b) | ||||
| Range | 38.8‐150.2 | 45.4‐150.2 | 38.8‐139.0 | |||||
Exact Chi square.
SD.
Wilcoxon matched‐pairs signed rank test.
For both groups, the majority of the patients were still smoking at time of diagnosis (85.4% for HPV‐negative and 55% for HPV‐positive). Both groups were treated similarly with RT alone or CRT (P = .22). HPV‐negative tumors were more frequently associated with metastases to distant organs than HPV‐positive tumors (P = .01). As expected, a number of disease‐related deaths were significantly higher in HPV‐negative OSPCC patients compared to HPV‐positive (P < .01).
Median follow‐up time for alive patients in the entire cohort (No. of patients = 44) was 82.0 months ( “SD” = 29.9 months) and 81.9 months (SD = 26.4) for patients with HPV‐positive tumors (No. of patients = 32), and 96.7 months (SD = 38.2) for patients with HPV‐negative tumors (No. of patients = 12). Two patients were lost due to follow‐up.
3.2. Distribution of HLA‐I, HLA‐II, PD‐L1, and PD1 in view of human papillomavirus status
IHC staining for p53, p16, HLA‐I, HLA‐II, PD‐L1, and PD1 was successfully performed in 99‐100% of all tumor specimens. Representative figures of IHC staining are shown in Figure 1A,B. Table 2 summarizes tumor‐ and stroma cells expression per marker in the whole group and in the HPV‐positive and HPV‐negative subgroups.
Figure 1.
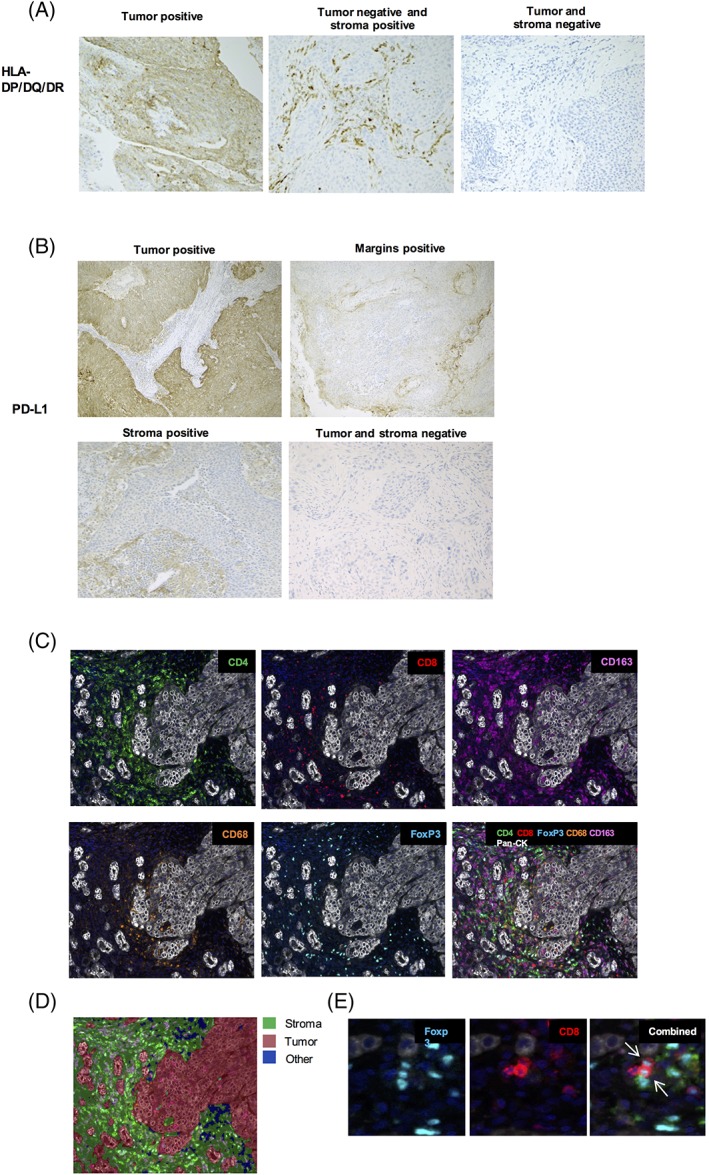
Illustration of immunohistochemical staining in OPSCC specimens. A, HLA‐DP/DQ/DR was manually scored in the tumor and in the tumor‐surrounding stroma. B, PD‐L1 expression was manually scored in the tumor, on the margins of the tumor and in the tumor‐surrounding stroma. C, Multiplex immunofluorescence staining of CD4, CD8, FoxP3, CD163, CD68, and pan‐CK in in OPSCC specimens. D, An algorithm was developed for automatic recognition of tumoral and stromal tissue. Empty spaces or artifacts were defined as “other.” E, Identification of double‐positive CD8+ FoxP3+ cells in tumor‐associated stroma
Table 2.
Expression of HLA‐I, HLA‐II, PD‐L1, and PD1 in tumor, tumor margins, and stroma in view of HPV status. Quantification of immunohistochemical staining scored in the tumor, on the margins and in the surrounding stroma. Tot: total number of patients, Loss: loss of expression, Down: downregulation of expression, Pos: positive expression, Neg: negative expression, T: tumor, S: stroma, M: tumor margins
| Staining | Scoring | Entire OPSCCs cohort | HPV‐negative OPSCCs | HPV‐positive OPSCCs | ||||
|---|---|---|---|---|---|---|---|---|
| No. of patients | % | No. of patients | % | No. of patients | % | P‐valuea | ||
| HLA‐HC10 T | Tot | 141 | 82 | 59 | .19 | |||
| Loss | 12 | 8.5 | 4 | 4.9 | 8 | 13.6 | ||
| Down | 95 | 67.4 | 57 | 69.5 | 38 | 64.4 | ||
| Pos | 34 | 24.1 | 21 | 25.6 | 13 | 22.0 | ||
| HLA‐HCA2 T | Tot | 138 | .16 | |||||
| Loss | 24 | 17.4 | 9 | 11.5 | 15 | 25.0 | ||
| Down | 75 | 54.4 | 46 | 59.0 | 29 | 48.3 | ||
| Pos | 39 | 28.3 | 23 | 29.5 | 16 | 26.7 | ||
| B2M T | Tot | 143 | 82 | 60 | .08 | |||
| Neg | 24 | 16.8 | 10 | 12.2 | 14 | 23.3 | ||
| Pos | 119 | 83.2 | 72 | 87.8 | 46 | 76.7 | ||
| HLA‐DRA T | Tot | 142 | 82 | 60 | .03 | |||
| Neg | 122 | 85.9 | 75 | 91.5 | 47 | 78.3 | ||
| Pos | 20 | 14.1 | 7 | 8.5 | 13 | 21.7 | ||
| HLA‐DR/DP/DQ T | Tot | 141 | 82 | 59 | .06 | |||
| Neg | 96 | 68.1 | 61 | 74.4 | 35 | 59.3 | ||
| Pos | 45 | 31.9 | 21 | 25.6 | 24 | 40.7 | ||
| HLA‐DRA S | Tot | 141 | 81 | 60 | .12 | |||
| Neg | 60 | 42.6 | 39 | 48.2 | 21 | 35.0 | ||
| Pos | 81 | 57.5 | 42 | 51.9 | 39 | 65.0 | ||
| HLA‐DR/DP/DQ S | Tot | 141 | 82 | 59 | .29 | |||
| Neg | 30 | 21.3 | 20 | 24.4 | 10 | 17.0 | ||
| Pos | 111 | 78.7 | 62 | 75.6 | 49 | 83.1 | ||
| PD‐L1 T | Tot | 141 | 81 | 60 | .22 | |||
| Neg | 106 | 75.2 | 64 | 79.0 | 42 | 70.0 | ||
| Pos | 35 | 24.8 | 17 | 21.0 | 18 | 30.0 | ||
| PD‐L1 M | Tot | 142 | 82 | 60 | .05 | |||
| Neg | 117 | 82.4 | 72 | 87.8 | 45 | 75.0 | ||
| Pos | 25 | 17.6 | 10 | 12.2 | 15 | 25.0 | ||
| PD‐L1 S | Tot | 141 | 82 | 59 | .02 | |||
| Neg | 101 | 71.6 | 65 | 79.3 | 36 | 61.0 | ||
| Pos | 40 | 28.4 | 17 | 20.7 | 23 | 39.0 | ||
| PD1S | Tot | 142 | 82 | 60 | .09 | |||
| Neg | 64 | 45.1 | 42 | 51.2 | 22 | 36.7 | ||
| Pos | 78 | 54.9 | 40 | 48.8 | 38 | 63.3 | ||
Exact Chi‐square test.
Downregulation or complete loss of the two HLA‐I molecules, that is, HLA‐B/C and HLA‐A, was seen in the vast majority of the tumors (combined loss or downregulation was 75.9% and 71.7%, respectively), while β2M expression was completely absent in 16.7% of the tumors. No significant differences in expression of HLA‐A, B/C molecules were observed between the HPV‐negative and positive tumors. Expression of HLA‐DRA or HLA‐DP/DQ/DR on tumor cells was found in a minority of the patients (14.1% and 31.9% respectively), whereas expression of HLA‐DRA or HLA‐ DP/DQ/DR on stromal cells was found in the majority of stromal cells (57.4 and 78.7%, respectively). HLA‐DRA expression on tumor cells was significantly higher in the HPV‐positive tumors compared to HPV‐negative tumors (P = .03), and a trend was observed for HLA‐ DP/DQ/DR (P = .06). On stromal cells, HLA‐DRA or HLA‐DP/DQ/DR expression did not differ in the HPV‐positive and HPV‐negative group (P = .12 and P = .29, respectively).
PD‐L1 expression on tumor cells, at the tumor margins or in the tumor‐surrounding stroma was found in 24.8%, 17.6%, and 28.4% of the tumors, respectively. PD‐L1 expression at the invasive tumor margins or in the tumor‐surrounding stroma was found to be significantly higher in HPV‐positive compared to HPV‐negative tumors (P = .05 and P = .02, respectively). Expression of PD‐1 was not significantly different between HPV‐positive and HPV‐negative tumors (P = .09).
Altogether, these data suggest that HPV‐positive OPSCC is characterized by higher expression of HLA‐II in tumor cells and higher expression of PD‐L1 in the surrounding stroma.
3.3. Distribution of myeloid cells and lymphocytes in view of human papillomavirus status
Multiplex IF staining was successfully performed in 89%‐94% of all tumor specimens. Representative figures of IF stainings and phenotypic annotation are shown in Figure 1C D. Distribution of myeloid cells and lymphocytes markers is shown in Figure 2. Quantification of the multiplex staining is shown in Supporting Information Table S2. Interestingly, we found a considerably higher number of single positive CD163+ cells compared to double‐positive CD68+ CD163+ TAMs or single positive CD68+ cells in the stroma (median of cells/mm2 20.7, 4.6, and 2.9, respectively), whereas numbers in the tumor compartment were comparable (median of cells/mm2 4.1, 3.1, and 2.2, respectively). No significant differences were observed in the numbers of any of the macrophage cell subpopulations between HPV‐negative and HPV‐positive tumors, neither in the tumor nor in the stroma.
Figure 2.
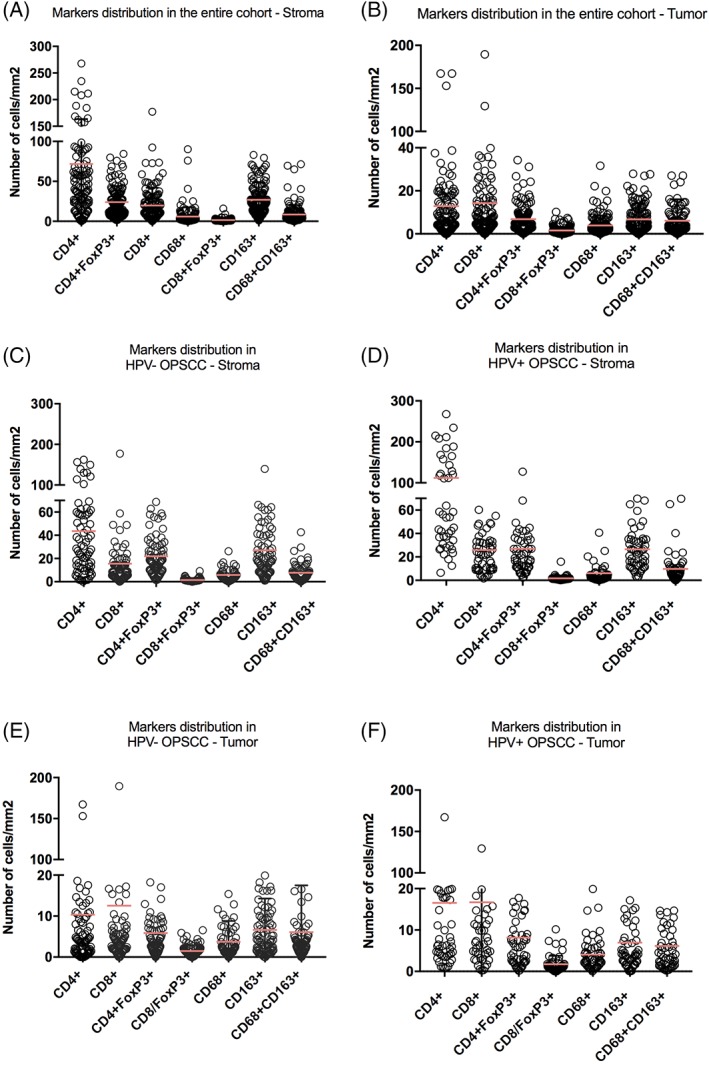
Distribution of myeloid cells and lymphocytes in view of HPV status. Quantification of the multiplex immunofluorescence staining scored in the tumor and in the surrounding stroma in the entire cohort (A‐B) and in HPV‐ negative (C‐D) and positive (E‐F) tumors separately [Color figure can be viewed at wileyonlinelibrary.com]
The number of CD4+ cells and CD8+ cells was much higher in the HPV‐positive tumors compared to HPV‐negative tumors, both in the tumor and stromal compartment (P < .001 in the tumor and P < .01 in the surrounding stroma for CD4 and P < .01, for both CD8 in the tumor and in the surrounding stroma), whereas very low numbers of CD4+ and CD8+ T cells were found in HPV‐negative tumors. As well known, lymphatic tissue contains large number of lymphocytes that could bias the quantification of tumor‐associated T lymphocytes, however, evaluation of tumor‐associated T lymphocytes could be performed as tumor cells were clearly distinguishable from other cells (Supporting Information Figure S1A). As shown in Supporting Information Figure S1B, segmentation of the tissue was performed in tails that either contained or were in proximity of the tumor. Tumorous and non‐tumorous areas were then identified (Supporting Information Figure S1C). Thus, only infiltrating immune cells found either inside or in proximity of the tumor and not far from the tumor were scored (“tumor” and “stroma”) (Supporting Information Figure S1D).
Also, the number of CD4+ Foxp3+ cells was significantly higher in the tumor compartment of HPV‐positive compared HPV‐negative tumors (P = .03).
Interestingly, we also found low numbers of CD8+ Foxp3+ cells both in the stromal and tumor compartment (median of cells/mm2 1.1 and 1.2, respectively) (representative figure of the staining is shown in Figure 1E). Also, their numbers did not differ between HPV‐negative and HPV‐positive tumors.
3.4. Correlation between immune and clinical variables
In order to explore associations between all variables included in this study and their correlation with clinical outcome, we computed Spearman correlations between clinical variables (HPV status, T classification, gender, smoking history, and treatment) and immune variables (all the staining performed in this study), displaying results as a heat map in Figure 3A. As expected, the number of CD4+ and CD8+ T cells were correlated with each other both in the stroma and in the tumor (r = 0.70 in the stroma and r = 0.61 in the tumor).
Figure 3.
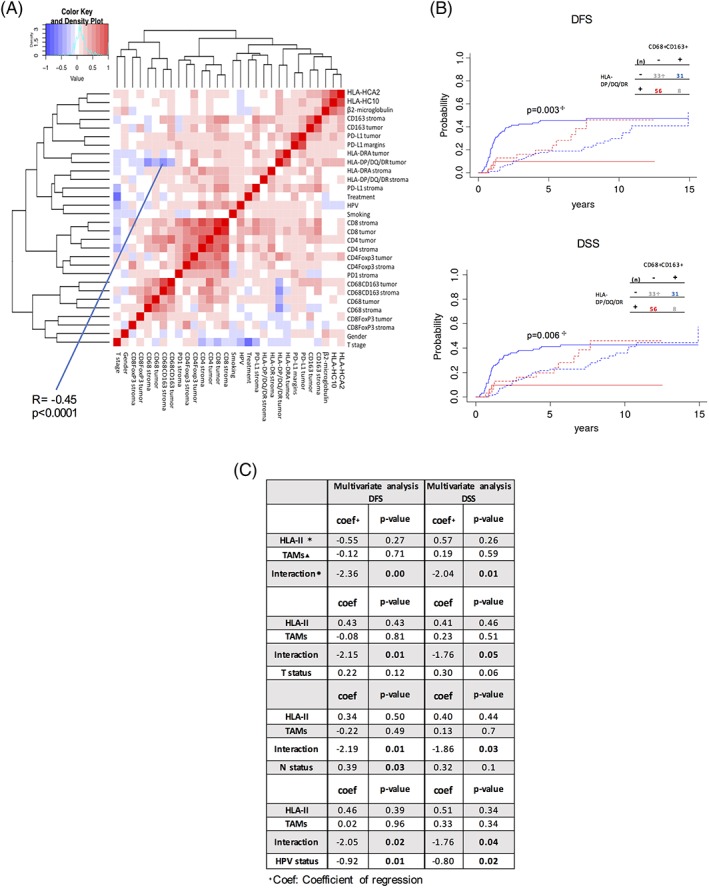
HLA‐DP/DQ/DR expression in inversely correlated with CD68+ CD163 numbers and the interaction is a strong predictor of survival. A, Heat map shows the degree of correlation (Spearman) between the clinical and immunological variables included in the study. B, Cumulative incidence analysis for DFS and DSS of patients with high HLA‐DP/DQ/DR expression on tumor cells and low numbers of CD68+ CD163+ TAMs in the surrounding stroma (red) or the other way around (blue).  P‐value is calculated between straight lines. Segmented lines represent competing risks.
  (n) represents the number of patients. C, Multivariate analyses show the predictive power of the interaction variable for DFS and DSS.
  Interaction between the HLA‐DP/DQ/DR and CD68+ CD163+ variables.
  HLA‐II, HLA‐DP/DQ/DR on tumor cells; ▴ TAMs, CD68+ CD163+ numbers in tumor‐associated stroma; Interaction, interaction variable between HLA‐II and TAMs. Competing risks and treatment stratification are included in the analysis
Interestingly, we also found that the number of double positive in the stroma CD68+ CD163+, commonly identified as pro‐tumor macrophages,34 was negatively correlated with expression of HLA‐DP/DQ/DR on tumor cells (Spearman r = −0.45 and P < .0001). The median value of the number of CD68+ CD163+ cells was used to identify samples with high or low number of CD68+ CD163+ cells in the stromal compartment. As shown in Figure 3B, patients with high HLA‐DP/DQ/DR expression on tumor cells and low numbers of CD68+ CD163+ TAMs in the surrounding stroma were strongly associated with a significant decreased in cumulative incidence for DFS and DSS (P = .003 and P = .006, respectively). Importantly, equal expression of both markers (low–low or high–high) did not significantly improved DFS (Supporting Information Figure S2).
We then performed a number of multivariate analyses using four of the most important clinical prognostic factors for OPSCC, HPV status, tumor, and lymph node status, together with the HLA‐DP/DQ/DR, TAMs and the new variable generated by their interaction (Figure 3C). Interestingly, we found that the interaction between these two immunological variables was stronger than T status and N status in predicting DFS and DSS, however, HPV status remained the most significant predictive factor.
Indeed, in multivariate regression model, including clinical variables (HPV status, gender, T classification, smoking history, and treatment) only, HPV status showed the strongest effect on DFS and DSS (P < .001 for both) (Supporting Information Table S4). Patients with HPV‐positive tumors were associated with significantly less disease‐specific deaths, loco‐regional recurrence or distant metastasis compared to HPV‐negative tumors (Supporting Information Figure S3). Importantly, we also found that treatment (RT alone or CRT), which did not differ between HPV‐negative and positive tumors, significantly affected both DFS and DSS (P = .01 and P = .04, respectively). Patients receiving CRT performed better compared to patients receiving RT alone (Supporting Information Figure S2). Therefore, here we used a treatment‐based stratification model for multivariate COX regression analysis in order include treatment variable in our analysis but preventing it to bias the results.
4. PROGNOSTIC IMPORTANCE OF CLINICAL AND IMMUNOLOGICAL VARIABLES
Univariate analysis of all the variables included in this study was performed to find indicative biomarkers with an effect on OS, DFS, and DSS and subsequently tested for statistical power in multivariate analyses. As expected patients with HPV‐positive tumor were associated with significantly longer OS, DFS, and DSS (Table 3). Also, female patients were associated with longer OS and DFS survival. Patients with higher N status classification were associated with significantly shorter OS, DFS, and DSS (P = .012, HR = 3.27; P = .023, HR = 4.61; and P = .020, HR = 3.15, respectively).
Table 3.
Univariate and multivariate analysis including immunological and clinical variables. Univariate analysis of immunological and clinical variables in relation to DFS, DSS, and OS was performed. T: tumor, S: stroma, M: tumor margins. Treatment stratification was included in the analysis. Variables with P < 0.1 in univariate analysis were included in multivariate analysis
| Univariate regression model—clinical and immunological variables | ||||||||||||||
|---|---|---|---|---|---|---|---|---|---|---|---|---|---|---|
| Disease‐free survival | Disease‐specific survival | Overall survival | ||||||||||||
| Variable | HR | P‐value | 95% CI | Variable | HR | P‐value | 95% CI | Variable | HR | P‐value | 95% CI | |||
| HPV (+ vs −) | 0.205 | .002 | 0.096 | 0.439 | HPV (+ vs −) | 0.339 | .009 | 0.150 | 0.766 | HPV (+ vs −) | 0.361 | .000 | 0.210 | 0.620 |
| Sex (F vs M) | 0.471 | .052 | 0.2 2 0 | 1.007 | Sex (F vs M) | 0.472 | .082 | 0.202 | 1.101 | Sex (F vs M) | 0.435 | .003 | 0.249 | 0.760 |
| Smoke (yes vs nonsmoker or stopped) | 1.271 | .147 | 0.919 | 1.757 | Smoke (yes vs nonsmoker or stopped) | 1.114 | .830 | 0.405 | 3.065 | Smoke (yes vs nonsmoker or stopped) | 1.192 | .623 | 0.417 | 2.366 |
| T class. (3‐4 vs 2‐1) | 1.185 | .379 | 0.812 | 1.730 | T class. (3‐4 vs 2‐1) | 1.677 | .361 | 0.366 | 2.086 | T class. (3‐4 vs 2‐1) | 1.946 | .087 | 0.907 | 4.176 |
| N class (3‐2 vs 1‐0) | 3.400 | .060 | 0.950 | 12.164 | N class (3‐2 vs 1‐0) | 4.615 | .023 | 1.232 | 17.286 | N class (3‐2 vs 1‐0) | 3.279 | .012 | 1.262 | 7.161 |
| HLA_B/C T | 0.747 | .270 | 0.301 | 1.265 | HLA_B/C T | 0.857 | .570 | 0.501 | 1.465 | HLA_B/C T | 1.145 | .500 | 0.770 | 1.702 |
| HLA B/C T | 0.942 | .800 | 0.868 | 1.501 | HLA B/C T | 1.209 | .410 | 0.7 68 | 1.901 | HLA B/C T | 1.165 | .370 | 0.836 | 1.623 |
| B2M T | 0.979 | .960 | 0.874 | 2.532 | B2M T | 1.435 | .440 | 0.5 7 4 | 3.592 | B2MT | 1.555 | .120 | 0.896 | 2.698 |
| HLA‐DRA T | 0.272 | .080 | 0.080 | 0.894 | HLA‐DRA T | 0.301 | .110 | 0.070 | 1.294 | HLA‐DRA T | 0.564 | .068 | 0.306 | 1.042 |
| HLA‐DP/DQ/DR T | 0.336 | .009 | 0.265 | 0.561 | HLA‐DP/DQ/DR T | 0.377 | .021 | 0.165 | 0.861 | HLA‐DP/DQ/DR T | 0.580 | .026 | 0.359 | 0.937 |
| HLA‐DRA S | 0.554 | .051 | 0.473 | 0.975 | HLA‐DRA S | 0.690 | .240 | 0.3 73 | 1.275 | HLA‐DRA S | 0.459 | .000 | 0.298 | 0.707 |
| HLA‐DP/DQ/DR S | 0.939 | .860 | 0.990 | 1.005 | HLA‐DP/DQ/DR S | 1.016 | .970 | 0.490 | 2.105 | HLA‐DP/DQ/DR S | 0.727 | .190 | 0.451 | 1.171 |
| PD‐L1 T | 0.464 | .085 | 0.2 7 5 | 1.289 | PD‐L1 T | 0.651 | .310 | 0.2 85 | 1.489 | PD‐L1 T | 0.766 | .290 | 0.468 | 1.254 |
| PD‐L1 M | 0.546 | .190 | 0.446 | 1.142 | PD‐L1 M | 0.616 | .300 | 0.2 46 | 1.542 | PD‐L1 M | 0.573 | .056 | 0.323 | 1.014 |
| PD‐L1 S | 0.408 | .025 | 0.309 | 0.818 | PD‐L1 S | 0.461 | .056 | 0.209 | 1.018 | PD‐L1 S | 0.615 | .044 | 0.384 | 0.986 |
| PD1 S | 0.512 | .033 | 0.446 | 1.062 | PD1 S | 0.679 | .220 | 0.3 66 | 1.262 | PD1 S | 0.738 | .150 | 0.490 | 1.112 |
| CD163+ S | 0.989 | .190 | 0.974 | 1.005 | CD163+ S | 0.989 | .200 | 0.9 72 | 1.006 | CD163+ S | 0.994 | .350 | 0.983 | 1.006 |
| CD4+ S | 0.997 | .290 | 0.992 | 1.002 | CD4+ S | 0.998 | .520 | 0.9 94 | 1.003 | CD4+ S | 0.994 | .017 | 0.988 | 0.999 |
| CD4+ FoxP3+ S | 0.982 | .200 | 0.955 | 1.010 | CD4+ FoxP3+ S | 0.987 | .330 | 0.960 | 1.014 | CD4+ FoxP3+ S | 0.976 | .016 | 0.957 | 0.995 |
| CD68+ S | 1.010 | .420 | 0.9 85 | 1.036 | CD68+ S | 1.010 | .450 | 0.9 84 | 1.038 | CD68+ S | 1.004 | .750 | 0.978 | 1.031 |
| CD68+ CD163+ S | 1.014 | .110 | 0.997 | 1.031 | CD68− TCD163+ S | 1.018 | .040 | 1.001 | 1.035 | CD68+ CD163+ S | 1.005 | .650 | 0.9 85 | 1.025 |
| CD8+ S | 0.991 | .620 | 0.956 | 1.027 | CD8+ S | 0.997 | .840 | 0.9 63 | 1.031 | CD8+ S | 0.981 | .036 | 0.964 | 0.999 |
| CD8+ FoxP3+ S | 0.974 | .730 | 0.840 | 1.129 | CD8+ FoxP3+ S | 0.983 | .820 | 0.846 | 1.142 | CD8+ FoxP3+ T | 0.918 | .200 | 0.805 | 1.046 |
| CD163+ T | 0.978 | .510 | 0.915 | 1.046 | CD163+ T | 0.977 | .520 | 0.910 | 1.049 | CD163+ T | 0.990 | .570 | 0.955 | 1.026 |
| CD4+ T | 1.017 | .009 | 1.004 | 1.030 | CD4+ T | 1.020 | .002 | 1.007 | 1.033 | CD4+ T | 1.001 | .920 | 0.975 | 1.029 |
| CD4+ FoxP3+ T | 0.986 | .740 | 0.911 | 1.068 | CD4+ FoxP3+ T | 0.997 | .930 | 0.9 2 7 | 1.072 | CD4+ FoxP3+ T | 0.972 | .330 | 0.917 | 1.030 |
| CD68+ T | 1.030 | .370 | 0.966 | 1.100 | CD68+ T | 1.036 | .300 | 0.969 | 1.107 | CD68+ T | 1.021 | .470 | 0.964 | 1.082 |
| CD68+ CD163+ T | 1.033 | .002 | 1.012 | 1.055 | CD68‐rCD163+ T | 1.040 | .009 | 1.021 | 1.059 | CD68− KZD163+ T | 1.028 | .036 | 1.002 | 1.055 |
| CD8+ T | 1.008 | .180 | 0.996 | 1.021 | CD8+ T | 1.010 | .079 | 0.99 9 | 1.022 | CD8+ T | 0.999 | .940 | 0.982 | 1.017 |
| CD8+ FoxP3+ T | 1.064 | .380 | 0.926 | 1.223 | CD8+ FoxP3+ T | 1.084 | .250 | 0.9 46 | 1.241 | CD8+ FoxP3+ T | 0.940 | .340 | 0.829 | 1.066 |
| Multivariate regression model with competing risks and treatment stratification | ||||||||||||||
|---|---|---|---|---|---|---|---|---|---|---|---|---|---|---|
| Disease‐free survival | Disease‐specific survival | Overall survival | ||||||||||||
| Variable | HR | P‐value | 95% CI | Variable | HR | P‐value | 95% CI | Variable | HR | P‐value | 95% CI | |||
| HPV (+ vs −) | 0.204 | .004 | 0.095 | 0.432 | HPV (+ vs −) | 0.432 | .016 | 0.121 | 0.722 | HPV (+vs −) | 0.506 | .015 | 0.291 | 0.873 |
| Sex (M vs F) | 1.042 | .835 | 0.9 2 0 | 1.207 | Sex (M vs F) | 0.700 | .350 | 0.5 20 | 1.289 | Sex (M vs F) | 0.819 | .430 | 0.610 | 1.349 |
| N class (3‐2 vs 1‐0) | 1.21 | .01 | 1.020 | 7.264 | N class (3‐2 vs 1‐0) | 3.231 | .056 | 1.120 | 7365 | N class (3‐2 vs 1‐0 | 7.053 | .003 | 1.120 | 12.225 |
| HLA‐DRA T | 0.655 | .590 | 0.144 | 2.997 | HLA‐DP/DQ/DR T | 0.362 | .015 | 0.144 | 2.997 | T class. (3‐4 vs 2‐1 | 1.730 | .066 | 0.970 | 2.939 |
| HLA‐DP/DQ/DR T | 0.390 | .029 | 0.167 | 0.908 | PD‐L1 S | 0.679 | .220 | 0.167 | 0.908 | HLA‐DRA T | 1.155 | .700 | 0.562 | 2.359 |
| HLA‐DRA S | 0.624 | .130 | 0.342 | 1.142 | CD68+ CD163+ S | 1.014 | .120 | 0.9 9 6 | 1.032 | HLA‐DP/DQ/DR T | 0.647 | .160 | 0.349 | 1.195 |
| PD‐L1 T | 0.655 | .350 | 0.268 | 1.602 | CD4+ T | 1.015 | .240 | 0.990 | 1.041 | HLA‐DRA S | 0.487 | .003 | 0.301 | 0.787 |
| PD‐L1 S | 0.614 | .250 | 0.268 | 1.399 | CD68+ CD163+ T | 1.016 | .500 | 0.971 | 1.063 | PD‐L1 M | 0.680 | .240 | 0.360 | 1.308 |
| PD1 S | 0.653 | .200 | 0.342 | 1.247 | CD8+ T | 0.940 | .062 | PD‐L1 S | 0.921 | .780 | 0.543 | 1.639 | ||
| CD4+ T | 1.012 | .260 | 0.991 | 1.034 | CD4+ S | 1.000 | .890 | 0.996 | 1.005 | |||||
| CD68+ CD163+ T | 1.017 | .400 | 0.978 | 1.056 | CD4+ FoxP3+ S | 0.974 | .024 | 0.9 52 | 0.996 | |||||
| CD8+ S | 1.037 | .064 | 0.998 | 1.077 | ||||||||||
| CD68+ CD163+ T | 1.030 | .083 | 0.9 96 | 1.065 | ||||||||||
Abbreviations: HR, hazard ratio; 95% CI, 95% confident interval.
Statistically significant values are shown in bold.
High expression of HLA‐DP/DQ/DR and HLA‐DRA in tumor cells was correlated with significantly longer OS (P = .026, HR = 0.58 and P < .01, HR = 0.45, respectively) and DFS (P = .009, HR = 0.33 and P = .05, HR = 0.55, respectively). Furthermore, HLA‐DP/DQ/DR expression in tumor cells was also correlated with significantly longer DFS (P = .021, HR = 0.37). Surprisingly, none of the molecules of the HLA‐I complex were associated with OS, DFS, or DSS. PD‐L1 expression scored in the stromal compartment was associated with significantly longer OS, DFS, and DSS (P = .025, HR = 0.48; P = .056, HR = 0.46; and P = .04, HR = 0.61, respectively). Furthermore, PD‐1 expression in stromal cells was associated with significantly longer DFS (P = .033, HR = 0.51). Numbers of CD4+ and CD4+ FoxP3+ T lymphocytes in the stromal compartment were associated with significantly longer OS (P = .017, HR = 0.99 and P = .016, HR = 0.97, respectively). Also, numbers of CD8+ T lymphocytes were associated with significantly longer OS (P = .036, HR = 0.98).
Interestingly, we found that increased numbers of CD68+ CD163+ TAMs in the tumor compartment was significantly correlated with reduced OS, DFS, and DSS (P = .036, HR = 1.02; P = .009, HR = 1.04; and P = .002, HR = 1.03, respectively). Furthermore, high numbers of CD68+ CD163+ TAMs in the stromal compartment was associated with shorter DSS (P = .040, HR = 1.01).
To test the statistical power of the variables in multivariate analysis, we fit a Cox proportional hazards regression model, including variables with P < .1 from univariate analysis. As shown in Table 3, statistical power of HLA‐DP/DQ/DR expression in tumor cells was validated in multivariate analysis as it was significantly associated with longer DFS and DSS survival (P = .029, HR = 0.39 and P = .015, HR = 0.36, respectively), but not for OS. Furthermore, high expression of HLA‐DRA and high numbers of CD4+ FoxP3+ T lymphocytes in the stromal compartment was associated with significantly longer OS (P = .003, HR = 0.48 and P = .024, HR = 0.97). As expected, HPV status was an independent prognostic factor for OS, DFS, and DSS. These data suggest that expression of HLA‐DP/DQ/DR, HLA‐DRA, and CD4+ FoxP+ T lymphocytes are independent prognostic markers of survival of OPSCC patients.
Ultimately, we performed an additional multivariate regression model using subdistribution functions in the competing risks and treatment stratified model, including immunological and clinical parameters. This analysis aimed to explore the complex network of interactions among immune components of the tumor microenvironment of OPSCC. In this model, no preselection based on univariate analysis was performed, instead, all immunological and clinical variables were included. However, due to the very large number of clinical‐ and immune variables and different methodology of scoring, immunohistochemical data (HLA‐HCA2, HLA‐HC10, HLA‐DRA, HLA‐DP/DQ/DR, PD‐L1, PD1) were analyzed separately from the IF data (CD4, CD8, FoxP3, CD68, CD163). As shown in Table 4, we confirmed that high expression of HLA‐DP/DQ/DR in tumor cells was correlated with significantly longer DFS, DSS, and OS (P = .03, HR = 0.39; P = .02, HR = 0.36; and P = .03, HR = 0.59, respectively. Furthermore, higher PD‐L1 expression in the tumor‐stroma borders or stromal compartment was associated with significantly longer OS (P = .04, HR = 0.55 and P = .04, HR = 0.60, respectively). In addition, we showed that high numbers of CD68+ CD163+ TAMs in the tumor‐surrounding stroma was significantly associated with shorter DFS, DSS, and OS (P = .04, HR = 1.03; P = .01 HR = 1.04; and P = .00, HR = 1.02, respectively). Finally, we found that numbers of CD8+ FoxP3+ T lymphocytes found in tumor compartment were associated with significantly shorter DFS (P = .04. HR = 1.39). Importantly, key clinical variables, including HPV status and N classification, were significant only in relation to OS and not in DFS and DSS, suggesting that their statistical power is reduced when multiple immune components of the tumor microenvironment are taken in account in the analysis.
Table 4.
Subdistribution multivariate regression model. Multivariate analysis of immunological and clinical variables in relation to DFS, DSS and OS was performed. T: tumor, S: stroma, M: tumor margins. Treatment stratification was included in the analysis
| Multivariate regression model with competing risks and treatment stratification—IHC variables | ||||||||||||
|---|---|---|---|---|---|---|---|---|---|---|---|---|
| Disease‐free survival | Disease‐specific survival | Overall survival | ||||||||||
| Variable | HR | P‐value | 95% CI | HR | P‐value | 95% CI | HR | P‐value | 95% CI | |||
| HPV (+ vs −) | 0.397 | .110 | 0.128 | 1.228 | 0.580 | .290 | 0.210 | 1.602 | 0.420 | .003 | 0.235 | 0.750 |
| Sex (F vs M) | 0.443 | .070 | 0.183 | 1.069 | 0.437 | .074 | 0.176 | 1.082 | 0.481 | .016 | 0.265 | 0.874 |
| Smoke (yes vs nonsmoker or stopped) | 2.688 | .110 | 0.799 | 9.044 | 1.734 | .470 | 0.387 | 7.764 | 1.483 | .450 | 0.531 | 4.141 |
| T class. (3‐4 vs 2‐1) | 0.374 | .140 | 0.100 | 1.396 | 0.619 | .460 | 0.173 | 2.207 | 1.758 | .096 | 0.905 | 3.413 |
| N class (3‐2 vs 1‐0) | 1.385 | .155 | 0.884 | 2.171 | 3.010 | .272 | 0.422 | 21.481 | 3.279 | .012 | 1.297 | 8.292 |
| HLA B/CT | 0.54 | .16 | 0.232 | 1.264 | 0.46 | .10 | 0.185 | 1.155 | 1.02 | .92 | 0.680 | 1.530 |
| HLA B/CT | 1.46 | .19 | 0.829 | 2.566 | 2.05 | .09 | 1.130 | 3.724 | 1.07 | .71 | 0.758 | 1.498 |
| B2MT | 1.22 | .72 | 0.419 | 3.552 | 1.39 | .59 | 0.424 | 4.576 | 1.35 | .28 | 0.781 | 2.341 |
| HLA‐DRAT | 0.61 | .57 | 0.110 | 3.401 | 0.58 | .54 | 0.104 | 3.240 | 0.58 | .09 | 0.313 | 1.087 |
| HLA‐DP/DQ/DR T | 0.39 | .03 | 0.168 | 0.895 | 0.36 | .02 | 0.159 | 0.821 | 0.59 | .03 | 0.359 | 0.959 |
| HLA‐DRA S | 0.82 | .56 | 0.421 | 1.593 | 0.97 | .94 | 0.482 | 1.971 | 0.45 | .00 | 0.286 | 0.698 |
| HLA‐DP/DQ/DR S | 1.51 | .30 | 0.696 | 3.268 | 1.47 | .36 | 0.638 | 3.404 | 0.79 | .35 | 0.479 | 1.295 |
| PD‐L1 T | 0.61 | .47 | 0.164 | 2.293 | 0.94 | .93 | 0.243 | 3.655 | 0.75 | .27 | 0.450 | 1.254 |
| PD‐L1 M | 1.12 | .89 | 0.235 | 5.301 | 0.92 | .93 | 0.175 | 4.889 | 0.55 | .04 | 0.301 | 0.994 |
| PD‐L1 S | 0.53 | .20 | 0.202 | 1.408 | 0.47 | .17 | 0.161 | 1.390 | 0.60 | .04 | 0.370 | 0.977 |
| PD1 S | 0.92 | .83 | 0.413 | 2.035 | 1.20 | .64 | 0.550 | 2.626 | 0.76 | .21 | 0.496 | 1.158 |
| Multivariate regression model with competing risks and treatment stratification—IF variable | ||||||||||||
|---|---|---|---|---|---|---|---|---|---|---|---|---|
| Disease‐free survival | Disease‐specific survival | Overall survival | ||||||||||
| Variable | HR | P‐value | 95% CI | HR | P‐value | 95% CI | HR | P‐value | 95% CI | |||
| HPV (+ vs −) | 0.257 | .009 | 0.060 | 1.263 | 0.456 | .350 | 0.089 | 2.345 | 0.294 | .007 | 0.121 | 0.714 |
| Sex (F vs M) | 0.523 | .301 | 0.153 | 1.796 | 0.705 | .620 | 0.178 | 2.794 | 0.288 | .008 | 0.115 | 0.719 |
| Smoke (yes vs nonsmoker or stopped) | 0.797 | .770 | 0.177 | 3.591 | 1.368 | .720 | 0.254 | 7.377 | 0.593 | .400 | 0.177 | 1.984 |
| T class. (3‐4 vs 2‐1) | 1.644 | .570 | 0.300 | 9.007 | 2.253 | .390 | 0.347 | 14.624 | 2.686 | .040 | 1.046 | 6.897 |
| N class (3‐2 vs 1‐0) | 9.974 | .035 | 1.177 | 84.568 | 12.222 | .056 | 0.938 | 159.168 | 7.053 | .003 | 1.937 | 25.678 |
| CD163+ S | 0.98 | .17 | 0.974 | 1.005 | 0.97 | .12 | 0.933 | 1.012 | 0.997 | .66 | 0.99 | 1.012 |
| CD4+ S | 1.00 | .48 | 0.992 | 1.002 | 1.00 | .53 | 0.994 | 1.012 | 0.998 | .62 | 0.932 | 1.006 |
| CD4+ FoxP3+ S | 1.00 | .89 | 0.955 | 1.010 | 0.99 | .76 | 0.934 | 1.048 | 0.967 | .07 | 0.952 | 1.003 |
| CD68+ S | 0.98 | .60 | 0.985 | 1.036 | 0.97 | .44 | 0.893 | 1.047 | 0.987 | .46 | 1.01 | 1.023 |
| CD68+ CD163+ S | 1.03 | .04 | 0.997 | 1.031 | 1.04 | .01 | 1.008 | 1.073 | 1.029 | .00 | 0.952 | 1.003 |
| CD8+ S | 0.94 | .09 | 0.956 | 1.027 | 0.96 | .30 | 0.875 | 1.003 | 0.996 | .85 | 0.787 | 1.042 |
| CD8+ FoxP3+ S | 0.80 | .14 | 0.840 | 1.129 | 0.80 | .28 | 0.529 | 1.169 | 0.961 | .69 | 0.905 | 1.173 |
| CD163+ T | 0.93 | .11 | 0.915 | 1.046 | 0.91 | .02 | 0.835 | 0.966 | 0.954 | .08 | 0.984 | 1.005 |
| CD4+ T | 1.05 | .06 | 1.004 | 1.030 | 1.05 | .11 | 0.988 | 1.119 | 1.016 | .33 | 0.974 | 1.05 |
| CD4+ FoxP3+ T | 0.91 | .21 | 0.911 | 1.068 | 0.93 | .37 | 0.762 | 1.059 | 1.046 | .22 | 0.976 | 1.123 |
| CD68+ T | 1.07 | .54 | 0.966 | 1.100 | 1.07 | .55 | 0.844 | 1.397 | 1.079 | .14 | 0.949 | 1.193 |
| CD68+ CD163+ T | 0.96 | .44 | 1.012 | 1.055 | 0.99 | .79 | 0.898 | 1.046 | 0.993 | .76 | 0.979 | 1.039 |
| CD8+ T | 1.05 | .06 | 0.996 | 1.021 | 1.04 | .16 | 0.977 | 1.109 | 1.007 | .64 | 0.942 | 1.035 |
| CD8+ FoxP3+ T | 1.39 | .09 | 0.926 | 1.223 | 1.33 | .27 | 0.803 | 2.382 | 1.135 | .18 | 1.259 | 1.368 |
Abbreviations: HR, hazard ratio; 95% CI, 95% confident interval.
In conclusion, these data suggest that HLA‐DP/DQ/DR, CD163+ CD68+ TAMs, PD‐L1, and CD8+ FoxP3+ T lymphocytes are independent prognostic markers of survival of OPSCC patients in our immunology‐based multivariate analysis.
5. DISCUSSION
The tumor microenvironment is a key contributor to the development and progression of many tumors.35 In the last decade, implementation of scoring systems for immunological biomarkers found in the tumor or in the surrounding stroma has become a key tool to help to predict prognosis and response to therapy in many cancer types.36 In OPSCC tumors, HPV status is one of the key prognostic variable for survival; however, new and stronger predictors of survival might be identified exploring the interaction between immune cells and tumor cells in the tumor microenvironment. Previous studies investigated the role of the microenvironment in head and neck tumors with contradictory results.10 Here, we obtained a comprehensive “immune signature” of HPV‐negative and HPV‐positive OPSCCs and we found new potential prognostic markers for survival of OPSCC patients. More specifically, expression of HLA‐DP/DQ/DR on tumor cells, the numbers of CD68+ CD163+ TAMs in the tumor‐associated stroma, and the numbers of CD8+ FoxP+ cells in the tumor were established in our multivariate analyses as independent prognostic markers of survival in oropharyngeal cancer.
The tumor immune microenvironment can either promote or suppress tumor growth depending on the number and phenotype of immune cells. Accessibility to tumor antigens also plays a key role in the immune surveillance. Indeed, often, tumor cells downregulate expression of HLA‐I, thus evading CD8+ T‐mediated tumor‐specific immune response.37 Nevertheless, in contrast with previous studies where loss of HLA‐I was more frequently found in HPV‐negative OPSCC,38 we did not find differences in expression level of HLA‐I between HPV‐positive and HPV‐negative tumors. However, the scoring system used in these studies was different from the one used in this study as “fraction” and “intensity” of the staining of the different HLA‐I markers were not combined and were used as separate variables for univariate and multivariate analysis.38, 39 In addition, in one of these studies, only two subgroups were generated in both “fraction” and “intensity” of the staining.39 Therefore, we think that results might be the consequence of different scoring systems and we believe that a standard method of scoring should be used.
Importantly, in our study, we found an indirect correlation between the expression of the HLA‐II molecule, HLA‐DP/DQ/DR on tumor cells, and the number of CD68+ CD163+ TAMs in the tumor‐associated stroma of OPSCC patients. Expression of HLA‐II on epithelial cells has been described for colorectal cancer, ovarian cancer, and melanoma; however, the role in head and neck cancer still needs to be elucidated.40, 41, 42, 43, 44 Interestingly, recent studies in melanoma suggested that high expression of HLA‐DR/DP/DQ in tumor cells is associated with improved response rates and clinical benefit of PD‐1/PD‐L1 targeted therapy.41 We therefore think that our study could optimize the selection of patients that would benefit from immunotherapy treatment. For instance, Nivolumab is an inhibitor of the immunocheckpoint PD‐1 expressed on exhausted T cells and is currently used to treat metastatic OPSCC patients. Based on our results, we speculate that patients with high HLA‐II expression on tumor cells and low numbers of TAMs would represent a selective population of the patients that would benefit from Nivolumab treatment. Indeed, we showed that both high HLA‐DP/DQ/DR expression and low numbers of TAMs are required to observe a beneficial effect in survival, as equal expression of both markers did not significantly affect DFS or DSS. Also, infiltration of TAMs are known to affect treatment responses in several tumor types45 and preclinical and clinical studies using anti‐CSFR1 Ab (macrophage colony‐stimulating factor receptor 1) have been performed.46, 47, 48 We, therefore, speculate that immunotherapy treatment targeting TAMs might be beneficial especially for patients with high expression of HLA‐DP/DQ/DR on tumor cells.
One of the possible reasons why patients with high HLA‐DP/DQ/DR and low TAMs numbers are associated with improved survival is that HLA‐DP/DQ/DR expression on tumor cells leads to recruitment of CD4+ T cells for Ag recognition, which leads to increased IFNγ production in the tumor microenvironment. In turn, IFNγ is thought to reduce the generation of TAMs,49 therefore inhibiting the macrophage‐mediated tumor progression. It is known that expression of HLA‐II is increased by CD8‐ and CD4‐mediated IFNγ production. 50, 51 Importantly, in this study, we showed that HPV‐positive tumors have higher numbers of CD4+ and CD8+ cells both in the tumor and in the surrounding stroma, which might explain the higher expression of HLA‐II, both HLA‐DRA and HLA‐DP/DQ/DR, on tumor cells compared to HPV‐negative tumors. As previously observed,52 a positive correlation between PD‐L1 expression on immune cells and longer OS was found.
Finally, in our study, we identified a relatively new subset of double‐positive CD8+ FoxP3+ cells in OPSCC. Interestingly, recent works identified CD8+ FoxP3+ T cells as a potent immunosuppressive population of T cells in vitro and in vivo,53, 54, 55 however, their role in cancer is poorly described and nothing is known in relation to OPSCC. For the first time in oropharyngeal cancer, we showed that despite low in numbers, increased infiltration of CD8+ FoxP3+ T cells in the tumor compartment is an independent prognostic factor for shorter DFS in our comprehensive multivariate analysis. As the role of double‐positive CD8+ FoxP3+ T cells is poorly understood in cancer,55 we think additional functional assays should be performed in order to elucidate the possible immunosuppressive effect of this specific subset of cells and find new cell‐specific pathways targetable with immunotherapy.
For future studies, we aim to conduct a similar multiparameters analysis in a bigger cohort of patients to further support the relevance of our findings. Studying the spatial interaction between markers as proximity between cells will also be of additional value.56 In addition, differences in phenotype and functionality of immune cells found within or in proximity of the tumor and immune cells found far from the tumor could be explored. Also, functional and single‐cell sequencing analysis could be performed in order to explore the potential immunosuppressive phenotype of the newly described CD8+ FoxP3+ T cells.
In conclusion, we think that similar comprehensive multivariate analysis should be performed in this and other cancer types to assess the potential of survival prediction of various immunological and non‐immunological factors to mimic their 3‐dimentional context in the tumor microenvironment.
CONFLICT OF INTEREST
The authors declare no potential conflicts of interest.
Supporting information
Figure S1 Identification and quantification of tumor‐associated T lymphocytes in tonsil. A) Hematoxylin–eosin staining staning of tonsillar tumor specimen. Tumor area was delimited by the segmented line. B) Tails segmentation of tumor‐containing area. 50% of random tails were used for the analysis. C) Pre‐selected tails were segmented into ‘tumor’ or “stroma” area. D) CD8+ lymphocytes found within or in proximity of tumor area were scored as tumor‐associated lymphocytes or stroma‐associated lymphocytes, respectively.
Figure S2 Effect of HLA‐DP/DQ/DR expression and numbers of CD68 + CD163+ TAMs on survival. Cumulative incidence analysis was performed with HLA‐DP/DQ/DR expression and numbers of TAMs. Importantly, only patients with high HLA‐DP/DQ/DR expression and low number of TAMs showed significantly improved DFS and DSS.
Figure S3 Impact of HPV status and treatment on disease free survival and disease progression. 2A) Effect of HPV status on the cumulative incidence or loco‐regional recurrence, metastasis (DFS) or disease‐specific death (DSS). 2B) Effect of different treatment regimens in the cumulative incidence or loco‐regional recurrence, metastasis (DFS) or disease‐specific death (DSS). ✢ P value is calculated between straight lines or segmented lines.
Table S1 List of all the antibodies used in this study.
Table S2 Quantification of the number of myeloid cells and lymphocytes in tumor, tumor margins and stroma in view of HPV status. Quantification of the multiplex immunofluorescence staining scored in the tumor and in the surrounding stroma. Median represents the median of number of cells/mm2.
ACKNOWLEDGMENTS
This work was supported by grants from the Marie Curie ITN‐TIMCC.
Cioni B, Jordanova ES, Hooijberg E, et al. HLA class II expression on tumor cells and low numbers of tumor‐associated macrophages predict clinical outcome in oropharyngeal cancer. Head & Neck. 2019;41:463–478. 10.1002/hed.25442
Funding information: Marie Curie ‐ Timcc, Grant/Award Number: 58593 EEG‐CEC TIMCC 317445; Marie Curie ITNTIMCC
REFERENCES
- 1. Vigneswaran N, Williams MD. Epidemiologic trends in head and neck cancer and aids in diagnosis. Oral Maxillofac Surg Clin North Am. 2014;26(2):123‐141. [DOI] [PMC free article] [PubMed] [Google Scholar]
- 2. Elrefaey S, Massaro MA, Chiocca S, Chiesa F, Ansarin M. HPV in oropharyngeal cancer: the basics to know in clinical practice. Acta Otorhinolaryngol Ital. 2014;34(5):299‐309. [PMC free article] [PubMed] [Google Scholar]
- 3. Gillison ML, Zhang Q, Jordan R, et al. Tobacco smoking and increased risk of death and progression for patients with p16‐positive and p16‐negative oropharyngeal cancer. J Clin Oncol. 2012;30(17):2102‐2111. [DOI] [PMC free article] [PubMed] [Google Scholar]
- 4. Ang KK, Harris J, Wheeler R, et al. Human papillomavirus and survival of patients with oropharyngeal cancer. N Engl J Med. 2010;363(1):24‐35. [DOI] [PMC free article] [PubMed] [Google Scholar]
- 5. Balkwill FR, Capasso M, Hagemann T. The tumor microenvironment at a glance. J Cell Sci. 2012;125(Pt 23):5591‐5596. [DOI] [PubMed] [Google Scholar]
- 6. Punt S, Dronkers EAC, Welters MJP, et al. A beneficial tumor microenvironment in oropharyngeal squamous cell carcinoma is characterized by a high T cell and low IL‐17(+) cell frequency. Cancer Immunol Immunother. 2016;65(4):393‐403. [DOI] [PMC free article] [PubMed] [Google Scholar]
- 7. Oguejiofor K, Galletta‐Williams H, Dovedi SJ, Roberts DL, Stern PL, West CM. Distinct patterns of infiltrating CD8+ T cells in HPV+ and CD68 macrophages in HPV‐ oropharyngeal squamous cell carcinomas are associated with better clinical outcome but PD‐L1 expression is not prognostic. Oncotarget. 2017;8(9):14416‐14427. [DOI] [PMC free article] [PubMed] [Google Scholar]
- 8. Russell S, Angell T, Lechner M, et al. Immune cell infiltration patterns and survival in head and neck squamous cell carcinoma. Head Neck Oncol. 2013;5(3):24. [PMC free article] [PubMed] [Google Scholar]
- 9. Saber CN, Grønhøj Larsen C, Dalianis T, von Buchwald C. Immune cells and prognosis in HPV‐associated oropharyngeal squamous cell carcinomas: review of the literature. Oral Oncol. 2016;58:8‐13. [DOI] [PubMed] [Google Scholar]
- 10. Matlung SE, Wilhelmina van Kempen P, Bovenschen N, van Baarle D, Willems SM. Differences in T‐cell infiltrates and survival between HPV+ and HPV‐ oropharyngeal squamous cell carcinoma. Future Sci OA. 2016;2(1):FSO88. [DOI] [PMC free article] [PubMed] [Google Scholar]
- 11. Ward MJ, Thirdborough SM, Mellows T, et al. Tumour‐infiltrating lymphocytes predict for outcome in HPV‐positive oropharyngeal cancer. Br J Cancer. 2014;110(2):489‐500. [DOI] [PMC free article] [PubMed] [Google Scholar]
- 12. Kim HR, Ha SJ, Hong MH, et al. PD‐L1 expression on immune cells, but not on tumor cells, is a favorable prognostic factor for head and neck cancer patients. Sci Rep. 2016;6:36956. [DOI] [PMC free article] [PubMed] [Google Scholar]
- 13. Quail DF, Joyce JA. Microenvironmental regulation of tumor progression and metastasis. Nat Med. 2013;19(11):1423‐1437. [DOI] [PMC free article] [PubMed] [Google Scholar]
- 14. Bushkin Y, Demaria S, Mohagheghpour N, le J. Activation of human CD8‐positive T cells via the CD8/HLA class I complex. Cell Immunol. 1990;126(1):185‐195. [DOI] [PubMed] [Google Scholar]
- 15. Holling TM, Schooten E, van Den Elsen PJ. Function and regulation of MHC class II molecules in T‐lymphocytes: of mice and men. Hum Immunol. 2004;65(4):282‐290. [DOI] [PubMed] [Google Scholar]
- 16. De Meulenaere A et al. Tumor PD‐L1 status and CD8+ tumor‐infiltrating T cells: markers of improved prognosis in oropharyngeal cancer. Oncotarget. 2017;8(46):80443‐80452. [DOI] [PMC free article] [PubMed] [Google Scholar]
- 17. Lyford‐Pike S, Peng S, Young GD, et al. Evidence for a role of the PD‐1:PD‐L1 pathway in immune resistance of HPV‐associated head and neck squamous cell carcinoma. Cancer Res. 2013;73(6):1733‐1741. [DOI] [PMC free article] [PubMed] [Google Scholar]
- 18. He J, Hu Y, Hu M, Li B. Development of PD‐1/PD‐L1 pathway in tumor immune microenvironment and treatment for non‐small cell lung cancer. Sci Rep. 2015;5:13110. [DOI] [PMC free article] [PubMed] [Google Scholar]
- 19. Bates GJ, Fox SB, Han C, et al. Quantification of regulatory T cells enables the identification of high‐risk breast cancer patients and those at risk of late relapse. J Clin Oncol. 2006;24(34):5373‐5380. [DOI] [PubMed] [Google Scholar]
- 20. Perrone G, Ruffini PA, Catalano V, et al. Intratumoural FOXP3‐positive regulatory T cells are associated with adverse prognosis in radically resected gastric cancer. Eur J Cancer. 2008;44(13):1875‐1882. [DOI] [PubMed] [Google Scholar]
- 21. Ihara F, Sakurai D, Horinaka A, et al. CD45RA‐Foxp3high regulatory T cells have a negative impact on the clinical outcome of head and neck squamous cell carcinoma. Cancer Immunol Immunother. 2017;66:1275‐1285. [DOI] [PMC free article] [PubMed] [Google Scholar]
- 22. Salama P, Phillips M, Grieu F, et al. Tumor‐infiltrating FOXP3+ T regulatory cells show strong prognostic significance in colorectal cancer. J Clin Oncol. 2009;27(2):186‐192. [DOI] [PubMed] [Google Scholar]
- 23. Yeong J, Thike AA, Lim JCT, et al. Higher densities of Foxp3+ regulatory T cells are associated with better prognosis in triple‐negative breast cancer. Breast Cancer Res Treat. 2017;163(1):21‐35. [DOI] [PubMed] [Google Scholar]
- 24. Saito T, Nishikawa H, Wada H, et al. Two FOXP3(+)CD4(+) T cell subpopulations distinctly control the prognosis of colorectal cancers. Nat Med. 2016;22(6):679‐684. [DOI] [PubMed] [Google Scholar]
- 25. Yang L, Zhang Y. Tumor‐associated macrophages: from basic research to clinical application. J Hematol Oncol. 2017;10(1):58. [DOI] [PMC free article] [PubMed] [Google Scholar]
- 26. Pirila E et al. Macrophages modulate migration and invasion of human tongue squamous cell carcinoma. PLoS One. 2015;10(3):e0120895. [DOI] [PMC free article] [PubMed] [Google Scholar]
- 27. Ruffell B, Chang‐Strachan D, Chan V, et al. Macrophage IL‐10 blocks CD8+ T cell‐dependent responses to chemotherapy by suppressing IL‐12 expression in intratumoral dendritic cells. Cancer Cell. 2014;26(5):623‐637. [DOI] [PMC free article] [PubMed] [Google Scholar]
- 28. Kubota K, Moriyama M, Furukawa S, et al. CD163+CD204+ tumor‐associated macrophages contribute to T cell regulation via interleukin‐10 and PD‐L1 production in oral squamous cell carcinoma. Sci Rep. 2017;7(1):1755. [DOI] [PMC free article] [PubMed] [Google Scholar]
- 29. van Monsjou HS, van Velthuysen MLF, van den Brekel MWM, Jordanova ES, Melief CJM, Balm AJM. Human papillomavirus status in young patients with head and neck squamous cell carcinoma. Int J Cancer. 2012;130(8):1806‐1812. [DOI] [PubMed] [Google Scholar]
- 30. van Kempen PM, van Bockel L, Braunius WW, et al. HPV‐positive oropharyngeal squamous cell carcinoma is associated with TIMP3 and CADM1 promoter hypermethylation. Cancer Med. 2014;3(5):1185‐1196. [DOI] [PMC free article] [PubMed] [Google Scholar]
- 31. Ruiter DJ, Ferrier CM, van Muijen GN, et al. Quality control of immunohistochemical evaluation of tumour‐associated plasminogen activators and related components. Eur J Cancer. 1998;34(9):1334‐1340. [DOI] [PubMed] [Google Scholar]
- 32. Mehta AM, Jordanova ES, Kenter GG, Ferrone S, Fleuren GJ. Association of antigen processing machinery and HLA class I defects with clinicopathological outcome in cervical carcinoma. Cancer Immunol Immunother. 2008;57(2):197‐206. [DOI] [PMC free article] [PubMed] [Google Scholar]
- 33. Fine JP, Gray RJ. A proportional hazards model for the subdistribution of a competing risk. J Am Stat Assoc. 1999;94:496‐509. [Google Scholar]
- 34. Hu Y, He MY, Zhu LF, et al. Tumor‐associated macrophages correlate with the clinicopathological features and poor outcomes via inducing epithelial to mesenchymal transition in oral squamous cell carcinoma. J Exp Clin Cancer Res. 2016;35:12. [DOI] [PMC free article] [PubMed] [Google Scholar]
- 35. Hanahan D, Weinberg RA. Hallmarks of cancer: the next generation. Cell. 2011;144(5):646‐674. [DOI] [PubMed] [Google Scholar]
- 36. Galon J, Pagès F, Marincola FM, et al. Cancer classification using the Immunoscore: a worldwide task force. J Transl Med. 2012;10:205. [DOI] [PMC free article] [PubMed] [Google Scholar]
- 37. Garrido F, Ruiz‐Cabello F, Aptsiauri N. Rejection versus escape: the tumor MHC dilemma. Cancer Immunol Immunother. 2017;66(2):259‐271. [DOI] [PMC free article] [PubMed] [Google Scholar]
- 38. Nasman A, Andersson E, Marklund L, et al. HLA class I and II expression in oropharyngeal squamous cell carcinoma in relation to tumor HPV status and clinical outcome. PLoS One. 2013;8(10):e77025. [DOI] [PMC free article] [PubMed] [Google Scholar]
- 39. Nasman A, Andersson E, Nordfors C, et al. MHC class I expression in HPV positive and negative tonsillar squamous cell carcinoma in correlation to clinical outcome. Int J Cancer. 2013;132(1):72‐81. [DOI] [PubMed] [Google Scholar]
- 40. Kambayashi T, Laufer TM. Atypical MHC class II‐expressing antigen‐presenting cells: can anything replace a dendritic cell? Nat Rev Immunol. 2014;14(11):719‐730. [DOI] [PubMed] [Google Scholar]
- 41. Johnson DB, Estrada MV, Salgado R, et al. Melanoma‐specific MHC‐II expression represents a tumour‐autonomous phenotype and predicts response to anti‐PD‐1/PD‐L1 therapy. Nat Commun. 2016;7:10582. [DOI] [PMC free article] [PubMed] [Google Scholar]
- 42. Rangel LB, Agarwal R, Sherman‐Baust CA, et al. Anomalous expression of the HLA‐DR alpha and beta chains in ovarian and other cancers. Cancer Biol Ther. 2004;3(10):1021‐1027. [DOI] [PubMed] [Google Scholar]
- 43. Sconocchia G, Eppenberger‐Castori S, Zlobec I, et al. HLA class II antigen expression in colorectal carcinoma tumors as a favorable prognostic marker. Neoplasia. 2014;16(1):31‐42. [DOI] [PMC free article] [PubMed] [Google Scholar]
- 44. Samuels S, Spaans VM, Osse M, et al. Human leukocyte antigen‐DR expression is significantly related to an increased disease‐free and disease‐specific survival in patients with cervical adenocarcinoma. Int J Gynecol Cancer. 2016;26(8):1503‐1509. [DOI] [PubMed] [Google Scholar]
- 45. Mantovani A, Marchesi F, Malesci A, Laghi L, Allavena P. Tumour‐associated macrophages as treatment targets in oncology. Nat Rev Clin Oncol. 2017;14(7):399‐416. [DOI] [PMC free article] [PubMed] [Google Scholar]
- 46. Pyonteck SM, Akkari L, Schuhmacher AJ, et al. CSF‐1R inhibition alters macrophage polarization and blocks glioma progression. Nat Med. 2013;19(10):1264‐1272. [DOI] [PMC free article] [PubMed] [Google Scholar]
- 47. Ries CH, Cannarile MA, Hoves S, et al. Targeting tumor‐associated macrophages with anti‐CSF‐1R antibody reveals a strategy for cancer therapy. Cancer Cell. 2014;25(6):846‐859. [DOI] [PubMed] [Google Scholar]
- 48. Papadopoulos KP, Gluck L, Martin LP, et al. First‐in‐human study of AMG 820, a monoclonal anti‐Colony‐stimulating factor 1 receptor antibody, in patients with advanced solid tumors. Clin Cancer Res. 2017;23:5703‐5710. [DOI] [PubMed] [Google Scholar]
- 49. U'Ren L, Guth A, Kamstock D, Dow S. Type I interferons inhibit the generation of tumor‐associated macrophages. Cancer Immunol Immunother. 2010;59(4):587‐598. [DOI] [PMC free article] [PubMed] [Google Scholar]
- 50. Gonalons E, Barrachina M, García‐Sanz JA, Celada A. Translational control of MHC class II I‐A molecules by IFN‐gamma. J Immunol. 1998;161(4):1837‐1843. [PubMed] [Google Scholar]
- 51. Steimle V, Siegrist C, Mottet A, Lisowska‐Grospierre B, Mach B. Regulation of MHC class II expression by interferon‐gamma mediated by the transactivator gene CIITA. Science. 1994;265(5168):106‐109. [DOI] [PubMed] [Google Scholar]
- 52. Hong AM, Vilain RE, Romanes S, et al. PD‐L1 expression in tonsillar cancer is associated with human papillomavirus positivity and improved survival: implications for anti‐PD1 clinical trials. Oncotarget. 2016;7(47):77010‐77020. [DOI] [PMC free article] [PubMed] [Google Scholar]
- 53. Hu D, Liu X, Zeng W, Weiner HL, Ritz J. A clonal model for human CD8+ regulatory T cells: unrestricted contact‐dependent killing of activated CD4+ T cells. Eur J Immunol. 2012;42(1):69‐79. [DOI] [PMC free article] [PubMed] [Google Scholar]
- 54. Robb RJ, Lineburg KE, Kuns RD, et al. Identification and expansion of highly suppressive CD8(+)FoxP3(+) regulatory T cells after experimental allogeneic bone marrow transplantation. Blood. 2012;119(24):5898‐5908. [DOI] [PubMed] [Google Scholar]
- 55. Kiniwa Y, Miyahara Y, Wang HY, et al. CD8+ Foxp3+ regulatory T cells mediate immunosuppression in prostate cancer. Clin Cancer Res. 2007;13(23):6947‐6958. [DOI] [PubMed] [Google Scholar]
- 56. Feng Z, Bethmann D, Kappler M, et al. Multiparametric immune profiling in HPV‐ oral squamous cell cancer. JCI Insight. 2017;2(14). [DOI] [PMC free article] [PubMed] [Google Scholar]
Associated Data
This section collects any data citations, data availability statements, or supplementary materials included in this article.
Supplementary Materials
Figure S1 Identification and quantification of tumor‐associated T lymphocytes in tonsil. A) Hematoxylin–eosin staining staning of tonsillar tumor specimen. Tumor area was delimited by the segmented line. B) Tails segmentation of tumor‐containing area. 50% of random tails were used for the analysis. C) Pre‐selected tails were segmented into ‘tumor’ or “stroma” area. D) CD8+ lymphocytes found within or in proximity of tumor area were scored as tumor‐associated lymphocytes or stroma‐associated lymphocytes, respectively.
Figure S2 Effect of HLA‐DP/DQ/DR expression and numbers of CD68 + CD163+ TAMs on survival. Cumulative incidence analysis was performed with HLA‐DP/DQ/DR expression and numbers of TAMs. Importantly, only patients with high HLA‐DP/DQ/DR expression and low number of TAMs showed significantly improved DFS and DSS.
Figure S3 Impact of HPV status and treatment on disease free survival and disease progression. 2A) Effect of HPV status on the cumulative incidence or loco‐regional recurrence, metastasis (DFS) or disease‐specific death (DSS). 2B) Effect of different treatment regimens in the cumulative incidence or loco‐regional recurrence, metastasis (DFS) or disease‐specific death (DSS). ✢ P value is calculated between straight lines or segmented lines.
Table S1 List of all the antibodies used in this study.
Table S2 Quantification of the number of myeloid cells and lymphocytes in tumor, tumor margins and stroma in view of HPV status. Quantification of the multiplex immunofluorescence staining scored in the tumor and in the surrounding stroma. Median represents the median of number of cells/mm2.