

Abstract
Nonalcoholic fatty liver disease (NAFLD) is a major risk factor of many end‐stage liver diseases. Alterations in microRNA expression have been reported in patients with NAFLD. However, the transcriptional mechanism(s) of dysregulated microRNAs under the state of NAFLD is poorly described, and microRNAs that regulate the pathogenesis of NAFLD synergistically with their regulators remain unknown. Here we report that microRNA‐378 expression is significantly increased in fatty livers of mice and patients with NAFLD. Although microRNA‐378 locates within the intron of Ppargc1β (peroxisome proliferator‐activated receptor γ coactivator 1‐beta), there was a significant uncoupling of Ppargc1β mRNA and microRNA‐378 levels in both sources of fatty livers. Further studies identified a full‐length primary transcript of microRNA‐378. LXRα (liver X receptor alpha) functioned as a transcription activator of microRNA‐378 and a repressor of Ppargc1β transcription. It is known that miR‐378 is an inhibitor of fatty acid oxidation (FAO) and the function of Ppargc1β is opposite to that of miR‐378. GW3965 treatment (LXRα agonist) of murine hepatocytes and mice increased microRNA‐378 and reduced Ppargc1β, which subsequently impaired FAO and aggravated hepatosteatosis. In contrast, additional treatment of miR‐378 inhibitor or Ppargc1β, which knocked down increased miR‐378 or recovered expression of Ppargc1β, offset the effects of GW3965. Liver‐specific ablation of Lxrα led to decreased miR‐378 and increased Ppargc1β, which subsequently improved FAO and reduced hepatosteatosis. Conclusion: Our findings indicated that miR‐378 possesses its own transcription machinery, which challenges the well‐established dogma that miR‐378 transcription is controlled by the promoter of Ppargc1β. LXRα selectively activates transcription of miR‐378 and inhibits expression of Ppargc1β, which synergistically impairs FAO. In addition to lipogenesis, impaired FAO by miR‐378 in part contributes to LXRα‐induced hepatosteatosis.
Abbreviations
- AKT1
v‐akt murine thymoma viral oncogene homolog 1
- ANOVA
analysis of variance
- ASO
antisense oligonucleotide
- DGCR8
DiGeorge syndrome critical region gene 8
- DMEM
Dulbecco’s modified Eagle’s medium
- DMSO
dimethylsulfoxide
- EST
expressed sequence tag
- FAO
fatty acid oxidation
- HFD
high fat diet
- LXRα
liver X receptor alpha
- MC
minicircle
- MM
mis‐matched
- MTP
microsomal transfer protein
- NAFLD
nonalcoholic fatty liver disease
- NASH
nonalcoholic steatohepatitis
- Nrf1
nuclear respiratory factor 1
- NS
no significance
- OCR
oxygen consumption rate
- PGC1β
peroxisome proliferator‐activated receptor γ coactivator 1 β
- PPARα
peroxisome proliferator‐activated receptor alpha
- Pri‐miR‐378
primary transcript of miR‐378
- RACE
rapid amplification of cDNA end
- RCT
reverse cholesterol transport
- SD
standard diet
- shRNA
short hairpin RNA
- SREBPs
sterol regulatory element‐binding proteins
- TTR
transthyretin
- VLDL
very low density lipoprotein‐triglyceride
- WT
wild type
The incidence of nonalcoholic fatty liver disease (NAFLD) is estimated to be 20%‐45% in the general population of the Western world due to the prevalence of obesity.1 Although NAFLD carries a relatively benign prognosis, a significant proportion of patients progress to nonalcoholic steatohepatitis (NASH) and later cirrhosis with the risk of hepatocellular carcinoma (HCC).2 It is estimated that NASH accounts for more than 13% of HCC cases in the United States.3 Several mechanisms may lead to hepatosteatosis, including increased fat supply, decreased fat export in the form of very low density lipoprotein‐triglyceride (VLDL), decreased fatty acid oxidation (FAO), and increased de novo lipogenesis.4 Although the pathogenesis of NAFLD has been studied extensively, its underlying mechanism(s) remains speculative.
The discovery of a class of naturally occurring small noncoding RNAs, termed microRNAs (miRNAs),5 has stimulated a new field of research on the mechanism of NAFLD. miRNAs function primarily by binding to the 3'‐untranslated regions of mRNAs, which leads to either mRNA cleavage or translational pausing.5 Alterations in miRNA expression have been reported in patients with NAFLD.6, 7 Although most studies focus on the role of miRNAs in regulating the pathogenesis of NAFLD/NASH,8 few are designed to understand the basic mechanisms of transcriptional control of miRNAs that are dysregulated in NAFLD.
miRNA genes are categorized based on genomic location, including intronic miRNAs in noncoding transcripts, exonic miRNAs in noncoding transcripts, intronic miRNAs in protein‐coding transcripts, and exonic miRNAs in protein‐coding transcripts.9 It is widely accepted that both exonic and intronic miRNAs in protein‐coding transcripts share the transcription machinery with their host genes.9, 10 One such miRNA is miR‐378, which is embedded within the first intron of Ppargc1β (peroxisome proliferator‐activated receptor γ coactivator 1‐beta).10 Ppargc1β encodes peroxisome proliferator‐activated receptor γ coactivator 1 (PGC1β), a transcriptional coactivator that regulates mitochondrial biogenesis, thermogenesis, and glucose and fatty acid metabolism.11 Liver‐specific deficiency of Ppargc1β leads to reduced FAO and hepatosteatosis.12 Lack of PGC1β also impaired secretion of VLDL, resulting in hepatosteatosis.13, 14 In contrast, hepatocyte‐specific expression of Ppargc1β leads to improved mitochondrial oxidative phosphorylation, FAO, and VLDL secretion.15 All of these findings indicate that PGC1β plays a key role in the pathogenesis of hepatosteatosis.
It is widely accepted that miR‐378 is co‐transcribed with Ppargc1β, and a high fat diet (HFD) induces expression of both Ppargc1β and miR‐378.10 However, miR‐378 functions as a promoter of hepatosteatosis by impairing FAO,10 which is opposite to that of PGC1β. Based on the opposing functions of PGC1β and miR‐378 in regulating energy metabolism in the liver, miR‐378 levels should be inversely correlated with those of Ppargc1β mRNA. Thus, we hypothesized that miR‐378 possesses its own transcriptional machinery that is independent of Ppargc1β. In the present study, we investigate the regulatory mechanism of miR‐378 biogenesis in fatty livers and determine how miR‐378 and Ppargc1β synergistically modulate the pathogenesis of hepatosteatosis.
Materials and Methods
Human Liver Biopsies
Human liver biopsies were obtained during liver transplantation for histological analysis by full trained pathologists and surgeons (University of Kansas Medical Center [KUMC] and Union Hospital, Tongji Medical College, China). A total of 24 specimens with NAFLD/NASH and 19 control subjects (normal liver) were used for our study. Tissues were obtained and handled in accordance with the guidelines set by the medical ethical committees of KUMC and Tongji Medical College. This project used only pathological specimens that were de‐identified and publicly available; hence, the research meets the definition of “exempt” under exemption 4 (page 213 [III‐30]) on SF424. The etiology of NAFLD and normal livers is available in Supporting Table S1.
Preparation of Minicircle Expression Vectors
Parental minicircle (MC) vectors were purchased from System Biosciences (Cat. MN511A‐1, Palo Alto, CA). We inserted miR‐378 precursor, Lxrα (liver X receptor alpha) short hairpin RNA (shRNA), Lxrα open reading frame (ORF), or Ppargc1β ORF into the minicircle parental plasmid. A transthyretin gene (TTR) promoter was used to ensure their liver‐specific expression.16 This construct was referred to as MC‐TTR‐miR‐378, MC‐TTR‐Lxrα‐shRNA, MC‐TTR‐Lxrα, or MC‐TTR‐Ppargc1β. To prepare the minicircle, a parental minicircle vector was transformed into a special host E. coli bacterial strain ZYCY10P3S2T (Cat. MN900A‐1; System Biosciences). Minicircles were prepared based on the manufacturer’s instruction.
GW3965 Treatment of Mice
Eight‐week‐old male C57Bl6 mice kept on standard diet (Open Source D12450B: 10% Kcal fat) were divided into four groups. Group I (n = 9) received dimethylsulfoxide (DMSO) and scramble (control); group II (n = 9) received GW3965; group III (n = 9) received GW3965 and miR‐378‐ASO (antisense oligonucleotide) (25 mg/kg); and group IV (n = 9) received miR‐378‐ASO and MC‐TTR‐Ppargc1β. GW3965 (30 mg/kg) was intraperitoneally injected into mice daily for 8 weeks. Mice were injected with miR‐378‐ASO (25 mg/kg body weight) and MC‐TTR‐Ppargc1β (1.5 mg/kg body weight) weekly by tail vein for 8 weeks. Before sacrifice, mice were fasted for 8 hours. Blood and livers were then harvested for further analysis.
Minicircle Vector Injection of Mice
Eight‐week‐old male C57Bl/6 mice were kept on the HFD (Open Source D12492: 60% Kcal fat) for 8 weeks. At 16 weeks of age, mice were injected with MC‐TTR‐Lxrα‐shRNA Mis‐matched (MM) (control, n = 10), MC‐TTR‐Lxrα‐shRNA (n = 10), or a combination of MC‐TTR‐Lxrα‐shRNA and MC‐TTR‐miR‐378. Mice received a dose of 1.5 μg/g MC‐TTR‐Lxrα‐shRNA complexed with in vivo jetPEI (Polyplus Transfection, Strasbourg, France) weekly for 8 weeks through tail vein injection. Before sacrifice, mice were fasted for 8 hours. Mice were then anesthetized, and blood was collected by way of cardiac puncture. Livers were harvested for gene expression and histological analysis.
Primary Hepatocyte Isolation
Primary hepatocytes were isolated from mouse livers through sequential perfusion of the portal vein with perfusion buffer (1× Hanks’ balanced salt solution (HBSS) containing 0.5 mmol/L ethylene diamine tetraacetic acid and 5 mmol/L HEPES [4‐(2‐hydroxyethyl)‐1‐piperazine ethanesulfonic acid], pH 7.2) and collagenase buffer (1 mg/mL collagenase type IV in 1× HBSS, 0.5 mmol/L CaC12, 5 mmol/L HEPES, pH 7.2). After perfusion, lobes of the liver were torn apart and the liver was mostly dissolved into the collagenase buffer. The remaining solid particles were discarded and the suspension was filtered through a 70‐μm membrane. Hepatocytes were washed 3 times at 4°C at 50 g for 2 minutes using Dulbecco’s modified Eagle’s medium (DMEM) with 10% fetal bovine serum (FBS). Cell viability was assessed by 0.4% Trypan Blue staining. Freshly isolated hepatocytes were used to determine the oxygen consumption rate (OCR).
Measurement of OCR
Primary mouse hepatocytes were seeded into collagen‐coated XF24 plates (Seahorse Bioscience, Billerica, MA) at 4×10⁴ cells/well in DMEM with 10% FBS. After 2 hours of adherence, OCR of hepatocytes was measured using the XF24 extracellular flux analyzer from Seahorse Bioscience. Detailed methods and reagent are available in the Supporting Information.
Statement on Institutional Approval for Mice Experimentation
Eight‐week‐old wild‐type (WT) male C57BL/6J mice (Jackson Laboratory, Bar Harbor, ME) were used for the experiments. Mice were housed in a barrier facility on a 12‐hour light cycle with free access to water and diet. Animal care, plasmid injection, and surgical procedures were conducted in compliance with an approved Institutional Animal Care and Use Committee protocol by the University of Minnesota and those set forth in the “Guide for the Care and Use of Laboratory Animals” as published by the National Research Council.
Statistical Analysis
Statistical analysis was performed using GraphPad Prism Software (La Jolla, CA). Statistical significance between two groups was assessed by a two‐tailed Student t test. Analysis of variance (ANOVA) was used to compare the statistical difference among multiple groups, followed by the Tukey post hoc test. All of the experiments were repeated at least 3 times on separate occasions. P < 0.05 was considered to be statistically significant.
Results
MiR‐378 is Robustly Induced in Fatty Livers of Dietary Obese Mice and Patients with NAFLD
Because hepatocytes represent the major site for lipid metabolism in the liver, we initially attempted to identify miRNAs that were highly and specifically expressed in hepatocytes by comparing miRNA profiles of livers of hepatocyte‐specific Dicer1 knockout and WT mice. DICER1 is a critical enzyme for miRNA maturation and its ablation impairs biogenesis of miRNAs.17 Among miRNAs that were reduced after Dicer1 knockout, miR‐378 was reduced by at least 3‐fold in Dicer1 knockout mice, suggesting that hepatocytes represent a major source of miR‐378 expression (Fig. 1A). To study the role of miR‐378 in NAFLD, we treated C57Bl/6 mice with a HFD to induce hepatosteatosis (Supporting Fig. S1A,B). As expected, miR‐378 expression was robustly increased in livers of HFD‐treated mice (Fig. 1B). Oleic acids (OAs) are the most abundant unsaturated fatty acids in liver triglycerides in human individuals.18 Human hepatoma HepG2 cells were used for our in vitro models because of their increased sensitivity to fat accumulation. OA treatment increased intracellular lipids in HepG2 cells (Supporting Fig. S1C), which were associated with increased miR‐378 (Fig. 1C). In human NASH tissues (n = 24), miR‐378 expression was also elevated compared with normal liver samples (n = 19) (Fig. 1D).
Figure 1.
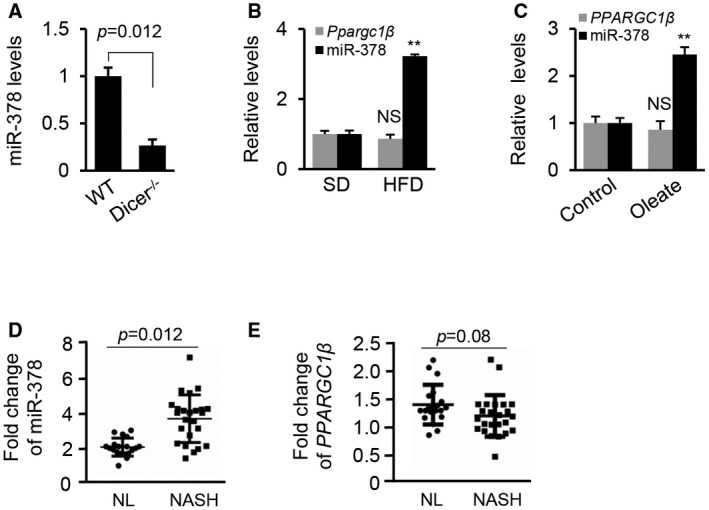
Expression of miR‐378 is uncoupled with levels of Ppargc1β mRNA. (A) Levels of miR‐378 in livers of Dicer1 deficiency mice (n = 6) compared with WT mice (n = 6). (B) Levels of miR‐378 and Ppargc1β in livers of HFD‐fed mice (n = 6) compared with SD‐fed mice (n = 6). (C) Levels of miR‐378 and PPARGC1β in HepG2 cells treated with oleate (0.5 mM). HepG2 cells treated with DMEM medium without oleate served as the control. (D,E) Levels of miR‐378 and PPARGC1β in livers from healthy individuals (n = 19) and patients with NASH (n = 24). The data shown are representative of an experiment repeated 3 times and conducted in triplicate. Data represent the mean ± SEM. Student t test was used for statistical analysis. **P < 0.01. Abbreviations: NL, normal liver; NS, no significance.
Because Ppargc1β is the only identified host gene of miR‐378, we measured the change in expression of Ppargc1β in fatty livers of HFD‐treated mice, HepG2 cells with accumulated lipid, and patients with NAFLD. As shown in Fig. 1B,C, a slight decrease (not statistically significant) in mRNA levels of Ppargc1β was detected in fatty livers of mice and HepG2 cells with accumulated lipid. No significant change in PPARGC1β mRNA was observed in 24 human NASH samples compared with 19 human normal liver samples (Fig. 1E). Together, our studies indicated that expression of miR‐378 is uncoupled with that of Ppargc1β in fatty livers.
Copy Number of Mature miR‐378 is Significantly Greater than that of Ppargc1β mRNAs in Fatty Livers
To confirm our observation, we used an absolute real‐time quantitative‐PCR approach to measure the copy numbers of miR‐378 and Ppargc1β mRNA in livers of HFD‐treated mice. Consistent with our previous observation (Fig. 1B), the copy number of miR‐378 was 3‐fold higher in livers of HFD‐treated than standard diet (SD)–treated mice (Fig. 2A), whereas no significant change in the copy number of Ppargc1β mRNA was observed (Fig. 2B). If Ppargc1β and miR‐378 share the same promoter, the copy numbers of Ppargc1β mRNA and miR‐378 should be the same or at least similar. In fact, the copy number of miR‐378 was approximately 20 or 80 times higher than that of Ppargc1β mRNAs in the livers of SD‐treated or HFD‐treated mice, respectively (Fig. 2C,D). Furthermore, no significant change in PGC1β protein was observed in the fatty livers of HFD‐treated mice versus control mice, oleate‐treated HepG2 cells, and human fatty livers versus normal livers (Supporting Fig. S2A‐F). In muscles of HFD‐treated mice, mRNA levels of Ppargc1β were also inversely correlated with the levels of miR‐378 (Fig. 2E,F). This phenomenon was also observed in humans with diabetes and obesity.19, 20 In summary, despite being located in the intron of Ppargc1β in the forward direction of transcription, the copy number of miR‐378 was substantially higher than that of Ppargc1β mRNA.
Figure 2.
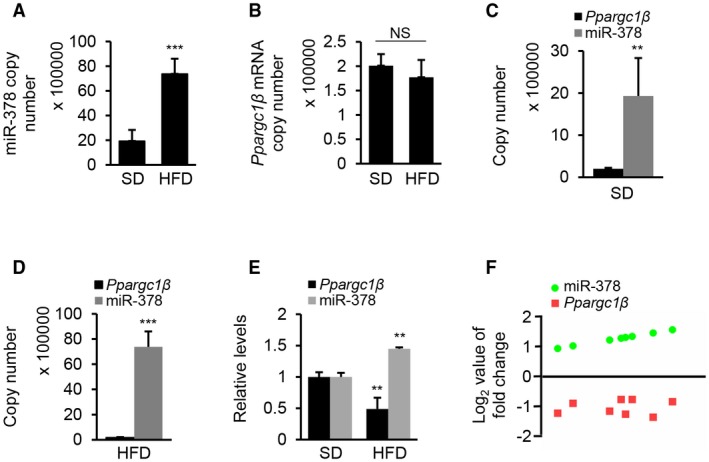
The copy number of miR‐378 is substantially higher than that of Ppargc1β mRNA in fatty livers of mice. (A) Copy numbers of miR‐378 in livers of HFD‐treated (n = 6) and SD‐fed mice (control, n = 6). (B) Copy numbers of Ppargc1β mRNA in livers of HFD‐treated (n = 6) and SD‐fed mice (control, n = 6). (C) Comparison of the copy numbers of miR‐378 and Ppargc1β mRNA in livers of SD‐fed mice. (D) Comparison of the copy numbers of miR‐378 and Ppargc1β mRNA in livers of HFD‐fed mice. (E) Relative levels of miR‐378 and Ppargc1β in muscles of HFD‐treated (n = 6) and SD‐fed mice (control, n = 6). (F) An inverse correlation of Ppargc1β mRNA and miR‐378 levels in HFD‐treated mice (Spearman correlation analysis). The y axis represents the log2 fold change of gene expression. Student t test was used for statistical analysis. Data represent the mean ± SEM. **P < 0.01; and ***P < 0.001.
Hepatic Lipid Accumulation did not Significantly Change the Expression of Dgcr8 and Dicer1
Biogenesis of miRNAs is tightly controlled by transcription of miRNA primary transcript or their host genes and miRNA maturation. As NAFLD is known to affect gene transcription and protein synthesis, levels of the microprocessor complexes could be altered by NAFLD, leading to changes in the expression patterns of miRNAs. To test this possibility, we examined the mRNA levels of DGCR8 (DiGeorge syndrome critical region gene 8) and DICER1 that encode two critical enzymes of miRNA maturation.21 No changes in mRNA and protein levels of DICER1 and DGCR8 were observed in HepG2 cells with accumulated lipid, fatty livers of mice, and NASH samples from patients (Fig. 3A‐C). Thus, we speculated that maturation of miR‐378 was not responsible for increased miR‐378 in fatty livers.
Figure 3.
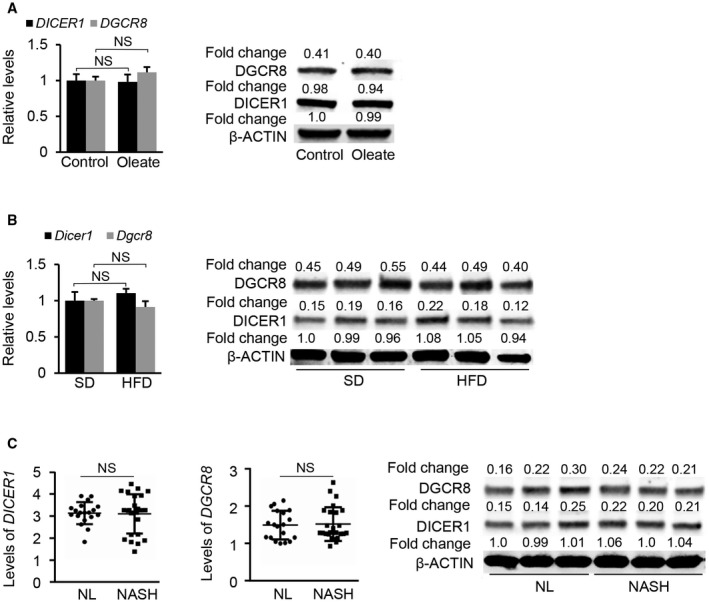
mRNA levels of DICER1 and DGCR8 in fatty livers of mice and patients with NAFLD. (A) mRNA and protein levels of DICER1 and DGCR8 in human HepG2 cells treated with oleate. (B) mRNA and protein levels of Dicer1 and Dgcr8 in livers of HFD‐fed mice (n = 6) compared with SD‐fed mice (n = 6). (C) mRNA levels of DICER1 and DGCR8 in normal liver tissues (n = 19) compared with NASH samples from patients (n = 24). Protein levels of DICER1 and DGCR8 were determined in normal liver tissues (n = 3) compared with NASH samples from patients (n = 3). Student t test was used for statistical analysis. Data represent the mean ± SEM. Abbreviations: NL, normal liver.
MiR‐378 Transcription is Independent of Ppargc1β and Regulated by its Own Promoter
Uncoupled expression of miR‐378 and Ppargc1β led us to hypothesize that transcription regulation of miR‐378 is responsible for increased miR‐378 in fatty livers, which is independent of the transcription machinery of Ppargc1β. Many miRNAs are transcribed by RNA polymerase II, and primary transcripts of miRNAs appear as mRNA‐like RNAs (miRNA primary transcript).5 Thus, we attempted to identify a full‐length primary transcript of miR‐378 (Pri‐miR‐378), allowing us to identify the promoter of miR‐378. Specifically, we used a database‐mining approach to search a mouse non‐RefSeq RNA database and identified an expressed sequence tag (EST) (AK045690.1) that contained the miR‐378 precursor (Fig. 4A). We next conducted a 5’RACE (rapid amplification of cDNA end) to ascertain the 5′‐end of the transcript (Supporting Fig. S3A). Sequencing of a strong 5’RACE PCR product (Fig. 4B, Supporting Fig. S3B) confirmed the transcription start site of Pri‐miR‐378, which was located 1,770 nt upstream of the miR‐378 precursor (Supporting Fig. S3A). Through an EST extension approach and 3’RACE, we identified the 3’ end and polyA tail of the Pri‐miR‐378 (Supporting Fig. S3C). Based on the EST sequence, 5’RACE, and 3’RACE, the full‐length of Pri‐miR‐378 was 3,279 bp (Supporting Fig. S3A). To confirm the length of Pri‐miR‐378, we performed northern blot analysis with a probe designed based on the AK045690.1. A large transcript (> 3 kb) was detected in RNAs from livers of HFD‐treated mice (Fig. 4C). This likely corresponded to Pri‐miR‐378 and confirmed our database mining and RACE results. Northern blot also confirmed that levels of Pri‐miR‐378 were significantly higher in livers of HFD‐treated than SD‐treated mice (Fig. 4C). Levels of Pri‐miR‐378 were also increased in patients with NAFLD (Fig. 4D), indicating that miR‐378 primary transcript exists in human livers. Together, although miR‐378 locates within the intron of Ppargc1β, our findings indicated that miR‐378 possesses its own transcription machinery (Fig. 4E).
Figure 4.
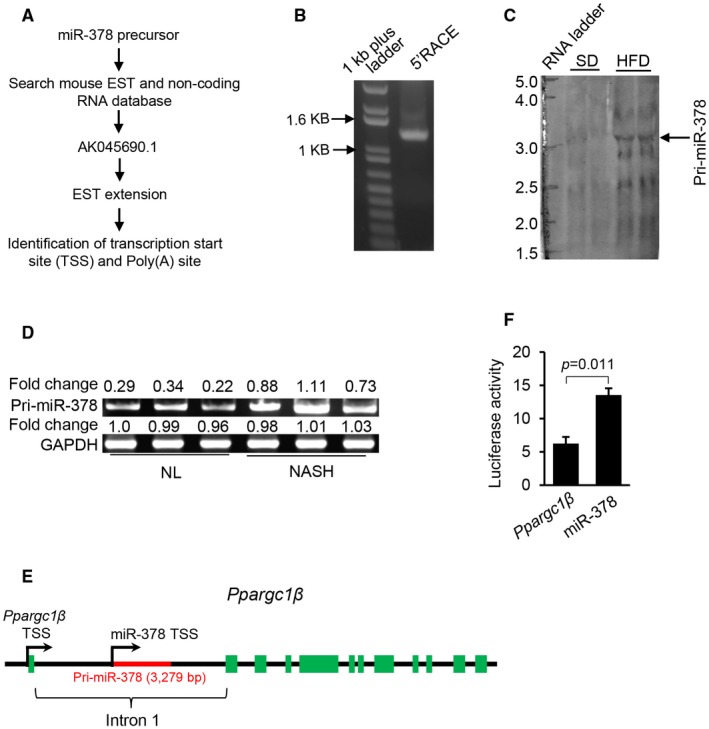
miR‐378 is transcribed independently of Ppargc1β. (A) Schematic representation to identify Pri‐miR‐378. (B) PCR product of 5’RACE (1,211 bp). (C) Northern blot analysis of Pri‐miR‐378 in livers of mice fed with SD (n = 2) and HFD (n = 2). (D) Increased levels of Pri‐miR‐378 in the fatty livers of patients with NAFLD (n = 3) compared with normal livers (n = 3). Semiquantitative PCR was used to determine the levels of Pri‐miR‐378 in human livers. (E) Genomic locus–encoding miR‐378 and Ppargc1β. (F) Luciferase activity of the reporter vector containing the promoter of either miR‐378 or Ppargc1β. Student t test was used for statistical analysis. Data represent the mean ± SEM. The data shown are representative of an experiment repeated 3 times and conducted in triplicate. Abbreviations: GAPDH, glyceraldehyde 3‐phosphate dehydrogenase.
We then determined whether the putative miR‐378 promoter can initiate transcription of Pri‐miR‐378. Two reporter vectors were generated, in which the transcription of luciferase gene in Hepa1‐6 cells was driven by the promoter for either miR‐378 or Ppargc1β. Consistent with the different copy numbers of miR‐378 and Ppargc1β mRNA in fatty livers, the transcriptional activity of Pri‐miR‐378 promoter was significantly higher than that of Ppargc1β (Fig. 4F). Together, transcription of miR‐378 and Ppargc1β was modulated by two separate and independent promoters.
LXRα Exerts the Opposite Effects on Transcription of miR‐378 and Ppargc1β
To investigate the mechanisms for the uncoupled expression of miR‐378 and Ppargc1β, we predicted the potential binding sites for transcription factors within the promoter regions of Pri‐miR‐378 and Ppargc1β.22 The analysis revealed a highly conserved binding motif for LXRα within the promoter of Pri‐miR‐378 (Fig. 5A). Accordingly, the mRNA level of Lxrα was increased in fatty livers of HFD‐treated mice (Fig. 5B). In part, because of its importance in regulating lipogenesis,23 we investigated whether Lxrα was able to modulate the transcription of Pri‐miR‐378 and Ppargc1β. The action of LXRα on the promoters of Ppargc1β and Pri‐miR‐378 was then examined by luciferase assay. Overexpression of Lxrα increased the activity of the Pri‐miR‐378 promoter while decreasing that of the Ppargc1β promoter (Fig. 5C). In contrast, knockdown of Lxrα led to an opposite effect (Fig. 5C). These results indicate that LXRα was able to increase the promoter activity of Pri‐miR‐378 but reduced that of the Ppargc1β promoter. To test whether the binding motif for LXRα within the Pri‐miR‐378 promoter was essential for increased expression of miR‐378, we introduced a mutation into the LXRα binding motif. Indeed, the mutation impaired the ability of LXRα to promote transcription of Pri‐miR‐378 (Fig. 5D). Lxrα overexpression significantly increased the levels of mature miR‐378 and Pri‐miR‐378 and reduced the expression of Ppargc1β, whereas inhibition of endogenous Lxrα resulted in opposite effects (Fig. 5E). To examine whether LXRα physically interacts with the promoter of Pri‐miR‐378, we performed chromatin immunoprecipitation (ChIP). DNA fragments containing LXRα binding sites within the Pri‐miR‐378 promoter were immune‐precipitated from the genomic DNA of mouse livers by an LXRα antibody (Fig. 5F). Although LXRα impaired the transcription of Ppargc1β (Fig. 5C), we did not identify any binding site for LXRα within the promoter of Ppargc1β.
Figure 5.
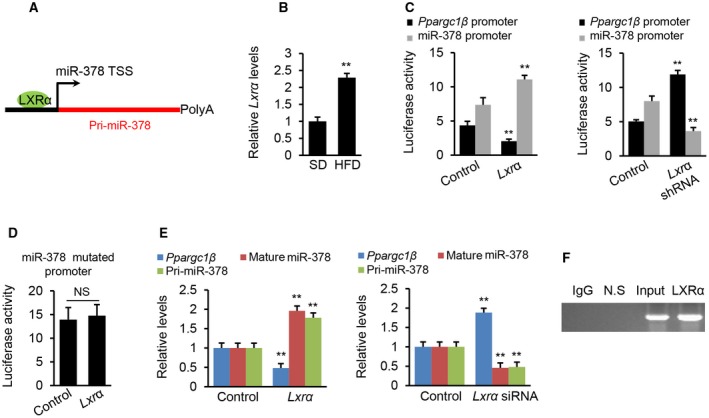
LXRα acts as a transcription activator of miR‐378 and a repressor of Ppargc1β expression. (A) Schematic representation of LXRα binding site within the promoter of miR‐378. (B) mRNA levels of Lxrα in livers of HFD‐fed mice (n = 6) compared with SD‐fed mice (n = 6). (C) Luciferase activities of miR‐378 and Ppargc1β promoters after overexpression or knockdown of Lxrα in Hepa1‐6 cells. Hepa1‐6 cells received the luciferase vector, and empty vector served as the control. (D) Luciferase activity of miR‐378 promoter with the mutated binding site after Lxrα overexpression. Hepa1‐6 cells received the luciferase vector with the mutated binding site serving as the control. (E) Levels of mature miR‐378, Pri‐miR‐378, and Ppargc1β mRNA in Hepa1‐6 cells after overexpression or knockdown of Lxrα. Overexpression of Lxrα reduced mRNA levels of Ppargc1β and increased Pri‐miR‐378 and mature miR‐378, whereas knockdown of Lxrα led to an opposite effect. Hepa1‐6 cells were transfected with MC‐TTR‐Lxrα or MC‐TTR‐Lxrα‐shRNA to overexpress or knock down Lxrα. (F) In vivo ChIP assays were performed using genomic DNA isolated from mouse livers, and binding of LXRα to the endogenous promoter of miR‐378 was detected using specific LXRα antibodies. Data represent the mean ± SEM. The data shown are representative of an experiment repeated 3 times and conducted in triplicate. **P < 0.01. Student t test was used for statistical analysis. Abbreviations: N.S., nonspecific control using primers of approximately 10 kb downstream of miR‐378 promoter, which served as negative control. Abbreviations: IgG, immunoglobulin G.
To validate our findings, we used the dCas9‐KRAB system to insert a “block” within the promoter of miR‐378 in the genome of Hepa1‐6 cells,24 which blocks the transcription of miR‐378. We then overexpressed Lxrα in WT Hepa1‐6 cells and Hepa1‐6 cells treated with dCas9‐KRAB. Real‐time quantitative PCR revealed that overexpression of Lxrα increased miR‐378 and repressed the expression of Ppargc1β in WT Hepa1‐6 cells (Supporting Fig. S4A). In contrast, in Hepa1‐6 cells treated with dCas9‐KRAB, overexpression of Lxrα failed to activate miR‐378 but still repressed the expression of Ppargc1β (Supporting Fig. S4B), indicating that miR‐378 has its own promoter.
In summary, LXRα can physically bind to the promoter of miR‐378 and induce miR‐378 transcription. In contrast, LXRα significantly inhibited the transcription of Ppargc1β through an unknown mechanism. Notably, these findings provided an explanation for uncoupled expression of miR‐378 and Ppargc1β.
LXRα Agonist Impaired FAO by Simultaneously Facilitating Transcription of miR‐378 and Inhibiting Expression of Ppargc1β
We next determined the functional contribution of pathways of LXRα‐miR‐378 and LXRα‐PGC1β to the pathogenesis of NAFLD. Despite the role of LXRα in activating sterol regulatory element‐binding proteins (Srebp1c)‐mediated lipogenesis,25 its function in regulating FAO was unknown. Because LXRα induces miR‐378 and inhibits Ppargc1β, two critical regulators of FAO, we hypothesized that LXRα impairs FAO by increasing miR‐378 and inhibiting Ppargc1β. GW3965 is a widely used agonist to activate LXRα.26 GW3965 treatment reduced the mRNA levels of Ppargc1β (Fig. 6A) and increased miR‐378 expression in Hepa1‐6 cells and the livers of mice (Fig. 6B).
Figure 6.
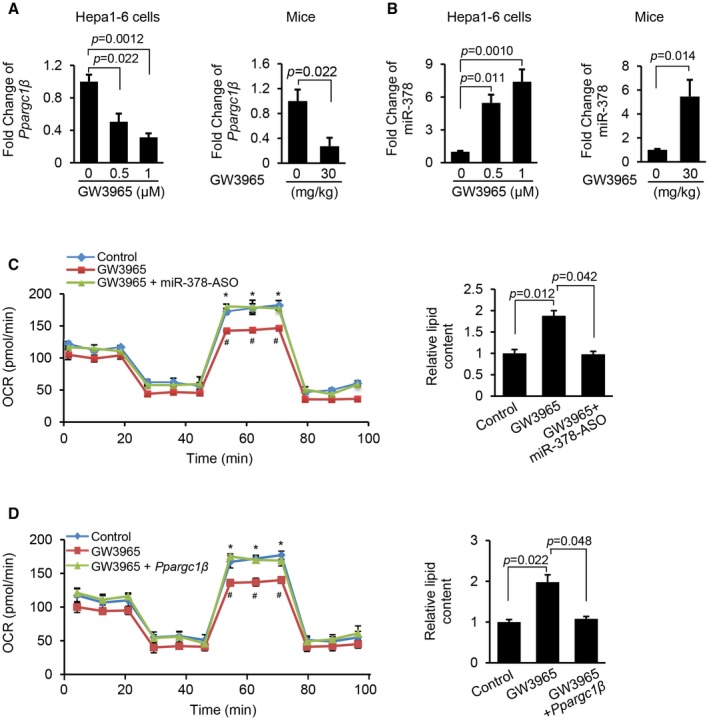
LXRα agonist treatment reduced the mRNA levels of Ppargc1β and increased the expression of miR‐378 in livers of mice and Hepa1‐6 cells. (A) mRNA levels of Ppargc1β in Hepa1‐6 cells and livers of mice treated with GW3965. Hepa1‐6 cells treated with 2% DMSO served as control. C57Bl/6 mice (n = 6) was treated with 30 mg/kg GW3965, and the control mice received 2% DMSO, serving as the control (n = 6). (B) Levels of miR‐378 in Hepa1‐6 cells and livers of mice treated with GW3965. (C) FAO rate and intracellular lipid content in three groups of Hepa1‐6 cells treated with scramble and 2% DMSO (control), GW3965, and a combination of GW3965 and miR‐378‐ASO. OCR statistical analysis: GW3965 versus control (# P < 0.05) and a combination of GW3965 and miR‐378‐ASO versus GW3965 (*P < 0.05). (D) FAO rate and intracellular lipid content in Hepa1‐6 cells that are treated with empty vector and 2% DMSO, GW3965, or a combination of GW3965 and MC‐TTR‐Ppargc1β. OCR statistical analysis: GW3965 versus control (# P < 0.05) and a combination of GW3965 and MC‐TTR ‐ Ppargc1β versus GW3965 (*P < 0.05). Data represent the mean ± SEM. The data shown are representative of an experiment repeated 3 times and conducted in triplicate. Student t test was used for statistical analysis in (A) and (B); and ANOVA was used for statistical analysis in (C) and (D).
To further test our hypothesis, Hepa1‐6 cells incubated with oleate were treated with either GW3965 or a combination of miR‐378‐ASO and GW3965. Such a design allowed us to determine whether miR‐378 mediates the inhibitory effect of LXRα on FAO. As expected, GW3965 treatment impaired FAO, whereas additional treatment of miR‐378‐ASO, which antagonized elevated miR‐378 due to GW3965 treatment, offset the inhibitory effect of GW3965 on FAO (Fig. 6C). Consistent with the impaired FAO, GW3965 significantly increased intracellular lipid content in Hepa1‐6 cells, whereas additional treatment of miR‐378‐ASO reduced the levels of lipid accumulation (Fig. 6C). Based on these observations, our attention was drawn to genes controlling FAO. GW3965 treatment impaired the expression of FAO genes encoding carnitine palmitoyltransferase 1 alpha (CPT1α), acyl‐coenzyme A oxidase 1 (ACOX1), peroxisome proliferator‐activated receptor alpha (PPARα), acyl‐coenzyme A dehydrogenase 1 (ACAD1), and acyl‐CoA dehydrogenase, very long chain (VLCAD),27, 28 and expression of these genes recovered after miR‐378‐ASO was introduced into Hepa1‐6 cells (Supporting Fig. S5A). Together, LXRα negatively controls the FAO primarily through activation of miR‐378.
We next introduced MC‐TTR‐Ppargc1β into Hepa1‐6 cells treated with GW3965. The results showed that GW3965 treatment dramatically impaired the ability of Hepa1‐6 cells to oxidize fatty acid and increased intracellular lipid content, while re‐introduction of Ppargc1β partially rescued the ability of Hepa1‐6 cells to oxidize fatty acid, which subsequently decreased intracellular lipid content (Fig. 6D). Additional treatment of Ppargc1β also recovered expression of FAO‐related genes that were repressed by GW3965 (Supporting Fig. S5B). Together, in addition to facilitating lipogenesis, LXRα exerts the inhibitory effect on FAO by facilitating transcription of miR‐378 and inhibiting the expression of Ppargc1β.
Both Ppargc1β and miR‐378 Mediate the Development of Hepatosteatosis in GW3965‐Treated Mice
We hypothesized that both Ppargc1β and miR‐378 contribute to the development of hepatosteatosis in GW3965‐treated mice. To test this hypothesis, 8‐week‐old C57Bl6 mice kept on SD were treated with either 2% DMSO (control), GW3965, a combination of GW3965 and miR‐378‐ASO, or a combination of GW3965 and MC‐TTR‐Ppargc1β for 8 weeks. GW3965 treatment increased miR‐378, and additional treatment of miR‐378‐ASO knocked down elevated miR‐378 (Fig. 7A). Phenotypically, GW3965 treatment increased liver weight and plasma triglycerides and reduced blood glucoses (Supporting Table S2), whereas additional treatment of miR‐378‐ASO partially offset the effects of GW3965 on liver weight and plasma lipid but failed to recover reduced glucose level (Supporting Table S2). No significant change was observed in body weight and plasma cholesterol among the three groups of mice (Supporting Table S2). OCR analysis showed that GW3965 treatment impaired FAO in hepatocytes, while further knockdown of miR‐378 offset the inhibitory effect of GW3965 (Fig. 7B). These findings suggest that GW3965 functions as an inhibitor of FAO by inducing expression of miR‐378. We next compared three groups of mice treated with either 2% DMSO (control), GW3965, or a combination of GW3965 and Ppargc1β. Additional treatment of Ppargc1β exhibited similar effects to those of miR‐378‐ASO on body and liver weight, plasma triglycerides, and levels of glucose (Supporting Table S2). Furthermore, GW3965 treatment reduced the expression of Ppargc1β and impaired FAO, whereas additional treatment of MC‐TTR‐Ppargc1β offset the effects of GW3965 (Fig. 7C,D). These findings indicate that both Ppargc1β and miR‐378 are not involved in LXRα‐modulated insulin signaling and gluconeogenesis, at least in fasted mice treated with SD.
Figure 7.
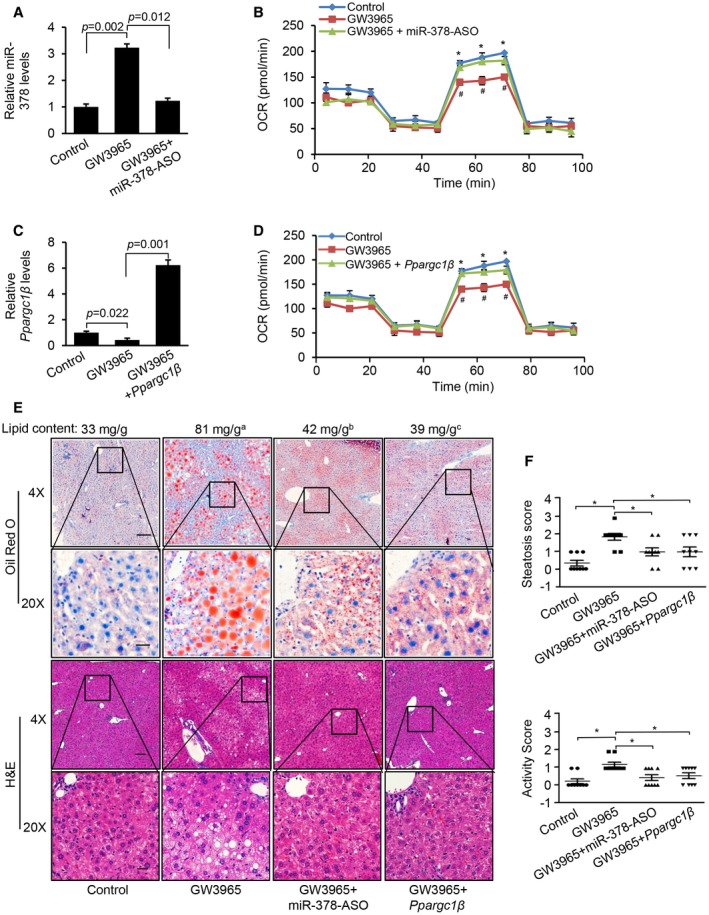
Both Ppargc1β and miR‐378 are required for the development of hepatosteatosis in mice treated with GW3965. (A) Levels of miR‐378 in the livers of three groups of mice treated with 2% DMSO (control, n = 9), GW3965 (n = 9), or a combination of GW3965 and miR‐378‐ASO (n = 9). (B) FAO rate in hepatocytes from these three groups of mice. GW3965 versus control (*P = 0.021) and a combination of GW3965 and miR‐378‐ASO versus GW3965 (# P = 0.031). (C) Levels of Ppargc1β mRNA in the livers of three groups of mice treated with 2% DMSO (control, n = 9), GW3965 (n = 9), or a combination of GW3965 and MC‐TTR‐Ppargc1β (n = 9). (D) FAO rate in hepatocytes isolated from livers of these three groups of mice. OCR statistical analysis: GW3965 versus control (*P = 0.021) and a combination of GW3965 and MC‐TTR‐Ppargc1β versus GW3965 (# P = 0.034). (E) Oil Red O and hematoxylin and eosin staining of livers excised from four groups of mice treated with 2% DMSO, GW3965, a combination of GW3965 and miR‐378‐ASO, or a combination of GW3965 and MC‐TTR‐Ppargc1β. GW3965 treatment increased the hepatic lipid content, and additional treatment of miR‐378‐ASO and MC‐TTR‐Ppargc1β offset the effect of GW3965. GW3965 versus control (a P = 0.011); GW3965 + miR‐378‐ASO versus GW3965 (b P = 0.029); and GW3965 + Ppargc1β versus GW3965 (c P = 0.032). (F) Steatosis score and activity score of livers from these four groups of mice. Data represent the mean ± SEM. *P < 0.05 (ANOVA test). Abbreviations: H&E, hematoxylin and eosin.
GW3965 treatment promoted hepatic lipid accumulation and hepatocyte ballooning, and additional treatment of miR‐378‐ASO or MC‐TTR‐Ppargc1β counteracts the effects of GW3965 (Fig. 7E,F). However, no significant change in inflammatory infiltrates and fibrosis was observed (Fig. 7E,F, Supporting Fig. S6A,B). GW3965 treatment also significantly reduced the ratio of glutathione/oxidized glutathione, and additional treatment of miR‐378‐ASO or Ppargc1β offset the effect of GW3965 (Supporting Fig. S6C), suggesting that both miR‐378 and Ppargc1β are the important players of GW3965‐regulated reactive oxygen species. In summary, miR‐378 and Ppargc1β mediate the promoting effect of GW3965 on hepatosteatosis and hepatocyte ballooning.
miR‐378 was not Involved in LXRα‐Mediated Lipogenesis and PGC1Β‐Mediated VLDL Secretion
LXRα facilitates lipogenesis and reverse cholesterol transport (RCT).25, 29 We next determined whether miR‐378 is involved in LXRα‐mediated lipogenesis and RCT by examining the mRNA levels of some typical “canonical” targets of LXRα in mice treated with GW3965, and a combination of GW3965 and miR‐378‐ASO. As shown in Supporting Fig. S7A, GW3965 treatment induced expression of genes encoding ABCA1 (adenosine triphosphate–binding cassette transporter subfamily A1) and ABCG1, whereas additional treatment of miR‐378‐ASO exhibited no effect on expression of these two genes. GW3965 induced expression of Srebp1c and the lipogenic genes encoding SCD1 (stearoyl‐CoA desaturase‐1), fatty acid synthesis, GPAT (glycerol‐3‐phosphate acyltransferase) and INSIG1 (insulin‐induced gene 1), whereas additional treatment of miR‐378‐ASO and Ppargc1β failed to offset the expression of these genes (Supporting Fig. S7B,C). These findings indicate that both Ppargc1β and miR‐378 are not involved in LXRα‐mediated lipogenesis and RCT, which is consistent with unaltered expression of lipogenic genes in liver‐specific Ppargc1β knockout mice.12
LXRα is a repressor of hepatic gluconeogenesis by facilitating AKT1 (v‐akt murine thymoma viral oncogene homolog 1) phosphorylation.30, 31 We next determined whether LXRα‐miR‐378 or LXRα‐PGC1β axis is involved in insulin signaling. Serum analysis showed that GW3965 treatment reduced levels of blood glucose (Supporting Table S2). If LXRα represses hepatic gluconeogenesis by inducing miR‐378 or repressing Ppargc1β, antagonizing miR‐378 or additional treatment of Ppargc1β should lead to recovered levels of blood glucose. In fact, additional treatment of miR‐378‐ASO and Ppargc1β failed to recover levels of blood glucose (Supporting Table S2), indicating that miR‐378 and Ppargc1β, at least in fasted SD‐treated mice, did not mediate the inhibitory effect of LXRα on gluconeogenesis (Supporting Table S2). To test our speculation, we determined the levels of phosphorylated AKT1. GW3965‐facilitated phosphorylation of AKT1 and additional treatment of Ppargc1β and miR‐378‐ASO failed to counteract the effect of GW3965 (Supporting Fig. S7D). Although LXRα is a regulator of Ppargc1β and miR‐378, Ppargc1β and miR‐378 are not involved in glucose homeostasis regulated by LXRα in SD‐treated mice. Despite reduced Ppargc1β expression, levels of Ppargc1α were not increased due to the compensation effect of Ppargc1β loss after GW3965 treatment (Supporting Fig. S7E).
Impaired VLDL secretion is an important contributor of hepatosteatosis.32 PGC1β can facilitate VLDL secretion by inducing expression of Mtp (microsomal transfer protein).32 Therefore, reduced Ppargc1ß by GW3965 might promote lipid to be trapped in the liver. GW3965 treatment reduced levels of Mtp (Supporting Fig. S7F,G), and re‐introduction of Ppargc1ß recovered expression of Mtp (Supporting Fig. S7G). However, additional treatment of miR‐378‐ASO failed to recover levels of Mtp (Supporting Fig. S7F). These findings indicate that impaired VLDL secretion due to the Ppargc1ß reduction might contribute to hepatosteatosis, and miR‐378 is not involved in MTP‐medicated VLDL secretion.
Liver‐Specific Knockdown of Lxrα Increased Ppargc1β and Reduced miR‐378, Which Subsequently Promoted Hepatosteatosis
We speculated that Lxrα knockdown should lead to reduced miR‐378 and increased expression of Ppargc1β, which subsequently promotes hepatosteatosis. For this purpose, we generated two vectors that express Lxrα shRNA or miR‐378 using an episomal DNA minicircle vector.33 This construct was referred to as MC‐TTR‐Lxrα‐shRNA or MC‐TTR‐miR‐378 (Fig. 8A). Eight‐week‐old C57Bl6 mice, which had been on a HFD for 8 weeks, were injected with MC‐TTR‐Lxrα‐shRNA (control), MC‐TTR‐Lxrα‐shRNA, or a combination of MC‐TTR‐Lxrα‐shRNA and MC‐TTR‐miR‐378 for 8 weeks. Such a design allowed us to determine whether recovered levels of miR‐378 that were presumably repressed by Lxrα knockdown should partially mediate the inhibitory effect of Lxrα shRNA on hepatosteatosis. Lxra knockdown decreased miR‐378 and increased Ppargc1β (Fig. 8B). Lxrα knockdown led to reduced liver weight and plasma triglycerides and increased glucose (Supporting Table S3). However, additional treatment of miR‐378 only offset the effects of Lxrα knockdown on liver weight and plasma triglycerides and failed to knock down increased blood glucose (Supporting Table S3).
Figure 8.
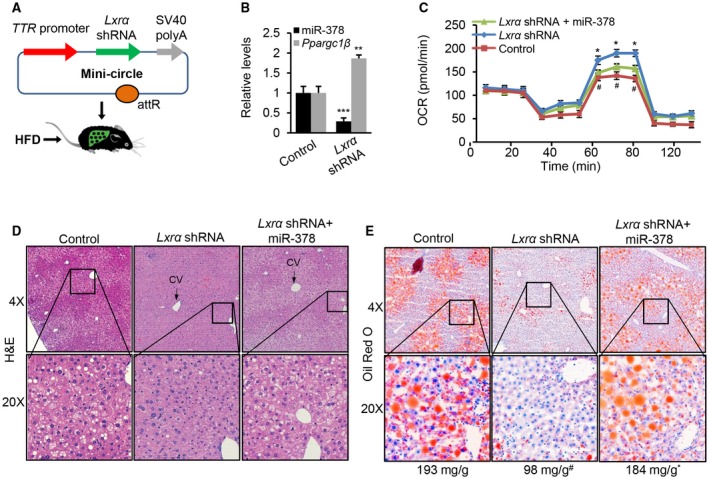
Lxrα knockdown resulted in increased mRNA levels of Ppargc1ß and reduced miR‐378, which subsequently impaired hepatic lipid accumulation. (A) Diagram of hepatic‐specific expression vector construction of Lxrα shRNA (MC‐TTR‐Lxrα‐shRNA). (B) Levels of mature miR‐378 and Ppargc1β in livers of HFD‐fed mice received MC‐TTR‐Lxrα‐shRNA (control, n = 10), MC‐TTR‐Lxrα‐shRNA (n = 10), and a combination of MC‐TTR‐Lxrα‐shRNA and MC‐TTR‐miR‐378 (n = 10). (C) FAO rate of hepatocytes from three groups of mice. OCR statistical analysis: Lxrα shRNA versus control (# P = 0.040) and a combination of Lxrα shRNA and miR‐378 versus Lxrα shRNA (*P = 0.034). (D,E) Hematoxylin and eosin and Oil Red O staining of livers excised from these three groups of mice. The number under the Oil Red O staining photos represents the hepatic lipid content (mg/g). Data represent the mean ± SEM. # P < 0.01; *P < 0.001 (ANOVA test). Abbreviations: H&E, hematoxylin and eosin.
Mechanistically, Lxra inactivation improved FAO in hepatocytes, whereas re‐introduction of miR‐378 counteracted the effect of Lxrα shRNA (Fig. 8C). Consistent with the increased FAO, knockdown of Lxrα increased the expression of genes controlling FAO, whereas additional treatment of miR‐378 impaired the expression of these genes (Supporting Fig. S8A). Compared with control mice, Lxra inactivation significantly reduced hepatosteatosis and hepatocyte ballooning, and additional treatment of miR‐378 offset the effects of Lxra knockdown (Fig. 8D,E, Supporting Fig. S8C,D). However, no significant change in inflammatory infiltrates and fibrosis was observed in the three groups of mice (Fig. 8D, Supporting Fig. S8B,E). In addition to inducing lipogenesis, LXRα showed a function to impair FAO by inducing miR‐378 transcription.
Discussion
PGC1β is a major regulator in maintaining energy and lipid homeostasis, and miR‐378 is embedded within the first intron of Ppargc1β.10, 11 Our study would suggest, however, that miR‐378 possesses its own promoter and its transcription is independent of Ppargc1β. It is now established that LXRα activates transcription of miR‐378 and inhibits Ppargc1β expression. PGC1β facilitates FAO, and miR‐378 impairs FAO.10, 11 As expected, antagonizing Lxrα alleviated hepatosteatosis in HFD‐treated mice, which simulated part of the phenotypes due to miR‐378 knockdown and overexpression of Ppargc1β. Together, our results—combined with those of others—challenged the accepted notion that miR‐378 is cotranscribed with Ppargc1β.
It was reported that expression of both Ppargc1β and miR‐378 were up‐regulated in livers of HFD‐treated mice.34 However, PGC1β is a strong activator of mitochondrial biogenesis and FAO in hepatocytes, and whole‐body knockdown of Ppargc1β induced mitochondrial dysfunction and hepatosteatosis.35 Liver‐specific deficiency of Ppargc1β leads to impaired FAO and hepatosteatosis.12 In addition, PGC1β is a transcription activator of Nrf1 (nuclear respiratory factor 1), another promoter of FAO.36 If HFD treatment induces expression of Ppargc1β in livers, the mRNA level of Nrf1 should be up‐regulated. Conversely, HFD treatment reduced the expression of Nrf1 (Supporting Fig. S9). Together with the functional studies, these findings indicate that expression of Ppargc1β and miR‐378 should be inversely correlated or at least uncoupled.
Combining database mining, EST extension, and 5’RACE and 3’RACE, we confirmed that miR‐378 possesses its own transcription machinery. We further established that LXRα functioned as an activator of miR‐378 transcription and a repressor of Ppargc1β expression, which was consistent with the uncoupled expression of miR‐378 and Ppargc1β in steatotic livers. Both overexpression of Lxrα and LXRα agonist repressed the expression of Ppargc1β. However, we did not identify any binding sites for LXRα within the promoter of Ppargc1β, suggesting that an indirect mechanism potentially is involved in LXRα‐mediated repression of Ppargc1β transcription. Given that the underlying mechanism(s) of metabolic disorders is complex and both Ppargc1β and miR‐378 are two key regulators of energy metabolism, our findings represent a pathway for LXRα to promote hepatosteatosis by facilitating transcription of miR‐378 that impairs FAO.
Lxrα‐deficient mice have lower hepatic and plasma lipid levels, and are unable to properly synthesize fatty acids and triglycerides.25 These defects are caused by the LXRα’s role as a regulator of hepatic Srebp1c transcriptional cascade that is almost entirely absent in Lxrα‐deficient mice. However, compared with Srebp1c‐deficient mice,25 Lxrα null mice have much lower hepatic lipid content, suggesting that other defects such as impaired FAO is responsible for this observation. In this study, we have established that LXRα is a transcriptional activator of miR‐378. Indeed, miR‐378 showed the capacity to impair FAO and aggravate hepatosteatosis.10 Thus, in addition to activating the Srebp1c pathway, LXRα increases hepatic lipid accumulation through impairing miR‐378‐mediated FAO. We and others established that decreased PGC1β after LXRα activation impairs VLDL secretion, thereby contributing to the development of hepatosteatosis. However, our findings show that miR‐378 is not involved in MTP‐mediated VLDL secretion. Together, we posit that reduced Ppargc1β and increased miR‐378 by LXRα coordinately and collaboratively exert their effects on FAO and hepatosteatosis. Another finding is that miR‐378 robustly increased the serum levels of alanine aminotransferase and aspartate aminotransferase (Supporting Table S3), suggesting its potential role in regulating liver injury. Currently, we are investigating the role of miR‐378 in regulating NASH progression.
Several types of preclinical models of NAFLD, including dietary, chemical, nutrition deficiency and genetic models, have been proposed.37 Both nutrition deficiency and chemical NAFLD models do not mirror the etiology and natural history of NASH and fail to induce the metabolic comorbidities that are observed in human NAFLD (insulin resistance and obesity).37, 38, 39 Although genetic models present certain advantages for experimental duration and NAFLD severity,40 these mutations are very rare in humans. HFD models resemble human NAFLD, both pathophysiologically and phenotypically, but the main disadvantage is the extended experimental duration and lesser degree of NAFLD severity.41 miR‐378 is a naturally occurring miRNA in the livers of mice and humans. HFD treatment induces expression of miR‐378, and its overexpression promotes hepatosteatosis. Our findings, combined with those of others, urged us to select a mouse model that is treated with miR‐378 and HFD to study the pathogenesis of hepatosteatosis.
In summary, we have used database mining and molecular and genetic approaches to demonstrate that Ppargc1β and miR‐378 display two distinct regulatory systems, while located within the same genomic locus. LXRα impairs FAO by increasing transcription of miR‐378 and reducing expression of Ppargc1β, which provides a line of function in regulating FAO in addition to its well‐established function as a promoter of lipogenesis. The insights obtained from this study further advance our understanding of the physiological roles of miRNA and the multilayer regulation of miRNA biogenesis to address the complexity of lipid homeostasis.
Supporting information
Supported by the National Institutes of Health (R01 DK102601, G.S.) and the Research Scholar Grant (ISG‐16‐210‐01‐RMC) from the American Cancer Society.
Potential conflict of interest: Nothing to report.
References
Author names in bold designate shared co‐first authorship.
- 1. Farrell GC, McCullough AJ, Day CP, editors. Non‐alcoholic Fatty Liver Disease: A Practical Guide. Hoboken, NJ: Wiley‐Blackwell; 2013. [Google Scholar]
- 2. Caldwell SH, Crespo DM, Kang HS, Al‐Osaimi AM. Obesity and hepatocellular carcinoma. Gastroenterology 2004;127:S97‐S103. [DOI] [PubMed] [Google Scholar]
- 3. Marrero JA, Fontana RJ, Su GL, Conjeevaram HS, Emick DM, Lok AS. NAFLD may be a common underlying liver disease in patients with hepatocellular carcinoma in the United States. Hepatology 2002;36:1349‐1354. [DOI] [PubMed] [Google Scholar]
- 4. Yu J, Marsh S, Hu J, Feng W, Wu C. The pathogenesis of nonalcoholic fatty liver disease: interplay between diet, gut microbiota, and genetic background. Gastroenterol Res Pract 2016;2016:2862173. [DOI] [PMC free article] [PubMed] [Google Scholar]
- 5. Bartel D. MicroRNAs: genomics, biogenesis, mechanism, and function. Cell 2004;116:281‐297. [DOI] [PubMed] [Google Scholar]
- 6. Cheung O, Puri P, Eicken C, Contos MJ, Mirshahi F, Maher JW, et al. Nonalcoholic steatohepatitis is associated with altered hepatic microRNA expression. Hepatology 2008;48:1810‐1820. [DOI] [PMC free article] [PubMed] [Google Scholar]
- 7. Becker P, Niesler B, Tschopp O, Berr F, Canbay A, Dandekar T, et al. MicroRNAs as mediators in the pathogenesis of non‐alcoholic fatty liver disease and steatohepatitis. Zeitschrift für Gastroenterologie 2014;52:1‐27. [Google Scholar]
- 8. Li Z, Rana TM. Therapeutic targeting of microRNAs: current status and future challenges. Nat Rev Drug Discov 2014;13:622. [DOI] [PubMed] [Google Scholar]
- 9. Kim VN, Han J, Siomi MC. Biogenesis of small RNAs in animals. Nat Rev Mol Cell Biol 2009;10:126‐139. [DOI] [PubMed] [Google Scholar]
- 10. Carrer M, Liu N, Grueter CE, Williams AH, Frisard MI, Hulver MW, et al. Control of mitochondrial metabolism and systemic energy homeostasis by microRNAs 378 and 378*. PNAS 2012;109:15330‐15335. [DOI] [PMC free article] [PubMed] [Google Scholar]
- 11. Finck BN, Kelly DP. PGC‐1 coactivators: inducible regulators of energy metabolism in health and disease. J Clin Invest 2006;116:615‐622. [DOI] [PMC free article] [PubMed] [Google Scholar]
- 12. Chambers KT, Chen Z, Crawford PA, Fu X, Burgess SC, Lai L, et al. Liver‐specific PGC‐1beta deficiency leads to impaired mitochondrial function and lipogenic response to fasting‐refeeding. PloS One 2012;7:e52645. [DOI] [PMC free article] [PubMed] [Google Scholar]
- 13. Lelliott CJ, Medina‐Gomez G, Petrovic N, Kis A, Feldmann HM, Bjursell M, et al. Ablation of PGC‐1β results in defective mitochondrial activity, thermogenesis, hepatic function, and cardiac performance. PLoS Biol 2006;4:e369. [DOI] [PMC free article] [PubMed] [Google Scholar]
- 14. Sonoda J, Mehl IR, Chong L‐W, Nofsinger RR, Evans RM. PGC‐1β controls mitochondrial metabolism to modulate circadian activity, adaptive thermogenesis, and hepatic steatosis. PNAS 2007;104:5223‐5228. [DOI] [PMC free article] [PubMed] [Google Scholar]
- 15. Bellafante E, Murzilli S, Salvatore L, Latorre D, Villani G, Moschetta A. Hepatic‐specific activation of peroxisome proliferator‐activated receptor γ coactivator‐1β protects against steatohepatitis. Hepatology 2013;57:1343‐1356. [DOI] [PubMed] [Google Scholar]
- 16. Jayandharan GR, Zhong L, Sack BK, Rivers AE, Li M, Li B, et al. Optimized Adeno‐Associated Virus (AAV)‐protein phosphatase‐5 helper viruses for efficient liver transduction by single‐stranded AAV vectors: therapeutic expression of factor IX at reduced vector doses. Hum Gene Ther 2010;21:271‐283. [DOI] [PMC free article] [PubMed] [Google Scholar]
- 17. Ng R, Wu H, Xiao H, Chen X, Willenbring H, Steer CJ, Song G. Inhibition of microRNA‐24 expression in liver prevents hepatic lipid accumulation and hyperlipidemia. Hepatology 2014;60:554‐564. [DOI] [PMC free article] [PubMed] [Google Scholar]
- 18. Gomez‐Lechon MJ, Donato MT, Martínez‐Romero A, Jiménez N, Castell JV, O’Connor J‐E. A human hepatocellular in vitro model to investigate steatosis. Chemico‐Bio Inter 2007;165:106‐116. [DOI] [PubMed] [Google Scholar]
- 19. Wang Z, Hall SD, Maya JF, Li L, Asghar A, Gorski JC. Diabetes mellitus increases the in vivo activity of cytochrome P450 2E1 in humans. Br J Clin Pharmacol 2003;55:77‐85. [DOI] [PMC free article] [PubMed] [Google Scholar]
- 20. Crunkhorn S, Dearie F, Mantzoros C, Gami H, da Silva WS, Espinoza D, et al. PPARGC1 beta expression is reduced in obesity potenetial pathogenic role of saturated fatty acids and p38 mitogen‐activated protein kinase activation. J Biol Chem 2007;282:15439‐15450. [DOI] [PubMed] [Google Scholar]
- 21. Kim VN. MicroRNA biogenesis: coordinated cropping and dicing. Nat Rev Mol Cell Biol 2005;6:376‐385. [DOI] [PubMed] [Google Scholar]
- 22. Cartharius K, Frech K, Grote K, Klocke B, Haltmeier M, Klingenhoff A, et al. MatInspector and beyond: promoter analysis based on transcription factor binding sites. Bioinformatics 2005;21:2933‐2942. [DOI] [PubMed] [Google Scholar]
- 23. Becares N, Gage MC, Martin‐Gutierrez L, Pourcet B, Pello OM, Luong TV, et al. Changes in LXRα phosphorylation promote a novel diet‐induced transcriptome that alters the transition from fatty liver to steatohepatitis. BioRxiv 2017;127779. [Google Scholar]
- 24. Thakore PI, D'ippolito AM, Song L, Safi A, Shivakumar NK, Kabadi AM, et al. Highly specific epigenome editing by CRISPR‐Cas9 repressors for silencing of distal regulatory elements. Nat Methods 2015;12:1143. [DOI] [PMC free article] [PubMed] [Google Scholar]
- 25. Kalaany NY, Gauthier KC, Zavacki AM, Mammen PP, Kitazume T, Peterson JA, et al. LXRs regulate the balance between fat storage and oxidation. Cell Metab 2005;1:231‐244. [DOI] [PubMed] [Google Scholar]
- 26. Kotokorpi P, Ellis E, Parini P, Nilsson L‐M, Strom S, Steffensen KR, et al. Physiological differences between human and rat primary hepatocytes in response to liver X receptor activation by 3‐[3‐[N‐(2‐chloro‐3‐trifluoromethylbenzyl)‐(2, 2‐diphenylethyl) amino] propyloxy] phenylacetic acid hydrochloride (GW3965). Mol Pharmacol 2007;72:947‐955. [DOI] [PubMed] [Google Scholar]
- 27. Huang J, Jia Y, Fu T, Viswakarma N, Bai L, Rao MS, et al. Sustained activation of PPARα by endogenous ligands increases hepatic fatty acid oxidation and prevents obesity in ob/ob mice. FASEB J 2012;26:628‐638. [DOI] [PMC free article] [PubMed] [Google Scholar]
- 28. Holness MJ, Bulmer K, Gibbons GF, Sugden MC. Up‐regulation of pyruvate dehydrogenase kinase isoform 4 (PDK4) protein expression in oxidative skeletal muscle does not require the obligatory participation of peroxisome‐proliferator‐activated receptor α (PPARα). Biochem J 2002;366:839‐846. [DOI] [PMC free article] [PubMed] [Google Scholar]
- 29. Zhao C, Dahlman‐Wright K. Liver X receptor in cholesterol metabolism. J Endocrinol 2010;204:233‐240. [DOI] [PubMed] [Google Scholar]
- 30. Liu W, Cao H, Ye C, Chang C, Lu M, Jing Y, et al. Hepatic miR‐378 targets p110α and controls glucose and lipid homeostasis by modulating hepatic insulin signalling. Nat Commun 2014;5:5684. [DOI] [PubMed] [Google Scholar]
- 31. Commerford SR, Vargas L, Dorfman SE, Mitro N, Rocheford EC, Mak PA, et al. Dissection of the insulin‐sensitizing effect of liver X receptor ligands. Mol Endocrinol 2007;21:3002‐3012. [DOI] [PubMed] [Google Scholar]
- 32. Wolfrum C, Stoffel M. Coactivation of Foxa2 through Pgc‐1β promotes liver fatty acid oxidation and triglyceride/VLDL secretion. Cell Metab 2006;3:99‐110. [DOI] [PubMed] [Google Scholar]
- 33. Mayrhofer P, Schleef M, Jechlinger W. Use of minicircle plasmids for gene therapy In: Cancer Gene Therapy. Springer; 2009;87‐104. [DOI] [PubMed]
- 34. Lin J, Handschin C, Spiegelman BM. Metabolic control through the PGC‐1 family of transcription coactivators. Cell Metab 2005;1:361‐370. [DOI] [PubMed] [Google Scholar]
- 35. Vianna CR, Huntgeburth M, Coppari R, Choi CS, Lin J, Krauss S, et al. Hypomorphic mutation of PGC‐1β causes mitochondrial dysfunction and liver insulin resistance. Cell Metab 2006;4:453‐464. [DOI] [PMC free article] [PubMed] [Google Scholar]
- 36. Shao D, Liu Y, Liu X, Zhu L, Cui Y, Cui A, et al. PGC‐1β‐regulated mitochondrial biogenesis and function in myotubes is mediated by NRF‐1 and ERRα. Mitochondrion 2010;10:516‐527. [DOI] [PubMed] [Google Scholar]
- 37. Santhekadur PK, Kumar DP, Sanyal AJ. Preclinical models of nonalcoholic fatty liver disease. J Hepatol 2018;68:230‐237. [DOI] [PMC free article] [PubMed] [Google Scholar]
- 38. Rinella ME, Elias MS, Smolak RR, Fu T, Borensztajn J, Green RM. Mechanisms of hepatic steatosis in mice fed a lipogenic methionine choline‐deficient diet. J Lipid Res 2008;49:1068‐1076. [DOI] [PMC free article] [PubMed] [Google Scholar]
- 39. Domitrović R, Jakovac H, Tomac J, Šain I. Liver fibrosis in mice induced by carbon tetrachloride and its reversion by luteolin. Toxicol Appl Pharmacol 2009;241:311‐321. [DOI] [PubMed] [Google Scholar]
- 40. Lindström P. The physiology of obese‐hyperglycemic mice. Sci World J 2007;7:666‐685. [DOI] [PMC free article] [PubMed] [Google Scholar]
- 41. Kanuri G, Bergheim I. In vitro and in vivo models of non‐alcoholic fatty liver disease (NAFLD). Int J Mol Sci 2013;14:11963‐11980. [DOI] [PMC free article] [PubMed] [Google Scholar]
Associated Data
This section collects any data citations, data availability statements, or supplementary materials included in this article.
Supplementary Materials