Abstract
The nitrogenase iron protein (Fe‐protein) contains an unusual [4Fe:4S] iron‐sulphur cluster that is stable in three oxidation states: 2+, 1+, and 0. Here, we use spatially resolved anomalous dispersion (SpReAD) refinement to determine oxidation assignments for the individual irons for each state. Additionally, we report the 1.13‐Å resolution structure for the ADP bound Fe‐protein, the highest resolution Fe‐protein structure presently determined. In the dithionite‐reduced [4Fe:4S]1+ state, our analysis identifies a solvent exposed, delocalized Fe2.5+ pair and a buried Fe2+ pair. We propose that ATP binding by the Fe‐protein promotes an internal redox rearrangement such that the solvent‐exposed Fe pair becomes reduced, thereby facilitating electron transfer to the nitrogenase molybdenum iron‐protein. In the [4Fe:4S]0 and [4Fe:4S]2+ states, the SpReAD analysis supports oxidation states assignments for all irons in these clusters of Fe2+ and valence delocalized Fe2.5+, respectively.
Keywords: iron–sulphur cluster, multiple-wavelength anomalous diffraction, nitrogenase, X-ray crystallography
Biological nitrogen fixation is a multi‐electron redox process carried out by nitrogenase,1, 2, 3 a two‐protein enzyme comprised of the iron‐ and molybdenum iron‐proteins (Fe‐protein and MoFe‐protein). In the catalytic cycle, electrons originating from an electron donor (ferredoxin or flavodoxin in vivo or dithionite in vitro) are passed to the Fe‐protein, which subsequently mediates the ATP‐dependent reduction of the MoFe‐protein. The MoFe‐protein contains two unique metallocofactors: an intermediate [8Fe:7S] P‐cluster and the active‐site [Mo:7Fe:9S:C]‐R‐homocitrate FeMo‐cofactor (FeMoco). Substrate reduction is accomplished through multiple binding and dissociation events between the MoFe‐protein and Fe‐protein, with each cycle involving electron transfer from the Fe‐protein to the MoFe‐protein. The timing of the electron transfers between the constituent clusters in the overall substrate reduction mechanism is an active area of investigation.
The Fe‐protein is the only electron donor currently known to efficiently support N2 reduction by nitrogenase. A homodimer, the Fe‐protein contains a single [4Fe:4S] cluster coordinated to the side chains of Cys97 and Cys132 of each subunit.4, 5 The cluster has been characterized in three overall oxidation states: the oxidized [4Fe:4S]2+ and dithionite‐reduced [4Fe:4S]1+ forms identified in early work on nitrogenase,1 and the all‐ferrous [4Fe:4S]0 form.6, 7 It is generally considered that electron transfer from the Fe‐protein to the MoFe‐protein uses the 2+/1+ couple, although a role for the all‐ferrous form has been proposed.6, 8, 9, 10 Changes in the Fe‐protein [4Fe:4S] cluster environment can be monitored spectroscopically11, 12, 13 and through the accessibility of the cluster to chelation.14, 15, 16
Mössbauer and EPR spectroscopies have been particularly valuable in deciphering the oxidation states in [4Fe:4S] clusters, including the Fe‐protein.17, 18, 19, 20 From the isomer shifts observed in Mössbauer spectra, the Fe in [4Fe:4S] clusters may be assigned as either valence localized sites (Fe2+ or Fe3+) or as valence delocalized Fe2.5+Fe2.5+ pairs.19, 20 In the case of the Fe‐protein, the S=1/2 spin state of the [4Fe:4S]1+ form consists of a delocalized Fe2.5+ pair and a pair of Fe2+. In contrast, only one type of Fe occurs in each of the other two cluster forms: the S=0 state of [4Fe:4S]2+ contains delocalized Fe2.5+ pairs,17 while in the S=4 state of [4Fe:4S]0, the iron sites are all Fe2+.21 Additional complexities in the electronic/magnetic structure arise from the variable spin coupling between the Fe. For example, the [4Fe:4S]1+ cluster exists as a mixture of S=1/2 and S=3/2 spin states with the precise distribution dependent on the solvent and nucleotide conditions.17
A full understanding of the nitrogenase mechanism must include the detailed oxidation state assignments of the component metalloclusters. Assigning oxidation states to individual metals in a metallocluster is difficult using conventional spectroscopic techniques, due to the ambiguity in assigning spectral features to specific sites. To circumvent these limitations, we have developed SpReAD (Spatially Resolved Anomalous Dispersion) refinement, a combination of X‐ray crystallography and X‐ray absorption spectroscopy to determine site‐specific X‐ray absorption spectra,22, 23 building on pioneering work by Coppens.24 By refining structures against diffraction data collected at a series of energies across an absorption edge, the X‐ray absorption spectra of each individual metal site can be obtained from the corresponding Δf” values. For the Fe‐protein, oxidation leads to a shift of the main edge position to higher energies by circa 1 eV per 0.5 change in oxidation state.25 It should be noted that edge positions are sensitive to many factors including the ligand sphere.26 The SpReAD method has previously been used to identify the reduced Fe site in the [2Fe:2S]1+ cluster of a ferredoxin22 from Aquifex aeolicus, as well as Fe oxidation states in the resting form of FeMoco23 and a mononuclear Fe site in the Azotobacter vinelandii MoFe‐protein.27 Herein, we present a comprehensive redox description of the A. vinelandii Fe‐protein [4Fe:4S] cluster in its three possible oxidation states.
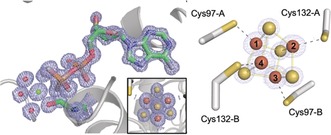
High resolution crystal structures are a prerequisite for the SpReAD analysis to ensure that the electron densities for the absorbing iron sites are well defined. Conditions were identified that permitted the first atomic resolution (1.13 Å) structure of the ADP‐bound A. vinelandii Fe‐protein (see the Supporting Information, Methods) (Figure 1). The overall subunit fold resembles previously determined structures5, 28, 29 (Supporting Information, Table S1 and Figure S1). The average iron–iron distances in the atomic‐resolution cluster (Supporting Information, Figure S2) for the dithionite‐reduced 1+ state with bound ADP are 2.70 Å, which is close to the 2.73 Å distances observed by extended X‐ray absorption fine structure (EXAFS).25, 30
Figure 1.

(Left) Electron density for the MgADP molecule and [4Fe:4S] cluster from the dithionite‐reduced, ADP‐bound structure at 1.13 Å‐resolution. The cluster bridges the dimer interface and 2 F o−F c map is contoured at 1σ. (Right) The Fe labelling scheme used in this work is indicated.
To assess the site‐specific oxidation state assignments for Fe in the [4Fe:4S] cluster of the Fe‐protein as a function of overall cluster oxidation state (2+, 1+, 0), and in the presence or absence of ADP, SpReAD analyses were conducted. Appropriate diffraction data sets were collected for four forms of the Fe‐protein: 1) the dithionite (DT)‐reduced [4Fe:4S]1+ state with ADP, 2) the DT‐reduced [4Fe:4S]1+ state without ADP, 3) indigodisulfonic acid (IDS)‐oxidized [4Fe:4S]2+ with ADP, and 4) the all‐ferrous TiIII‐citrate reduced [4Fe:4S]0 state without ADP. Suitable quality data sets could not be obtained for either the [4Fe:4S]0 form in the presence of ADP or for the [4Fe:4S]2+ state in the absence of ADP. Intriguingly these forms have less mechanistic relevance as ADP and oxidized Fe‐protein are the physiological products of electron transfer to the MoFe‐protein. Diffraction data were collected along the rising iron edge centered at 7120 keV using procedures described previously22, 23 (Supporting Information, Table S2, S3). Photoreduction did not appear to be significant under these conditions, consistent with observations from X‐ray absorption spectroscopy studies of Fe‐protein,25, 31 although some contribution to the oxidized 2+ state cannot be eliminated.
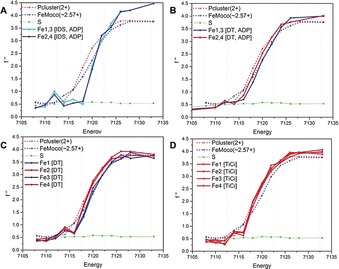
To benchmark the SpReAD analysis and assign oxidation states, reference curves were derived from the MoFe‐protein metalloclusters, with the P‐cluster and FeMoco assigned to reduced Fe2+ and oxidized Fe∼2.57+, respectively23 (Figure 2, and S3 in the Supporting Information). The FeMoco oxidation state was taken as the average of 4 Fe3+ and 3 Fe2+.23 Absorption curves were compiled for each iron site in different forms of the Fe‐protein [4Fe:4S] cluster and overlaid with the reference spectra (Figure 2, and S3 in the Supporting Information). The comparison to the P‐cluster absorption spectra yielded an unambiguous population of Fe2+‐like curves, and a second set of curves were shifted to higher energy by roughly 1 eV, indicating a more oxidized state comparable to that of the average Fe‐sites in FeMoco. The curves that aligned with the P‐cluster were assigned to the Fe2+ state, while the data shifted to higher energies are assigned to the expected Fe2.5+ state.
Figure 2.

SpReAD curves for the three possible oxidation states of the Fe‐protein: A) The IDS‐oxidized [4Fe:4S]2+ state with ADP. B) The dithionite (DT)‐reduced [4Fe:4S]1+ state with ADP. C) The dithionite‐reduced [4Fe:4S]1+ state (nucleotide free). D) The TiIII‐citrate‐reduced [4Fe:4S]0 state (nucleotide free). The structures used for the data depicted in panels A and B contain a crystallographic two‐fold axis of symmetry through the cluster and so Fe1 and Fe3 are equivalent, as are Fe2 and Fe4. The structures used for the data depicted in panels C and D contain an entire [4Fe:4S] cluster in the asymmetric unit, and so the absorption curves for each Fe are presented. More‐reduced profiles are coded in red, more‐oxidized profiles are coded in blue. For reference, the SpReAD profiles of the dithionite‐reduced state of the MoFe‐protein metalloclusters are plotted: the average Fe curve for the all‐ferrous P‐cluster (red dots) and the more oxidized average of all Fe in FeMoco (ca. Fe2.57+) (blue dots). The sulphur anomalous (green) is also shown; at 7100 eV, the expected value of f′′ is 0.70 e (skuld.bmsc.washington.edu/scatter/data/S.dat).
The SpReAD analysis of the dithionite‐reduced state [4Fe:4S]1+ was completed on the MgADP‐bound and nucleotide free structures of Fe‐protein. In both cases, the site‐specific X‐ray absorption spectra support two distinct [2Fe:2S] sublayers perpendicular to the two‐fold axis of the protein dimer. The sublayer facing the protein surface (coordinated by Cys97 Sγ)) is assigned to the more oxidized valence delocalized Fe2.5+–Fe2.5+ iron sites, while the sublayer facing the interior of the protein (coordinated by Cys132 Sγ) is assigned as two Fe2+. In contrast, the absorption curves for the Fe in the fully‐reduced [4Fe4S]0 agree well with the P‐cluster reference state, supporting a consistent oxidation state description of Fe2+ for all sites. The absorption curves for the fully oxidized [4Fe4S]2+ state are shifted to higher energy as anticipated for the Fe2.5+ state, but the curves differ in shape from the reference FeMoco (Figure 2, and S3 in the Supporting Information).
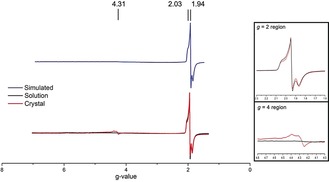
To confirm that the electronic state of the [4Fe:4S]1+ cluster in the crystal reflected the solution properties, perpendicular‐mode electron paramagnetic resonance (EPR) was used. A polycrystalline sample of the [4Fe:4S]1+ nucleotide‐free protein crystals (used in SpReAD experiments) was prepared and compared to the respective protein‐solution sample by EPR (Figure 3, see the Supporting Information, Methods). Solution‐state samples produced a rhombic spectrum with a strong S=1/2 feature at g=1.94 with no other low‐field features. Spectra of Fe‐protein crystals similarly showed a predominant S=1/2 feature, with an additional signal at g=4.3 (4 % of the g=1.9 integrated peak area). Previous studies have attributed the g=4.3 signal to adventitious Fe3+, or an S=5/2 system by Mössbauer spectroscopy30 reflective of the ATP‐bound state. However, the crystal structure of our sample is well ordered and shows no bound nucleotide. The resting state of the Fe‐protein is considered to be a mixture of S=1/2 and S=3/2 spin states,17 and the absence of the S=3/2 signal may reflect the solvent dependence of the equilibrium.17
Figure 3.

EPR spectra of Fe‐protein in the [4Fe4S]1+ state in solution (black) and in a crystal slurry (red). Simulated spectrum in blue. Inserts show the expanded g=2 and g=4 regions.
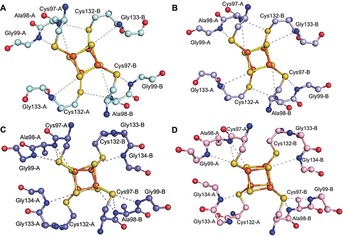
During the process of substrate reduction by nitrogenase, the Fe‐protein cycles through a series of conformations coupled to distinct nucleotide and cluster oxidation states. The crystal structures reveal distinct patterns of hydrogen bonds surrounding the cluster associated with the presence or absence of MgADP (Figure 4). Although the underlying basis for one hydrogen bond pattern relative to the other is not evident, the MgADP conformation is observed in the 1+ and 2+ oxidation states, while the nucleotide free conformation is observed in 0 and 1+ states, suggesting that the MgADP conformation interacts preferentially with the more oxidized forms of the [4Fe:4S] cluster.
Figure 4.

Hydrogen bonding patterns observed in the Fe‐protein structures: A) The IDS‐oxidized [4Fe:4S]2+ state with ADP. B) The dithionite‐reduced [4Fe:4S]1+ state with ADP. C) The dithionite‐reduced [4Fe:4S]1+ state (nucleotide free). D) The TiIII‐citrate‐reduced [4Fe:4S]0 state (nucleotide free). Distinct hydrogen bonding patterns are observed for the ADP‐bound (A,B) and nucleotide free forms (C,D), with little difference associated with the oxidation state changes from 2+ to 1+ in the presence of ADP (A,B), or from 1+ to 0 in the nucleotide free form (C,D).
An important feature of the nitrogenase mechanism is that the [4Fe:4S]1+ state of the cluster serves as the electron donor to the MoFe‐protein only in the MgATP bound form of the Fe‐protein, but not in the nucleotide free and MgADP‐bound states. Interestingly, the SpReAD analysis on the latter two structures establishes that the two Fe in the [4Fe:4S] cluster closest to the surface are more oxidized relative to the more buried Fe. The redox competent form of the Fe‐protein might be expected to have the reduced Fe nearer to the surface to facilitate electron transfer into the MoFe‐protein. If so, MgATP could promote an internal redox rearrangement such that the positions of the Fe2+ and Fe2.5+ are switched. The binding of ATP has been associated with a decrease (ca. 100 mV) in the reduction potential of the cluster,32 as well as changes in the EPR. A further intriguing observation is that in the [4Fe:4S]1+ form, despite the surface exposed cluster, only the MgATP‐bound form is chelated by α,α‐dipyridyl and related compounds. These chelators have a higher affinity for Fe2+ relative to Fe3+ (estimated to be ca. 106, based on the reduction potential of 1.12 V33). One explanation for this behavior is that the surface exposed Fe are Fe2+ in the MgATP‐bound form and the enhanced reactivity with the chelator reflects their reduced state.
Complete understanding of the Fe‐protein catalytic cycle will require the structural analysis of the MgATP‐bound form that has evaded crystallization for over 25 years. The cumulative SpReAD analysis described herein and in the previous work on the MoFe‐protein23 provide an assignment of the site specific redox states of the resting forms of the nitrogenase proteins. These experiments provide the foundation to pursue the crucial non‐resting states with substrates, intermediates and inhibitors.34, 35, 36, 37
Conflict of interest
The authors declare no conflict of interest.
Supporting information
As a service to our authors and readers, this journal provides supporting information supplied by the authors. Such materials are peer reviewed and may be re‐organized for online delivery, but are not copy‐edited or typeset. Technical support issues arising from supporting information (other than missing files) should be addressed to the authors.
Supplementary
Acknowledgements
We thank Prof. O. Einsle, Prof. L. Zhang, Dr. K. Perez, Dr. R. Arias, A. Maggiolo, and Prof. J. B. Howard for informative discussions, and K. H. Lee for the initial identification of the ADP‐bound Fe‐protein crystals. We acknowledge the Gordon and Betty Moore Foundation and the Beckman Institute at Caltech for their generous support of the Molecular Observatory at Caltech. We thank the staff at Beamline 12‐2, Stanford Synchrotron Radiation Lightsource (SSRL), operated for the DOE and supported by its OBER and by the NIH, NIGMS (P41GM103393), and the NCRR (P41RR001209). We also thank Dr. A. Di Bilio for assisting with EPR experiments. The Caltech EPR Facility was supported by NSF‐1531940. This work was supported by NIH grant GM045162 and the Howard Hughes Medical Institute.
B. B. Wenke, T. Spatzal, D. C. Rees, Angew. Chem. Int. Ed. 2019, 58, 3894.
References
- 1. Burgess B. K., Lowe D. J., Chem. Rev. 1996, 96, 2983–3012. [DOI] [PubMed] [Google Scholar]
- 2. Howard J. B., Rees D. C., Proc. Natl. Acad. Sci. USA 2006, 103, 17088–17093. [DOI] [PMC free article] [PubMed] [Google Scholar]
- 3. Seefeldt L. C., Hoffman B. M., Peters J. W., Raugei S., Beratan D. N., Antony E., Dean D. R., Acc. Chem. Res. 2018, 51, 2179–2186. [DOI] [PMC free article] [PubMed] [Google Scholar]
- 4. Hausinger R. P., Howard J. B., J. Biol. Chem. 1983, 258, 13486–13492. [PubMed] [Google Scholar]
- 5. Georgiadis M. M., Komiya H., Chakrabarti P., Woo D., Kornuc J. J., Rees D. C., Science 1992, 257, 1653–1659. [DOI] [PubMed] [Google Scholar]
- 6. Watt G. D., Reddy K. R. N., J. Inorg. Biochem. 1994, 53, 281–294. [Google Scholar]
- 7. Angove H. C., Yoo S. J., Münck E., Burgess B. K., J. Biol. Chem. 1998, 273, 26330–26337. [DOI] [PubMed] [Google Scholar]
- 8. Erickson J. A., Nyborg A. C., Johnson J. L., Truscott S. M., Gunn A., Nordmeyer F. R., Watt G. D., Biochemistry 1999, 38, 14279–14285. [DOI] [PubMed] [Google Scholar]
- 9. Nyborg A. C., Johnson J. L., Gunn A., Watt G. D., J. Biol. Chem. 2000, 275, 39307–39312. [DOI] [PubMed] [Google Scholar]
- 10. Lowery T. J., Wilson P. E., Zhang B., Bunker J., Harrison R. G., Nyborg A. C., Thiriot D., Watt G. D., Proc. Natl. Acad. Sci. USA 2006, 103, 17131–17136. [DOI] [PMC free article] [PubMed] [Google Scholar]
- 11. Zumft W. G., Palmer G., Mortenson L. E., Biochim. Biophys. Acta Bioenerg. 1973, 292, 413–421. [DOI] [PubMed] [Google Scholar]
- 12. Ryle M. J., Lanzilotta W. N., Seefeldt L. C., Scarrow R. C., Jensen G. M., J. Biol. Chem. 1996, 271, 1551–1557. [DOI] [PubMed] [Google Scholar]
- 13. Stephens P. J., McKenna C. E., Smith B. E., Nguyen H. T., McKenna M. C., Thomson A. J., Devlin F., Jones J. B., Proc. Natl. Acad. Sci. USA 1979, 76, 2585–2589. [DOI] [PMC free article] [PubMed] [Google Scholar]
- 14. Deits T. L., Howard J. B., J. Biol. Chem. 1989, 264, 6619–6628. [PubMed] [Google Scholar]
- 15. Walker G. A., Mortenson L. E., Biochemistry 1974, 13, 2382–2388. [DOI] [PubMed] [Google Scholar]
- 16. Ljones T., Burris R. H., Biochemistry 1978, 17, 1866–1872. [DOI] [PubMed] [Google Scholar]
- 17. Lindahl P. A., Day E. P., Kent T. A., Orme-Johnson W. H., Münck E., J. Biol. Chem. 1985, 260, 11160–11173. [PubMed] [Google Scholar]
- 18. Angove H. C., Yoo S. J., Burgess B. K., Münck E., J. Am. Chem. Soc. 1997, 119, 8730–8731. [Google Scholar]
- 19. Beinert H., Holm R. H., Münck E., Science 1997, 277, 653–659. [DOI] [PubMed] [Google Scholar]
- 20. Noodleman L., Peng C. Y., Case D. A., Mouesca J.-M., Coord. Chem. Rev. 1995, 144, 199–244. [Google Scholar]
- 21. Yoo S. J., Angove H. C., Burgess B. K., Hendrich M. P., Münck E., J. Am. Chem. Soc. 1999, 121, 2534–2545. [Google Scholar]
- 22. Einsle O., Andrade S. L., Dobbek H., Meyer J., Rees D. C., J. Am. Chem. Soc. 2007, 129, 2210–2211. [DOI] [PMC free article] [PubMed] [Google Scholar]
- 23. Spatzal T., Schlesier J., Burger E.-M., Sippel D., Zhang L., Andrade S. L., Rees D. C., Einsle O., Nat. Commun. 2016, 7, 10902. [DOI] [PMC free article] [PubMed] [Google Scholar]
- 24. Wu G., Zhang Y., Ribaud L., Coppens P., Wilson C., Iversen B. B., Larsen F. K., Inorg. Chem. 1998, 37, 6078–6083. [DOI] [PubMed] [Google Scholar]
- 25. Musgrave K. B., Angove H. C., Burgess B. K., Hedman B., Hodgson K. O., J. Am. Chem. Soc. 1998, 120, 5325–5326. [Google Scholar]
- 26. Kowalska J. K., Hahn A. W., Albers A., Schiewer C. E., Bjornsson R., Lima F. A., Meyer F., DeBeer S., Inorg. Chem. 2016, 55, 4485–4497. [DOI] [PMC free article] [PubMed] [Google Scholar]
- 27. Zhang L., Kaiser J. T., Meloni G., Yang K.-Y., Spatzal T., Andrade S. L., Einsle O., Howard J. B., Rees D. C., Angew. Chem. Int. Ed. 2013, 52, 10529–10532; [DOI] [PMC free article] [PubMed] [Google Scholar]; Angew. Chem. 2013, 125, 10723–10726. [Google Scholar]
- 28. Strop P., Takahara P. M., Chiu H.-J., Angove H. C., Burgess B. K., Rees D. C., Biochemistry 2001, 40, 651–656. [DOI] [PubMed] [Google Scholar]
- 29. Jang S. B., Seefeldt L. C., Peters J. W., Biochemistry 2000, 39, 14745–14752. [DOI] [PubMed] [Google Scholar]
- 30. Lindahl P. A., Gorelick N. J., Münck E., Orme-Johnson W. H., J. Biol. Chem. 1987, 262, 14945–14953. [PubMed] [Google Scholar]
- 31. Blank M. A., Lee C. C., Hu Y., Hodgson K. O., Hedman B., Ribbe M. W., Inorg. Chem. 2011, 50, 7123–7128. [DOI] [PMC free article] [PubMed] [Google Scholar]
- 32. Zumft W. G., Mortenson L. E., Palmer G., Eur. J. Biochem. 1974, 46, 525–535. [DOI] [PubMed] [Google Scholar]
- 33. Harris D. C., Quantitative Chemical Analysis, Macmillan, 2010. [Google Scholar]
- 34. Spatzal T., Perez K. A., Einsle O., Howard J. B., Rees D. C., Science 2014, 345, 1620–1623. [DOI] [PMC free article] [PubMed] [Google Scholar]
- 35. Spatzal T., Perez K. A., Howard J. B., Rees D. C., eLife 2015, 4, e11620. [DOI] [PMC free article] [PubMed] [Google Scholar]
- 36. Sippel D., Einsle O., Nat. Chem. Biol. 2017, 13, 956. [DOI] [PMC free article] [PubMed] [Google Scholar]
- 37. Sippel D., Rohde M., Netzer J., Trncik C., Gies J., Grunau K., Djurdjevic I., Decamps L., Andrade S. L., Einsle O., Science 2018, 359, 1484–1489. [DOI] [PubMed] [Google Scholar]
Associated Data
This section collects any data citations, data availability statements, or supplementary materials included in this article.
Supplementary Materials
As a service to our authors and readers, this journal provides supporting information supplied by the authors. Such materials are peer reviewed and may be re‐organized for online delivery, but are not copy‐edited or typeset. Technical support issues arising from supporting information (other than missing files) should be addressed to the authors.
Supplementary


