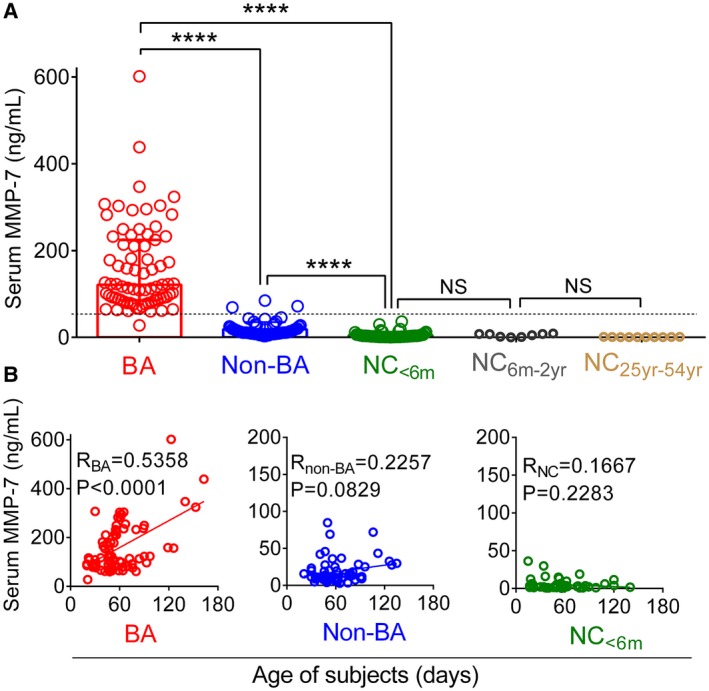
Figure 2.

Serum MMP‐7 concentration in BA, non‐BA, and NC. (A) Dots represent MMP‐7 concentration for individual subjects and cohorts (and different ages for NCs). Boxes and whiskers represent median and interquartile range. (B) Serum MMP‐7 plotted against age of subjects. The r and P value are calculated by linear regression model; ****P < 0.0001.
