

Abstract
Background
Ex vivo androgen prodrug conversion by blood esterases after oral androgen ester administration may result in an overestimation of the measured blood androgens.
Objective
We investigated whether blood collection tubes with esterase inhibitors decreased the conversion of testosterone undecanoate (TU) and dimethandrolone undecanoate (DMAU) to their active metabolites, testosterone (T), and dimethandrolone (DMA), providing a more accurate assessment of circulating T/DMA levels.
Methods
Blood was collected in tubes with/without esterase inhibitors from: (i) four healthy and four hypogonadal men receiving no androgens and spiked ex vivo with TU/DMAU; (ii) four men taking oral TU (Andriol®); and (iii) eight hypogonadal men dosed with oral 316 mg TU and 15 healthy men with 200 mg DMAU. T/DMA levels were measured by LC‐MS/MS.
Results
Sodium fluoride (NaF, an esterase inhibitor) decreased measured T levels by 14.2% in men not receiving TU. Increasing amounts of TU/DMAU added to blood collected into plain tubes resulted in a concentration‐dependent overestimation of T/DMA that was reduced by collecting blood into NaF tubes (by 30–85%), and keeping samples at 4 °C and minimizing time prior to centrifugation. After oral TU/DMAU administration to men, when TU/DMAU levels were >15/10 ng/mL, respectively, blood collected in NaF tubes yielded lower measured T concentrations by 15–30% and DMA by 22% due to an additional inhibitory effect of NaF on blood esterases.
Conclusion
NaF directly lowers plasma T/DMA levels measured by LC‐MS/MS and also inhibits blood esterase activity. Overestimation of T/DMA in blood collected in tubes without NaF after oral TU/DMAU administration is important for pharmacokinetics studies in drug development clinical trials but may have limited impact in clinical practice/utilization because the differences between measured and true androgen values are modest and the wide therapeutic androgen efficacy ranges obviate the need for highly accurate androgen measurements during therapy.
Keywords: collection tubes, dimethandrolone undecanoate, esterase inhibitors, testosterone
Introduction
Liquid chromatography‐tandem mass spectrometry (LC‐MS/MS) is the gold standard for measuring serum/plasma testosterone (T) because of improved method sensitivity, specificity, accuracy, and precision (Taieb et al., 2003; Wang et al., 2004; Rosner et al., 2007). Currently, laboratories are encouraged to participate not only in proficiency testing but in accuracy‐based programs that allow laboratories to harmonize their measurements to traceable standards and standardized methods (Vesper & Thienpont, 2009). This allows patients to have their blood samples measured in different laboratories using different methods but have similar T results (Vesper & Botelho, 2010). However, pre‐analytic issues may result in inaccurate estimates of circulating T levels. Such artifacts have been reported with serum separator tubes, which have been shown to interfere with T measurements (Wang et al., 2008).
Many current T replacement therapies formulated as injections and oral preparations are T esters. Ex vivo conversion of these prodrugs to T by non‐specific blood esterases after blood collection may result in overestimation of circulating T levels. Thus, in patients administered T esters, the measured T level may not only reflect circulating T but also the ex vivo conversion of the prodrug to the active androgen. This may confound hormone level evaluations as has previously been shown in the measurement of T enanthate (Wang et al., 2008) and T undecanoate (TU) (Lachance et al., 2015). Inaccurate estimation of circulating T levels may lead physicians to make improper dose adjustments in hypogonadal men treated with a T ester such as T enanthate, cypionate, and undecanoate because T levels in blood that are typically collected in plain tubes may yield falsely high T levels due to ex vivo conversion of T esters to T.
In this study, we evaluated whether commonly used additives and anticoagulants in blood collection tubes prevent the esterase action on androgen ester prodrugs and allow more accurate measurement of circulating T in men treated with TU or DMAU. Oral TU has been available for over 30 years in most of the world except the United States (Skakkebaek et al., 1981; Schurmeyer et al., 1983; Gooren, 1994). TU is also available as an intramuscular injectable form (Schubert et al., 2004; Morgentaler et al., 2008; Wang et al., 2010). Accurate assessment of T levels is required for monitoring patients receiving T esters as replacement therapy since these levels are used for dose titration and to assess the adequacy of T replacement therapy (Matsumoto & Bremner, 2004). We also studied dimethandrolone undecanoate (DMAU, 7‐alpha, 11‐beta 19‐nortestosterone undecanoate), a modified androgen largely hydrolyzed in the liver to the active compound dimethandrolone (DMA), that is being developed as a male hormonal contraceptive (Attardi et al., 2006; Surampudi et al., 2014; Ayoub et al., 2016). Reliable DMA levels are needed to predict and identify the lowest circulating concentration of this potential male contraceptive that will provide adequate androgenic action, spermatogenesis suppression, and contraceptive efficacy. This report describes enhanced studies on efforts to accurately measure active androgen product after dosing with two oral androgen esters.
Material and Methods
Research participants
Blood samples were collected from 97 healthy men aged between 18 and 45 years who were screened by medical history and physical examination. In addition, we studied eight hypogonadal men (five with primary testicular dysfunction including two with Klinefelter syndrome, three with hypogonadotropic hypogonadism due to pituitary or hypothalamic diseases) who were dosed with oral TU; four men from Canada who were on Andriol® (oral TU) where the baseline T levels were not available; 15 healthy volunteers enrolled in a contraceptive clinical trial who were screened by medical history, physical examination, normal laboratory tests, serum T, and semen analyses within the fertile male range who were dosed with oral DMAU. The demographics of these three groups of volunteers are shown in Table 1.
Table 1.
Characteristics of the hypogonadal and healthy men (mean ± SD)
| Hypogonadal men | Men taking Andriol® | Healthy men | |
|---|---|---|---|
| No. of participants | 8 | 4 | 15 |
| Age (years) | 47.3 ± 11.6 | 58.3 ± 2.8 | 34.8 ± 8.0 |
| Height (cm) | 174.8 ± 9.1 | 176.5 ± 4.2 | 175.9 ± 8.4 |
| Weight (kg) | 90.8 ± 20.6 | 82.5 ± 1.7 | 77.6 ± 13.1 |
| BMI (kg/m2) | 30.0 ± 7.1 | 26.5 ± 1.3 | 25.0 ± 3.0 |
| Ethnicity N (%) | |||
| Not Hispanic or Latino | 4 (50%) | 4 (100%) | 12 (80%) |
| Hispanic or Latino N | 4 (50%) | 0 (0%) | 3 (20%) |
| Race N (%) | |||
| White | 7 (87.5%) | 4 (100%) | 5 (33.3%) |
| Asian | 1 (12.5%) | 0 (0.0%) | 3 (20.0%) |
| Black/African American | 0 (0.0%) | 0 (0.0%) | 4 (26.7%) |
| Other | 0 (0.0%) | 0 (0.0%) | 3 (20.0%) |
| Baseline T (ng/dL) | 70 ± 57 | Not known | 518 ± 89 |
Experimental and study design
Ex vivo spiking experiments to evaluate the effects of blood esterase inhibitors on the conversion of TU/DMAU to T/DMA (Table 2A)
Table 2.
(A) Ex vivo spiking experiment designa. (B) In vivo blood sample collection from men at baseline or after dosing with TU or DMAU
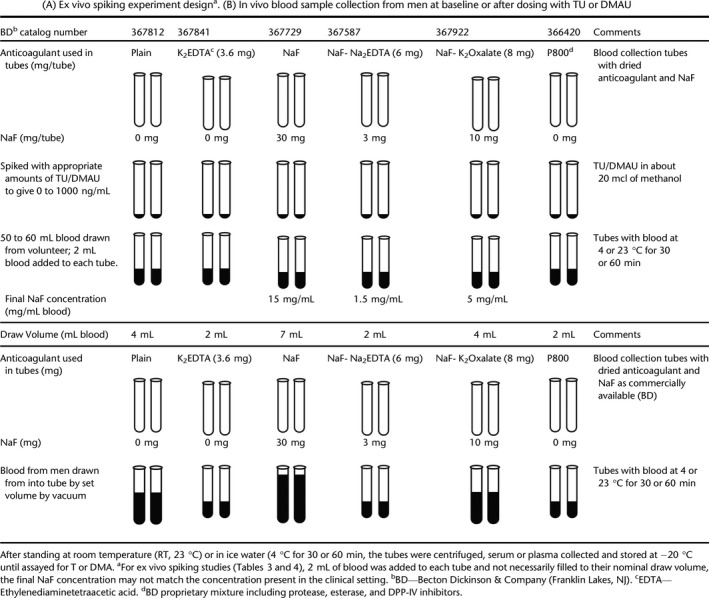
TU or DMAU in methanol was added to the various commercially available blood collection tube types, some of which contained esterase inhibitors (Table 2A). Venous blood, up to 60 mL, was collected from healthy volunteers or hypogonadal men for ex vivo studies. Two mL of aliquots of freshly collected whole blood was transferred into different blood collection tubes, TU was added to achieve a concentration of 30 to 1000 ng/mL (methanol concentration was ≤ 1%) (Tables 2A and 3), and DMAU was added to attain a concentration of 125 to 1000 ng/mL (Tables 2A and 4). These concentrations were chosen because they span the expected TU/DMAU Cmax (maximal concentration) after dosing with oral TU/DMAU (Yin et al., 2012a,b; Surampudi et al., 2014; Ayoub et al., 2017). Prior to centrifugation, the tubes were held for 30 or 60 min at 4 °C or 60 min at room temperature (RT, 23 °C). These ex vivo experiments were repeated at least twice with different concentrations of TU/DMAU added to blood collection tubes. Tables 3 and 4 summarize data from representative experiments where the spiked concentrations of TU and DMAU mimicked clinical concentrations after oral dosing.
Table 3.
Measured T levels after addition of TU to different blood collection tubes to yield a concentration of 0, 300, and 600 ng/mL from healthy mena
| Incubation time (min) – temperature | TU 0 ng/mL | TU 300 ng/mL | TU 600 ng/mL | ||||
|---|---|---|---|---|---|---|---|
| T (ng/dL) | % difference vs. Plainb | T (ng/dL) | % difference vs. no TU added | T (ng/dL) | % difference vs. no TU added | ||
| Experiment 1 | |||||||
| Plain | 30 – 4 °C | 349.5 | 412.0 | +17.9 | 455.5 | +30.3 | |
| 30 – RT | 353.0 | 505.0 | +43.1 | 814.0 | +130.6 | ||
| NaF (15 mg/mL) | 30 – 4 °C | 271.0 | −22.5 | 269.5 | −0.6 | 336.5 | +24.2 |
| 30 – RT | 259.0 | −26.6 | 301.5 | +16.4 | 360.0 | +39.0 | |
| P‐800 | 30 – 4 °C | 323.5 | −7.4 | 384.0 | +18.7 | 374.5 | +15.8 |
| 30 – RT | 329.5 | −6.7 | 467.0 | +41.7 | 643.0 | +95.1 | |
| Experiment 2 | |||||||
| Plain | 30 – 4 °C | 437.5 | 624.5 | +42.7 | 541.0 | +23.7 | |
| 60 – 4 °C | 420.5 | 741.5 | +76.3 | 794.0 | +88.8 | ||
| 60 – RT | 407.5 | 984.0 | +141.5 | 1515.0 | +271.8 | ||
| K2EDTA (1.8 mg/mL) | 30 – 4 °C | 443.5 | +1.4 | 534.5 | +20.5 | 539.5 | +21.6 |
| 60 – 4 °C | 454.5 | +8.1 | 521.5 | +14.7 | 669.5 | +47.3 | |
| 60 – RT | 481.0 | +18.0 | 1105.0 | +129.7 | 1765.0 | +266.9 | |
| NaF (1.5 mg/mL) + Na2EDTA (3 mg/mL) | 30 – 4 °C | 414.0 | −5.4 | 443.0 | +7.0 | 482.5 | +16.5 |
| 60 – 4 °C | 411.0 | −2.3 | 497.0 | +20.9 | 654.5 | +59.2 | |
| 60 – RT | 447.5 | +9.8 | 705.0 | +57.5 | 1235.0 | +176.0 | |
| NaF (5 mg/mL) + K2Oxalate (4 mg/mL) | 30 – 4 °C | 391.5 | −10.5 | 387.5 | −1.0 | 438.0 | +11.9 |
| 60 – 4 °C | 380.5 | −9.5 | 435.0 | +14.3 | 494.0 | +29.8 | |
| 60 – RT | 399.5 | −2.0 | 717.0 | +79.5 | 1085.0 | +171.6 | |
| P800 | 30 – 4 °C | 435.5 | −0.5 | 492.5 | +13.1 | 515.0 | +18.3 |
| 60 – 4 °C | 476.0 | +13.2 | 491.5 | +3.3 | 582.0 | +22.3 | |
| 60 – RT | 428.0 | +5.0 | 860.0 | +100.9 | 1380.0 | +222.4 | |
Note that for the ex vivo spiking studies, 2 mL blood was added to each tube. Thus, the tubes were not filled to their nominal draw volume, so the final NaF concentration does not match the concentration present in the clinical setting (see Table 2). The results from duplicate tubes were averaged.
% difference vs. plain—relative difference vs. plain tube kept at same conditions.
Table 4.
DMA levels (ng/mL) after addition of known amounts of DMAU in blood collected in different tubes from healthy mena
| Incubation time (min) – temperature | DMAU concentration | ||||
|---|---|---|---|---|---|
| 300 ng/mL | 600 ng/mL | ||||
| DMA (ng/mL) | % difference vs. Plainb | DMA (ng/mL) | % difference vs. Plain | ||
| Plain | 30 – 4 °C | 3.3 | 1.5 | ||
| 60 – 4 °C | 5.9 | 4.3 | |||
| 60 – RT | 8.4 | 14.5 | |||
| K2EDTA (1.8 mg/mL) | 30 – 4 °C | 1.4 | −56.1 | 1.2 | −17.1 |
| 60 – 4 °C | 1.4 | −76.5 | 2.3 | −46.4 | |
| 60 – RT | 9.7 | +15.2 | 16.5 | +13.4 | |
| NaF (1.5 mg/mL) + Na2EDTA (3 mg/mL) | 30 – 4 °C | 0.6 | −80.6 | 1 | −30.0 |
| 60 – 4 °C | 1.3 | −77.3 | 2.4 | −43.5 | |
| 60 – RT | LLOQ | – | 10.2 | −29.4 | |
| NaF (5 mg/mL) + K2Oxalate (4 mg/mL) | 30 – 4 °C | LLOQ | – | 0.9 | −38.7 |
| 60 – 4 °C | 1 | −82.2 | 1.2 | −72.7 | |
| 60 – RT | 5.7 | −31.9 | 9.6 | −34.1 | |
| P800 | 30 – 4 °C | 0.7 | −78.1 | 0.9 | −42.5 |
| 60 – 4 °C | 0.9 | −84.2 | 1.4 | −67.1 | |
| 60 – RT | 6.7 | −20.6 | 10.8 | −25.9 | |
Note that for the ex vivo spiking studies, 2 mL blood was added to each tube. Thus, the tubes were not filled to their nominal draw volume, so the final NaF concentration does not match the concentration present in the clinical setting (see Table 2). The results from duplicate tubes were averaged.
% difference vs. plain—relative difference vs. Plain tube kept at same conditions.
Studies in healthy men not dosed with TU
Morning blood samples were collected from 97 healthy men (18–45 years) into plain and NaF‐EDTA tubes for each participant. * [Correction added on February 1, 2019, after online publication: Text referencing a clinical laboratory in Canada has been deleted from this sentence.] The plain tubes were kept at RT and the NaF‐EDTA tubes kept at 4 °C, and both tubes were centrifuged after 30 min. Blood in plain tubes was held at RT to allow clot formation; blood collected in NaF‐EDTA was held at 4 °C for studies where maximal esterase inhibition was desired because our ex vivo studies showed that keeping the tubes at 4 °C was optimal for inhibition of esterase activity (Tables 3 and 4).
Single oral dosing of TU/DMAU studies in men
Eight hypogonadal men participated in a clinical trial where a single oral dose of 316 mg TU (molecular weight 456.7; conversion factor 1 ng/mL = 2.189 nmol/L) in a self‐emulsifying drug delivery system was administered immediately prior to a meal (Clinical Trial # NCT02670343) and blood samples were drawn pre‐dose (−30 and 0 min) and hourly for 12 h post‐dose. Fifteen healthy men participated in a clinical trial where 200 mg DMAU (molecular weight 470.7, conversion factor 1 ng/mL = 2.126 nmol/L) in castor oil/benzyl benzoate or powder in a capsule (Clinical Trial #NCT01382069) was administered by mouth after a meal. These healthy volunteers consented to have extra blood samples drawn during their serial blood draws (10 samples over 24 h) for the pharmacokinetics study. Samples collected in plain tubes were kept at room temperature, while all other samples were kept at 4 °C for 30 min prior to centrifugation.
Four men (Quebec, Canada) who were taking a commercially available oral TU (Andriol®) donated blood at about 4 and 5 h after they took their morning dose. After blood collection, the tubes were allowed to incubate at RT (plain and EDTA tubes) or on ice (NaF‐EDTA tube) for 30, 60, 120, or 180 min prior to centrifugation. The serum or plasma was then separated and frozen prior to analysis.
For all the studies described, all participants signed informed consent forms that were approved by an Internal Review Board.
Analytic methods
T/TU (Shiraishi et al., 2008; Yin et al., 2012a,b) and DMA/DMAU concentrations were measured by LC‐MS/MS assays previously described (Surampudi et al., 2014; Ayoub et al., 2017). Briefly, levels of T/TU and DMA/ DMAU were measured using a Shimadzu high‐performance LC 20 series systems (Columbia, MD) coupled to AB Sciex Triple Quad 5000 or 5500 mass spectrometer (Foster City, CA) and analyzed using the turbo ion spray source in the positive mode. For T/TU assay, serum/plasma samples were extracted with ethyl acetate: hexane (3:2, volume:volume) and a Thermo Hypersil GOLD column (Waltham, MA) was used with a gradient profile at a flow rate of 0.045 mL/min with a mobile phase of 2% methanol (MeOH) and 98% water and 0.1% formic acid. The parent/product ions for T/TU were monitored at m/z 289.2/109.0 and 457.5/97.1 and deuterated (D2) T and D21 TU at m/z 291.2/110.9 and 478.7/97.2, respectively. For the DMA assay, serum samples were extracted twice with methyl tertiary‐butyl ether/hexane solution (volume: volume. 50:50). For DMAU measurements, 50 mcl of serum samples was treated with 200 mcl acetonitrile to precipitate proteins before the solid‐phase extraction using WAX‐55‐65‐20 mg columns (DPX Labs, Lexington, SC). Both DMA and DMAU were separated using a Shimadzu HPLC LC20 system with a Thermo Hypersil GOLD column with a gradient profile at a flow rate of 0.08 mL/min and a mobile phase A of MeOH and an aqueous solution of 2%MeOH H2O containing 0.1% formic acid as mobile phase B. DMAU and DMA were monitored with transitions m/z 471.3/169.2 for DMAU, m/z 476.4/169.2 for d5‐DMAU, 303.6/109.0 for DMA, and 308.3/93.1 for d5‐DMA. The within‐run and between‐run precision was 2.2–9.3% and 3.3–10.2% for T; 3.4–11.8% and 7.6–10.4% for TU; 4.1–8.5% and 12.6–13.3% for DMA; and 6.1–8.1% and 9.9–11.7% for DMAU, respectively. Accuracy ranged from 102.2% to 110.2% for T; 88.3–108.3% for TU; 91.6–100.1% for DMA; and 96.2–102.2% for DMAU at the ranges measured. The lower limit of quantification is 2.0 ng/dL for T, 2.0 ng/mL for TU, 0.5 ng/mL for DMA, and 1.0 ng/mL for DMAU. The T LC‐MS/MS method was certified by CDC Laboratory Hormone Standardization (HoSt) Program (Vesper et al., 2008).
Statistical analysis
Ex vivo data are presented in Tables 3 and 4 as an average of the duplicate tubes. Percent difference compared to average plain tube value with no ester added was calculated for all conditions and all tubes. For data from multiple samples, normality of the data distribution was assessed by visual means (histogram and cumulative probability plots) and Shapiro–Wilk test. Data for normally distributed variables were presented as mean and 95% confidence interval (CI) and median (25th, 75th percentile) were shown for non‐normally distributed data such as Cavg and Cmax for T/DMA (Ghasemi & Zahediasl, 2012). Graphic presentation for the 24‐h pharmacokinetics studies used geometric mean and 95% confidence interval (95% CI). For samples collected during pharmacokinetic studies, the area under the 12/24‐h T/DMA concentration curve (AUC) was calculated using the trapezoidal method. The average concentration over 12/24 h (Cavg) was calculated by AUC divided by 12/24 h. Comparison between different tube types for steroid levels from the same draw was performed using Wilcoxon signed rank test. A p value of <0.05 was considered significant.
Results
Ex vivo experiments to evaluate the effects of esterase inhibitors in blood on the measurement of T/DMA and conversion of TU/DMAU to T/DMA
Impact of blood collected in tubes with NaF on measured plasma T concentration
In the absence of TU, collecting blood into tubes containing NaF consistently reduced measured T levels. The decrease in measured T concentration was related to the final NaF concentration: NaF tube with final NaF concentration of 15 mg/mL showed a decrease of −23 to −27% (Table 3, Experiment 1); the NaF‐Oxalate tube with NaF at 10 mg/mL had changes of −2 to −11%; and the NaF‐EDTA tube with NaF at 1.5 mg/mL had changes of −5 to +10% (Table 3, Experiment 2). Table S1 reveals that addition of increasing amounts of NaF (up to 20‐fold higher than in commercial tubes) to serum or aqueous solution did not affect the measured T concentration by LC‐MS/MS suggesting the cellular component of blood (i.e., partitioning effect) is important for NaF effects on measured T.
We also tested the effect of matrix (serum from plain tubes or plasma from NaF‐EDTA tubes) on both the T and DMA LC‐MS/MS assays. Ion suppression was less in plasma than serum for the T assay and similar in plasma and serum for the DMA assay (Table S2). Since standards and internal standards (deuterated steroids) were formulated in the same matrix as the samples, the effect of the matrix did not impact the analyte concentration measurements.
Ex vivo addition of TU to blood samples collected in different blood collection tubes
Blood from four hypogonadal men (prior to administration of oral TU) was aliquoted into duplicate plain tubes with known amounts of TU (to yield a final concentration of 30 to 1000 ng/mL) and left at 4 °C or RT for 30/60 min. At baseline, average serum T was 26.0 ± 6.2 ng/dL (1 ng/dL = 0.0347 nmol/L), and substantial overestimation of T was observed due to the conversion of TU to T in blood, which was dependent on the amount of TU added (TU added 30 ng/mL, T measured 48.9 ± 5.1 ng/dL; TU 100 ng/mL, T 89.49 ± 4.9 ng/dL; TU 300 ng/mL, T 242 ± 15.2 ng/dL; and TU 1000 ng/mL, T 578.5 ± 66.6 ng/dL representing up to a 22‐fold increase from baseline at the highest TU concentration). The ex vivo conversion of androgen prodrugs requires blood cells; when 500 ng/mL TU was added to two serum samples or an aqueous solution, the measured T levels did not increase after incubation with different amounts of NaF (Table S1, Experiments 1 and 2).
Overestimation of measured T levels +24 to 272% was observed when increasing amounts of TU were added to plain tubes and were substantially diminished in NaF‐containing and P800 tubes (Table 3, Experiments 1 and 2). The ex vivo conversion is both time and temperature dependent. As shown in Table 3, Experiment 2, the addition of TU to a concentration of 300 ng/mL in blood collected in plain tubes increased measured T levels by 43% to 76% after 30 and 60 min at 4 °C, respectively, and by 142% after 1‐h incubation at RT. This overestimation was reduced to 7% (30 min at 4 °C) when the blood was collected in NaF‐EDTA tube. This inhibition of conversion of TU to T was incomplete and followed this blood collection tube order: NaF> NaF‐Oxalate> NaF‐EDTA > P800 tubes.
Ex vivo addition of DMAU to blood samples in different collection tubes
When DMA (final concentration 5 to 50 ng/mL) or DMAU (final concentration 300 to 600 ng/mL) was added to blood samples from four healthy men collected in plain or NaF‐EDTA tubes, both DMA and DMAU measured were lower in the tube with NaF‐EDTA (average DMA −12.1% and DMAU −34.5%). However, when DMA was added to aqueous solution and levels of DMA were measured in the presence of increasing amount of NaF (0 to 200 mg/mL about 20‐fold higher than concentrations in NaF‐EDTA tubes), no change in measured DMA levels was observed (Table S1, Experiment 4). In addition, there was no conversion of DMAU to DMA in serum suggesting that the presence of blood cellular component is required for the action of NaF on measured DMA levels (Table S1, Experiment 3).
Increasing amounts of DMAU (final concentration of 0, 125, 250, 500, and 1000 ng/mL; were added to plain and NaF‐containing tubes (NaF concentration 15 mg/mL blood) and allowed to stand for 60 min at RT, and DMA (molecular weight 302.5, 1 ng/mL = 3.31 nmol/L) levels increased progressively (1.57, 2.79, 5.54, and 8.82 ng/mL) depending on the amount of DMAU added, but the conversion of DMAU to DMA was reduced in NaF tubes by 72%, 61.3%, 54.3%, and 48.8%, respectively. NaF partially prevented hydrolysis of DMAU to DMA similar to the data shown with TU.
In another experiment, DMAU (300 and 600 ng/mL final concentration in the tube) was added to five different blood collection tube types and kept at 23 °C or at 4° for 30 or 60 min prior to centrifugation. Again, the highest levels of DMA were in plain and EDTA tubes. DMA levels were lower with tubes containing NaF (NaF‐Oxalate and NaF‐EDTA) or esterase inhibitors (P800) for all doses and conditions indicating that DMAU conversion into DMA, ex vivo, can be partially blocked by esterase inhibitors (Table 4).
Studies in healthy men not dosed with TU
To better characterize the impact of NaF on T levels, blood was collected from 97 healthy young men into NaF‐EDTA tubes and plain tubes. The mean T concentrations in the serum and NaF‐EDTA plasma were 585 ± 17.3 ng/dL and 504 ± 15.8 ng/dL, respectively, and the geometric means were 559 and 478 ng/dL, respectively, demonstrating a 14.2% reduction in T levels measured in NaF‐EDTA plasma compared to serum that was uniform across the eugonadal range of T concentrations (Fig. 1).
Figure 1.
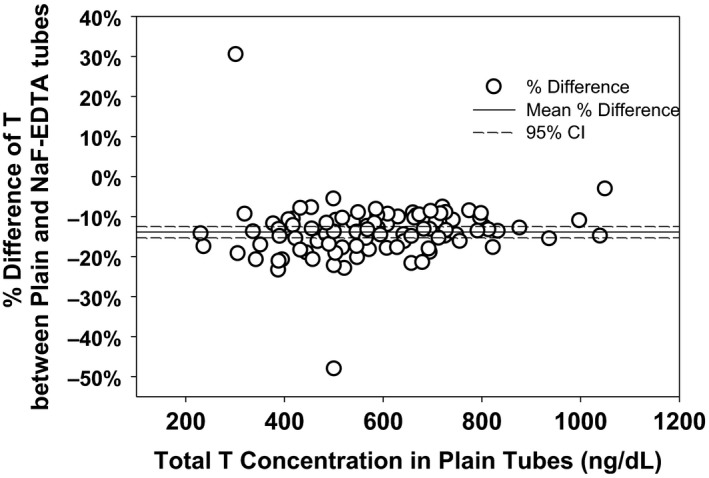
Difference between T levels measured in serum (blood collected into plain tubes) and plasma (blood collected in NaF‐EDTA tubes) expressed as a percent of the plain tube assay results against the concentration of serum T measured from blood collected in plain tubes. The mean difference between plasma and serum was −14.2%.
In vivo (oral dosing) experiments
Differences in measured T levels in blood collected in different tubes after oral administration of TU
Concentrations of TU and T after a single dose of TU at all time‐points for each blood collection tube are presented in Fig. 2A. TU levels appeared to be similar in blood samples collected in all tubes. Similar to the ex vivo studies, serum T levels in samples collected in plain tubes were higher compared with all other tubes containing variable concentrations of NaF, but differences were only significant at peak T levels (for NaF‐Oxalate, NaF‐EDTA, and NaF tubes p = 0.012, p = 0.036, and p = 0.069 at 2 h and p = 0.012 for all tubes at 3 h, respectively). The T Cavg and Cmax over the 12 h were significantly lower in tubes containing NaF compared to serum collected in plain tubes (Fig. 2B). However, the TU Cavg and Cmax collected in the plain and NaF‐containing tubes were similar over the 12‐h period with only blood collected in NaF‐Oxalate being lower when compared to plain tube (p = 0.04).
Figure 2.

(A) TU and T concentrations (geometric mean and 95% CI) time profiles for blood collected in plain, NaF‐ETDA, NaF‐Oxalate and NaF‐containing tube during the 12 h after oral administration of TU to 8 hypogonadal men. (B) Average (Cavg) and maximum (Cmax) TU and T concentrations during the 12 h after oral administration of TU to 8 hypogonadal men with blood collected in NaF‐Oxalate, NaF‐EDTA, NaF, and P800 tubes compared to plain tubes. (The box represents the 25 and 75 percentile and the whiskers 10 and 90 percentile, the solid line in the box is the median, and the dotted line the mean). (C) Difference in T concentrations measured from blood collected in plain vs. NaF‐EDTA tubes in relation to the corresponding average TU concentrations. Regression line for segment, TU < 15 ng/mL (y = −0.010x + 0.070) and segment TU ≥ 15 ng/mL (y = 0.000259x + 0.148). Inset showed expanded x‐axis for lower concentration of TU. The NaF, NaF‐EDTA, and NaF‐Oxalate tubes were kept at 4 °C, and the plain tubes were kept at room temperature for 30 min prior to processing.
A plot of the difference between T concentrations from plain and NaF‐EDTA collection tubes vs. average TU concentration revealed that higher TU concentrations (above 15 ng/mL) were associated with an increased difference between the measured T concentrations (Fig. 2C). Whereas at TU concentrations below 15 ng/mL, the mean difference in T concentrations from the two types of collection tubes was close to 0%, as identified by a regression relation (Fig. 2C inset). At higher TU concentrations, the average difference was > 15% reaching as high as 30%.
The conversion of TU to T continued for up to 180 min after blood was collected from men who were taking oral TU (Andriol®) with the extent of conversion greater in the plain and EDTA tubes, which were incubated at RT, than in the NaF‐EDTA tubes, which were kept in ice (Table 5). While the increase in T concentration between 30 and 60 min of incubation was about 7% in all 3 tube types, by the end of 180 min of incubation in the plain and EDTA tubes, the T concentrations had increased substantially more (30–40%) compared to the NaF‐EDTA tubes (about 8%).
Table 5.
Mean percent change (95% CI) in T concentration over time in blood collected into different tubes from four men taking oral TU (Andriol®)
| Tube type | Incubation condition | Increase in T concentration vs. 30 min samplea | ||
|---|---|---|---|---|
| 60 min | 120 min | 180 min | ||
| Plain | Room temperature | 6.4% (1.6%, 11.1%) | 18.3% (9.6%, 27.0%) | 29.9% (15.2%, 44.5%) |
| K2EDTA (3.6 mg) | Room temperature | 7.4%b (−2.4%, 17.2%) | 20.9% (4.4%, 37.4%) | 42.3% (18.9%, 65.8%) |
| NaF(3 mg) ‐ Na2EDTA (6 mg) | 4°C | 6.7% (−2.8%, 16.3%) | 5.8% (1.8%, 9.9%) | 7.7% (2.3%, 13.2%) |
T concentration in the 30‐min sample was used as baseline.
T concentration were also measured in EDTA tubes centrifuged immediately after collection. There was a 9.2% increase in T level at 30 min compared to the samples that were centrifuged immediately after collection.
Differences in measured DMA in blood collected by different tubes after oral administration of DMAU
When DMAU was administered to healthy male volunteers, peak DMA and DMAU concentrations (4, 6, and 8 h) were lower in samples collected in tubes with NaF but not tubes with P800 compared to plain tubes (Fig. 3A). Both DMAU and DMA Cavg (Fig. 3A) and Cmax (data not shown) levels were lower in tubes with NaF‐Oxalate and NaF‐EDTA (p = 0.043 for all tests) and lowest in tubes with higher concentration of NaF (p = 0.018 and p = 0.028 for DMAU and DMA, respectively) compared with plain tubes (Fig. 3B). A plot of the difference between DMA concentrations from plain and NaF‐EDTA collection tubes vs. average DMAU concentration showed that unlike TU, higher DMAU concentrations (above 10 ng/mL) were not associated with an increased difference between the DMA concentrations (Fig. 3C). The difference between the plain and NaF‐EDTA maintained constant about + 22%. When DMAU concentrations were below 10 ng/mL (Fig. 3C inset), the mean difference in DMA concentrations from the two types of collection tubes averaged close to 0%.
Figure 3.
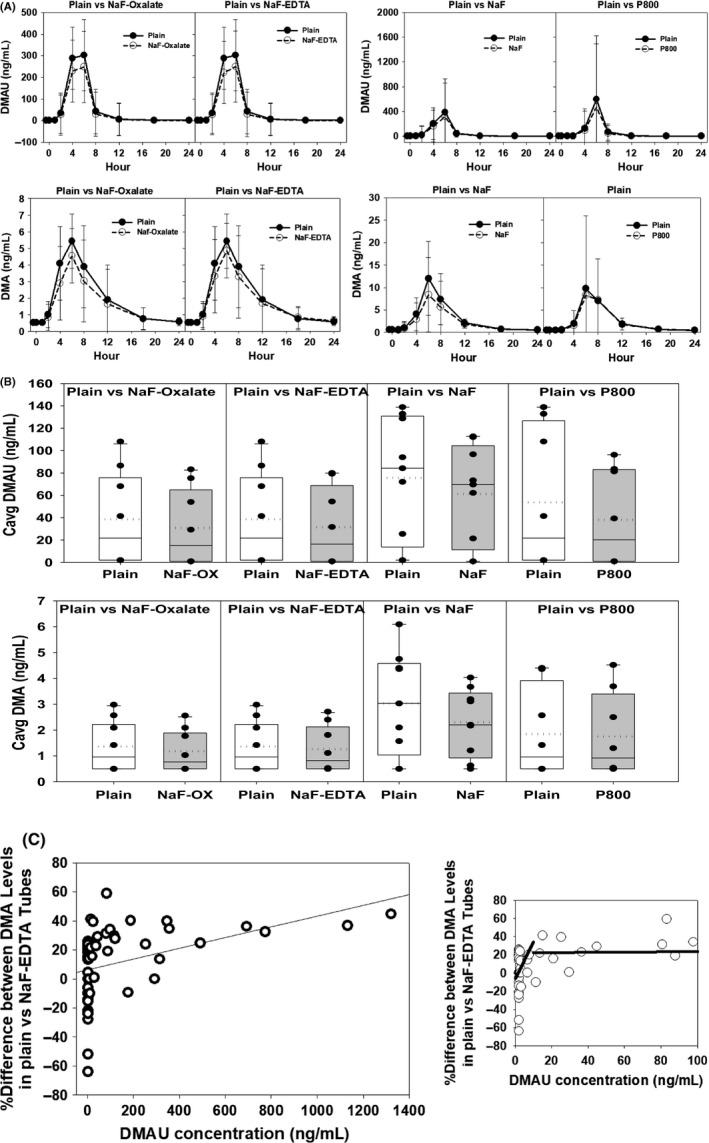
(A) DMAU and DMA concentrations (geometric mean and 95% CI) in blood collected in NaF‐Oxalate, NaF‐EDTA, NaF, and P800 tubes compared to plain tubes during the 24 h after oral administration of DMAU to 15 healthy men. Not all men had blood collected in all the different blood collection tubes. (B) Average (Cavg) of DMAU and DMA concentrations during the 24 h after oral administration of DMAU to 15 healthy men with blood collected in NaF‐Oxalate, NaF‐EDTA, NaF, and P800 tubes compared to plain tubes. (The box represents the 25 and 75 percentile and the whiskers 10 and 90 percentile, the solid line in the box is the median, and the dotted line the mean). (C) Difference in DMA concentrations measured from blood collected in plain vs. NaF‐EDTA tubes in relation to the corresponding average DMAU concentrations. Regression line for segment, DMAU< 10 ng/mL (y = −6.4 + 2.79x) and high segment DMAU ≥ 10 ng/mL (y = −22.2−0.01x). Inset showed expanded x‐axis for lower concentration of DMAU. Samples collected in plain tubes were kept at room temperature, while all other samples were kept at 4 °C for 60 min prior to processing.
Discussion
Non‐specific esterases in liver, tissue, and blood cellular components hydrolyze inactive steroid esters (e.g., androgen prodrugs) into a biologically active form. The use of ester prodrugs for oral administration of androgens allows greater systemic bioavailability and a longer half‐life than the active moiety (Behre, 2004). However, when blood samples are collected, the prodrug in the sample can continue to undergo hydrolysis, ex vivo, by non‐specific esterases present in the blood (mainly in red and white blood cells) thus leading to overestimation of circulating androgen levels (Williams, 1985). We studied different blood collection tubes with esterase inhibitors to determine whether androgens can be more accurately measured when the ex vivo conversion of the prodrug (androgen esters) to the drug (androgens) are inhibited.
We first assessed the effect of NaF, a known esterase inhibitor (Dufer et al., 1984; Yourno, 1986; Cohn et al., 1987), on the measurement of T by LC‐MS/MS. Our ex vivo experiments demonstrated that when measuring T levels from blood samples that do not contain TU, T levels were underestimated in tubes containing NaF. The greatest underestimation of T concentrations was seen in tubes with the highest concentration of NaF. Our data are consistent with our prior studies that measured T levels in blood collected in tubes containing NaF and demonstrate that T levels are underestimated by about 15–20 percent (Shiraishi et al., 2008; Wang et al., 2008). In this study, we demonstrated that collecting blood in NaF‐EDTA tubes from 97 healthy men resulted in an underestimation of T levels by about 14.2% across the adult male range. This underestimation is not due to NaF interference with LC‐MS/MS detection, since adding NaF to either an aqueous solution or serum containing T did not decrease the measured T level. Similarly, when DMA was added to blood (but not aqueous solution) with NaF, DMA levels measured were similarly lower (about 12%). We confirmed that the lower concentrations of T/DMA measured in NaF‐EDTA plasma compared to serum by LC‐MS/MS are not due to the effect of the matrix on the measurement because the plasma did not show more ion suppression than serum. The interference by NaF appeared to require the presence of blood components suggesting that NaF may complex with blood components preventing the accurate measurement of androgens after separation of blood components by LC‐MS/MS assays. This underestimation of T/DMA levels in serum/plasma gives rise to inaccurate values when blood is collected in tubes containing NaF. Consequently, tubes containing NaF should not be used for collection of blood for measurement of T (and probably of other androgenic steroids) in clinical practice in the absence of T or androgen esters prodrugs.
We then compared blood collected in tubes with and without NaF as an esterase inhibitor (Dufer et al., 1984; Yourno, 1986; Cohn et al., 1987) or a tube with proprietary proteinase and esterase inhibitors (P800) on conversion of TU/DMAU to T /DMA ex vivo. The P800 tube decreased hydrolysis of steroid esters ex vivo but was not as effective as tubes containing different concentrations of NaF and is unlikely to be adopted for steroid measurements in routine clinical practice due to cost and limited availability. We previously demonstrated that non‐specific esterases in blood cells can convert the T ester, T enanthate, to T in blood and may affect the accuracy of the measured T concentration (Wang et al., 2008). When TU added to blood was allowed to stand at RT, the T concentration measured in the serum was higher than the initial T concentration (Lachance et al., 2015). The results of our earlier study showing that TU added to blood had little effect on T measurements were erroneous and were probably due to the insolubility of TU in aqueous solutions (Wang et al., 2008, 2018; Lachance et al., 2015). All our ex vivo spiking experiments showed significant concentration‐dependent ester hydrolysis when steroid esters (TU and DMAU) were added to the blood, resulting in increased measured T or DMA. The amount of hydrolysis was also influenced by the type of blood collection tube selected as NaF diminished this hydrolysis by binding to the active form of non‐specific esterases, thereby preventing the enzyme from acting on substrates such as the androgen esters (Haugen & Suttie, 1974; Huang et al., 2016). While the results differed slightly between TU and DMAU, NaF‐Oxalate or NaF‐EDTA appeared to deliver the most consistent results in all experiments. These findings are consistent with previously conducted studies (Lachance et al., 2015).
There are two factors, aside from the T/DMA level in the circulation, that influence the measured T/DMA levels when blood is collected in NaF‐containing tubes from a man who received oral TU/DMAU. First, there is the NaF interference of LC‐MS/MS assay which decreases the measured T/DMA concentrations (−14% for T and about −12% for DMA). Second, there is the NaF inhibition of esterases that decreases the ex vivo conversion of TU/DMAU to T/DMA which may further reduce the measured T/DMA levels. These factors cannot be experimentally distinguished but appear to collectively influence measured T/DMA concentrations such that levels in serum from blood collected into plain tubes are higher than in blood collected into tubes with NaF both ex vivo and in vivo. After dosing with TU/DMAU, the ex vivo conversion of TU to T is dependent on the TU levels in circulation, whereas ex vivo conversion of DMAU to DMA appeared to be more constant and not dependent on DMAU levels. The reason for this difference in responses for TU and DMAU is not known.
Other factors that significantly impact the amount of ex vivo hydrolysis include temperature and duration that the test sample is allowed to stand before centrifugation to obtain serum or plasma. In plain and EDTA tubes kept at room temperature, hydrolysis persists for at least 180 min post‐collection. Keeping the NaF‐EDTA tubes at 4 °C substantially reduced the hydrolysis. This implies that the samples with anticoagulants should be processed as quickly as possible and if they need to be kept longer prior to centrifugation they should be kept at 4 °C.
When blood is collected from men who have been orally dosed with TU/DMAU, the differences among plain and NaF‐containing tubes were often small and not significant except at the peak prodrug/drug concentrations. While these differences with blood collection tubes led to statistically significant differences in Cavg and Cmax calculations for T/DMA, the relevance depends on how the results are going to be used in a clinical setting. In most instances, clinicians use the measured T levels (in concert with symptoms of hypogonadism) to monitor response to treatment and adjust the T dose to within the broad physiological T range. If the sampling is near the T ester trough concentration, then the method of sample collection is unlikely to impact the result. However, if the sampling is near TU Cmax, then the overestimation may be significant (e.g., >15%) unless blood is collected in tubes with esterase inhibitors. For clinical trials in drug development in which the T levels are used as a measure of efficacy by regulatory bodies, the consistent use of the appropriate type of tube with relevant validation of reference ranges can be important. Hence, in efficacy studies of oral TU, the most appropriate blood collection tube is one containing NaF when TU concentrations are high as has been noted by Lachance et al. (2015). Overestimation of T may have a clinical impact on hypogonadal men who are replaced with oral TU and whose T concentrations are based on blood collected into, for example, plain tubes. However, when we take into consideration the targeted therapeutic range of T replacement, prevention of ex vivo conversion of TU to T is clinically important only for T levels near the upper or lower reference range to allow for appropriate dose adjustment. Furthermore, when blood is collected at a time point that reflects the average concentration of T after oral TU (i.e., about 5 h post‐dose), TU concentrations are low and would not foster clinically significant ex vivo synthesis of T (Yin et al., 2012a,b).
In contrast to oral TU, the collection of blood in plain tubes after DMAU administration allows relatively accurate quantification of DMA/DMAU levels. There is no reference or efficacy range for DMA levels, but in order to minimize the potential for post‐collection hydrolysis, we suggest that once blood has clotted, the samples be processed as soon as possible. The clinical response to DMAU administration can be guided by serum DMA levels that have to be determined in clinical studies.
Conclusion
Overestimation of circulating steroid levels after addition of steroid ester is likely caused by ex vivo hydrolysis of the ester in the blood collection tube and is significantly diminished in tubes containing NaF. However, NaF also directly decreases the levels of T and DMA measured by LC‐MS/MS even without the presence of the ester. The overestimation due to hydrolysis can also be decreased by minimizing the time tubes, which are held prior to sample processing and by cooling of samples prior to processing (centrifugation). The differences in T observed in in vivo studies after oral administration of TU/DMAU was greatest around the time of peak prodrug concentrations. During pharmacokinetics studies, these differences may be important for regulatory approval because post‐collection conversion may lead an overestimation of average or peak androgen levels. However, the impact on clinical therapeutics for TU/DMAU may not be as relevant when blood is collected into a consistent tube type because of the wide therapeutic T/DMA window.
Conflict of Interest
JC, AL, LH, and FB have nothing to disclose. RS is a paid consultant for Clarus Therapeutics, Antares and Grant support from Clarus Therapeutics. JL is a paid consultant to Clarus Therapeutics. RD is employed by and has equity interest in Clarus Therapeutics, and is an inventor on relevant US patents (Nos. 8,241,664; 8,492,369; 8,778,916; and 8,828,428). TD is employed by and has equity interest in Clarus Therapeutics. CW received grant support from Clarus Therapeutics, Antares and TesoRx.
Author's Contributions
All authors contributed to the design of the study, reviewing, editing, and providing final approval of the manuscript. JC, AL, BF, LH, CW, and TD collected and analyzed the data, and JC, RS, TD, RD, JS, and CW interpreted the data.
Supporting information
Table S1. Effect of addition of TU/T/DMAU/DMA to serum or aqueous solution on measured T/DMA levels and impact of increasing concentrations of NaF.
Table S2. Effect of Serum and Plasma on T and DMA measurement by LC‐MS/MS.
Acknowledgements
The studies on TU and T were supported by a research grant from Clarus Therapeutics. The studies on DMAU and DMA were supported by Eunice Kennedy Shriver National Institute of Child Health and Development (NICHD) Contraceptive Clinical Trial Network Contract HHSN27520130024I Task Orders HHSN 27500001, 27500002, 27500006, and the UCLA Clinical and Translational Science Institute (UL1TR000124) at Harbor‐UCLA/LA BioMed. The technical assistance of Maria Lajoie, Vignesh Iyer, and Dennis Garcia and the Endocrine and Metabolic Research Laboratory at LA Biomed is gratefully acknowledged.
References
- Attardi BJ, Hild SA & Reel JR. (2006) Dimethandrolone undecanoate: a new potent orally active androgen with progestational activity. Endocrinology 147, 3016–3026. [DOI] [PubMed] [Google Scholar]
- Ayoub R, Page ST, Swerdloff RS, Liu PY, Amory JK, Leung A, Hull L, Blithe D, Christy A, Chao JH, Bremner W & Wang C. (2016) Comparison of the single‐dose pharmacokinetics, pharmacodynamics, and safety of two novel oral formulations of dimethandrolone undecanoate (DMAU): a potential oral, male contraceptive. Andrology 5, 278–285. [DOI] [PMC free article] [PubMed] [Google Scholar]
- Ayoub R, Page ST, Swerdloff RS, Liu PY, Amory JK, Leung A, Hull L, Blithe D , Christy A, Chao JH, Bremner WJ & Wang C. (2017) Comparison of the single dose pharmacokinetics, pharmacodynamics, and safety of two novel oral formulations of dimethandrolone undecanoate (DMAU): a potential oral, male contraceptive. Andrology 5, 278–285. [DOI] [PMC free article] [PubMed] [Google Scholar]
- Behre H. (2004) Pharmacology of testosterone preparations In: Testosterone, Action, Deficiency, Substitution (eds Nieschlag E. & Behre HM.), pp. 405–444. Cambridge University Press, Cambridge. [Google Scholar]
- Cohn PD, Emanuel PD & Bozdech MJ. (1987) Differences in nonspecific esterase from normal and leukemic monocytes. Blood 69, 1574–1579. [PubMed] [Google Scholar]
- Dufer J, Trentesaux C & Desplaces A. (1984) Differential effect of the serine protease inhibitor phenyl methyl sulfonyl fluoride on cytochemically detectable esterases in human leucocytes and platelets. Scand J Haematol 32, 25–32. [DOI] [PubMed] [Google Scholar]
- Ghasemi A & Zahediasl S. (2012) Normality tests for statistical analysis: a guide for non‐statisticians. Int J Endocrinol Metab 10, 486–489. [DOI] [PMC free article] [PubMed] [Google Scholar]
- Gooren LJ. (1994) A ten‐year safety study of the oral androgen testosterone undecanoate. J Androl 15, 212–215. [PubMed] [Google Scholar]
- Haugen DA & Suttie JW. (1974) Fluoride inhibition of rat liver microsomal esterases. J Biol Chem 249, 2723–2721. [PubMed] [Google Scholar]
- Huang MQ, Kang L, Wang W, Skee D, Chen M, Lin ZJ, Verhaeghe T & Weng N. (2016) UPLC‐MS/MS assay for the simultaneous determination of ethinyl estradiol, norgestimate and 17‐Desacetyl norgestimate at low pg/mL in human plasma. J Chromatogr B Analyt Technol Biomed Life Sci 1017–1018, 1–9. [DOI] [PubMed] [Google Scholar]
- Lachance S, Dhingra O, Bernstein J, Gagnon S, Savard C, Pelletier N, Boudreau N & Levesque A. (2015) Importance of measuring testosterone in enzyme‐inhibited plasma for oral testosterone undecanoate androgen replacement therapy clinical trials. Future Sci OA 1, FSO55. [DOI] [PMC free article] [PubMed] [Google Scholar]
- Matsumoto AM & Bremner WJ. (2004) Serum testosterone assays–accuracy matters. J Clin Endocrinol Metab 89, 520–524. [DOI] [PubMed] [Google Scholar]
- Morgentaler A, Dobs AS, Kaufman JM, Miner MM, Shabsigh R, Swerdloff RS & Wang C. (2008) Long acting testosterone undecanoate therapy in men with hypogonadism: results of a pharmacokinetic clinical study. J Urol 180, 2307–2313. [DOI] [PubMed] [Google Scholar]
- Rosner W, Auchus RJ, Azziz R, Sluss PM & Raff H. (2007) Position statement: utility, limitations, and pitfalls in measuring testosterone: an Endocrine Society position statement. J Clin Endocrinol Metab 92, 405–413. [DOI] [PubMed] [Google Scholar]
- Schubert M, Minnemann T, Hubler D, Rouskova D, Christoph A, Oettel M, Ernst M, Mellinger U, Krone W & Jockenhovel F. (2004) Intramuscular testosterone undecanoate: pharmacokinetic aspects of a novel testosterone formulation during long‐term treatment of men with hypogonadism. J Clin Endocrinol Metab 89, 5429–5434. [DOI] [PubMed] [Google Scholar]
- Schurmeyer T, Wickings EJ, Freischem CW & Nieschlag E. (1983) Saliva and serum testosterone following oral testosterone undecanoate administration in normal and hypogonadal men. Acta Endocrinol (Copenh) 102, 456–462. [DOI] [PubMed] [Google Scholar]
- Shiraishi S, Lee PW, Leung A, Goh VH, Swerdloff RS & Wang C. (2008) Simultaneous measurement of serum testosterone and dihydrotestosterone by liquid chromatography‐tandem mass spectrometry. Clin Chem 54, 1855–1863. [DOI] [PubMed] [Google Scholar]
- Skakkebaek NE, Bancroft J, Davidson DW & Warner P. (1981) Androgen replacement with oral testosterone undecanoate in hypogonadal men: a double blind controlled study. Clin Endocrinol (Oxf) 14, 49–61. [DOI] [PubMed] [Google Scholar]
- Surampudi P, Page ST, Swerdloff RS, Nya‐Ngatchou JJ, Liu PY, Amory JK, Leung A, Hull L, Blithe DL, Woo J, Bremner WJ & Wang C. (2014) Single, escalating dose pharmacokinetics, safety and food effects of a new oral androgen dimethandrolone undecanoate in man: a prototype oral male hormonal contraceptive. Andrology 2, 579–587. [DOI] [PMC free article] [PubMed] [Google Scholar]
- Taieb J, Mathian B, Millot F, Patricot MC, Mathieu E, Queyrel N, Lacroix I, Somma‐Delpero C & Boudou P. (2003) Testosterone measured by 10 immunoassays and by isotope‐dilution gas chromatography‐mass spectrometry in sera from 116 men, women, and children. Clin Chem 49, 1381–1395. [DOI] [PubMed] [Google Scholar]
- Vesper HW & Botelho JC (2010) Standardization of testosterone measurements in humans. J Steroid Biochem Mol Biol 121, 513–519. [DOI] [PubMed] [Google Scholar]
- Vesper HW & Thienpont LM. (2009) Traceability in laboratory medicine. Clin Chem 55, 1067–1075. [DOI] [PubMed] [Google Scholar]
- Vesper HW, Botelho JC, Shacklady C, Smith A & Myers GL. (2008) CDC project on standardizing steroid hormone measurements. Steroids 73, 1286–1292. [DOI] [PubMed] [Google Scholar]
- Wang C, Catlin DH, Demers LM, Starcevic B & Swerdloff RS. (2004) Measurement of total serum testosterone in adult men: comparison of current laboratory methods versus liquid chromatography‐tandem mass spectrometry. J Clin Endocrinol Metab 89, 534–543. [DOI] [PubMed] [Google Scholar]
- Wang C, Shiraishi S, Leung A, Baravarian S, Hull L, Goh V, Lee PW & Swerdloff RS. (2008) Validation of a testosterone and dihydrotestosterone liquid chromatography tandem mass spectrometry assay: interference and comparison with established methods. Steroids 73, 1345–1352. [DOI] [PMC free article] [PubMed] [Google Scholar]
- Wang C, Harnett M, Dobs AS & Swerdloff RS. (2010) Pharmacokinetics and safety of long‐acting testosterone undecanoate injections in hypogonadal men: an 84‐week phase III clinical trial. J Androl 31, 457–465. [DOI] [PubMed] [Google Scholar]
- Wang C, Shiraishi S, Leung A, Baravarian S, Hull L, Goh V, Lee PWN & Swerdloff RS. (2018) Corrigendum to “Validation of a testosterone and dihydrotestosterone liquid chromatography tandem mass spectrometry assay: interference and comparison with established methods” [Steroids Volume 73, Issue 13, 12 December 2008, Pages 1345–1352]. Steroids 135, 108. [DOI] [PMC free article] [PubMed] [Google Scholar]
- Williams FM. (1985) Clinical significance of esterases in man. Clin Pharmacokinet 10, 392–403. [DOI] [PubMed] [Google Scholar]
- Yin A, Alfadhli E, Htun M, Dudley R, Faulkner S, Hull L, Leung A, Bross R, Longstreth J, Swerdloff R & Wang C. (2012a) Dietary fat modulates the testosterone pharmacokinetics of a new self‐emulsifying formulation of oral testosterone undecanoate in hypogonadal men. J Androl 33, 1282–1290. [DOI] [PMC free article] [PubMed] [Google Scholar]
- Yin AY, Htun M, Swerdloff RS, Diaz‐Arjonilla M, Dudley RE, Faulkner S, Bross R, Leung A, Baravarian S, Hull L, Longstreth JA, Kulback S, Flippo G & Wang C. (2012b) Reexamination of pharmacokinetics of oral testosterone undecanoate in hypogonadal men with a new self‐emulsifying formulation. J Androl 33, 190–201. [DOI] [PMC free article] [PubMed] [Google Scholar]
- Yourno J. (1986) Monocyte nonspecific esterase: purification and subunit structure. Blood 68, 479–487. [PubMed] [Google Scholar]
Associated Data
This section collects any data citations, data availability statements, or supplementary materials included in this article.
Supplementary Materials
Table S1. Effect of addition of TU/T/DMAU/DMA to serum or aqueous solution on measured T/DMA levels and impact of increasing concentrations of NaF.
Table S2. Effect of Serum and Plasma on T and DMA measurement by LC‐MS/MS.