Abstract
Polychlorinated biphenyls (PCBs) are known human carcinogens that are byproducts of pigment manufacturing and found in colorants used to tint consumer paints sold in the United States and elsewhere. PCBs have the potential to be emitted from paint containing these pigments. To quantify the gas-phase emissions of ∑PCBs, we used polyurethane foam (PUF) to capture emissions from freshly applied colorants. Some PCB emissions were detected on the PUF after one day. After six weeks, all PCBs found in the colorant were also found on the PUF. Even the fully chlorinated PCB209 was emitted from green colorant. Mono- and dichlorinated PCBs were released from the colorant at a faster rate than the higher chlorinated congeners. By the end of the experiment all the lower chlorinated congeners were absent from the colorant while more than 75% of the higher chlorinated congeners remained in the sample. The rate of PCB emissions from paint colorants is a function of the surface/air equilibrium coefficient and the presence of water accelerates the emissions. Although concentrations of PCBs in colorants are less than 285 ng g−1, PCB emissions from colorants in paint can cause environmentally relevant concentrations of ≥500 pg m−3 within hours of painting a room.
Graphical Abstract
Introduction
Polychlorinated biphenyls (PCBs) found in ambient air in the United States originate from two categories of sources: Aroclor sources, which are ongoing emissions from the use and disposal of commercial mixtures of PCBs manufactured and sold from the 1920s through the 1970s; and non-Aroclor sources, whose unintentionally produced PCBs (UP-PCBs) come from inadvertent production during chemical manufacturing or other industrial activities.1–3 Aroclors were produced and distributed in large quantities. About 1.3 million tons of PCBs were produced as Aroclor mixtures making them the largest source of PCBs to the environment.4 Although Aroclors are no longer being produced or sold, Aroclor-containing products remain in use, including in electrical transformers, fluorescent light ballasts, sealants, and caulking.5 The production and release of UP-PCBs is unknown, although non-Aroclor sources, primarily from paint, add about 200 kg of PCBs to Chicago’s total stock of PCBs in sources each year.6
PCBs cause a variety of toxic responses in humans, animals, and plants. They are known group 1 human carcinogens and are potential neurotoxins and endocrine disrupters.7–10 They are implicated in the development of metabolic syndrome, attention deficit/hyperactivity disorder (ADHD), autism and other neurodevelopment disorders.11–14
The potential for human exposure to airborne PCBs is a relatively new realization. Historically, at the time of widespread use of Aroclors in middle part of the last century, PCBs were considered non-volatile. It is now clear that all PCBs are sufficiently volatile to be measured in the gas phase world-wide. The distribution of PCB congeners measured in air often exhibits strong resemblance to the distribution in original Aroclors but recent findings indicate that UP-PCBs are commonly present, particularly in indoor air.15,16 Inhalation may now be the dominant route of human exposure.15,17
UP-PCBs come from sources where PCBs are produced or introduced during chemical, industrial or manufacturing processes. PCB 11 (3,3’-dichlorobiphenyl) is an example of a UP-PCB congener that is commonly observed in the environment due to inadvertent chemical manufacturing processes. It is absent in most Aroclor mixtures and only 0.16% of the total PCBs in Aroclor 1221.18,19 PCB 11 was first reported in a water sample collected near the wastewater discharge of a paint and pigment manufacturing facility.20,21 PCB 11 was identified as a byproduct of 3,3’-dichlorobenzidine which is used in yellow pigments.22 Since then, PCB 11 has been found to be ubiquitous in air world-wide23–26 and found in various printed consumer goods.27 PCB 11 was found in Chicago air at high concentrations; it was the 5th most concentrated congener of all 209 potential congeners.23 The PCB profiles in various pigments were found to include more than 50 congeners including PCB 11. While the PCB congener concentrations varied between different colorants, PCB 11 was the most common congener detected.28
PCB 11 serves as a good indicator of paint sources, but it is not the only PCB found in paint pigments. Many PCB congeners are found in numerous pigments, including congeners that are also found in the commercial mixtures.3,15,16 For example, PCBs 1, 8, and 52 are found in pigments and in Aroclors and Clophen mixtures sold around the world.15,19 These PCBs are examples of congeners that have both Aroclor and non-Aroclor sources.18,28,29 Therefore PCBs 1, 8, and 52 can either be an intentionally produced or a UP-PCB and both can exist in the same environmental sample. Furthermore, the list of PCBs not found in the original Aroclor mixtures is fixed, but the list of UP-PCBs could include all 209 congeners. In addition to pigments, manufacturing of titanium dioxide, polymers, and silicon may also be sources of UP-PCBs.16,30,31
Some of the PCBs found in both pigments and commercial mixtures have been measured in school and residence air at concentrations higher than would be expected from Aroclor sources alone.15,16 We hypothesize that use of PCB-containing paint pigment is an important source of UP-PCB congeners in indoor environments. The same PCBs that have been found in colorants have been found in the air. It is unclear, however, if these PCBs volatilize from paint. To test this hypothesis, we conducted a series of emission studies to evaluate the rate and extent of PCB release from paint colorants. We evaluate the findings to determine the physical-chemical properties of the colorant that control the release of PCBs from this non-Aroclor source.
Materials
The experiments used colorants purchased at Diamond Vogel in Iowa City, Iowa in 2009 and 2018 (Table 1). A colorant is made up of one or more powder pigments mixed into a base and other proprietary materials. We only purchased colorants which were reported to contain synthetic organic pigments. Colorants are used in retail stores to provide customized paint colors when added to base paint. When mixed with water, we found the colorants to be fully miscible, deeply colored, and have a solid precipitate of the same color. We painted colorants on aluminum foil and pieces of drywall (Menards, Iowa City, IA) primed with white latex primer (ACE, 214A100 White, ACE Hardware, Iowa City, IA). We captured emissions using polyurethane foam (PUF) disks (Tisch Environmental, Cleves, OH, Part # TE-1014). We spiked colorant extracts, foil and PUF samples with 100 μL at 500 ng mL−1 (per congener) surrogate standard containing PCB 14 (3,5-dichlorobiphenyl), deuterated PCB 65 (2,3,5,6-tetrachlorobiphenyl), and PCB 166 (2,3,4,4’,5,6-hexachlorobiphenyl) and 25 μL at 1000 ng mL−1 (per congener) internal standard containing deuterated PCB 30 (2,4,6-trichlorobiphenyl) and PCB 204 (2,2’,3,4,4’,5,6,6’-octachlorobiphenyl). This mass is used for each sample and results in 50 ng of each surrogate PCBs and 25 ng of each of the PCBs used as internal standards. We quantified PCBs using a calibration standard (AccuStandard, New Haven, CT) containing all 209 PCBs (50 ng mL−1 of mono- through trichlorinated congeners, 100 ng mL−1 tetra- through heptachlorinated congeners, and 150 ng mL−1 octa- through decachlorinated congeners) and the surrogate and internal standards is used for quantification. Hexane, acetone, methanol, dichloromethane (DCM), sulfuric acid (H2SO4), potassium hydroxide (KOH), ethanol (EtOH), and silica gel (Fisher Chemical, LOT 179391) were used in the cleaning and extraction process of samples.
Table 1.
PCB congeners in colorants.
| Colorant Name | Color (CI Index)40 | Top 10 PCBs ranked highest to lowest mass | Concentration (ng ∑PCBs g−1 colorant) | Year Purchased |
|---|---|---|---|---|
| D | Phthalo Green (PG 7) | 209, 206, 6, 208, 207, 8, 12/13, 11, 198/199, 4 | 284 | 2018 |
| E | Phthalo Blue (PB 15:2) | 209, 26/29, 5, 12/13, 4, 206, 9, 3, 10, 175 | 0.69 | 2018 |
| AXX | Organic Yellow (Blend) | 8, 4, 6, 184, 182, 188, 17, 181, 209, 12/13 | 13.3 | 2018 |
| AGF | Organic Yellow (PY 97) | 52, 90/101/113, 92, 36, 38, 5, 79, 120, 127, 165 | 3.82 | 2018 |
| T | Medium Yellow (Blend) | 4, 11, 8, 6, 1, 209, 3, 10, 12/13, 5 | 3.01 | 2018 |
| ORF | Organic Orange (PO 73) | 3, 11, 15, 12/13, 8, 35, 4, 6, 5, 38 | 5.04 | 2018 |
| REE | Organic Red (PR 122) | 12/13, 15, 8, 31, 3, 6, 4, 25, 39, 146 | 11.7 | 2018 |
| DD | Maroon | 2, 1, 3, 146, 147/149, 153/168, 8, 118, 187, 6 | 9.82–16 | 2009 |
| VV | White | 25, 6, 133, 131, 146, 72, 94, 98, 142 | 0.03 | 2009 |
Methods
We conducted three types of laboratory experiments to explore PCB release from colorants and developed a computational model to interpret our results. The experiments included extraction of the PCB congeners from the colorants; and capture of PCB emissions from colorants applied to aluminum foil and drywall. The computational model (MATLAB R2015b) used these results to predict emissions of PCBs from paint to indoor air.
We measured the PCB congener concentrations in 9 colorants. Briefly, we weighed 1 to 2 g of colorant into a vial, spiked with surrogate standards, and vortexed with 5mL of hexane. This was repeated for triplicate measurements. The solvent layer was gently shaken with 2 mL of H2SO4 for 2 minutes and centrifuged. This was repeated and then 2 mL of 1:1 KOH and EtOH. The cleaning of the solvent layer was repeated and the combined concentrated solvent was eluted through silica and acidified silica gel.
We captured the diffusive emissions of PCB congeners from the colorants by brushing a 130 cm2 circle of colorant with a weighed mass of approximately 1 to 1.5 g to a surface and placing a polyurethane foam passive emission sampler (PUF-PES) directly over it. The PUF-PES design has been previously described.32–34 The PUF-PES consisted of a polyurethane foam (PUF) disc cleaned using pressured acetone and hexane solvent (Dionex ASE 350), dried, and inserted snuggly in clean glass Petri dishes (14 cm diameter, 2 cm depth). The depth of the dish allowed for an air gap between the PUF disc and the colorant. Gas-phase PCBs that volatilize from the colorants are captured by the PUF disc. The samplers were left over their surfaces for varying amounts of time ranging from 1 day to 6 weeks (Table SI1&SI2).
We applied the DD colorant and a PUF-PES sampler to 21 separate sheets of clean weighed aluminum foil. We applied the D colorant and a PUF-PES to 18 sheets. We removed the PUF-PES after 1 to 42 days at various time steps (Table S1&S2). At each time step, three pairs of foil and PUF samples were collected to produce triplicate measurements. The foil was weighed. Blank controls for each experiment consisted of PUF-PES placed over unpainted pieces of foil (n=17) and over foil painted with colorant VV (n=2) which contained low levels of PCBs (∑PCBs = 0.03 ng/g colorant applied). One unpainted foil and the associated PUF was collected at each time step. Foil painted with colorant VV and the associated PUF was collected at the end of the experiment. All foil and PUF samples were wrapped in aluminum foil, placed in Ziploc bags, and stored in a freezer. Foil and PUF samples were spiked with 100 μL surrogate standard solution prior to extraction. PUF was extracted with a pressurized and heated mixture of 1:1 acetone and hexane (Dionex ASE 350) as previously described.16 Aluminum foil was rinsed with acetone and processed using the method described above for colorants.
The additional colorants (AXX, E, T, REE, ORF, and AGF) were each applied to 3 pieces of foil each with a PUF-PES. Each foil and PUF pair was collected after 2 weeks except for colorant D which was collected after 6 weeks. Additional pieces of foil were painted with colorant VV and spiked with 0.5 mL of a PCB mixture consisting of one congener from each homolog group. These samples were covered with a PUF-PES for 5 weeks. The foil and PUF was extracted as above.
We applied colorant DD and a PUF-PES sampler to ten pieces of primed drywall the same way as the aluminum foil, although not in triplicate. The PUF-PES were removed from the drywall at time steps ranging from 1 to 21 days and the drywall was discarded. PUF-PES placed over two additional pieces of drywall were used as controls. One was painted with colorant VV. Another piece of drywall was not painted with any colorant.
The hexane extracts of the colorants, foil, and PUF samples were spiked with internal standards and analyzed using the internal standard method and a GC-MS/MS (Agilent 7890A GC system, Agilent 7000 Triple Quad, Agilent 7693 autosampler) in multiple-reaction monitoring (MRM) mode as described in the supporting information and elsewhere.16 We analyzed for all 209 PCB congeners, minus 3 unlabeled congeners used for surrogate and internal standards. Details of the instrumental method may be found in the supporting information and as described previously.15,16,35–38
Quality control and assurance protocols included collection of triplicate measurements of the PCB concentrations in the colorants and PCB emissions from colorant applied to foil. Each sample was spiked with 100 μL of surrogate standard solution at the start of the analytical process and then spiked with 25 μL internal standard solution before instrumental analysis. Surrogate recoveries ranged from 12 to 100% and used to correct for losses during sample processing. PCB 14 corrected the masses of the mono-, di-, and trichlorinated congeners, PCB D65 corrected the masses of the tetra- and pentachlorinated congeners, and PCB 166 corrected the masses of the hexa-, hepta-, octa-, nona-, and decachlorinated congeners. Background laboratory air was monitored using a polyurethane foam passive air sampler and exhibited a distinct signal of Aroclor 1254, which was not observed in any emission or colorant measurements. Blanks consisted of clean unpainted aluminum foil, PUF-PES samples placed over clean unpainted aluminum foil, and PUF-PES samples placed over drywall painted with white primer. A limit of quantification (LOQ) was calculated as the mean plus two standard deviations of every congener detected in the PUF placed for 1 to 42 days over unpainted foil blanks (n = 17). Congener masses below LOQ are reported as 0. LOQ values ranged between 0 and 0.79 ng per congener (Table SI3).
Results
PCB Concentration in Colorants
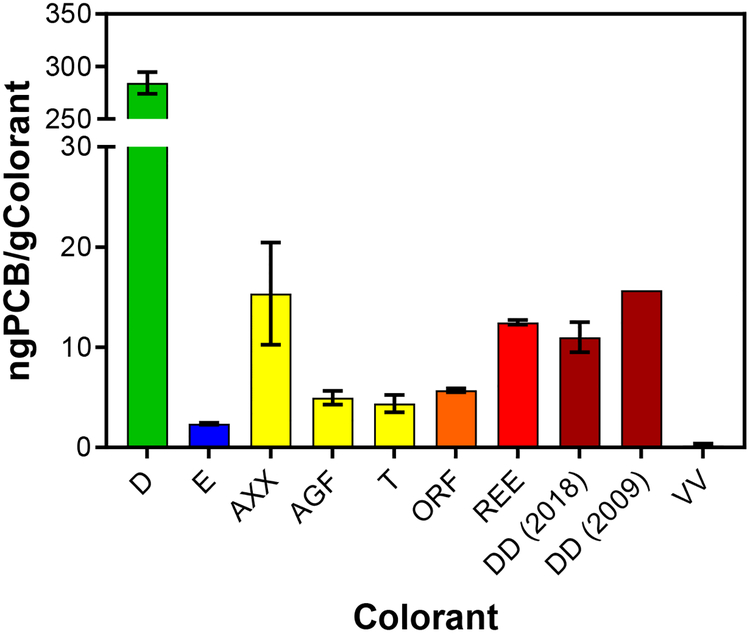
PCBs were found in all colorants we purchased (Figure 1, 2, SI1, and Table SI4). Different colorants have different concentrations and profiles of PCBs, including colorants that are similar in appearance. The congeners found in colorant DD are the same congeners that Hu et al (2009) found to dominate colorant DD in their analysis except for PCB 161 (2,3,3’,4,5’,6-hexachlorobiphenyl) which was found to be 3 orders of magnitude smaller in this study (1.79 and 0.0025 ng g−1, respectively). The concentration of ∑PCBs in colorant DD was 11 ± 1.5 ng g−1 colorant. PCBs in the colorant are volatile and the concentration changed over time and with handling of the material. In 2009, the concentration of ΣPCBs was 15.7 ng g−1.28
Figure 1.
Concentration of PCBs found in colorants. The color of the bar indicates the color we observed when extracting each colorant. AXX, T, and AGF are all yellow. Error bars are one standard deviation from the average. No standard deviation was reported for DD in 2009.28
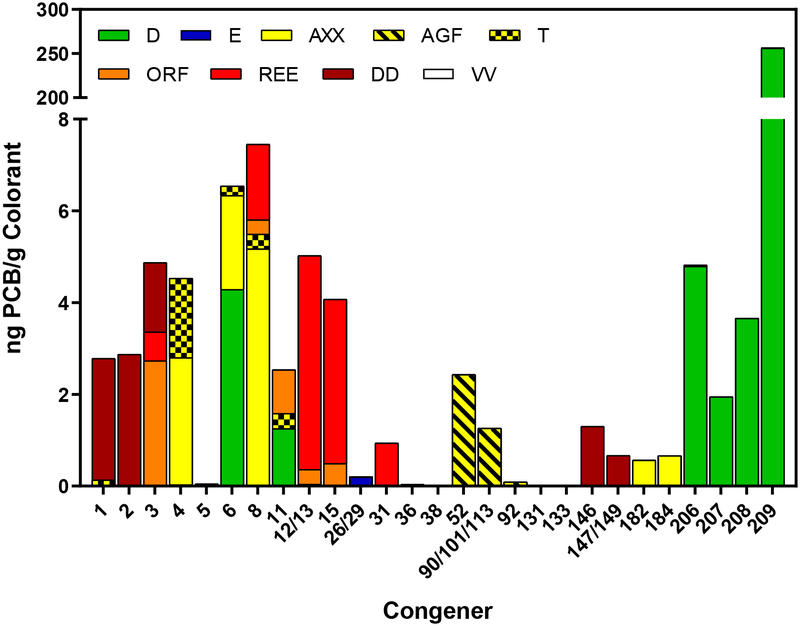
Figure 2.
Concentration of top 5 PCB congeners in colorants. The color of the bar indicates the color we observed when extracting each colorant. AXX, T, and AGF are all yellow. Although above the LOQ, the concentration of some congeners are too small to be seen.
In our study the most frequent congeners detected were PCBs 3, 5, and 12/13 (7 colorants) followed by PCBs 4, 6, 8, 9, and 79 (6 colorants each) (Table 1). The most common congener found in the top ten PCBs of each colorant was PCB 4, 6, 8, and 12/13 (6 colorants). Previous studies found that the most common congener was PCB 11.28,29 Some PCBs found in the colorants measured in this experiment matched colorants measured in other experiments. AXX is similar to 96–7G and Y1 measured by Hu and Hornbuckle.28 Also, REE is similar to Hu’s R4 and PR 254, reported by Anezaki et al.29 Anezaki measured the PCB content in pigments directly. PR 254 and other labels for pigments in Anezaki’s study are the color code used to identify the pigments. REE is a colorant reported to contain the pigment PR 254 demonstrating that the same colored pigments, purchased in different countries, may contain the same PCBs.
PCB 11 concentrations are much lower than previously reported, even for the same tint color. For example, Anazaki found PCB 11 to exceed 700,000 ng g−1 in a yellow colored pigment. Hu found PCB 11 to be the dominant congener in yellow and red colorants. Interestingly, our yellow colorant AXX and Hu’s yellow colorants Y1, 96–26Z, 96–7G, and TT all contain PCBs 4, 6, and 8 in their top 4 highest mass PCBs. However, Hu’s colorants also contained PCB 11 in the top 4, with PCB 11 being the highest mass congener in 2 of them. PCB 11 does not even enter the top 10 highest mass congener in AXX. Considering PCB 11 was such a dominant congener in Hu’s colorants and had the highest concentration of any congener reported by Anezaki, it is surprising we do not see it in the top 10 highest mass PCBs in any of our yellow or red colorants besides T (0.33 ng g−1). We do see PCB 11 in ORF, an orange colorant, which is made from PO 73, a diketopyrrolo-pyrrole (DPP) pigment.39 Anezaki reported PCB 11 in all of his orange pigments but none of them are PO 73. Many of the yellow and orange pigments are either azo or dairylide pigments.
Colorant D had the highest concentration of PCBs of any colorant we measured with a concentration of 280 ± 10 ng g−1 colorant. The largest contribution to this was PCB 209 with a concentration of 256 ± 9 ng g−1. Hu et al and Anezaki et al also measured high concentration of PCBs in their green colorants and pigments with PCB 209 having the highest concentration (59.36 to 100.47 ng g−1 colorant, and 160 to 2300 ng g−1 pigment). The pigment Anezaki measured was PG7, the same pigment used in D, but they did not report many of the lower chlorinated congeners we have found.
Colorant VV was found to have a small concentration of PCBs, 0.2 ± 0.2 ng g−1 colorant. Therefore, we used Colorant VV as a negative control to extraction and emission experiments.
PCB Emissions from Colorants
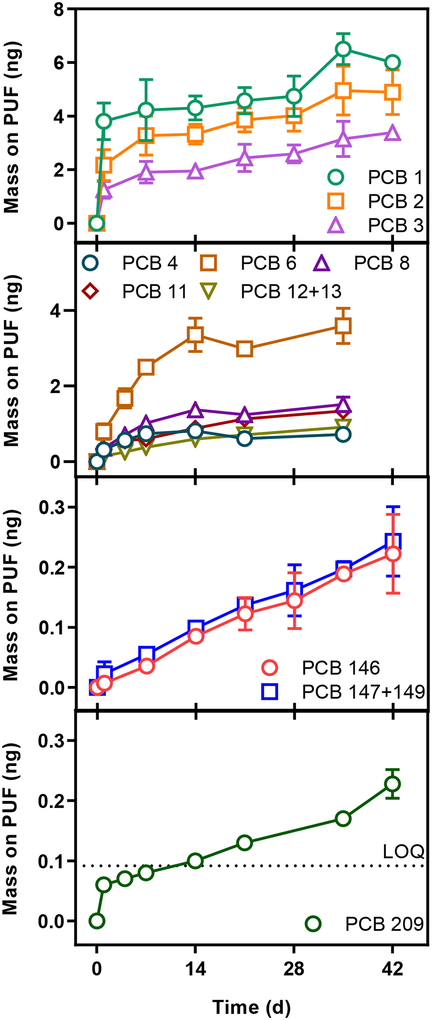
We measured the emissions of PCBs from colorant DD and D using the PUF-PES method over 6 weeks. The mass of most congeners accumulating in the PUF increased with time (Figure 3 and Table SI5&SI6). After 1 day 9 ± 3 ng or 600 ± 200 ng m−2 d−1 of ∑PCBs were emitted from colorant DD. By the end of the experiment (42 days) 18.4 ± 1.0 ng ∑PCBs had accumulated (28 ± 5 ng m−2 d−1). We measured the emissions of PCBs from colorants E, AXX, AGF, T, ORF, and REE after only one 14-day time step, to confirm that the congeners in all tested colorants were available for gas-phase emission (Table SI7).
Figure 3.
Average mono-, di-, hexa- and decachlorobiphenyl mass emitted from Colorant DD and colorant D and captured by the PUF-PES. Error bars are one standard deviation from the average. Error bars not shown on data points are smaller than the marker.
The emission rates change as PCBs are depleted from the colorant. The lower chlorinated congeners (PCBs 1, 2, and 3) were released at a faster rate (~260 ng m−2 day−1 for PCB 1) than the higher chlorinated congeners (~0.5 ng m−2 day−1 for PCB 146) from the same painted area (0.0153 m2) after the first day. The same trend was observed for the PCBs spiked on colorant VV. By the end of the experiment the emission rates were greatly reduced for the lower chlorinated congeners (~9.5 ng m−2 day−1 for PCB 1, 96% decrease) but not so much for the higher chlorinated congeners (~0.35 ng m−2 day−1 for PCB 146, 30% decrease). The change in emission rates is due, in part, to depletion of PCBs from the colorant. About 50% of the lower chlorinated congeners were emitted in the first day and were almost completely depleted from the painted foil (<4% mass PCBs 1, 2, and 3 remaining) at the end of the experiment. More than 75% of the higher chlorinated congener mass remained in the colorant after 42 days.
Notably, we were also able to measure the volatilization of PCB 209, the fully chlorinated congener, from our emission experiment with colorant D (Figure 3). PCB 209 has the highest concentration of any congener in any colorant we measured (256 ± 9 ng g−1). The final mass accumulated on the PUF was larger than our LOQ but less than 0.1% of that applied to the foil (0.23 ± 0.02 ng).
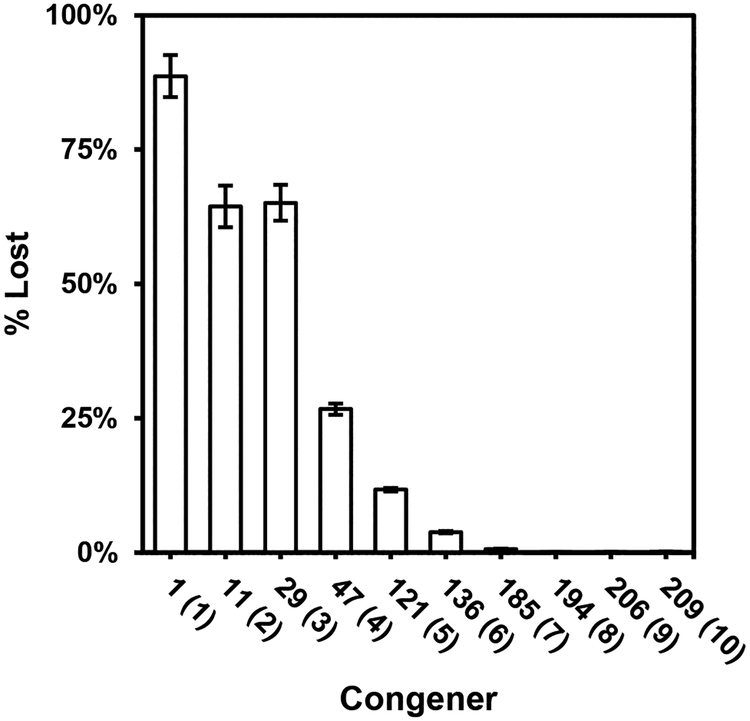
We measured the emissions of 10 PCB congeners spiked on foil painted with colorant VV to confirm the emission rate trends (Figure 4). After 5 weeks, more than 88% of the monochlorinated congener was emitted from the foil and captured on the PUF-PES. The fraction of the applied PCBs emitted decreased with chlorine number to 0.06% of the fully chlorinated PCB209. We conclude that emissions of PCBs from colorant applied to foil is a reproducible function of PCB congener properties, including chlorine number. No PCBs accumulated in PUF-PES placed over blank foil or colorant VV.
Figure 4.
The percentage of congeners lost between spiking colorant VV with the homolog mixture and removing the PUF-PES 5 weeks later. The homolog mixture contains one congener from each homolog.
We hypothesized that the PCBs would also be emitted from environmentally relevant surfaces. We applied colorant DD to primed drywall and after 21 days found PCB emissions, dominated by monochlorinated biphenyls (PCBs 1, 2, and 3), to accumulate on PUF-PES over time (Figure SI2). The total emission from DD applied to drywall resulted in an emission of 4.8 ng ∑PCBs after 21 days. After one day, the emission rate was 48 ng m−2 day−1 and 6.1 ng m−2 day−1 overall for PCB 1. The initial emissions rate of PCB 1 is much lower for drywall than for foil. Emissions of PCB 1 from drywall did not decrease as much as emissions from foil from 1 to 21 days. Slower emissions may be due to PCBs diffusing into the drywall where they might not diffuse into the foil. We conclude that emissions of PCBs associated with paint colorant are available for emission under realistic conditions, including after application indoors.
Discussion
Predicting Emission of PCBs from Paint
The governing mass balance equations that describe the mass transfer of PCBs from the colorant to the air, and from the air to the PUF include Eq. 1 (the change in the mass of PCBs in the colorant), Eq. 2 (the change in the mass of PCBs in the air gap), and Eq. 3 (the change in the mass of PCBs in the PUF):
| (1) |
| (2) |
| (3) |
where Mcol, MAir, and MPUF are the masses of PCBs in the colorant, air, and PUF (ng) respectively, A is the area of the colorant (m2), kOL,Col and kOL,PUF are the overall gas-phase mass transfer coefficients of PCBs in the colorant and the PUF respectively (m hr−1), KCol/Air and KPUF/Air are the colorant-air and the PUF-air partitioning coefficients (dimensionless), and CCol, CAir, and CPUF and the concentrations of PCBs in the colorant, air, and PUF (ng m−3).41 The coefficients in these equations that vary between different PCB congeners are mass transfer and the equilibrium coefficients (Table SI8&9). Of the two, the equilibrium coefficient has the greatest predicted impact on PCB emission rates: there are several orders of magnitude difference between the lowest and highest chlorinated congeners.
Diffusion of PCB congeners within a layer of paint (or in our case, colorant) can be described as the mass transfer between a series of homogeneous layers by using a modified state-space (MSS) model.41 The mass transfer of a PCB between each slice and into the air is controlled by diffusion within the slices and across each interface. The modified state-space model was used to model the release of PCBs from the colorant and into the PUF in the PUF-PES. The mass balances equations for each slice and the air make a system of ordinary differential equations that were all solved using MatLab. The PUF acts as a diffusional sink and can be modeled the same way as the source except the initial concentration is 0 and different parameter values are used. The model was run for the PCBs detected in our experiment and predicts the mass of PCBs in the colorant to decrease over time while the mass in the PUF increases. Additional equations are provided in the SI.
The model correctly predicted that initial emissions (ng d−1) are highest for the lower chlorinated congeners, and all congeners are partially emitted within 35 days (Figure SI6). However, the model consistently under-predicted emissions for most congeners. Our experiments found emissions of mono- and dichlorinated PCBs to be up to 5 times higher than the model predicts.
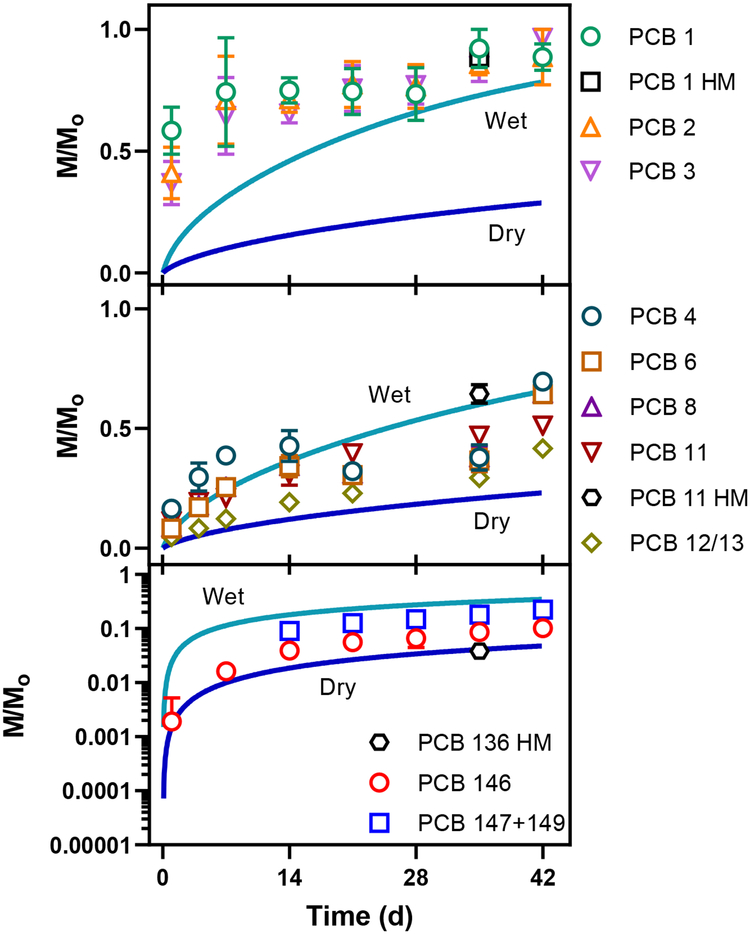
The water content of the colorants may explain why the model under-predicted PCB emissions. The colorants are fully miscible in water and application to the foil resulted in a moist surface that dried over time (Figure SI3&SI4). On average, the colorants lost 0.33 grams water per gram colorant applied in our foil experiments. During our study of colorants applied to foil, we found ~ 60% lost in the first day, 70% in the first week, and 100% of the water was gone by the 5th week. To investigate the effect of water on PCB emissions, we replaced the colorant/air equilibrium coefficients, KCol/Air, with the congener-specific water/air equilibrium constants (Henry’s constants).42 Treating the colorant as ‘wet’ resulted in higher predicted emissions of PCBs, although the model still does not predict the rapid release of the monochlorinated congeners within the first day of exposure (Figure 5, SI7&SI8). We conclude that in addition to PCB concentration, the physical-chemical properties of the congeners and the water content of applied paint all affect the rate and cumulative magnitude of PCB emissions from newly painted surfaces. Our model indicates that the presence of water greatly accelerates the emissions of PCBs.
Figure 5.
Measured (symbols) and predicted (lines) mass of monochlorobiphenyls (top plot), dichlorobiphenyls (middle), and hexachlorobiphenyls (bottom) emitted from colorants. The mass emitted (and accumulated on the PUF) is normalized to the amount applied to the foil (M/M0) and are the mean of 3 values. The lines are the predicted emissions assuming the colorant is wet (top line in each plot) or dry (lower line). Points labeled ‘HM’ reflect the emissions off the homolog mixture spiked onto colorant VV.
Predicting Room Concentration
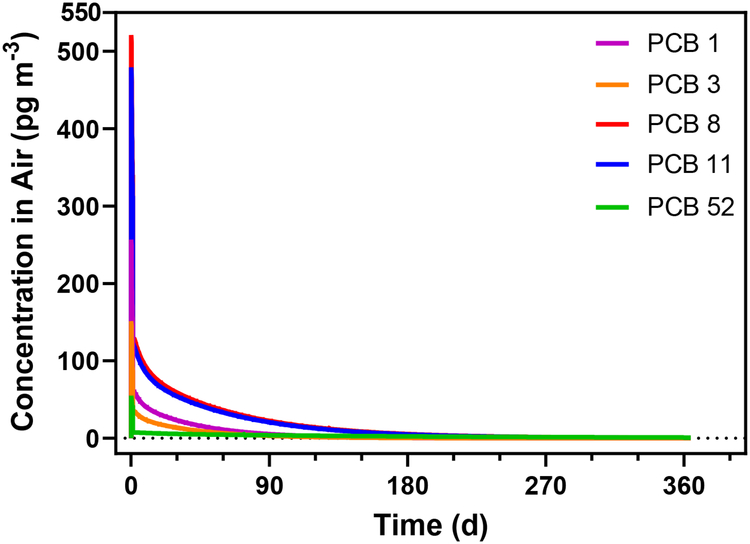
Air flow velocity, temperature, and ventilation are environmental conditions that may affect the rate and cumulative magnitude of PCB emissions from newly painted surfaces. To predict the concentration of PCBs in a room due to emissions from colorants used in paint applied to indoor walls, we applied the same model with some modifications. We assumed a 10 × 10 × 5 (m3) room initially has PCB-free air and is also ventilated with PCB-free air. At time = 0 four walls of the room are painted with a paint containing 14 oz colorant per gallon of paint. We assumed the paint was applied wet and Henry’s Law governed the air/paint equilibrium for the first 24 hours. We modified the mass transfer coefficient to reflect air flow in a typical room.43 Other parameters used can be found in Table SI10. The model then predicts the concentration of each PCB in the air due to its emissions from the paint on the walls over time (Figure 6).
Figure 6.
The predicted concentrations of PCBs 1, 3, 8, 11, and 52 in a freshly painted room over one year.
For the congeners shown in Figure 6, the maximum concentration in the room was reached 3 hours after painting, except for PCB 52 which reached its max one hour after painting. The concentrations declined to <1 pg m−3 by the end of the 365 day simulation. The emissions of PCB 1 were 12 ng m−2 day−1 for the first day. Because we assumed dilution with water-based paint, this is less than the emission rates of PCB 1 for the first day from the colorant painted on both the foil (~260 ng m−2 day−1) and the drywall (48 ng m−2 day−1) found experimentally.
Indoor air flow velocities range from 0.25 to 0.45 m s−1 with the highest flow next to the wall and close to the ventilation diffuser.43 Our model predicts an increase in max room concentration when going from the lower to higher wind speed for the first 37 days after which room concentrations are higher for the lower wind speed. Ventilation in a room is also variable in realistic conditions and HVAC systems may be turned off at night. Decreasing the ventilation rate by half resulted in ~40% increased max concentrations.
Our study confirms PCBs volatilize from colorants and are measurable sources of PCBs to indoor and outdoor environments. Our study shows that all PCB congeners in applied paint are available for volatilization. This has particular concern for surfaces and materials where airborne PCBs deposit– including fish, soils, and surface waters. Continued use of paint slows the long-term rate of natural attenuation and may be the cause of continued accumulation of PCBs in polar mammals and aquatic food chains. The rate of release, however, is much faster for the lower molecular weight congeners and their concentrations reach levels in indoor air that may pose risk to humans through inhalation exposure.
Supplementary Material
Acknowledgements
The authors wish to thank the Superfund Research Program of the National Institute of Environmental Health Sciences (Grant No. NIH P42ES013661) for funding; Dr. Rachel Marek for assistance in method development; Deb Willard for assistance with instruments; and Dr. Andres Martinez for advice on model parametrization. The content is solely the responsibility of the authors and does not necessarily represent the official views of the National Institutes of Health.
Footnotes
Supporting Information
The Supporting information contains instrument parameters, quality assurance and quality control data, congener-specific data results, and modeling details.
The authors declare no competing financial interest.
References
- (1).Erickson MD; Kaley RG Applications of Polychlorinated Biphenyls. Environ. Sci. Pollut. Res 2011, 18 (2), 135–151. [DOI] [PubMed] [Google Scholar]
- (2).Cui S; Qi H; Liu L-Y; Song W-W; Ma W-L; Jia H-L; Ding Y-S; Li Y-F Emission of Unintentionally Produced Polychlorinated Biphenyls (UP-PCBs) in China: Has This Become the Major Source of PCBs in Chinese Air? Atmos. Environ 2013, 67, 73–79. [Google Scholar]
- (3).Bartlett PW; Isaksson E; Hermanson MH “New” Unintentionally Produced PCBs in the Arctic. Emerg. Contam 2019, 5, 9–14. [Google Scholar]
- (4).Breivik K; Sweetman A; Pacyna JM; Jones KC Towards a Global Historical Emission Inventory for Selected PCB Congeners — a Mass Balance Approach: 1. Global Production and Consumption. Sci. Total Environ 2002, 290 (1–3), 181–198. [DOI] [PubMed] [Google Scholar]
- (5).Lehmann GM; Christensen K; Maddaloni M; Phillips LJ Evaluating Health Risks from Inhaled Polychlorinated Biphenyls: Research Needs for Addressing Uncertainty. Environ. Health Perspect 2015, 123 (2), 109–113. [DOI] [PMC free article] [PubMed] [Google Scholar]
- (6).Shanahan CE; Spak SN; Martinez A; Hornbuckle KC Inventory of PCBs in Chicago and Opportunities for Reduction in Airborne Emissions and Human Exposure. Environ. Sci. Technol 2015, 49 (23), 13878–13888. [DOI] [PMC free article] [PubMed] [Google Scholar]
- (7).IARC, (International Agency for Research on Cancer). POLYCHLORINATED BIPHENYLS AND POLYBROMINATED BIPHENYLS/IARC Working Group on the Evaluation of Carcinogenic Risks to Humans; 2013. [Google Scholar]
- (8).Lauby-Secretan B; Loomis D; Baan R; El Ghissassi F; Bouvard V; Benbrahim-Tallaa L; Guha N; Grosse Y; Straif K Use of Mechanistic Data in the IARC Evaluations of the Carcinogenicity of Polychlorinated Biphenyls and Related Compounds. Environ. Sci. Pollut. Res 2016, 23 (3), 2220–2229. [DOI] [PubMed] [Google Scholar]
- (9).Brouwer A; Longnecker MP; Birnbaum LS; Cogliano J; Kostyniak P; Moore J; Schantz S; Winneke G Characterization of Potential Endocrine-Related Health Effects at Low-Dose Levels of Exposure to PCBs. -Environ Heal. Perspect 1999, 1, 7639–7649. [DOI] [PMC free article] [PubMed] [Google Scholar]
- (10).Longnecker MP; Rogan WJ; Lucier G THE HUMAN HEALTH EFFECTS OF DDT (DICHLORODIPHENYL-TRICHLOROETHANE) AND PCBS (POLYCHLORINATED BIPHENYLS) AND AN OVERVIEW OF ORGANOCHLORINES IN PUBLIC HEALTH *. Annu. Rev. Public Heal 1997, 18, 211–244. [DOI] [PubMed] [Google Scholar]
- (11).Lee D-H; Lee I-K; Porta M; Steffes M; Jacobs DR Relationship between Serum Concentrations of Persistent Organic Pollutants and the Prevalence of Metabolic Syndrome among Non-Diabetic Adults: Results from the National Health and Nutrition Examination Survey 1999–2002. Diabetologia 2007, 50 (9), 1841–1851. [DOI] [PubMed] [Google Scholar]
- (12).Eubig PA; Aguiar A; Schantz SL Lead and PCBs as Risk Factors for Attention Deficit/hyperactivity Disorder. Environ. Health Perspect 2010, 118 (12), 1654–1667. [DOI] [PMC free article] [PubMed] [Google Scholar]
- (13).Mitchell MM; Woods R; Chi L-H; Schmidt RJ; Pessah IN; Kostyniak PJ; LaSalle JM Levels of Select PCB and PBDE Congeners in Human Postmortem Brain Reveal Possible Environmental Involvement in 15q11-q13 Duplication Autism Spectrum Disorder. Environ. Mol. Mutagen 2012, 53 (8), 589–598. [DOI] [PMC free article] [PubMed] [Google Scholar]
- (14).Grandjean P; Landrigan P Developmental Neurotoxicity of Industrial Chemicals. Lancet 2006, 368 (9553), 2167–2178. [DOI] [PubMed] [Google Scholar]
- (15).Marek RF; Thorne PS; Herkert NJ; Awad AM; Hornbuckle KC Airborne PCBs and OH-PCBs Inside and Outside Urban and Rural U.S. Schools. Environ. Sci. Technol 2017, 51 (14), 7853–7860. [DOI] [PMC free article] [PubMed] [Google Scholar]
- (16).Herkert NJ; Jahnke JC; Hornbuckle KC Emissions of Tetrachlorobiphenyls (PCBs 47, 51, and 68) from Polymer Resin on Kitchen Cabinets as a Non-Aroclor Source to Residential Air. Environ. Sci. Technol 2018, 52 (9). [DOI] [PMC free article] [PubMed] [Google Scholar]
- (17).Ampleman MD; Martinez A; DeWall J; Rawn DFK; Hornbuckle KC; Thorne PS Inhalation and Dietary Exposure to PCBs in Urban and Rural Cohorts via Congener-Specific Measurements. Environ. Sci. Technol 2015, 49 (2), 1156–1164. [DOI] [PMC free article] [PubMed] [Google Scholar]
- (18).Frame GM; Cochran JW; Bøwadt SS Complete PCB Congener Distributions for 17 Aroclor Mixtures Determined by 3 HRGC Systems Optimized for Comprehensive, Quantitative, Congener-Specific Analysis. J. High Resolut. Chromatogr 1996, 19 (12), 657–668. [Google Scholar]
- (19).Schulz DE; Petrlck G; Dulnker JC Complete Characterization of Polychlorinated Biphenyl Congeners in Commercial Aroclor and Clophen Mixtures by Multldimenslonal Gas Chromatography-Electron Capture Detection. Environ. Sci. Technol 1989, 23, 852–859. [Google Scholar]
- (20).Litten S; Fowler B; Luszniak D Identification of a Novel PCB Source through Analysis of 209 PCB Congeners by US EPA Modified Method 1668. Chemosphere 2002, 46 (9–10), 1457–1459. [DOI] [PubMed] [Google Scholar]
- (21).King TL; Yeats P; Hellou J; Niven S Tracing the Source of 3,3′-Dichlorobiphenyl Found in Samples Collected in and around Halifax Harbour. Mar. Pollut. Bull 2002, 44 (7), 590–596. [DOI] [PubMed] [Google Scholar]
- (22).Inc srico Y; Chandra Rastogi S Investigation of Isomer Specific Polychlorinated Biphenyls in Printing Inks. Bull. Environ. Contam. Toxicol 1992, 48 (9), 567–571. [DOI] [PubMed] [Google Scholar]
- (23).Hu D; Martinez A; Hornbuckle KC Discovery of Non-Aroclor PCB (3,3′-Dichlorobiphenyl) in Chicago Air. Environ. Sci. Technol 2008, 42 (21), 7873–7877. [DOI] [PMC free article] [PubMed] [Google Scholar]
- (24).Rodenburg LA; Guo J; Du S; Cavallo GJ Evidence for Unique and Ubiquitous Environmental Sources of 3,3′-Dichlorobiphenyl (PCB 11). Environ. Sci. Technol 2010, 44 (8), 2816–2821. [DOI] [PubMed] [Google Scholar]
- (25).Du S; Wall SJ; Cacia D; Rodenburg LA Passive Air Sampling for Polychlorinated Biphenyls in the Philadelphia Metropolitan Area. Environ. Sci. Technol 2009, 43 (5), 1287–1292. [DOI] [PubMed] [Google Scholar]
- (26).Basu I; Arnold KA; Venier M; Hites RA Partial Pressures of PCB-11 in Air from Several Great Lakes Sites. Environ. Sci. Technol 2009, 43 (17), 6488–6492. [DOI] [PubMed] [Google Scholar]
- (27).Guo J; Capozzi SL; Kraeutler TM; Rodenburg LA Global Distribution and Local Impacts of Inadvertently Generated Polychlorinated Biphenyls in Pigments. Environ. Sci. Technol 2014, 48 (15), 8573–8580. [DOI] [PubMed] [Google Scholar]
- (28).Hu D; Hornbuckle KC Inadvertent Polychlorinated Biphenyls in Commercial Paint Pigments †. Environ. Sci. Technol 2010, 44 (8), 2822–2827. [DOI] [PMC free article] [PubMed] [Google Scholar]
- (29).Anezaki K; Nakano T Concentration Levels and Congener Profiles of Polychlorinated Biphenyls, Pentachlorobenzene, and Hexachlorobenzene in Commercial Pigments. Environ. Sci. Pollut. Res 2014, 21 (2), 998–1009. [DOI] [PubMed] [Google Scholar]
- (30).Rowe AA; Totten LA; Xie M; Fikslin TJ; Eisenreich SJ Air−Water Exchange of Polychlorinated Biphenyls in the Delaware River 2007. [DOI] [PubMed]
- (31).Anezaki K; Nakano T Unintentional PCB in Chlorophenylsilanes as a Source of Contamination in Environmental Samples. J. Hazard. Mater 2015, 287, 111–117. [DOI] [PubMed] [Google Scholar]
- (32).Fujii M; Shinohara N; Lim A; Otake T; Kumagai K; Yanagisawa Y A Study on Emission of Phthalate Esters from Plastic Materials Using a Passive Flux Sampler. Atmos. Environ 2003, 37 (39–40), 5495–5504. [Google Scholar]
- (33).Ni Y; Kumagai K; Yanagisawa Y Measuring Emissions of Organophosphate Flame Retardants Using a Passive Flux Sampler. Atmos. Environ 2007, 41 (15), 3235–3240. [Google Scholar]
- (34).Shinohara N; Fujii M; Yamasaki A; Yanagisawa Y Passive Flux Sampler for Measurement of Formaldehyde Emission Rates. Atmos. Environ 2007, 41 (19), 4018–4028. [Google Scholar]
- (35).Martinez A; Hadnott BN; Awad AM; Herkert NJ; Tomsho K; Basra K; Scammell MK; Heiger-Bernays W; Hornbuckle KC Release of Airborne Polychlorinated Biphenyls from New Bedford Harbor Results in Elevated Concentrations in the Surrounding Air. Environ. Sci. Technol. Lett 2017, 4 (4), 127–131. [DOI] [PMC free article] [PubMed] [Google Scholar]
- (36).Herkert NJ; Martinez A; Hornbuckle KC A Model Using Local Weather Data to Determine the Effective Sampling Volume for PCB Congeners Collected on Passive Air Samplers. Environ. Sci. Technol 2016, 50 (13), 6690–6697. [DOI] [PMC free article] [PubMed] [Google Scholar]
- (37).Martinez A; Norström K; Wang K; Hornbuckle KC Polychlorinated Biphenyls in the Surficial Sediment of Indiana Harbor and Ship Canal, Lake Michigan. Environ. Int 2010, 36 (8), 849–854. [DOI] [PMC free article] [PubMed] [Google Scholar]
- (38).Hu D; Lehmler H-J; Martinez A; Wang K; Hornbuckle KC Atmospheric PCB Congeners across Chicago. Atmos. Environ 2010, 44 (12), 1550–1557. [DOI] [PMC free article] [PubMed] [Google Scholar]
- (39).Herbst W; Hunger K Industrial Organic Pigments - Production, Properties, Applications, 3rd ed.; Wiley-VCH: Darmstadt, Germany, 2004. [Google Scholar]
- (40).Chromaflo Technologies. COLORTREND ® 808 Low-VOC* Colorants Technical Data Sheet; 2015. [Google Scholar]
- (41).Guo Z A Framework for Modelling Non-Steady-State Concentrations of Semivolatile Organic Compounds Indoors – I: Emissions from Diffusional Sources and Sorption by Interior Surfaces. Indoor Built Environ 2013, 22 (4), 685–700. [Google Scholar]
- (42).Dunnlvant FM; Elzerman AW; Jurs PC; Hasan MN Quantitative Structure-Property Relationships for Aqueous Solubilities and Henry’s Law Constants of Polychlorinated Biphenyls. Environ. Sci. Technol 1992, 26, 1567–1573. [Google Scholar]
- (43).Herkert NJ; Hornbuckle KC Effects of Room Airflow on Accurate Determination of PUF-PAS Sampling Rates in the Indoor Environment. Environ. Sci. Process. Impacts 2018, 20 (5), 757–766. [DOI] [PMC free article] [PubMed] [Google Scholar]
Associated Data
This section collects any data citations, data availability statements, or supplementary materials included in this article.


