This article reports gene copy number alterations that could aid in selecting either FOLFOX or FOLFIRI in combination with bevacizumab for patients with metastatic colorectal cancer.
Keywords: Irinotecan, Oxaliplatin, Bevacizumab, Colorectal cancer, aCGH analysis
Abstract
Background.
The randomized phase III study (WJOG4407G) showed equivalent efficacy between FOLFOX and FOLFIRI in combination with bevacizumab as the first‐line treatment for metastatic colorectal cancer (mCRC). We studied whole genome copy number profiles using array‐based comparative genomic hybridization (aCGH) analysis of tumor tissue samples obtained in this study. The aim of this study was to identify gene copy number alterations that could aid in selecting either FOLFOX or FOLFIRI in combination with bevacizumab for patients with mCRC.
Materials and Methods.
DNA was purified from 154 pretreatment formalin‐fixed paraffin‐embedded tissue samples (75 from the FOLFOX arm and 79 from the FOLFIRI arm) of 395 patients enrolled in the WJOG4407G trial and analyzed by aCGH. Genomic regions greater than 1.2‐fold were regarded as copy number gain (CNG).
Results.
Patient characteristics between the treatment arms were well balanced except for tumor laterality (left side; 64% in FOLFOX arm and 80% in FOLFIRI arm, p = .07). FOLFIRI showed a trend toward better response rate (RR), progression‐free survival (PFS) and overall survival (OS) than FOLFOX in the patients with CNG of chromosome 8q24.1 (Fisher's exact test, p = .134 for RR; interaction test, p = .102 for PFS and p = .003 for OS) and 8q24.2 (Fisher's exact test, p = .179 for RR; interaction test, p = .144 for PFS and p = .002 for OS).
Conclusion.
Chromosome 8q24.1–q24.2 may contain genes that could potentially serve as predictive markers for selecting either FOLFOX or FOLFIRI in combination with bevacizumab for treatment of patients with mCRC.
Implications for Practice.
Bevacizumab has been used as a standard first‐line treatment for patients with metastatic colorectal cancer (mCRC) in combination with either oxaliplatin‐based or irinotecan‐based chemotherapy. Until now, there has been no predictive marker to choose between the two combination chemotherapies. This array‐based comparative genomic hybridization analysis revealed that the difference in therapeutic effect between the two combination chemotherapies is prominent in patients with mCRC with gene copy number gain in chromosome 8p24.1–p24.2. Such patients showed more favorable response and survival when treated with irinotecan‐based combination chemotherapy. Overlapping genes commonly found in this region may be predictive biomarkers of the efficacy of the combination chemotherapy with bevacizumab.
摘要
背景。随机 III 期研究(WJOG4407G)显示 FOLFOX 和 FOLFIRI 联合贝伐珠单抗作为转移性结直肠癌(mCRC)的一线治疗具有相同的疗效。我们使用在该研究中获得的肿瘤组织样本的基于阵列的比较基因组杂交(aCGH)分析研究全基因组拷贝数分布图。本研究的目的是确定基因拷贝数的改变,这有助于为 mCRC 患者选择 FOLFOX 或 FOLFIRI 联合贝伐珠单抗。
材料和方法。从参与 WJOG4407G 试验的 395 名患者的 154 个治疗前福尔马林固定的石蜡包埋的组织样本(75 个来自 FOLFOX 组,79 个来自 FOLFIRI 组)中纯化 DNA,并进行 aCGH 分析。大于 1.2 倍的基因组区域被认为是拷贝数增加(CNG)。
结果。除肿瘤位置(左侧;FOLFOX 组为 64%,FOLFIRI 组为 80%,p = 0.07)外,治疗组之间的患者特征良好均衡。在染色体 8q24.1 [Fisher 精确检验,反应率(RR) 的 p 值 = 0.134;交互测试,无进展生存期(PFS) 的 p 值 = 0.102,总生存期(OS) 的 p 值 = 0.003]和 8q24.2(Fisher 精确检验,RR 的 p 值 = 0.179;交互测试,PFS 的 p 值 = 0.144 ,OS 的 p 值 = 0.002)的 CNG 患者中,FOLFIRI 显示出比 FOLFOX 更好的RR、PFS和OS的趋势。
结论。染色体 8q24.1 ‐ q24.2 含有可能作为预测标志物的基因,用于选择 FOLFOX 或 FOLFIRI 与贝伐珠单抗联合以治疗mCRC 患者。
对实践的启示:贝伐珠单抗已被用作转移性结直肠癌(mCRC)患者的标准一线治疗,与基于奥沙利铂或基于伊立替康的化学疗法相结合。到目前为止,还没有预测标志物可以在两种联合化疗之间进行选择。这种基于阵列的比较基因组杂交分析显示,在具有染色体 8p24.1‐p24.2 的基因拷贝数增加的 mCRC 患者中,两种联合化疗之间的治疗效果差异显著。当使用基于伊立替康的联合化疗治疗时,这些患者表现出更有利的反应和生存率。通常在该区域中发现的重叠基因可能是贝伐珠单抗联合化疗的功效的预测性生物标志物。
Introduction
For the first‐line treatment of metastatic colorectal cancer (mCRC), chemotherapy regimens containing fluoropyrimidine [5‐fluorouracil (5‐FU)/ leucovorin] in combination with oxaliplatin (FOLFOX) or irinotecan (FOLFIRI) were recognized to be the standard‐of‐care in early 2000 [1]. Recently, molecular targeting agents have been developed. Bevacizumab (Bev; Avastin, Genentech) is a recombinant humanized monoclonal antibody, which binds to the vascular endothelial growth factor (VEGF) with high specificity and prevents its interaction with its receptors on the endothelial cells and inhibits angiogenesis. This antiangiogenic agent has been shown to yield superior progression‐free survival (PFS) and overall survival (OS) when added to 5‐FU‐based chemotherapy in patients with mCRC, and it has been used as a standard first‐line treatment in combination with either FOLFOX or FOLFIRI [2], [3]. The WJOG4407G trial was the first phase III study comparing FOLFIRI with FOLFOX in combination with bevacizumab, which showed their equivalent efficacy as the first‐line treatment for mCRC. Median PFS for the FOLFIRI arm (n = 197) and FOLFOX arm (n = 198) was 12.1 and 10.7 months (hazard ratio [HR], 0.905; 95% confidence interval [CI], 0.723–1.133; p = .003 for noninferiority), respectively, and median OS for the FOLFIRI arm and the FOLFOX arm were 30.1 and 31.4 months (HR, 0.990; 95% CI, 0.785–1.249), respectively, whereas the best overall response rates were 64% for the FOLFIRI arm and 62% for the FOLFOX arm [4]. Until now, there has been no predictive marker to choose between them.
Copy number changes at the genomic level are common features of cancers, including CRC. Copy number changes in the tumor cells are thought to be associated with tumor growth and chemosensitivity/resistance. Several published comparative genomic hybridization (CGH) studies of CRC have provided a good overview of the typical patterns of copy number gains and losses in CRC. More recently, array‐based CGH (aCGH), with significantly higher resolution, has been applied to further refine these findings, leading to identification of several candidate driver genes [5], [6], [7]. However, advanced analyses of copy number changes, which may determine the correlation with the efficacy of chemotherapy, have not identified biomarkers specific for selecting optimal chemotherapy regimens of mCRC.
In the present study, we purified DNA from formalin‐fixed paraffin‐embedded (FFPE) tissue samples obtained from the patients enrolled in the WJOG4407G trial and generated whole genome copy number profiles of mCRC using aCGH. The main aim of this study was to identify gene copy number alterations that could aid in selecting either FOLFOX or FOLFIRI in combination with bevacizumab for patients with mCRC.
Materials and Methods
Ethics Statement
This study was carried out as a collaborative study of the WJOG4407G trial [4]. The WJOG440G trial and this collaborative study were approved by the ethics committee of each participating institution. This collaborative study was not mandatory for all of the patients participating in WJOG4407G trial and only included the patients who provided written informed consents specific for this translational research. The WJOG4407G trial and this collaborative study were undertaken in accordance with the principles laid down in the Declaration of Helsinki and registered in the University Hospital Medical Network (UMIN) Clinical Trials Registry, number UMIN000001396.
Patients
In the WJOG4407G trial, 395 eligible patients with previously untreated mCRC were randomized to receive either FOLFOX + Bev (ox arm; oxaliplatin 85 mg/m2, l‐leucovorin 200 mg/m2, bolus 5‐FU 400 mg/m2, infusional 5‐FU 2,400 mg/m2, and Bev 5 mg/kg, every 2 weeks) or FOLFIRI + Bev (iri arm; same as ox arm, except for irinotecan 150 mg/m2 in place of oxaliplatin) until disease progression, appearance of unacceptable toxicity, or patient's refusal. Tumor samples were obtained prior to chemotherapy from the patients who participated in this collaborative study. The clinical data of the subjects of this study were obtained from the data center of the West Japan Oncology Group (WJOG).
Sample Collection
The laboratory analyses were performed at Kinki University, Osaka‐Sayama. Tumor tissue was manually dissected from the FFPE tissue samples. Genomic DNA (gDNA) was purified from each tissue specimen using the QIAamp DNA Micro kit (Qiagen GmbH, Hilden, Germany). The concentration and purity of the gDNA were measured using the Quant‐iT PicoGreen dsDNA Assay Kit (Thermo Fisher Scientific Inc., Waltham, MA).
aCGH profiling
Five hundred nanograms of pooled gDNA were labelled with either Cyanine 5‐dUTP (Cy5; test) or Cyanine 3‐dUTP (Cy3; gender‐matched reference), according to the manufacturer's instructions (Agilent Genomic DNA Enzymatic Labeling Kit). Competitive hybridization was performed on Agilent Human CGH microarrays 4 × 180 K for each sample, according to “Agilent Oligonucleotide Array‐Based CGH for Genomic DNA Analysis.” Images were scanned and quantified on the Agilent G2565 CA microarray scanner, and the fluorescence intensities were extracted using the Feature Extraction (version 10.7.3.1) software (Agilent Technologies Inc., Santa Clara, CA).
Analysis of the Array Data
The aCGH analysis was performed using the Agilent genomic workbench software (version 6.5.0.18). The somatic copy number aberrations (CNAs) were detected using the quality‐weighted interval score algorithm, also called the aberration detection method 2 algorithm (threshold: 6.0), with a centralization threshold of 6.0 and bin size of 10.
There are no standardized log2 ratio cutoffs to define low‐amplitude CNAs. Based on the available literature, genomic positions with a log2 Cy5/Cy3 fluorescence ratio of over 0.25 (∼1.2‐fold) and a minimum of three consecutive probes with the same polarity per region were extracted as showing copy number gain (CNG) [8], [9]. CNAs overlapping with known normal genomic variants according to the Database of Genomic Variants (http://dgvbeta.tcag.ca/dgv/app/home?ref=NCBI37/hg19) were not included.
Database Submission of aCGH Data
The aCGH data were deposited in the Gene Expression Omnibus (GEO) database: http://www.ncbi.nlm.nih.gov/geo/. The GEO accession number is GSE110785.
Statistical Analysis
We first estimated the treatment effects in the overall subject population (n = 154) based on the copy number statuses in subchromosomal regions. Then, we explored the relevance of focal chromosomal aberrations to predictive markers to choose between FOLFOX + Bev and FOLFIRI + Bev, first focusing on the response rates followed by analysis for progression‐free survival and overall survival. The chi‐squared contingency test or Fisher's exact test was used to compare categorical variables, and Student's t test was used to compare continuous variables. Kaplan–Meier methods were used to estimate the time‐related probabilities of survival among patients with mCRC between the two different treatment arms (ox and iri arms) and between two copy number statuses, CNG(−) and CNG(+), specified for each chromosome region. The log‐rank test was used to detect the statistically significant differences in the survival distributions between the two treatment arms and between the copy number statuses. A p value < .05 was considered as denoting statistical significance, whereas the screening cutoff p value for interaction test was set at .2 to explore the candidate predictive markers for response rate.
Results
Patient Characteristics and Treatment Efficacy
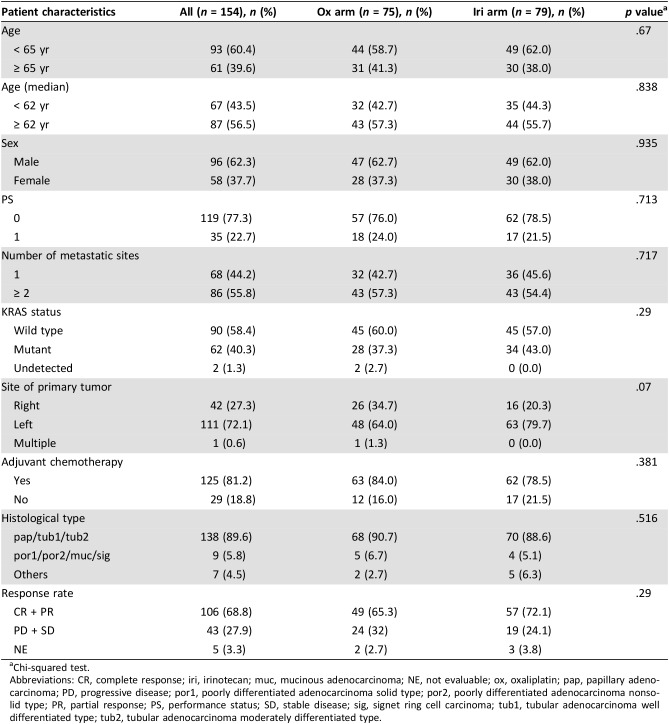
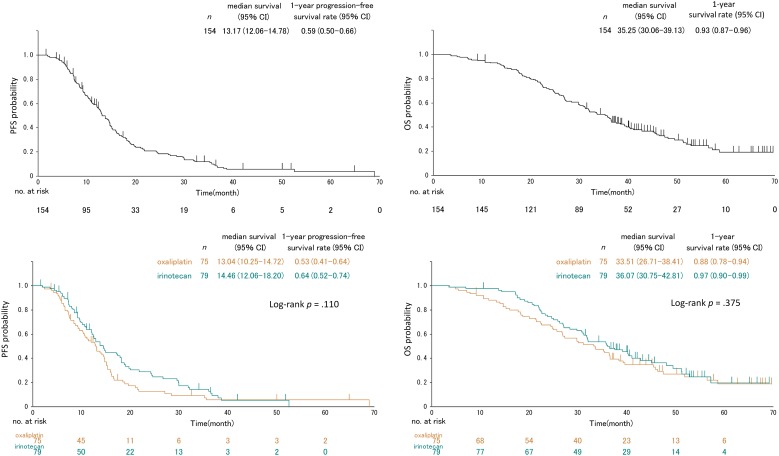
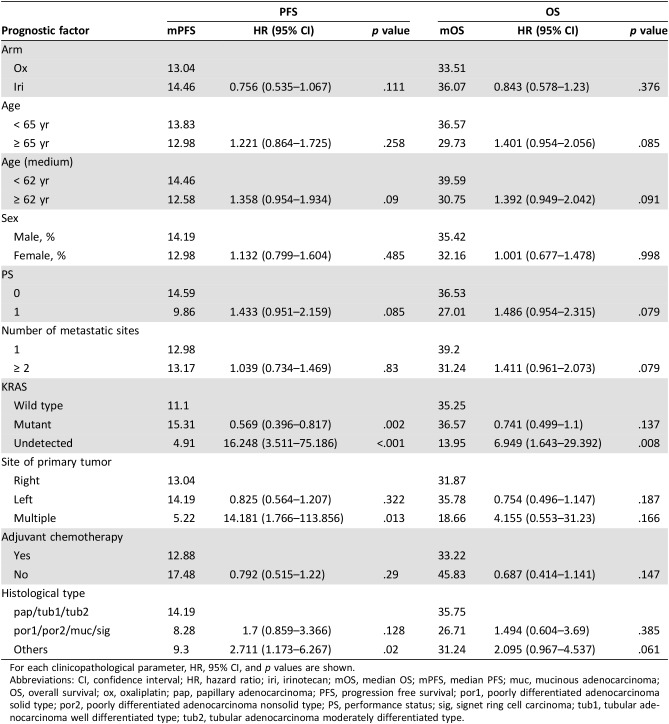
Tissue samples were obtained from 154 patients (75 from the ox arm and 79 from the iri arm), which were eligible for the aCGH analysis, accounting for 39% of the all 395 eligible patients of the WJOG4407G trial. Their clinicopathological features are summarized in Table 1. There were no significant differences in patient background between the two treatment arms except for tumor sites. The proportion of patients having primary tumors at the right‐sided colon was slightly higher in the ox arm (p = .07). The iri arm showed a slightly higher response rate (75% vs. 67%; Table 1) and slightly longer PFS (median, 14.5 vs. 13 months) and OS (median, 36.1 vs. 33.5 months) than the ox arm, although all these were not statistically significant (Fig. 1 and Table 2).
Table 1. Patient characteristics.
Chi‐squared test.
Abbreviations: CR, complete response; iri, irinotecan; muc, mucinous adenocarcinoma; NE, not evaluable; ox, oxaliplatin; pap, papillary adenocarcinoma; PD, progressive disease; por1, poorly differentiated adenocarcinoma solid type; por2, poorly differentiated adenocarcinoma nonsolid type; PR, partial response; PS, performance status; SD, stable disease; sig, signet ring cell carcinoma; tub1, tubular adenocarcinoma well differentiated type; tub2, tubular adenocarcinoma moderately differentiated type.
Figure 1.
Kaplan–Meier plots of the PFS (left) and OS (right) for total (upper) and according to the treatment regimen (lower) in the overall subject population (n = 154).
Abbreviations: CI, confidence interval; OS, overall survival; PFS, progression‐free survival.
Table 2. Analysis of prognostic factors for PFS and OS.
For each clinicopathological parameter, HR, 95% CI, and p values are shown.
Abbreviations: CI, confidence interval; HR, hazard ratio; iri, irinotecan; mOS, median OS; mPFS, median PFS; muc, mucinous adenocarcinoma; OS, overall survival; ox, oxaliplatin; pap, papillary adenocarcinoma; PFS, progression free survival; por1, poorly differentiated adenocarcinoma solid type; por2, poorly differentiated adenocarcinoma nonsolid type; PS, performance status; sig, signet ring cell carcinoma; tub1, tubular adenocarcinoma well differentiated type; tub2, tubular adenocarcinoma moderately differentiated type.
Survival Impacts of Copy Number Gain
The results from the aCGH analysis were successfully obtained from all subjects. CNGs at 10 subregions of chromosome 7p, at 15 subregions of 7q, at 16 subregions of 8q, at 15 subregions of 13q, and at 5 subregions of 20q were observed in ≥30 patients (supplemental online Table 1).
For the total patient population, CNG covering the 7q, 13q (9 subregions), 20p (3 subregions) and 20q (3 subregions) chromosomal regions was significantly correlated with OS in the univariate analysis (supplemental online Table 2). The patients with CNG in these regions showed a better prognosis.
Clinopathological analysis for prognostic factors showed significant difference in PFS, but not in OS, between patients with KRAS wild and mutant types (p = .002; Table 2). This trend of PFS was also detected among all patients enrolled in our original study with a p value of .003 [4]. To adjust for this KRAS status, we performed multivariate analysis and found four candidate regions, 7q31.2, 7q31.3, 7q32, and 8q11.1, which were significantly correlated with PFS (supplemental online Table 3).
Subregional Determinants of the Response
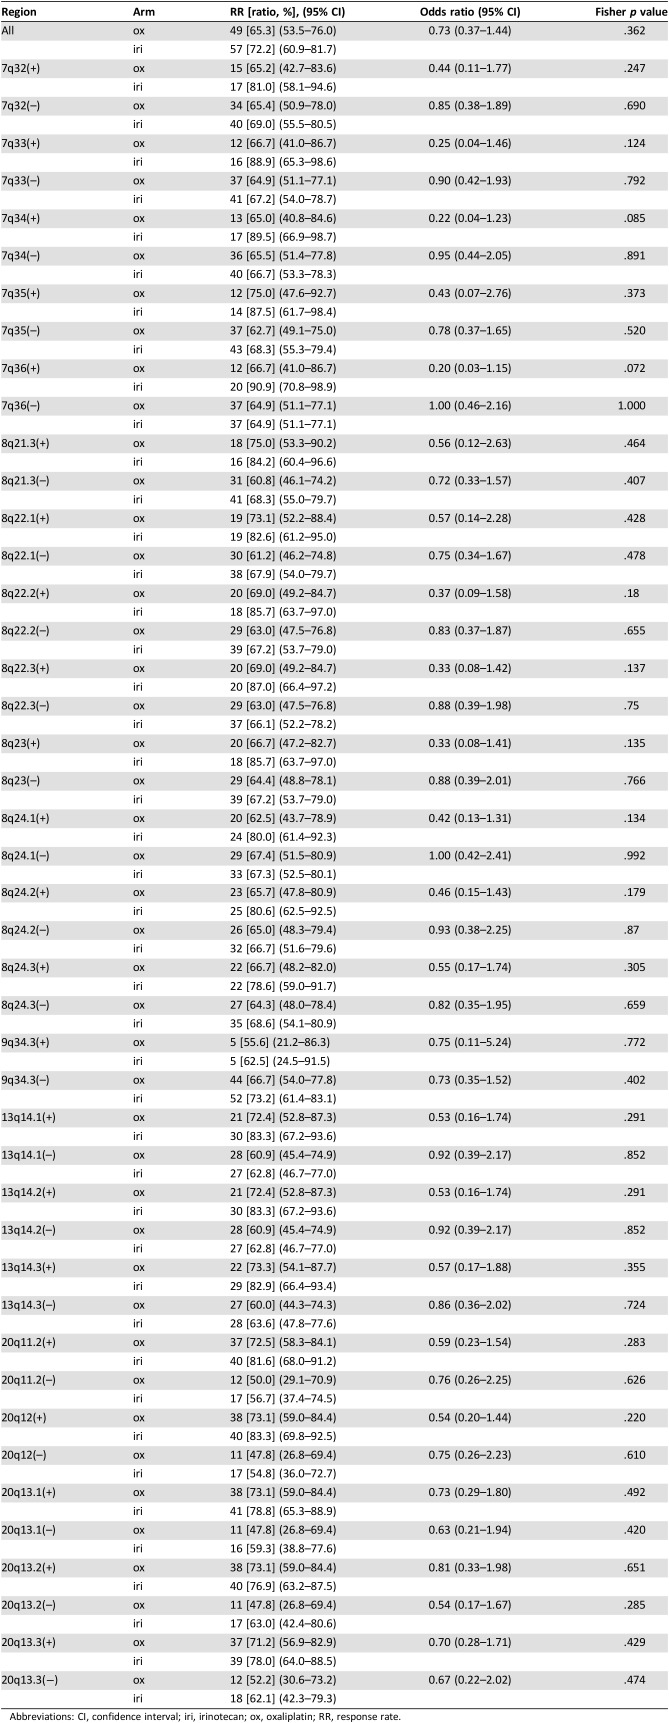
To identify factors predicting treatment efficacy of each chemotherapy regimen, we first compared the response rate (RR) between the ox and iri arms for patients with or without CNG in each chromosomal region (Table 3). Subregions less frequently showing CNGs (≥15 patients; supplemental online Table 4) that were occasionally found in chromosomes other than 7p, 7q, 8q, 13q, 20p, and 20q (≥30 patients) were also included for the analyses (supplemental online Table 5). The iri arm showed a better RR than the ox arm for patients with CNGs at 1q21.1–q21.2, 1q42.12, 1q32.1, 7q21.3, 7q33, 7q34, 7q36, 8q22.2, 8q22.3, 8q23, 8q24.1, and 8q24.2 (p < .2) as assessed by univariate analysis (Table 3 and supplemental online Table 5). Because there was a difference in the site of primary tumors (right vs. left) between the two treatment arms—that is, left‐sided tumors were more frequent in the iri arm (p = .070; Table 1)—we performed multivariate analyses adjusting for the site of primary tumor (supplemental online Table 5). The results obtained by both univariate and multivariate analyses were essentially comparable for difference in the RR between treatment arms. The possible interaction for RR were detected in patients with CNGs at 1q21.1–q21.2, 1q42.12, 1q32.1, 7q11.21, 7q11.22, 7q21.3, 7q33, 7q34, 7q36, 8q21.1, 8q22.2, 8q22.3, 8q23, 8q24.2, and 19q13.12 (p < .2) and 8q24.1 (p = .203) for multivariate analysis (supplemental online Table 5).
Table 3. Response rates comparing treatment arms in representative chromosomal regions with (+) and without (−) copy number gain.
Abbreviations: CI, confidence interval; iri, irinotecan; ox, oxaliplatin; RR, response rate.
Subregional Determinants of PFS and OS
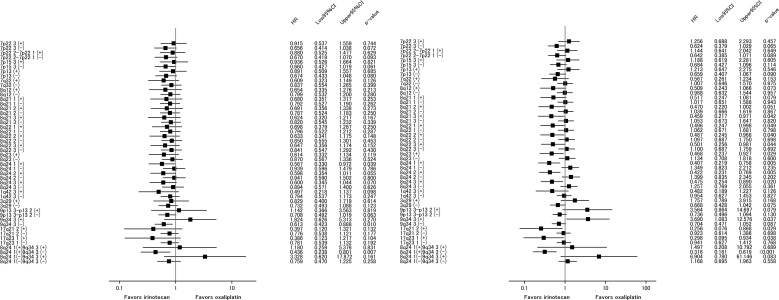
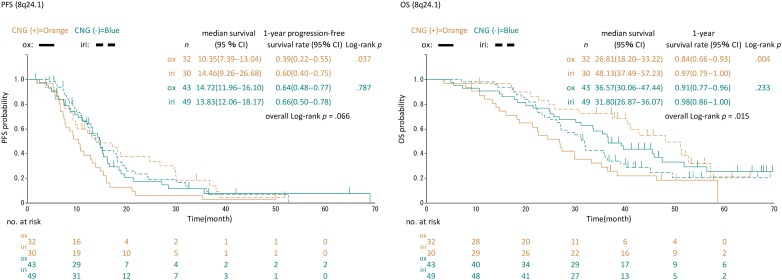
Next, we examined interactions of CNG for PFS and OS (Fig. 2 and supplemental online Table 6). For each chromosomal region, no significant imbalance in the patient distribution for treatment was observed between CNG statuses (supplemental online Table 7). The iri arm showed better PFS than the ox arm (p for interaction < .2) in patients with CNGs at chromosome 8q24.1 (median 14.5 vs. 10.4 months), 8q24.2 (median 14.5 vs. 11.4 months), and 8q24.3 (median 14.5 vs. 10.7 months) regions and in those without CNG at the chromosome 9q34.3 region (median 14.8 vs. 13.0 months), whereas the correlation of CNG with OS was found in a wider range of whole chromosomal regions, including these regions (Fig. 2 and supplemental online Table 6). The log‐rank test also showed significant differences between the two arms in PFS (median 14.5 vs. 10.4 months, p = .037) and OS (median 48.1 vs. 26.8 months, p = .004) in patients having CNG at 8q24.1 (Fig. 3). These trends for PFS and OS tended to be exhibited in patients with CNG at 8q24.2 with median 14.4 versus 11.4 months, p = .053 for PFS and median 48.1 versus 26.9 months, p = .004 for OS (supplemental online Fig. 1). On the other hand, no significant difference in the outcomes between the two arms was found for PFS (median 13.8 vs. 14.7 months, p = .787) and OS (median 31.8 vs. 36.6 months, p = .233) and PFS (median 14.6 vs. 14.7 months, p = .801) and OS (median 31.8 vs. 37.9 months, p = .200) in patients without CNG at 8q24.1 and 8q24.2, respectively (Fig. 3 and supplemental online Fig. 1). In both subregions, patients with CNG in the iri arm were comparably distributed between right‐ and left‐sided tumors: right 6/16 (37.5 %), left 24/63 (38.1 %), p = .965 for 8q24.1 and right 6/16 (37.5 %), left 25/63 (39.7 %), p = .873 for 8q24.2. However, those patients with CNG in the ox arm had a slightly higher distribution in right‐sided tumors for both regions: right 13/26 (50 %), left 18/48 (38.1 %), p = .295 for 8q24.1 and right 15/26 (57.7 %), left 20/48 (41.7 %), p = .269 for 8q24.2. Although a chi‐squared test showed statistical insignificance, these rather biased distributions in the ox arm may affect OS and PFS in favor of the iri arm. To adjust for the primary site, we performed Cox regression analyses for these two subregions (supplemental online Table 8). Univariate and multivariate analyses of PFS for the CNG group showed p values of .051 and .112 for 8q24.1 and of .069 and .220 for 8q24.2, respectively.
Figure 2.
A forest plot comparing patient treatment arms according to chromosomal regions for PFS (left) and OS (right).
Abbreviations: CI, confidence interval; HR, hazard ratio.
Figure 3.
Kaplan–Meier plots of PFS (left) and OS (right) according to treatment and amplification status in the 8q24.1 chromosome region.
Abbreviations: CI, confidence interval; CNG, copy number gain; iri, irinotecan; OS, overall survival; ox, oxaliplatin; PFS, progression‐free survival.
Discussion
Our first analytical approach using aCGH revealed subchromosomal regions with CNG that showed a significant correlation with OS and PFS. The most common CNG (cutoff value ∼1.2‐fold) were detected in almost the entire subregions of chromosomes 7, 8q, 13, and 20, consistent with previous reports [10], [11]. Many of these subregions with CNGs were correlated with longer OS regardless of treatment, suggesting that these regions may include positive prognostic factors (genes). In contrast to OS, correlation with PFS was found in more limited regions. The multivariate analysis identified only two CNG regions (7q31.2–q32 and 8q11.1) that might be correlated with PFS as well as OS. Overlapping genes found commonly in CNGs of 7q31.2–q32 regions were KCND2, MIR29A, MIR29B1, FJ43663, and MKLN1. MIR29A and MIR29B1 are known as tumor suppressor miRNAs that inhibit the progression of several cancer types and may potentially serve as candidate positive prognostic factors [12], [13], [14]. The intrinsic genes in 8q11.1 are less characterized but may also include unknown prognostic factors (genes) for mCRC [15]. These issues remain unclarified, and further profound gene analyses are needed.
Our results suggested the chromosomal regions that might contain candidate factor(s) to determine which of FOLFOX or FOLFIRI in combination with bevacizumab was more suitable for the individual patient. Such factors are thought to be chromosomally located in subregions that showed a considerable correlation with treatment effect. After adjusting the site of the primary tumor, which caused imbalance between the two treatment arms, a significant interaction between the treatment effects was detected in subregions 8q24.1, 8q24.2, 8q24.3, and 9q34.3 for PFS in favor of the iri arm. Among these regions, 8q24.1 and 8q24.2 were also possible predictors for RR. Consistent with this, PFS and OS between two arms for the patients with CNGs at 8q24.1 or q24.2 were significantly different. In addition, the number of patients with CNGs in 8q24.1 and 8q24.2 was 62 (40%) and 66 (43%), respectively, indicating that the CNGs in this chromosomal region (8q24.1–8q24.2) occur frequently in mCRC (Fig. 3 and supplemental online Fig. 1).
Considering that the RR and PFS reflect treatment efficacy more directly than OS, CNGs in a subregion covering 8q24.1 to q24.2 may highlight the candidate genes for selecting the FOLFIRI regimen. Overlapping genes commonly found in this region were NSMCE2, TRIB1, FAM84B, POU5F1B, LOC727677, MYC, and PVT1. These genes are located on the border between 8q24.1 and q24.2, extending from 8q24.13 (NSMCE2 and TRIB1) to 8q24.21 (FAM84B, POU5F1B, LOC727677, MYC, and PVT1). MYC is well known as one of the most potent and commonly deregulated oncoproteins in human cancers [16], [17]. Cytotoxic drugs, including camptothecin, a compound categorized as a topoisomerase I inhibitor, as well as irinotecan, have been shown to selectively target tumor cells with MYC overexpression [18], [19]. In contrast, Citro et al. showed that MYC‐knockdown enhanced the efficacy of cisplatin against melanoma both in vitro and in vivo, implying that MYC confers platinum drug resistance in cancer cells [20]. These previous reports support our results. Although the participation of other putative oncogenes involved in the sensitivity to irinotecan or resistance to oxaliplatin, such as TRIB1 [21] and POU5F1B [22], which are chromosomally located near MYC, cannot be excluded, we hypothesize that MYC is the most promising positive predictive biomarker. Further validation and functional studies from a viewpoint of chemosensitivity are required to determine the potential roles of these genes in patients with mCRC.
There are some limitations in this study. First, this collaborative study did not include all of the randomized patients in the WJOG4407G trial, resulting in some imbalance between the two treatment arms. The iri arm showed slightly better outcomes than the ox arm in this cohort, as in the original trial results. These imbalances may cause some biases. Second, multivariate analysis performed in this study may not include all factors affecting efficacy. Additional statistical testing could minimize statistical multiplicity reducing the risk of type I errors; however, these tests may not be compulsory for an exploratory analysis such as the one conducted in this study. Third, the screening criteria for interaction p value set at .2 seem to be less stringent. However, it seems acceptable to set the screening criteria for interaction p value at .2 as an explorative study with a small sample size. Fourth, although an alternative method such as dividing the subjects into training and validation sets to confirm the significance of predictive biomarkers is possible, our sample size was too small for this approach. The results of this study should be validated in other cohorts. Fifth, we could not extract additionally RNA and protein from most samples for further analyses because tissues were limited and extraction of DNA was prioritized for whole‐genome CGH. The molecules contained in the chromosomal region (8q24.1–q24.2) should be identified as biomarker(s) related to efficacy of chemotherapy.
Conclusion
To the best of our knowledge, this is the first study to analyze the correlations between CNG and chemosensitivity (or chemoresistance) for patients with mCRC. CNGs at the 8q24.1–q24.2 subregions were associated with favorable response and survival in the patients treated with FOLFIRI plus bevacizumab, compared with FOLFOX plus bevacizumab. The 8q24.1–q24.2 subregional nucleotide sequence can be readily used as a probe, with assays as such real‐time PCR, to quantitatively analyze regional gene copy number changes, thus allowing an option to choose the more effective chemotherapy regimen to be used in combination with bevacizumab in patients with mCRC, a new therapeutic concept that warrants clinical evaluation. We also proposed that candidate biomarker genes could reside within these regions, and further studies to clarify their roles in experimental models would help develop personalized treatments for patients with mCRC.
See http://www.TheOncologist.com for supplemental material available online.
Acknowledgments
We thank Okumoto K. and Kitayama T. for technical support and Marco A. De Velasco for critically reading the manuscript. We also thank the patients who participated in WJOG4407GTR and their families, WJOG4407G investigators, nurses, and other medical staffs who contributed to the study, and the Data and Safety Monitoring Committee (H. Ariyoshi), Audit Committee (Y. Nakanishi) of the West Japanese Oncology Group (WJOG), and the WJOG Data Center (K. Mori, N. Ozumi, and S. Nakamura). This work was sponsored by the WJOG, a nonprofit organization. The WJOG received unrestricted research grants from Pharmaceutical companies disclosed at http://www.wjog.jp/support.html.
Footnotes
For Further Reading: Toshikazu Moriwaki, Shota Fukuoka, Hiroya Taniguchi et al. Propensity Score Analysis of Regorafenib Versus Trifluridine/Tipiracil in Patients with Metastatic Colorectal Cancer Refractory to Standard Chemotherapy (REGOTAS): A Japanese Society for Cancer of the Colon and Rectum Multicenter Observational Study. The Oncologist 2018;23:7–15; first published on September 11, 2017.
Implications for Practice: Previous studies of patients with metastatic colorectal cancer refractory to standard chemotherapy had demonstrated that both regorafenib and trifluridine/tipiracil could result in increased overall survival compared with placebo, but there are no head‐to‐head trials. This large, multicenter, observational study retrospectively compared the efficacy of regorafenib and trifluridine/tipiracil in 550 patients with metastatic colorectal cancer refractory to standard chemotherapy who had access to both drugs. Although no difference in overall survival was found between the two drugs in adjusted analysis using propensity score, regorafenib showed favorable survival in patients aged <65 years, whereas trifluridine/tipiracil was favored in patients aged ≥65 years in the subgroup analysis.
Author Contributions
Conception/design: Yoshihiko Fujita, Kentaro Yamazaki, Junji Tsurutani, Kazuto Nishio
Provision of study material or patients: Kentaro Yamazaki, Takahiro Tsushima, Michitaka Nagase, Hiroshi Tamagawa, Shinya Ueda, Takao Tamura, Yasushi Tsuji, Kohei Murata, Koichi Taira, Tadamichi Denda, Toshikazu Moriwaki, Sadao Funai, Takako Eguchi Nakajima, Kei Muro, Akihito Tsuji, Motoki Yoshida, Koichi Suyama, Takuya Kurimoto, Naotoshi Sugimoto, Eishi Baba, Nobuhiko Seki, Mikio Sato, Takaya Shimura
Collection and/or assembly of data: Yoshihiko Fujita, Kazuko Sakai
Data analysis and interpretation: Yoshihiko Fujita, Masataka Taguri, Kentaro Yamazaki, Narikazu Boku, Ichinosuke Hyodo, Takeharu Yamanaka, Kazuto Nishio
Manuscript writing: Yoshihiko Fujita, Masataka Taguri, Narikazu Boku, Ichinosuke Hyodo
Final approval of manuscript: Yoshihiko Fujita, Masataka Taguri, Kentaro Yamazaki, Junji Tsurutani, Kazuko Sakai, Takahiro Tsushima, Michitaka Nagase, Hiroshi Tamagawa, Shinya Ueda, Takao Tamura, Yasushi Tsuji, Kohei Murata, Koichi Taira, Tadamichi Denda, Toshikazu Moriwaki, Sadao Funai, Takako Eguchi Nakajima, Kei Muro, Akihito Tsuji, Motoki Yoshida, Koichi Suyama, Takuya Kurimoto, Naotoshi Sugimoto, Eishi Baba, Nobuhiko Seki, Mikio Sato, Takaya Shimura, Narikazu Boku, Ichinosuke Hyodo, Takeharu Yamanaka, Kazuto Nishio
Disclosures
Kentaro Yamazaki: Chugai Pharma, Daiichi Sankyo, Yakult Honsha, Takeda, Bayer, Merck Serono, Bristol‐Myers Squibb Japan, Taiho Pharmaceutical, Eli Lilly & Co. (H), Taiho Pharmaceutical (RF); Junji Tsurutani: Ganchiryogakkai (RF), Taiho Pharmaceutical, Eizai, Chugai, Novartis, Kyowa Hakko‐Kirin (H), Daiichisankyo, Asahikasei, Eizai (SAB); Tadamichi Denda: Merck Sharpe & Dohme, Boehringer Ingelheim, Sanofi (RF); Toshikazu Moriwaki: Taiho Pharmaceutical, Takeda (H, RF), Merck Sharpe & Dohme Oncology (RF), Chugai Pharma, Merck Serono, Eli Lilly & Co., Sanofi‐Aventis (H); Takako Eguchi Nakajima: Taiho Pharmaceutical (C/A), Merck Serono, Taiho Pharmaceutical, Chugai Pharm, Takeda Pharm, Yakult Honsha, Eli Lilly & Co. Japan, Esai Pharm, Sanofi, Amgen, Astellas BioPharma, Ono Pharm, AstraZeneca, Merck Sharpe & Dohme, Dainippon Sumitomo Pharm (RF), Eli Lilly & Co. Japan, Taiho Pharmaceutical, Chugai Pharm, Sawai Pharm, Takeda Pharm, Kyowa Hakko‐Kirin, Merck Serono, Bristol‐Myers Squibb, Ono Pharm, Bayer Yakuhin, Dainippon Sumitomo, Maruho Co., Ltd. (H); Kei Muro: Ono, Chugai, Takeda, Taiho, Bayer, Eli Lilly & Co. (H), Merck Sharpe & Dohme, Daiichi Sankyo, Shionogi, Kyowa Hakko Kirin, Gilead Sciences (RF); Akihito Tsuji: Daiichi Sankyo, Taiho Pharmaceutical, Chugai Pharma, Merck Serono, Takeda Pharmaceutical, Bristol‐Myers Squibb Japan (H); Eishi Baba: Chugai, Eli Lilly & Co. (H), Chugai, Eli Lilly & Co., Taiho, Ono, Merck Serono, Kyowa Hakko‐Kirin, Taiho, Diichi Sankyo, Yakult, Bristol‐Myers Squibb (RF); Nobuhiko Seki: Boehringer Ingelheim (H, RF), Eli Lilly & Co. Japan, AstraZeneca, Bristol‐Myers Squibb, Ono Pharm, MSD Oncology, Daiichi Sankyo (H, SAB), Taiho Pharmaceutical, Chugai Pharm (H); Narikazu Boku: Taiho, Ono, Bristol‐Myers Squibb (RF), Taiho, Ono, Eli Lilly & Co., Bristol‐Myers Squibb, Chugai, Yakult, Merck Serono (H); Ichinosuke Hyodo: Chugai Pharma, Taiho Pharmaceutical, Yakult Honsha, Bristol‐Myers Squibb, Takeda Pharma (RF), Chugai Pharma, Taiho Pharmaceutical, Daiichi Sankyo, Takeda, Eli Lilly & Co., Yakult Honsha (H); Takeharu Yamanaka: Chugai (H). The other authors indicated no financial relationships.
(C/A) Consulting/advisory relationship; (RF) Research funding; (E) Employment; (ET) Expert testimony; (H) Honoraria received; (OI) Ownership interests; (IP) Intellectual property rights/inventor/patent holder; (SAB) Scientific advisory board
References
- 1.National Comprehensive Cancer Network . NCCN Clinical Practice Guidelines in Oncology: Colon Cancer, version 1.2012. Available at http://www.nccn.org/professionals/physician_gls/f_guidelines.asp. Accessed September 22, 2011.
- 2.Hurwitz H, Fehrenbacher L, Novotny W et al. Bevacizumab plus irinotecan, fluorouracil, and leucovorin for metastatic colorectal cancer. N Engl J Med 2004;350:2335–2342. [DOI] [PubMed] [Google Scholar]
- 3.Kabbinavar FF, Hambleton J, Mass RD et al. Combined analysis of efficacy: The addition of bevacizumab to fluorouracil/leucovorin improves survival for patients with metastatic colorectal cancer. J Clin Oncol 2005;23:3706–3712. [DOI] [PubMed] [Google Scholar]
- 4.Yamazaki K, Nagase M, Tamagawa H et al. Randomized phase III study of bevacizumab plus FOLFIRI and bevacizumab plus mFOLFOX6 as first‐line treatment for patients with metastatic colorectal cancer (WJOG4407G). Ann Oncol 2016;27:1539–1546. [DOI] [PubMed] [Google Scholar]
- 5.Nakao K, Mehta KR, Fridlyand J et al. High‐resolution analysis of DNA copy number alterations in colorectal cancer by array based comparative genomic hybridization. Carcinogenesis 2004;25:1345–1357. [DOI] [PubMed] [Google Scholar]
- 6.Poulogiannis G, Ichimura K, Hamoudi RA et al. Prognostic relevance of DNA copy number changes in colorectal cancer. J Pathol 2010;220:338–347. [DOI] [PubMed] [Google Scholar]
- 7.Brosens RP, Haan JC, Carvalho B et al. Candidate driver genes in focal chromosomal aberrations of stage II colon cancer. J Pathol 2010;221:411–424. [DOI] [PubMed] [Google Scholar]
- 8.Hashemi J, Fotouhi O, Sulaiman L et al. Copy number alterations in small intestinal neuroendocrine tumors determined by array comparative genomic hybridization. BMC Cancer. 2013;13:505. [DOI] [PMC free article] [PubMed] [Google Scholar]
- 9.Bambury RM, Bhatt AS, Riester M et al. DNA copy number analysis of metastatic urothelial carcinoma with comparison to primary tumors. BMC Cancer 2015;15:242. [DOI] [PMC free article] [PubMed] [Google Scholar]
- 10.Berg M, Agesen TH, Thiis‐Evensen E et al. Distinct high resolution genome profiles of early onset and late onset colorectal cancer integrated with gene expression data identify candidate susceptibility loci. Mol Cancer 2010;9:100. [DOI] [PMC free article] [PubMed] [Google Scholar]
- 11.Ali Hassan NZ, Mokhtar NM, Kok Sin T et al. Integrated analysis of copy number variation and genome‐wide expression profiling in colorectal cancer tissues. PLoS One 2014;9:e92553. [DOI] [PMC free article] [PubMed] [Google Scholar]
- 12.Qu H, Zhu M, Tao Y. Suppression of peripheral myelin protein 22 (PMP22) expression by miR29 inhibits the progression of lung cancer. Neoplasia 2015;62:881–886. [DOI] [PubMed] [Google Scholar]
- 13.Rostas JW 3rd, Pruitt HC, Metge BJ et al. MicroRNA‐29 negatively regulates EMT regulator N‐myc interactor in breast cancer. Mol Cancer 2014;13:200. [DOI] [PMC free article] [PubMed] [Google Scholar]
- 14.Espinosa‐Parrilla Y, Muñoz X, Bonet C et al. Genetic association of gastric cancer with miRNA clusters including the cancer‐related genes MIR29, MIR25, MIR93 and MIR106: Results from the EPIC‐EURGAST study. Int J Cancer 2014;135:2065–2076. [DOI] [PubMed] [Google Scholar]
- 15.Stuppia L, Gatta V, Scarciolla O et al. Identification in chromosome 8q11 of a region of homology with the g1 amplicon of the Y chromosome and functional analysis of the BEYLA gene. Genomics 2005;85:280–283. [DOI] [PubMed] [Google Scholar]
- 16.Vita M, Henriksson M. The Myc oncoprotein as a therapeutic target for human cancer. Semin Cancer Biol 2006;16:318–330. [DOI] [PubMed] [Google Scholar]
- 17.Meyer N, Penn LZ. Reflecting on 25 years with MYC. Nat Rev Cancer 2008;8:976–990. [DOI] [PubMed] [Google Scholar]
- 18.Arango D, Mariadason JM, Wilson AJ et al. c‐Myc overexpression sensitises colon cancer cells to camptothecin‐induced apoptosis. Br J Cancer 2003;89:1757–1765. [DOI] [PMC free article] [PubMed] [Google Scholar]
- 19.Frenzel A, Zirath H, Vita M et al. Identification of cytotoxic drugs that selectively target tumor cells with MYC overexpression. PLoS One 2011;6:e27988. [DOI] [PMC free article] [PubMed] [Google Scholar]
- 20.Citro G, D'Agnano I, Leonetti C et al. c‐myc antisense oligodeoxynucleotides enhance the efficacy of cisplatin in melanoma chemotherapy in vitro and in nude mice. Cancer Res 1998;58:283–289. [PubMed] [Google Scholar]
- 21.Briffa R, Um I, Faratian D et al. Multi‐scale genomic, transcriptomic and proteomic analysis of colorectal cancer cell lines to identify novel biomarkers. PLoS One 2015;10:e0144708. [DOI] [PMC free article] [PubMed] [Google Scholar]
- 22.Hayashi H, Arao T, Togashi Y et al. The OCT4 pseudogene POU5F1B is amplified and promotes an aggressive phenotype in gastric cancer. Oncogene 2015;34:199–208. [DOI] [PubMed] [Google Scholar]


