

Supplemental Digital Content is Available in the Text.
Keywords: governmental public health practice, Public Health Workforce Interests and Needs Survey (PH WINS), survey research methods, workforce research
Abstract
Context:
The Public Health Workforce Interests and Needs Survey (PH WINS) was first fielded in 2014 and is the largest public health workforce survey in the nation. This article elucidates the methods used for the 2017 PH WINS fielding.
Program or Policy:
PH WINS was fielded to a nationally representative sample of State Health Agency Central Office (SHA-CO) staff, as well as local health department (LHD) staff. The instrument largely mirrored 2014, though the training needs section was revised, and a validated item measuring burnout in staff was added.
Implementation:
Staff lists were collected directly from all participating state and local agencies. Forty-seven state health agencies (SHAs), 26 large LHDs, and 71 midsize LHDs participated. All SHAs were surveyed using a census approach. The nationally representative SHA-CO frame is representative of all central office staff members. The nationally representative local frame was a complex survey design, wherein staff from LHDs were randomly sampled across 20 strata, based on agency size and geographic region. Staff were also contributed with certainty from large LHDs in nondecentralized states. The frame is representative of staff at LHDs serving more than 25 000 people and with 25 or more staff members. Other LHDs are excluded, and so PH WINS is not representative of smaller LHDs. Balanced repeated replication weights were used to adjust variance estimates for the complex design.
Evaluation:
Overall, 47 604 people responded to PH WINS in 2017 across all frames. PH WINS 2017 achieved a response rate of 48%. The design effect for the SHA-CO frame was 1.46 and was 16.42 for the local frame.
Discussion:
PH WINS now offers a nationally representative sample of both SHA-CO and LHD staff across 4 major domains: workplace environment, training needs, emerging concepts in public health, and demographics. Both practice and academia can use PH WINS to better understand the perceptions and needs of staff, address training gaps, and work to recruit and retain quality staff.
Context
State of workforce development
Ensuring a competent public health workforce is an essential service recognized by the Centers for Disease Control and Prevention (CDC) and health departments nationwide.1–3 For the better part of 3 decades, workforce development has been a national, state, and local focus, though it has been a topic of interest for more than a century.3–7 In the early 1990s, after publication of the landmark National Academy of Medicine report in 1988, the focus on workforce development largely related to enumeration of the workforce and establishing the 10 essential services and core functions of public health. In the years that followed, individual, state-based, and regional organizations conducted large-scale research on the governmental public health workforce, but not until the 2014 Public Health Workforce Interests and Needs Survey (PH WINS) did the field have nationally representative data on individual staff perceptions about their workplace, awareness of emerging concepts in public health, and self-reported training needs.8–11
Program or Policy
Overview of fielding of PH WINS in 2014
PH WINS was created as a collaboration between the Association of State and Territorial Health Officials (ASTHO) and the de Beaumont Foundation and was the first large-scale, nationally representative survey of individual public health workers in the United States.11 After a summit of public health leaders from across the country in 2013, PH WINS was conceptualized and later launched in 2014.12,13 There were 4 major domains in the survey: workplace environment, training needs, emerging concepts in public health, and demographics. PH WINS was originally launched with a nationally representative state frame and a local pilot survey. The local pilot survey included administration in 14 large local health departments (LHDs) that were members of the Big City Health Coalition (BCHC), as well as more than 50 smaller LHDs. Overall, 23 229 staff members responded to PH WINS 2014 across 3 initial groups—state health agency (SHA) (n = 19 171, 48% response rate), BCHC14 pilot (n = 2670, 26% response rate), and local pilot (n = 1325, 40% response rate). The SHA group was parsed into a nationally representative State Health Agency Central Office (SHA-CO) frame (n = 10 246, 46% response rate), with the remainder of respondents from local/regional health departments combined with the BCHC and local pilot respondents. This conglomeration was not nationally representative. The full history of PH WINS is well enumerated in earlier articles in this journal.11,13
Major changes in 2017
PH WINS 2017 is the second iteration of PH WINS, building on the 2014 fielding. The creation of a nationally representative local frame is the single largest change from 2014. This was a complex sample of midsize and larger LHDs and excluded small LHDs (those with fewer than 25 staff members or serving fewer than 25 000 people). The sampling frame for LHDs is described in detail later in this article.
Beyond the nationally representative local frame, there were several other notable changes in the 2017 fielding and instrument. At the state level, all participating agencies participated as a “census” unlike in 2014, where agencies had staff samples drawn on a probability basis to accommodate minimum reliability for regional and national estimates in a number of states. This occurred, in part, due to significant membership requests for detailed data analysis after PH WINS 2014, which was not possible without a larger number of respondents. This shift also occurred to simplify fielding in 2017. For the local sample design, 1 large LHD drew a probability-based sample of employees who were invited to take the survey. For the rest of the LHDs, a probability-based sample of LHDs was selected and the survey was fielded as a census to all staff members in each selected LHD. Only direct contact (in which ASTHO invited participants directly as opposed to via agency leadership) was used in 2017. Other notable changes relate largely to the instrument, including a complete revision of the training needs section, the addition of a validated burnout index, and updates to the emerging concepts in public health section. Each of these changes is discussed in detail in the following text.
Implementation
Instrument changes in 2017
As in 2014, the 2017 iteration of PH WINS focuses largely on 4 domains. These include workplace environment, training needs, emerging concepts in public health, and demographics. However, several of these domains were significantly modified after the initial fielding in 2014. The workplace environment section was shortened through the elimination of several questions (full survey instrument in the Appendix, Supplemental Digital Content, available at http://links.lww.com/JPHMP/A540) to ameliorate some survey burden. However, items relating to intent to leave and burnout (a correlate of intent to leave and job satisfaction) were added.15,16 The burnout measure, known as the Oldenburg Burnout Inventory, has been used for well over a decade in the United States and internationally, and offers insight into burnout, exhaustion, and disengagement. While traditionally fielded on a 4-point scale, it was fielded on a 5-point scale (adding a neutral option) in PH WINS for ease of respondents and alignment with other workplace environment items. While the final measures can be collapsed back to 4 points, this may limit the ability to compare the PH WINS measure with other data sets including the Oldenburg Burnout Inventory.15 In addition, the workplace environment section was expanded for those individuals who indicated they were considering leaving their organization within the next year. In 2014, we noticed a large proportion of staff were considering leaving17 but did not adequately capture information regarding for how long they had considered leaving, why they were considering leaving, and whether they had taken any steps to do so. Survey questions for these items were added and pretested for 2017.
The training needs section was entirely revised from 2014. The focus of the section in 2014, as determined by the technical expert panel and foundational summit,13 was on crosscutting training needs. As health departments across the country began to use PH WINS results for workforce development efforts, including workforce development plans for accreditation, practice partners indicated that it would be valuable to have a broader base of training needs with more specific, actionable skills in 2017. In addition, partners recommended that it would be ideal to have different items based on supervisory status, as particular skills differ on the basis of whether a staff member is a frontline worker versus part of the Executive service, for example. This tiered approach aligns with the Core Competencies for Public Health Professionals.18
Given this feedback, a workgroup was formed in 2016 to reenvision the training needs assessment. Recommendations from the work group manifested in PH WINS 2017 with the creation of 8 focus areas and approximately 21 questions across 3 tiers of supervisory status (nonsupervisors, supervisors/managers, and executives). The “strategic skills” domains included Effective Communication, Data for Decision Making, Cultural Competency, Budget and Financial Management, Change Management, Cross-Sectoral Partnerships, Systems and Strategic Thinking, and Developing a Vision for a Healthy Community. With the addition of these questions across the several tiers, the training needs assessment has become the largest section in PH WINS. While the items changed between 2014 and 2017, the response options remained the same.
Other adjustments to the instrument included removing half of the emerging concepts questions from 2014, and the addition of a question regarding the extent to which respondents think their agency ought to be involved in areas related to the social determinants of health that are not traditionally in the purview of the health department (such as education, housing, and transportation). All new questions were piloted and pretested in advance of use. Cognitive interviews were conducted with staff at 3 SHAs and 3 LHDs to help refine the new survey questions. A pretest of the survey was sent to 40 staff members in SHAs (n = 27 responses) and 40 staff members in LHDs (n = 31 responses).
Sampling approach—2017
The target population for the SHA-CO sample includes permanent central office employees in all states across the United States, excluding temporary and contractor staff. To achieve a nationally representative sample of the target population, all SHA leadership were asked to have their SHA participate in PH WINS and all participating states were asked to include their complete eligible staff roster for survey administration. Ultimately, 47 SHAs participated in the 2017 survey utilizing a census approach. The survey was fielded to all staff members in participating SHAs and during the fielding of the survey, employees found to be the target population eligible through screening questions, such as whether they were central office staff or worked in district offices, were ultimately included in the final SHA sample.
The target population for the BCHC sample includes all employees of each of 26 participating departments (out of 30 BCHC member departments). Twenty-four BCHCs used a census approach that included all eligible staff members, and 1 BCHC opted to participate via a sample. One BCHC participated via its SHA.
The target population for the local sample was different in that it only included staff in LHDs that had 25+ employees and served populations of 25 000+, thus excluding smaller LHDs. A list of all eligible LHDs was generated to prepare the sample frame from which a stratified, clustered sample of entire LHDs was selected for the fielded sample. Strata were constructed on the basis of a cross-classification of the 10 Health and Human Services (HHS) regions19 and 2 population-served sizes (25 000-250 000, >250 000). All staff members in each participating LHD were asked to complete the survey. Local staff were contributed with certainty (as opposed to on a probability basis) from 547 LHDs (either BCHCs or from those in nondecentralized states). Overall, 258 decentralized LHDs were selected via probability and 71 participated. In addition to the sample of local employees obtained from the LHD list frame, a substantial number of completed surveys were obtained via the SHA frame when staff included in the SHA indicated they were a noncentral (ie, local or regional) employee. In this way, the final PH WINS local frame comprises survey completes arising from both the initial LHD sample and the SHA sample. While leadership responded to organization-level invitations to PH WINS, it was ultimately an individual staffer's decision as to whether he or she would participate in the survey itself.
Weighting changes and design effect in 2017
The SHA-CO national sample weight was constructed in a multistep process: (1) a sample design weight was calculated at the state level for each participating SHA to account for any subsampling of staff; (2) a nonresponse adjustment was applied to the sample design weight to bring the total weighted count of central office completed surveys in alignment with the known staff totals of central office employees for each SHA; and (3) a poststratification adjustment was applied to the nonresponse adjusted weight to bring the total weighted count of staff in each of the HHS regions in alignment with region-level staff totals providing the final sample weights. The weights summed across participating SHAs in an HHS region will equal the total population of central office state-level employees in that region. Note that regions 1 and 2 were combined because of small size.
Presented in Table 1 are the unweighted sample of completed surveys and the weighted estimates of SHA-CO staff by HHS region. The design effect provides insight into the impact the complex sample design and sample weighting have on the estimates of variance for PH WINS outcomes. The design effect provided estimates of the potential change in variance of the PH WINS actual sample as compared with a simple random sample. For example, in regions 1 and 2, the variance of an estimated proportion of P = 50% using PH WINS data would be approximately 16% higher than the variance of a simple random sample of the same size. Equivalently, the standard error of the proportion would be approximately 8% higher than the standard error from a simple random sample of the same size. The design effect differs for every type of estimate and for every subgroup of analysis. However, the replicate weights for use in carrying out balanced repeated replication variance estimation that is provided in the PH WINS data account for the sample variance arising from the complex sample design and weighting.
TABLE 1. SHA National Sample Weighting Summarya.
| HHS Region | Unweighted Sample Size of Staff | Weighted Estimates of Staff | Design Effect |
|---|---|---|---|
| 1 and 2 | 2 388 | 6 599 | 1.16 |
| 3 | 1 404 | 3 255 | 1.08 |
| 4 | 3 074 | 14 802 | 1.68 |
| 5 | 2 338 | 6 495 | 1.03 |
| 6 | 2 559 | 5 187 | 1.16 |
| 7 | 926 | 1 857 | 1.13 |
| 8 | 951 | 3 366 | 1.17 |
| 9 | 2 377 | 8 169 | 1.06 |
| 10 | 1 123 | 3 126 | 1.02 |
| 17 140 | 52 856 | 1.46 |
Abbreviations: HHS, Health and Human Services; LHD, local health department; SHA, state health agency; SHA-CO, State Health Agency Central Office.
aIn the local frame, regions 1 and 2 combined because of the small number of LHDs, so this was also combined for the SHA-CO frame.
The local national sample weights were calculated for the combined sample comprising completed surveys from the participating BCHC LHDs, from the probability-based sample of LHDs in decentralized states, and from the completed surveys of local employees contributed from the SHA frame for nondecentralized states. The multistep weighting process to create the local sample weights was as follows: (1) a sample design weight was calculated for staff in each participating BCHC agency and each LHD based on their probabilities of selection and for local staff coming from the SHA frame; (2) for LHD completes, a nonresponse adjustment was applied to the sample design weight to bring the total weighted count of completed surveys in alignment with the known staff totals for each BCHC department or smaller LHD; (3) a poststratification adjustment is applied to the nonresponse adjusted weight to bring the total weighted count of staff in each of the 20 strata (10 HHS regions × 2 population-served size) in alignment with staff totals; (4) the poststratified weights were trimmed at the tails of the weight distribution (5th percentile and 95th percentile)—providing the final local national sample weights. The final local national weights summed across participating LHDs in an HHS region will equal the total population of local employees in that region as well as by population-served size above 250 000 or 250 000 and below. Note that regions 1 and 2 were combined because of size considerations.
Presented in Table 2 are the unweighted sample of completed surveys, the weighted estimates of local staff by HHS region, and population-served size using local weights and the associated design effects.
TABLE 2. Local and BCHC Sample Weighting Summarya.
| HHS Region | Strata of Population Served | Unweighted Sample Size of Staff | Weighted Estimates of Staff | Design Effect |
|---|---|---|---|---|
| 1 and 2 | >250k | 442 | 11 781 | 24.63 |
| 1 and 2 | ≤250k | 275 | 4 490 | 1.52 |
| 3 | >250k | 1 871 | 7 700 | 2.39 |
| 3 | ≤250k | 979 | 5 318 | 1.28 |
| 4 | >250k | 7 704 | 21 176 | 1.77 |
| 4 | ≤250k | 2 716 | 12 780 | 3.18 |
| 5 | >250k | 1 567 | 9 345 | 1.16 |
| 5 | ≤250k | 208 | 9 081 | 2.28 |
| 6 | >250k | 3 257 | 8 176 | 1.42 |
| 6 | ≤250k | 355 | 2 212 | 1.29 |
| 7 | >250k | 183 | 1 671 | 4.37 |
| 7 | ≤250k | 210 | 2 214 | 1.54 |
| 8 | >250k | 850 | 2 140 | 1.1 |
| 8 | ≤250k | 389 | 2 198 | 1.28 |
| 9 | >250k | 4 043 | 17 065 | 1.21 |
| 9 | ≤250k | 275 | 2 757 | 1.27 |
| 10 | >250k | 966 | 4 576 | 1.3 |
| 10 | ≤250k | 243 | 1 912 | 1.01 |
| Total | 26 533 | 126 590 | 16.42 |
Abbreviations: BCHC, Big City Health Coalition; HHS, Health and Human Services; LHD, local health department.
a“≤250k” includes LHDs serving 250 000 people and below and “>250k” indicates LHDs serving more than 250 000 people.
Redefining “central office” in decentralized states
The SHA-CO frame is similar in concept to 2014 but has one primary difference that relates to the inclusion of additional staff members from decentralized states. As outlined in detail in 2014, PH WINS was a complicated survey to field, in part, because of the governance structure of SHAs in the United States related to the different types of relationships that they have with LHDs. In some (decentralized) states, LHDs and SHAs operate largely independently. At the other end of the spectrum (centralized states), LHDs operate as local offices or franchises of the SHA. Other states have arrangements where authorities are shared between state and local offices (known as “shared” governance), or where some LHDs are quite autonomous, and others are managed by the state health department (“mixed” governance).20 In 2014, some states did not have the ability to delineate local from central office employees for inclusion in the survey. Instead, the distinction was made after respondents indicated where they worked and a “setting” variable was constructed accordingly. This approach also occurred in 2017, with one exception.
In decentralized states, where LHDs are independent of the SHA, several thousand respondents who were employed by the SHA indicated they worked in regional or district offices. Upon further investigation, these respondents were found to be employees of the SHA, functioning as central office employees split across different buildings in various locations across the state, though the LHDs in those states are still functionally autonomous. In our view, this is different from local or regional offices in centralized states, where the district, regional, and local health departments are all entities belonging to the SHA. As such, we decided in the case of decentralized states that we would include these district staff members (n = 3775) as part of central office estimates. No other changes were made.
Fielding approach in 2017
Similar to 2014, we collected a list of employees, which we used to invite respondents to participate in PH WINS, from 3 distinct groups (SHA, BCHC, other LHDs; Figure 1). First, we worked with 47 SHAs to generate staff lists, which included centralized, shared, or mixed states where we expected that LHD staff would be included and sorted into an appropriate setting later (77 992 potential respondents). We worked with 25 BCHC health departments14 directly to generate staff lists for 16 870 potential respondents. One other BCHC LHD participated via its SHA. Finally, we worked with 71 randomly sampled decentralized agencies that agreed to participate in PH WINS to invite 7423 potential respondents. Potential respondents from these 3 groups—SHA, BCHC, and other LHDs—were then processed to yield the 2 nationally representative frames. To accomplish this, in concert with the generation of the staff lists, we identified which staff would be eligible for inclusion in the nationally representative SHA-CO frame or the nationally representative LHD frame. Overall, just over 17 000 central office staff members responded in the SHA-CO frame, representing 53 000 central office staff members nationwide. Approximately 26 000 staff members responded in the local frame, representing more than 126 000 staff members nationally.
FIGURE 1.
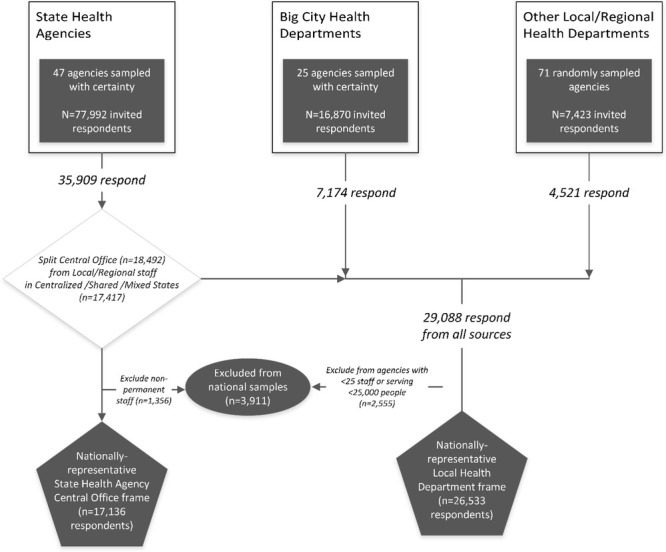
Overview of Fielding Approach for PH WINS 2017
Abbreviations: BCHC, Big City Health Coalition; LHD, local health department.
aSampling with “certainty” indicates all agencies from the groups were invited to participate, whereas agencies that were “randomly sampled” were invited to participate in PH WINS on a probability basis. Once agency leadership agreed to participate in PH WINS (regardless of whether the agency itself had been sampled randomly or with certainty), all staff members were invited to participate as a census. One exception exists, wherein staff from one BCHC LHD also were further randomly sampled to determine whether they would receive individual invitations to participate.
We worked with a “workforce champion” (typically a human resources professional or other employee with workforce development responsibilities) and an information technology contact in each agency to conduct outreach about the launch of PH WINS and ensure that no technological issues were encountered with the survey invitation e-mail as occurred at times in 2014. Five agencies had technical difficulties with the e-mail–based invites, but these issues were resolved. Workforce champions were regularly updated with the response rate and bounce count for their agency during fielding. ASTHO staff created phone- and e-mail–based support lines for the 2017 fielding, providing technical assistance to potential respondents having issues with the survey and answering questions about fielding and use of the data (n = 818). The vast majority of PH WINS invites were fielded in late fall of 2017, with the remainder in the winter. Respondents received an initial invite and up to 5 reminders to participate in the study over the course of approximately 8 weeks in the field.
In constructing final sample assignment, 17 136 respondents qualified for the nationally representative SHA-CO sample and the 26 533 respondents qualified for the nationally representative LHD sample. The only difference between the 2 samples, other than the location of staff, is that the SHA-CO sample includes only permanently employed staff of the central office whereas the LHD sample includes staff of all types at the LHD. In consulting with local partners, it was determined that a variety of employment status types exist at the local level in substantial proportion in a way that they do not encounter at the state level. It would have been imprudent to only include permanent local staff in these estimates.
Evaluation
Response rates, missings analysis
Overall, PH WINS was fielded to 102 305 public health staff members across the United States (Table 3). After accounting for e-mail bounces and staff who had left their position (n = 3784), PH WINS 2017 achieved a response rate of 48%. There were 3935 local staff members who participated via their SHAs that were not eligible for inclusion in the nationally representative LHD frame due to their small size, or were SHA-CO staff that were not permanently employed. This accounts for the difference between the gross number of respondents (n = 47 604) and the totals for the 2 nationally representative frames (n = 43 669).
TABLE 3. Response Ratesa.
| Unfinished | Finished | Total | Response Rate | |
|---|---|---|---|---|
| Initial sampling group | ||||
| BCHC | 9 242 | 7 174 | 16 416 | 44% |
| Other local/regional health department | 2 661 | 4 521 | 7 182 | 63% |
| State health agencyb | 39 014 | 35 909 | 74 923 | 48% |
| Total | 50 917 | 47 604 | 98 521 | 48% |
| Final nationally representative frame | ||||
| Local | 18 078 | 26 533 | 44 611 | 59% |
| SHA-CO | 31 199 | 17 136 | 48 335 | 35% |
| Total | 49 277 | 43 669 | 92 946 | 47% |
Abbreviation: BCHC, Big City Health Coalition; SHA-CO, State Health Agency Central Office.
aE-mails that were returned undeliverable were not counted toward response rate.
bIncludes state health agency staff who work in local health department. Finished counts include staff who completed the survey; required questions included what setting they worked in, and for SHA-CO respondents, their employment status (eg, permanent, temporary). Initial sampling groups were processed, based on respondents' setting, into the nationally representative frames.
Approximately 0.5% (n = 554) affirmatively opted out of the survey and are counted as nonrespondents alongside the remaining invited staff who did not respond to e-mail invitations or complete the survey. Because the initial state group included central office and local staff, we had to parse and estimate these response rates. We estimate the SHA-CO frame had a response rate of 35% and the LHD frame had a response rate of 59%. As units, SHAs had variable response rates (51% mean, median 48%, min 26%, max 82%). The BCHC health departments had a comparable response rate (51% mean, median 52%, min 22%, max 79%). Staff from the initial other LHD group had the highest response rate (67% mean, median 70%, min 14%, max 100%).
We examined patterns of missingness generally but focus specifically here on item response analysis in the 7722 partial responses (“survey incompletes”) (Figure 2). Substantial drop-off occurred on pages 2 (workplace environment), 4 (burnout), and 7 to 9 (training needs). These were the longest questions in PH WINS. Measuring page-to-page drop-off, we find that 30% fell off between consent and workplace environment pages, 15% on burnout, 25% on supervisory status, 57% on training needs, 35% on emerging concepts, 11% on social determinants, and 16% on demographics. Trends in drop-off were largely consistent across frames (see Appendix Figure 1, Supplemental Digital Content, available at http://links.lww.com/JPHMP/A540). One exception is that BCHC and local frame respondents seemed to drop off at a higher proportion than state incompletes at the question about their state and agency, suggesting concerns about confidentiality. A small number of incompletes submitted the survey but chose to skip questions needed to determine which frame to place them in. These staff members were excluded from both the final nationally representative frames, and a small number of staff members were marked as incompletes more broadly and not included in the final data set.
FIGURE 2.
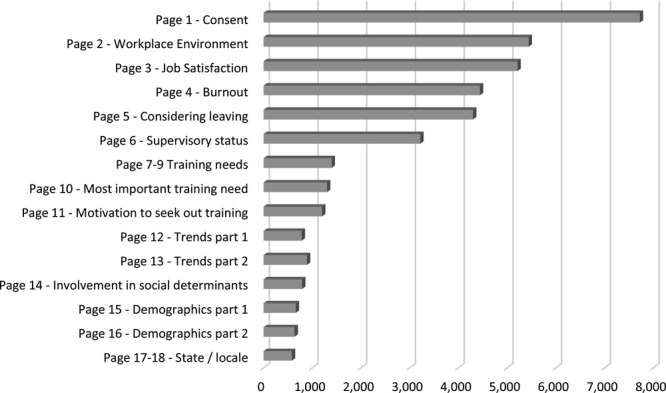
Page Completion (Among Survey Incompletes)
Discussion
Implications for workforce development research
PH WINS is the only large-scale survey to offer nationally representative information on state and local public health workers. Moreover, its rigor and complex sampling adjustment mean that we can be confident in our estimates and examinations of critical trends for the public health workforce. These data represent a wealth of information related to job satisfaction, demographics, intent to leave, perceptions of training needs, and a number of other areas for researchers and practitioners. Beyond high-level trend analyses, we are well powered to examine correlates of critical questions in public health and thoroughly examine the drivers of these issues. Practitioners can use these data in workforce development and to help address the potential wave of retirements agencies are facing.21 An additional benefit to researchers is that PH WINS has now been fielded twice, which allows for multi cross-sectional comparisons, with more fieldings in the future. Workforce development will continue to be a primary area of interest in public health systems research, and we believe that PH WINS can support those efforts.
Reflecting on the methodological future of PH WINS
As we consider future fieldings of PH WINS, methodological improvements are always possible. While we have a robust response rate near 50%—significantly higher than Web-based surveys generally—more can be done to ensure good response rates in the future. Efforts could include continued marketing of PH WINS during off-fielding years to increase general awareness, more incentives for respondents (where allowable), and funding to support research-to-action type projects. Moreover, future fieldings may benefit from test-retest, nonresponse follow-up, and other advanced survey methods to improve internal and external validity. The 2017 fielding of PH WINS represents the culmination of work planned since the 2014 fielding in terms of creating a nationally representative local frame. However, a substantial limitation of our approach with the 2017 frame is its focus on mid- and large-sized LHDs. This was done for both practical and prudential reasons. Practically, it would be very difficult to assess a health department's workforce and its needs if it only has a few staff members. This represents a substantial portion of LHDs nationally. Prudentially, we did not believe we could reasonably field a representative sample to small LHD staff and, instead, focused on mid- and large-sized health departments. This is a limitation, and more work can be done to address this issue in coming years.
Limitations
In the 2017 fielding of PH WINS, 47 SHAs across all regions and LHDs from all 50 states and District of Columbia participated. This represents an improvement from the 2014 fielding regarding generalizability, but nonresponse bias remains a potential issue. The largest limitation is that our nationally representative local frame is only technically nationally representative to midsize and larger LHDs across the United States. Practically, as seen in the Appendix (Supplemental Digital Content, available at http://links.lww.com/JPHMP/A540), there are some differences between staff at smaller locals and midsize/larger departments. We did incidentally collect almost 3000 responses from respondents serving smaller LHDs in centralized/shared/mixed states. Given that only approximately 19 000 staff members are in this pool nationally, deeper examination of these respondents and their comparability with their peers at larger jurisdictions may be worthwhile in examining considerations of generalizability to smaller LHDs. Sensitivity analyses show that most of these differences are not statistically (or practically) significant, with a few exceptions—namely, that smaller LHD staff are much less diverse than national averages and more staff members work in clinical roles. This may or may not be representative of all small LHDs nationwide. More work is necessary to create estimates generalizable to this population.
Implications for Policy & Practice
While some view PH WINS largely as a research endeavor, it is envisioned by ASTHO and de Beaumont primarily as a data collection system in support of public health practice.
With PH WINS, agencies and regional training centers can identify pressing issues around potential staff turnover, training needs, and job satisfaction, as well as in other areas.
Agencies might consider directly using PH WINS in their workforce development efforts, including potentially for public health accreditation.
Governmental agencies should use PH WINS to identify the myriad, complex determinants of voluntary turnover, including employee engagement, supervisor satisfaction, and organizational support.
Supplementary Material
Footnotes
PH WINS was conducted with funding from the de Beaumont Foundation. Dr Leider and Mss Pineau and Ma were consultants to ASTHO for this project.
The authors declare no conflicts of interest.
Supplemental digital content is available for this article. Direct URL citations appear in the printed text and are provided in the HTML and PDF versions of this article on the journal's Web site (http://www.JPHMP.com).
References
- 1.Centers for Disease Control and Prevention. National Public Health Workforce Strategic Roadmap. https://www.cdc.gov/ophss/csels/dsepd/strategic-workforce-activities/ph-workforce/roadmap.html. Published 2017. Accessed October 15, 2017.
- 2.Centers for Disease Control and Prevention. Ten Essential Services of Public Health. http://www.cdc.gov/nphpsp/essentialServices.html2010. Accessed April 5, 2018.
- 3.Institute of Medicine, Committee on Assuring the Health of the Public in the 21st Century. The Future of the Public's Health in the 21st Century. Washington, DC: National Academies Press; 2003. [Google Scholar]
- 4.Institute of Medicine, Committee for the Study of the Future of Public Health. The Future of Public Health. Washington, DC: National Academies Press; 1988. [Google Scholar]
- 5.Public Health Functions Project. The Public Health Workforce: An Agenda for the 21st Century: A Report of the Public Health Functions Project. Darby, PA: DIANE Publishing; 1997. [Google Scholar]
- 6.Mountin JW, Hankla E. Training public health workers. Public Health Rep. 1946;(61):725–748. [PubMed] [Google Scholar]
- 7.Welch W, Rose W. The Welch-Rose Report. New York, NY: General Education Board of the Rockefeller Foundation; 1915. [Google Scholar]
- 8.Gebbie KM. The public health workforce: key to public health infrastructure. Am J Public Health. 1999;89(5):660–661. [DOI] [PMC free article] [PubMed] [Google Scholar]
- 9.Beck AJ, Boulton ML. Building an effective workforce: a systematic review of public health workforce literature. Am J Prev Med. 2012;42(5)(suppl 1):S6–S16. [DOI] [PubMed] [Google Scholar]
- 10.Hilliard TM, Boulton ML. Public health workforce research in review: a 25-year retrospective. Am J Prev Med. 2012;42(5)(suppl 1):S17–S28. [DOI] [PubMed] [Google Scholar]
- 11.Sellers K, Leider JP, Harper E, et al. The Public Health Workforce Interests and Needs Survey: the first national survey of state health agency employees. J Public Health Manag Pract. 2015;21(suppl 6):S13–S27. [DOI] [PMC free article] [PubMed] [Google Scholar]
- 12.Kaufman NJ, Castrucci BC, Pearsol J, et al. Thinking beyond the silos: emerging priorities in workforce development for state and local government public health agencies. J Public Health Manag Pract. 2014;20(6):557–565. [DOI] [PMC free article] [PubMed] [Google Scholar]
- 13.Leider JP, Bharthapudi K, Pineau V, Liu L, Harper E. The methods behind PH WINS. J Public Health Manag Pract. 2015;21(suppl 6):S28–S35. [DOI] [PMC free article] [PubMed] [Google Scholar]
- 14.Leider JP, Castrucci BC, Hearne S, Russo P. Organizational characteristics of large urban health departments. J Public Health Manag Pract. 2015;21(suppl 1):S14–S19. [DOI] [PMC free article] [PubMed] [Google Scholar]
- 15.Demerouti E, Bakker AB. The Oldenburg Burnout Inventory: a good alternative to measure burnout and engagement. In: Handbook of Stress and Burnout in Health Care. Hauppauge, NY: Nova Science; 2008:65–78. [Google Scholar]
- 16.Griffeth RW, Hom PW, Gaertner S. A meta-analysis of antecedents and correlates of employee turnover: update, moderator tests, and research implications for the next millennium. J Manag. 2000;26(3):463–488. [Google Scholar]
- 17.Liss-Levinson R, Bharthapudi K, Leider JP, Sellers K. Loving and leaving public health: predictors of intentions to quit among state health agency workers. J Public Health Manag Pract. 2015;21(suppl 6):S91–S101. [DOI] [PMC free article] [PubMed] [Google Scholar]
- 18.Council on Linkages Between Academia and Public Health and Practice. Core Competencies for Public Health Professionals. Washington, DC: Public Health Foundation; 2014. [Google Scholar]
- 19.Department of Health and Human Services. Regional offices. https://www.hhs.gov/about/agencies/iea/regional-offices/index.html. Published 2018. Accessed August 28, 2018.
- 20.Meit M, Sellers K, Kronstadt J, et al. Governance typology: a consensus classification of state-local health department relationships. J Public Health Manag Pract. 2012;18(6):520–528. [DOI] [PubMed] [Google Scholar]
- 21.Leider JP, Coronado F, Beck AJ, Harper E. Reconciling supply and demand for state and local public health staff in an era of retiring baby boomers. Am J Prev Med. 2018;54(3):334–340. [DOI] [PMC free article] [PubMed] [Google Scholar]
Associated Data
This section collects any data citations, data availability statements, or supplementary materials included in this article.