Abstract
As in mammals, high-sucrose diets lead to obesity and insulin resistance in the model organism Drosophila melanogaster (called Drosophila hereafter). To explore the relative contributions of glucose and fructose, sucrose’s component monosaccharides, we compared their effects on larval physiology. Both sugars exhibited similar effects to sucrose, leading to obesity and hyperglycemia. There were no striking differences resulting from larvae fed high glucose versus high fructose. Some small but statistically significant differences in weight and gene expression were observed that suggest Drosophila is a promising model system for understanding monosaccharide-specific effects on metabolic homeostasis.
Introduction
Much ado has been made about the negative health effects of high-fructose corn syrup. A number of laboratory studies have shown that fructose is worse for health than its structural isomer glucose [1] and references therein]. Controlled clinical studies have shown increased hyperglycemia and reduced insulin sensitivity during fructose feeding, compared with glucose feeding, although the mechanisms downstream are not well-understood [2]. Both fructose and glucose are six-carbon hexose sugars and can be catabolized via glycolysis or metabolized to store as fat. One difference between them is the liver can take on fructose preferentially and suffers metabolic overload as a result [3]. Glucose and fructose are both common in the diet. High-fructose corn syrup, which is typically 55% fructose, also contains 42% glucose [4]. Cane or beet sugar is sucrose, a disaccharide of fructose and glucose that is just as sweet as high-fructose corn syrup. Sucrose is digested by intestinal sucrase to deliver a 50:50 ratio of fructose to glucose to peripheral tissues, nearly the same ratio as in high-fructose corn syrup. Previous studies showed that Drosophila melanogaster (called Drosophila from now on) fed high-sucrose diets (24–34% sucrose) developed type 2 diabetes-like pathophysiology including increased triacylglycerides, hyperglycemia, and insulin resistance, compared with control diets [5% sucrose, [5–11]]. We set out to understand how different sugars might be metabolized differently in vivo using this Drosophila model.
In many cells, glucose is readily converted into fructose and vice versa via phosphohexose isomerase or via three-carbon catabolic intermediates [12]. When cellular energy is low, the cell will oxidize either monosaccharide via glycolysis to make ATP. When energy is high, the cell shunts these monosaccharides into polysaccharides like glycogen or amylose, into the lipogenic pathway, or into glycoprotein synthesis [12,13]. In the circulation, however, glucose and fructose meet different fates, at least in mammals. Glucose is taken up by many peripheral tissues including liver, adipose, muscle, and heart, where its metabolism can be attenuated by reducing glucose uptake or by feedback inhibition of phosphofructokinase under high-energy conditions [12]. An important feature of glucose in the liver is that it can be sequestered or produced there and released to increase the blood’s glucose supply [14]. In contrast with glucose, fructose is more likely to be catabolized by the liver, bypassing phosphofructokinase and potentially overloading glycolysis and downstream pathways [1]. Dietary fructose, therefore, favors hepatic lipogenesis more than glucose [3,15].
The Drosophila fat body serves as both the fly adipose and liver. This tissue specializes in fat storage and metabolism, increasing in lipid content when the fly is overfed and decreasing in fat storage when the fly is starved [16]. In previous studies, we found that fat bodies from larvae subjected to high-sucrose feeding developed insulin resistance and accumulated potential lipotoxins including free fatty acids and triacylglycerides [17–19]. Fat bodies also control systemic metabolic homeostasis by endocrine mechanisms including cytokines and adipokines [20–23]. Therefore, fat body physiology reflects metabolic regulatory mechanisms of the liver and adipose in mammals.
Because of the notable effects of fructose and glucose in humans, we exploited a high-sugar-induced type 2 diabetes model to look for conserved differences between fructose and glucose during overnutrition in Drosophila. By directly comparing glucose and fructose-reared larvae, we detected only a few minor differences that suggest fructose may be worse for flies than glucose. Overall, high fructose and high glucose diets produced similar negative effects on fly physiology.
Results
In previous studies, we tested dose responses to various sugars and saw similar effects on developmental delay [5]. To extend those studies, we chose glucose and fructose, two monosaccharides frequently ingested by humans. To enable comparison with our 0.15 M sucrose control diet (approximately 5% sugar, as in many fly diets), we used 0.3 M fructose or 0.3 M glucose diets as our controls (CFD or CGD, respectively). Because previous studies had used 1 M sucrose, a disaccharide, we prepared food containing 2 M of each monosaccharide. 2 M fructose or glucose, however, proved to be highly toxic to larvae, especially in one of our wild-type control genotypes. Consequently, we reduced sugar concentrations to settle on a high-sugar dietary concentration of 1.7 M fructose (high fructose diet, HFD) or 1.7 M glucose (high glucose diet, HGD). The control genotype larvae were the offspring of the cross between w1118 males and UAS-Dcr2; r4-GAL4 females, which we have characterized extensively. These animals are phenotypically normal and we have generated a large amount of data using them [17–19,24].
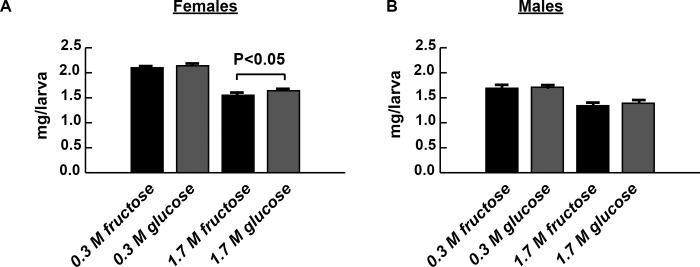
Insulin resistance in Drosophila is accompanied by decreased weight and increased hemolymph glucose and body fat content in both larvae and adults [25–27]. High sucrose diets also elicit all of these phenotypes [5,6,28], so we tested HFD and HGD larvae for insulin resistant phenotypes. Because of the developmental delay, we isolated third instar larvae at the same developmental stage, when fully developed larvae wander from the food in preparation for metamorphosis, to enable direct comparison. Rearing on HFD and HGD reduced wandering third instar larval weights compared with CFD and CGD rearing (Fig 1A and 1B). While the two control diets did not produce significant differences in weight, HFD-rearing did produce female larvae of significantly smaller weight, compared with the HGD (Fig 1A). High fructose reduced weight by 26.1% in females and 20.7% in males, whereas high glucose reduced weight by 23.5% and 18.7% in females and males, respectively.
Fig 1. High-sugar diets reduce weight, compared with control diets.
1.7 M monosaccharide diets reduced wandering third instar larval weights compared with either 0.3 M monosaccharide diet, all with adjusted P < 0.001 in females (A) or males (B) using a one-way ANOVA followed by Tukey’s multiple comparisons test. HFD modestly but significantly reduces weight by 5.5% compared with HGD rearing in female larvae (A). A 3.6% reduction in male weight between HGD and HFD was not statistically significant (B). n = 17–30 biological replicates. Error bars represent the S.E.M.
Insulin resistance is also accompanied by hyperglycemia, or increased blood glucose concentrations. Therefore, we quantified glucose levels in the Drosophila blood, known as hemolymph. Both HFD and HGD increased hemolymph glucose concentrations compared with CFD and CGD (Fig 2). However, no difference was seen between fructose and glucose on either 0.3 M diets (P = 0.2722) or 1.7 M diets (P = 0.6101)
Fig 2. Chronic high monosaccharide diet feeding leads to hyperglycemia.
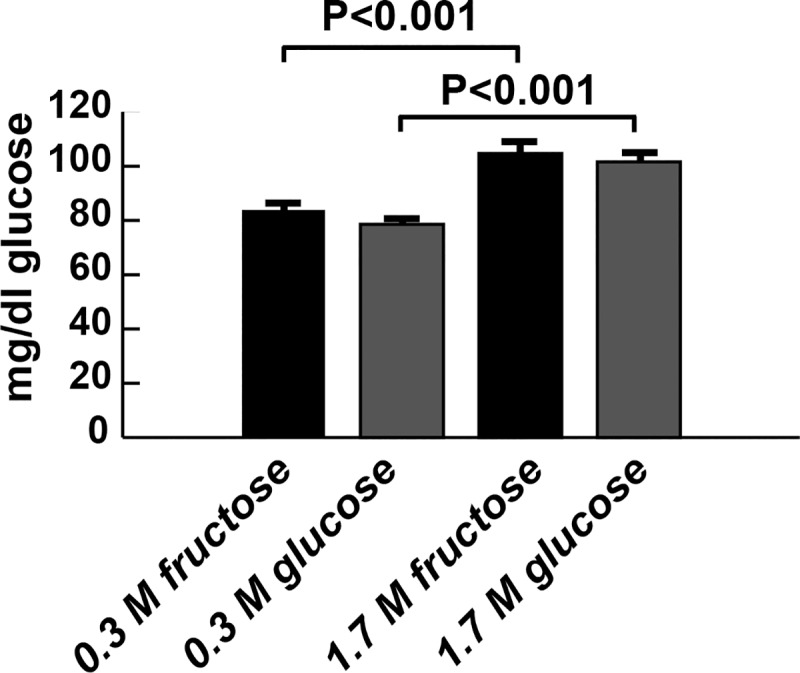
Both HFD and HGD led to hyperglycemia, compared with CFD and CGD. n ≥ 36 biological replicates. Significance was determined using a one-way ANOVA followed by Tukey’s multiple comparisons test. Error bars represent the S.E.M.
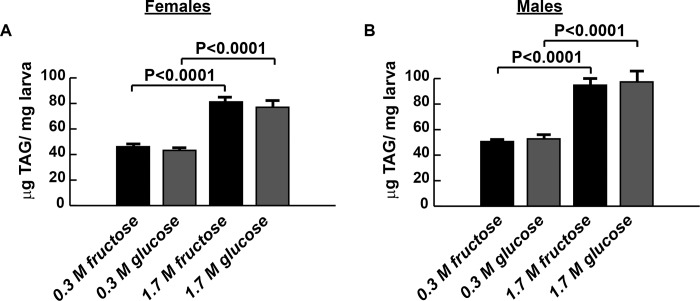
Overnutrition is associated with increased fat storage or obesity. Therefore, we quantified whole animal triacylglycerides (TAG) in larvae reared on CFD, CGD, HFD, and HGD. Like the high-sucrose diet, both HFD and HGD increased TAG concentrations (Fig 3A and 3B). As with hemolymph glucose, we saw no differences between fructose-fed and glucose-fed larval TAG content on either type of diet.
Fig 3. Chronic high monosaccharide diet feeding leads to obesity.
Both HGD and HFD 1.7 M sugar diets increased TAG concentration in wandering third instar larvae, compared with respective controls. There were no differences in TAG between fructose and glucose diets. n = 17–30 biological replicates. Significance was determined using a one-way ANOVA followed by Tukey’s multiple comparisons test. Error bars represent the S.E.M.
Insulin resistance often correlates with reduced molecular signaling activity. Insulin receptor activation leads to a cascade of phosphorylation events including the kinase Akt (also called PKB). Phosphorylation of Drosophila Akt at serine 505 is a reliable indicator of insulin signaling [29]. Phospho-Akt, in turn, exerts a negative effect on FOXO, a negative regulator of insulin-dependent growth and glucose uptake and catabolism. We quantified PO4-Akt in CFD, CGD, HFD, and HGD larval fat bodies stimulated with 1 μM recombinant human insulin as a way to measure insulin sensitivity (Fig 4). The most dramatic effects again resulted from HFD feeding: HFD caused a 50% reduction in fat body insulin sensitivity, compared with CFD-reared larvae (Fig 4). In contrast, HGD feeding did not have the same effect when compared with CGD (p > 0.5). To our surprise, the CGD led to reduced fat body insulin sensitivity, compared with the CFD. By contrast, the HFD was no more sensitive to insulin stimulation than the HGD (Fig 4). These data are not easily explained but are consistent with a model where fructose and glucose have distinct effects on insulin signaling in the Drosophila fat body.
Fig 4. Fructose reduces insulin signaling more than glucose.
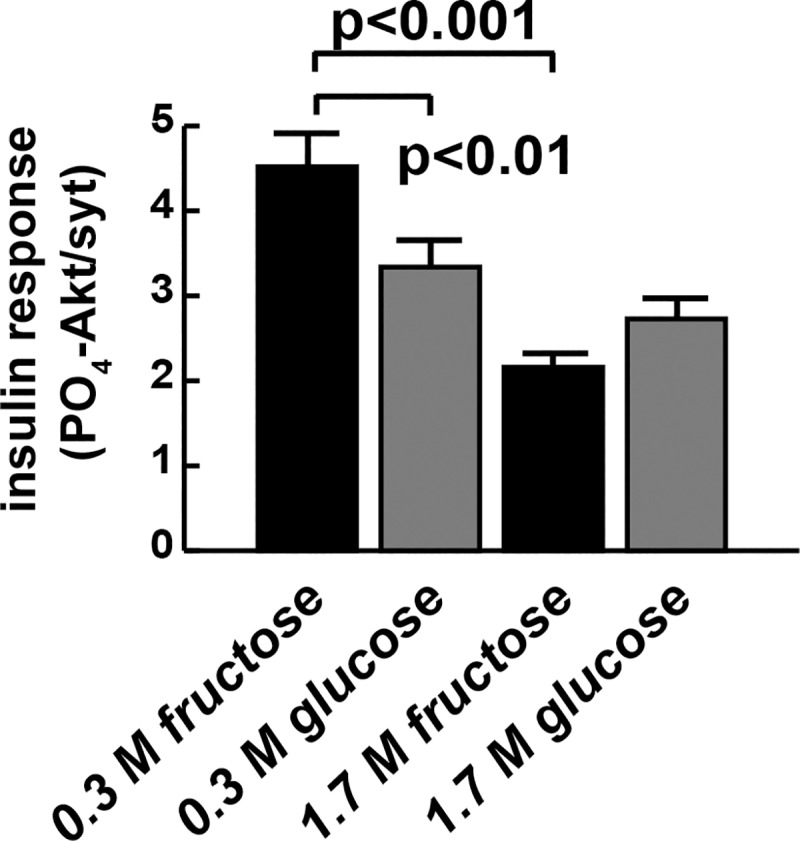
Chronic HFD (1.7 M fructose) feeding significantly increases insulin resistance, measured by Akt phosphorylation response, compared with CFD feeding (0.3 M fructose). A one-way ANOVA followed by Tukey’s multiple comparisons test was used to compare diets. n = 15 for CGD. n = 14 for HGD. n = 10 for CFD and HFD. Error bars represent the S.E.M.
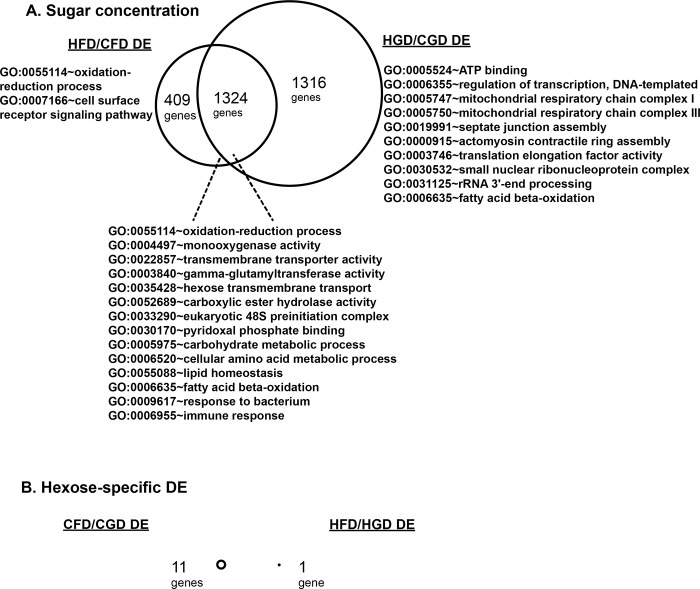
To look more closely at target tissue differences between the two sugar diets, we used RNA-seq to characterize gene expression in the larval fat body after rearing on all four diets. Fat bodies were collected from female wandering third instar larvae, RNA isolated, and Illumina Hi-Seq and differential expression analysis done by the Washington University Genome Technology Access Center. As in previous studies comparing control and high sucrose fat body, many genes were differentially expressed (DE) between control and high monosaccharide diets. For fructose, EdgeR identified 1733 DE genes between CFD and HFD, with 2641 DE genes between CGD and HGD (Fig 5, Supplemental data at GEO accession GSE121059). More than half (1324) of sugar-DE genes overlapped between the fructose and glucose datasets (Fig 5A), all of which showed the same direction of change (up- or down-regulated by high sugar). Using these data, we found that only a small number of genes were significantly DE between glucose and fructose feeding in the fat body (Fig 5, Table 1). Eleven genes were DE between CFD and CGD fat bodies. Three of the DE genes, Sgs7 (CG18087), IM3 (CG16844), and CG42798 were also DE in independent studies profiling InR targets in the fat body [24]. There was an interesting relationship between glucose and insulin signaling: each gene had the same response in high sucrose-fed InR RNAi (relative to wild-type) as it did to glucose (relative to fructose, Table 1) with constitutively active InR producing the opposite change. Thus, while both CFD and CGD appear to provide a healthy diet for flies, they do exhibit significant differences at the gene expression level in the fat body.
Fig 5. High-sugar feeding leads to effects on gene expression.
(A) Both high-sugar diets (HFD, HGD) lead to significant changes in gene expression, compared with control (CFD, CGD) diets. The enriched gene ontology (GO) categories affected included many related metabolic pathways. (B) Hexose-specific gene expression profiles contained a total of 12 differentially-expressed genes (Table 1). No GO categories were enriched in these gene lists. Three biological replicates were sequenced for each sample type and EdgeR was used to select differentially expressed genes using the negative binomial model exact test.
Table 1. Differential expression between all-glucose and all-fructose diets.
RNA-seq and differential expression analysis identified twelve DE genes with p<0.0001 and a false discovery rate under 5% for 5% w/v CFD versus CGD monosaccharide diets. For HFD and HGD (30.6%w/v monosaccharide), only one gene, CG6602, significantly differed in fat body expression level. Four of the twelve differentially expressed genes were also regulated by InR [24].
| Gene ID | Gene name | Gene description | P value | FDR | CGD/CFD | InRi FC- HS | InRCA FC |
| CG33128 | CG33128 | putative aspartic-type endopeptidase | 2.24E-05 | 0.04163 | -9.2678 | ||
| CG5767 | CG5767 | DUF725 family | 3.43E-05 | 0.04163 | -4.66179 | ||
| CG18087 | Sgs7 | Salivary gland secretion 7 | 7.33E-06 | 0.022108 | -4.40159 | -104.13091 | 5.842893 |
| CG15404 | CG15404 | 5.66E-06 | 0.022108 | -4.07992 | |||
| CG7606 | CG7606 | 2.98E-05 | 0.04163 | -3.83348 | |||
| CG42798 | CG42798 | 3.8E-05 | 0.04163 | -3.21595 | -3.4530228 | 3.878016 | |
| CG11720 | Sgs3 | Salivary gland secretion 3 | 1.34E-05 | 0.032438 | -2.8747 | ||
| CG7178 | wupA | wings up A; troponin | 3.36E-05 | 0.04163 | -2.72439 | ||
| CG33282 | CG33282 | SLC2A family; putative glucose transporter | 5.8E-06 | 0.022108 | 2.417307 | ||
| CG13075 | CG13075 | chitin metabolism | 2.49E-06 | 0.022108 | 3.852006 | ||
| CG16844 | IM3 | Immune induced molecule 3 | 3.56E-05 | 0.04163 | 7.837073 | 377.902483 | -3.26191 |
| Gene ID | Gene name | Gene description | P Value | FDR | HGD/HFD | InRi FC- LS | InRCA FC |
| CG6602 | CG6602 | 2.99E-09 | 2.88E-05 | 5.809633 | 5.96770702 | -2.5801 |
Comparing HFD to HGD, only one gene was differentially-expressed, CG6602 (Fig 5, Table 1). This gene was expressed at significantly higher levels in HGD-fed fat bodies, compared with HFD fat bodies. Interestingly, CG6602 expression did not differ between CFD and CGD (Supplemental data at GEO dataset GSE121059). Therefore, there were no overlapping genes between the two monosaccharide-dependent gene sets (Fig 5B). We observed no differential expression in CG6602 between control and high sucrose fat bodies [17,18] and CG6602 was differentially expressed in control-fed but not high-sugar-fed InR RNAi fat bodies [24]. Like some of the DE genes detected comparing CFD and CGD monosaccharide diets, we noted that this gene had a similar response to InR RNAi as it did to glucose: both increased CG6602 expression. Conversely, constitutively active InR decreased CG6602 expression (Table 1). Although not much is known about CG6602, its expression was also reduced 50% by loss of Sir2 in whole adult flies [30]. Therefore, we chose to target CG6602 in the fat body using transgenic RNA interference (RNAi). We predicted that CG6602 might be upregulated to protect larvae from adverse effects of the HGD.
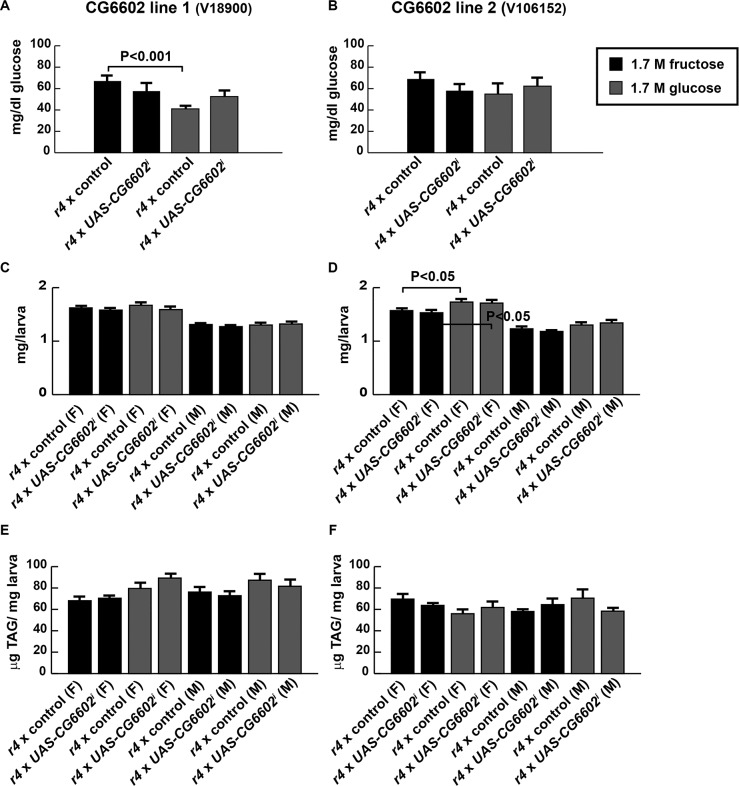
Two UAS-RNAi transgenic lines, CG6602i18900 and CG6602i106152 [31], were used to target this gene in the fat body using an r4-GAL4 driver [32] using the GAL4/UAS bipartite transgenic system [33]. A UAS-Dcr2 transgene was also used to increase the efficacy of RNAi [31]. In parallel, lines of the genetic background into which each transgene was inserted (VDRC stocks 60000 and 60100, described in methods) were crossed to driver lines to serve as controls. We compared hemolymph glucose, TAG, and weight at larval maturity for each of the four genotypes, two CG6602 RNAi and two controls, on the HFD and HGD. In general, our observations showed little difference in the responses to fructose and glucose. More severe phenotypes in high-fructose as compared with high-glucose diets occasionally reached statistical significance (6A, 6D). None of the phenotypes tested were dramatically affected by CG6602 RNAi (Fig 6A–6F). Reducing CG6602 had non-significant effects on hemolymph glucose on either high-sugar diet (Fig 6A and 6B). Neither growth nor TAG content was affected by CG6602 knockdown in larvae reared on either diet (Fig 6C–6F).
Fig 6. Minimal effects of CG6602 knockdown on high-sugar-induced phenotypes.
(A) CG6602 RNAi did not significantly affect hemolymph glucose concentrations in wandering third instar larvae, although fructose and glucose were different in one control genotype. (B) No significant differences were observed, although similar trends of sugar and CG6602 dependence occurred in both genotypes. (C) (D) No effects on larval weights were observed with CG6602 knockdown. (E) (F) No effects on larval TAG were observed with CG6602 knockdown. n ≥ 5. A one-way ANOVA followed by Tukey’s multiple comparisons test was used to compare groups. Error bars represent the S.E.M.
Discussion
Our results extend previous studies to investigate the effects of monosaccharide feeding in Drosophila larvae. In our model, high fructose is not much worse for flies than high glucose with respect to any phenotypes. Both HFD and HGD induced hyperglycemia and obesity along with hundreds of changes in gene expression. There were few changes in gene expression between glucose and fructose-containing diets. High fructose and high glucose diets led to comparable degrees of obesity and diabetes. Overall, HFD and HGD phenotypes were much like those on a high sucrose diet [5]. There were only minor differences, leading us to hypothesize that monosaccharide composition is not critical for larvae; rather, physiology depends on sugar concentration.
Recent studies have also explored the role of different monosaccharides in Drosophila [34–37]. The Lushchak group noted a range of effects of fructose and glucose on Drosophila growth, lifespan, fecundity, metabolism, and oxidative stress. For some phenotypes, there was little to no difference between the two sugars. Lifespan, feeding rate, and fecundity varied very little between the two sugars when compared at equal concentrations of up to 20% weight/volume [35] although high sugar concentration phenotypes differed from low sugar and were more severe. Both glucose and fructose similarly increased protein thiols and reduced lipid peroxides as sugar content increased from 0.25% to 10% [36]. Yet high glucose preferentially reduced mitochondrial respiratory capacity, whereas high fructose increased peroxide production, suggesting that these sugars differentially regulate catabolism [36]. Some mitochondrial phenotypes were even sex-specific [36]. In another study, the authors found that a 20% high-glucose diet led to more severe developmental delay and lethality along with hyperglycemia, compared with 20% high-fructose [34]. In young adult flies, obesity, glycogen, and trehalose accumulation were all higher, by contrast, on 20% fructose fed [34]. In our study, we found few differences comparing the CFD with CGD or the HFD with HGD. It is possible that the concentrations used overwhelmed metabolic or stress pathways and that intermediate concentrations would have revealed more monosaccharide-specific significant differences. It may also be that most fructose is converted to glucose in larvae: RNA-seq studies showed high phosphoglucose isomerase expression in the larval gut, which easily converts fructose to glucose (via their phosphorylated forms) and vice versa, depending upon substrate concentrations. It may also be that metabolic effects of fructose are more deleterious than glucose during larval development, but the effects are delayed or not apparent until young adulthood. Although high-sugar diets have reduced longevity in several studies, in a study where glucose feeding was increased more modestly (adding 10% glucose to a 1.7% sucrose diet), it led to increased adult longevity [38]. Considering the complex and numerous fates of dietary sugar, it is not surprising that the effects of fructose and glucose overload seem to depend upon genotype, sex, developmental stage, concentrations, and dietary contexts. We regularly observe significant differences among various control genetic backgrounds, and our control flies were of a different genotype (w1118 outcrosses) than those studied previously [the common Canton-S [34,36], a wild-type IF line [35,37], and another wild-type line derived from a single wild-caught female from the Vancouver area [38]]. Taken together, these studies are consistent with models where the effects of high-calorie diets depend upon genetic susceptibility and also on the balance between sugars and other dietary components.
Although thousands of DE genes were detected between control and high-sugar diets, very few DE genes could be associated with each sugar. Surprisingly, there was no overlap between the control sugar-dependent and high sugar-dependent DE genes (Fig 5B). Remarkably, only one gene (CG6602) differed between the HFD and HGD, and this gene seemed to play little role in the phenotypes tested. Several genes that were differentially expressed in CFD vs CGD were interesting, with an overlap between monosaccharide-dependent genes and insulin receptor-dependent genes [24]. The first of these, Sgs7, is a poorly-understood nuclear hormone receptor target gene, and another, IM3, encodes an immune response peptide [39]. A third monosaccharide- and insulin-dependent gene, CG42798, has no described alleles or functions. Not much is known about the roles these genes might play in metabolism and we could find no mammalian orthologs for Sgs7, IM3, CG42798, or CG6602, making them weak candidates for future study. Taken together, our data suggests that Drosophila may be of use as a model in which to study the effects of fructose and glucose on metabolism and insulin signaling.
Materials and methods
Drosophila stocks used
UAS-Dcr2 [31] was combined with r4-GAL4 [32] to express UAS-dependent transgenes in the fat body. Other stocks were from the Vienna Drosophila Resource Center (VDRC): lines 60000 (w1118, the GD line control), 60100 (KK insertion site control), and the UAS-dependent RNAi lines CG6602i18900 (GD 18900) and CG6602i106152 (KK 106152).
Fly husbandry and diet preparation
Stocks were maintained on a standard cornmeal-yeast-agar medium. For experiments, a modified Bloomington semi-defined medium was used [5] containing either 5.4% w/v fructose or glucose (0.3 M, control diets) or 30.6% w/v fructose or glucose (1.7 M, high-sugar diets) for all of the sugar. Flies were reared at 25°C on a 12 hour light, 12 hour dark cycle.
Wet weights
Wandering third instar larvae were collected, rinsed thoroughly with PBS, dried on a Kimwipe, and weighed in groups of six in a 1.5 ml tube using an analytical balance.
Triacylglyceride assays
Wandering third instar larvae were frozen in groups of six and then homogenized and assayed as described previously [5]. Briefly, animals are homogenized in PBS + 0.1% Tween, then heated at 65°C for 5 minutes to inactivate lipases. After cooling to room temp, homogenates are vortexed then added to Infinity Triglyceride assay reagent (ThermoFisher TR22421) and incubated at 37°C for five minutes. Absorbance is quantified at 540 nm against a standard curve.
Hemolymph glucose assays
Wandering third instar larvae were collected and rinsed, then hemolymph was collected and assayed as described previously [5]. Briefly, fine forceps are used to wound the animal and 6–10 larvae are combined to isolate 1–2 microliters of hemolymph. This is added to frozen Infinity Glucose Hexokinase assay reagent (ThermoFisher TR15321), then defrosted once all samples have been added and incubated for 5 minutes at 37°C. Absorbance is quantified at 340 nm against a standard curve.
Western blotting
Wandering third instar fat bodies were treated with 1 μM insulin in Schneider’s Insect Medium (both from Sigma) for 15 minutes, then fat bodies were harvested and boiled in 2x sample buffer. Approximately 3–5 fat bodies were loaded per lane. Blots were blocked and probed in TBS-T + 5% milk and incubated with primary antibodies overnight at 4°C. Antibodies #8C3 (DSHB, 1:5000) and #4054 (Cell Signaling, 1:500) were used to detect syntaxin (loading control) and PO4-Akt (at Ser505), respectively.
RNA-seq
Three biological replicates were used for each diet. Wandering third instar females were collected between 10:00 and 14:00 each day, inverted, and fat bodies isolated in 1X PBS by a combination of fine dissection and centrifugation at 15,000 x for 1 minute. Females were used because they can be prepared more quickly, have larger fat bodies, avoid the potential mistake of testes in the sample, and because some genotypes are male lethal on high-sugar diets. After fat body purity was checked by microscope, fat bodies were frozen in Tripure (Roche), then extracted and purified using chloroform, isopropanol, and Qiagen’s RNeasy columns. Ribo-Zero and library preps, sequence mapping, and differential expression analyses were done by Washington University’s Genome Technology Access Center. The samples were aligned with D. melanogaster reference genome, build Ensembl_R72, using TopHat version 2.0.9 and Bowtie 2.0, and the genes were quantitated with HTSeq version 0.5.4 (S1 Table). To select statistically significant differentially expressed genes, we used EdgeR using the negative binomial model exact test with tag wise dispersions (without a Bayesian approach) and a false discovery rate (FDR) cutoff of 5% [40]. Full raw data can be found at the NIH’s Gene Expression Omnibus (GEO) dataset GSE121059. (https://www.ncbi.nlm.nih.gov/geo/query/acc.cgi?acc=GSE121059) DAVID was used to compare differentially expressed gene sets and enriched gene ontology categories were selected as those over-represented with a p < 0.05 [41].
Supporting information
Three biological replicates were used for each sample type.
(DOCX)
Acknowledgments
We thank Eric Tycksen and the Genome Technology Access Center in the Department of Genetics at Washington University School of Medicine for help with genomic analysis. We also thank the Vienna Drosophila Resource Center and the Developmental Studies Hybridoma Bank for generating reagents to support this work.
Data Availability
Full raw expression data can be found at the NIH’s Gene Expression Omnibus (GEO) dataset GSE121059. (https://www.ncbi.nlm.nih.gov/geo/query/acc.cgi?acc=GSE121059) All other data is fully contained within the manuscript.
Funding Statement
This study was funded by the Diabetes Action Research and Education Foundation (https://diabetesaction.org/) to LPM and the Diabetes Research Training Center at Washington University (https://diabetesresearchcenter.dom.wustl.edu/) via NIH grant P60DK020579-34 to LPM. The Washington University Genome Technology Access Center is partially supported by NCI Cancer Center Support Grant #P30 CA91842 to the Siteman Cancer Center and by ICTS/CTSA Grant# UL1 TR000448. The funders had no role in study design, data collection and analysis, decision to publish, or preparation of the manuscript.
References
- 1.Softic S, Gupta MK, Wang GX, Fujisaka S, O’Neill BT, Rao TN, et al. Divergent effects of glucose and fructose on hepatic lipogenesis and insulin signaling. J Clin Invest. 2017;127: 4059–4074. 10.1172/JCI94585 [DOI] [PMC free article] [PubMed] [Google Scholar]
- 2.Stanhope KL, Schwarz JM, Keim NL, Griffen SC, Bremer AA, Graham JL, et al. Consuming fructose-sweetened, not glucose-sweetened, beverages increases visceral adiposity and lipids and decreases insulin sensitivity in overweight/obese humans. J Clin Invest. 2009;119: 1322–34. 10.1172/JCI37385 [DOI] [PMC free article] [PubMed] [Google Scholar]
- 3.Hannou SA, Haslam DE, McKeown NM, Herman MA. Fructose metabolism and metabolic disease. J Clin Invest. 2018;128: 545–555. 10.1172/JCI96702 [DOI] [PMC free article] [PubMed] [Google Scholar]
- 4.White JS. Straight talk about high-fructose corn syrup: what it is and what it ain’t. Am J Clin Nutr. 2008;88: 1716S–1721S. 10.3945/ajcn.2008.25825B [DOI] [PubMed] [Google Scholar]
- 5.Musselman LP, Fink JL, Narzinski K, Ramachandran PV, Hathiramani SS, Cagan RL, et al. A high-sugar diet produces obesity and insulin resistance in wild-type Drosophila. Dis Model Mech. 2011;4: 842–9. 10.1242/dmm.007948 [DOI] [PMC free article] [PubMed] [Google Scholar]
- 6.Pasco MY, Leopold P. High sugar-induced insulin resistance in Drosophila relies on the lipocalin Neural Lazarillo. PLoS One. 2012;7: e36583 10.1371/journal.pone.0036583 [DOI] [PMC free article] [PubMed] [Google Scholar]
- 7.Wang L, Clark AG. Physiological genetics of the response to a high-sucrose diet by Drosophila melanogaster. Biochem Genet. 1995;33: 149–65. [DOI] [PubMed] [Google Scholar]
- 8.Morris SNS, Coogan C, Chamseddin K, Fernandez-Kim SO, Kolli S, Keller JN, et al. Development of diet-induced insulin resistance in adult Drosophila melanogaster. Biochim Biophys Acta. 2012;1822: 1230–1237. 10.1016/j.bbadis.2012.04.012 [DOI] [PMC free article] [PubMed] [Google Scholar]
- 9.Rovenko BM, Kubrak OI, Gospodaryov DV, Perkhulyn NV, Yurkevych IS, Sanz A, et al. High sucrose consumption promotes obesity whereas its low consumption induces oxidative stress in Drosophila melanogaster. J Insect Physiol. 2015;79: 42–54. 10.1016/j.jinsphys.2015.05.007 [DOI] [PubMed] [Google Scholar]
- 10.Reed LK, Williams S, Springston M, Brown J, Freeman K, DesRoches CE, et al. Genotype-by-diet interactions drive metabolic phenotype variation in Drosophila melanogaster. Genetics. 2010;185: 1009–19. 10.1534/genetics.109.113571 [DOI] [PMC free article] [PubMed] [Google Scholar]
- 11.Na J, Musselman LP, Pendse J, Baranski TJ, Bodmer R, Ocorr K, et al. A Drosophila model of high sugar diet-induced cardiomyopathy. PLoS Genet. 2013;9: e1003175 10.1371/journal.pgen.1003175 [DOI] [PMC free article] [PubMed] [Google Scholar]
- 12.Mulukutla BC, Yongky A, Le T, Mashek DG, Hu W-S. Regulation of Glucose Metabolism—A Perspective From Cell Bioprocessing. Trends Biotechnol. 2016;34: 638–651. 10.1016/j.tibtech.2016.04.012 [DOI] [PubMed] [Google Scholar]
- 13.Sun SZ, Empie MW. Fructose metabolism in humans—what isotopic tracer studies tell us. Nutr Metab. 2012;9: 89 10.1186/1743-7075-9-89 [DOI] [PMC free article] [PubMed] [Google Scholar]
- 14.Han H-S, Kang G, Kim JS, Choi BH, Koo S-H. Regulation of glucose metabolism from a liver-centric perspective. Exp Mol Med. 2016;48: e218 10.1038/emm.2015.122 [DOI] [PMC free article] [PubMed] [Google Scholar]
- 15.Laughlin MR. Normal roles for dietary fructose in carbohydrate metabolism. Nutrients. 2014;6: 3117–3129. 10.3390/nu6083117 [DOI] [PMC free article] [PubMed] [Google Scholar]
- 16.Musselman LP, Kühnlein RP. Drosophila as a model to study obesity and metabolic disease. J Exp Biol. 2018;221 10.1242/jeb.163881 [DOI] [PubMed] [Google Scholar]
- 17.Musselman LP, Fink JL, Ramachandran PV, Patterson BW, Okunade AL, Maier E, et al. Role of fat body lipogenesis in protection against the effects of caloric overload in Drosophila. J Biol Chem. 2013;288: 8028–42. 10.1074/jbc.M112.371047 [DOI] [PMC free article] [PubMed] [Google Scholar]
- 18.Musselman LP, Fink JL, Maier EJ, Gatto JA, Brent MR, Baranski TJ. Seven-Up Is a Novel Regulator of Insulin Signaling. Genetics. 2018;208: 1643–1656. 10.1534/genetics.118.300770 [DOI] [PMC free article] [PubMed] [Google Scholar]
- 19.Palanker Musselman L, Fink JL, Baranski TJ. CoA protects against the deleterious effects of caloric overload in Drosophila. J Lipid Res. 2016;57: 380–387. 10.1194/jlr.M062976 [DOI] [PMC free article] [PubMed] [Google Scholar]
- 20.Geminard C, Rulifson EJ, Leopold P. Remote control of insulin secretion by fat cells in Drosophila. Cell Metab. 2009;10: 199–207. 10.1016/j.cmet.2009.08.002 [DOI] [PubMed] [Google Scholar]
- 21.Rajan A, Perrimon N. Drosophila cytokine unpaired 2 regulates physiological homeostasis by remotely controlling insulin secretion. Cell. 2012;151: 123–37. 10.1016/j.cell.2012.08.019 [DOI] [PMC free article] [PubMed] [Google Scholar]
- 22.Agrawal N, Delanoue R, Mauri A, Basco D, Pasco M, Thorens B, et al. The Drosophila TNF Eiger Is an Adipokine that Acts on Insulin-Producing Cells to Mediate Nutrient Response. Cell Metab. 2016;23: 675–684. 10.1016/j.cmet.2016.03.003 [DOI] [PubMed] [Google Scholar]
- 23.Kawamura K, Shibata T, Saget O, Peel D, Bryant PJ. A new family of growth factors produced by the fat body and active on Drosophila imaginal disc cells. Development. 1999;126: 211–219. [DOI] [PubMed] [Google Scholar]
- 24.Musselman LP, Fink JL, Grant AR, Gatto JA, Tuthill BF, Baranski TJ. The relationship between immunity and metabolism in Drosophila diet-induced insulin resistance. Mol Cell Biol. 2017. December 29;38(2) 10.1128/MCB.00259-17 [DOI] [PMC free article] [PubMed] [Google Scholar]
- 25.Böhni R, Riesgo-Escovar J, Oldham S, Brogiolo W, Stocker H, Andruss BF, et al. Autonomous control of cell and organ size by CHICO, a Drosophila homolog of vertebrate IRS1-4. Cell. 1999;97: 865–75. [DOI] [PubMed] [Google Scholar]
- 26.Shingleton AW, Das J, Vinicius L, Stern DL. The temporal requirements for insulin signaling during development in Drosophila. PLoS Biol. 2005;3: e289 10.1371/journal.pbio.0030289 [DOI] [PMC free article] [PubMed] [Google Scholar]
- 27.Tatar M, Kopelman A, Epstein D, Tu MP, Yin CM, Garofalo RS. A mutant Drosophila insulin receptor homolog that extends life-span and impairs neuroendocrine function. Science. 2001;292: 107–10. 10.1126/science.1057987 [DOI] [PubMed] [Google Scholar]
- 28.Na J, Sweetwyne MT, Park ASD, Susztak K, Cagan RL. Diet-Induced Podocyte Dysfunction in Drosophila and Mammals. Cell Rep. 2015;12: 636–647. 10.1016/j.celrep.2015.06.056 [DOI] [PMC free article] [PubMed] [Google Scholar]
- 29.Sarbassov DD, Guertin DA, Ali SM, Sabatini DM. Phosphorylation and regulation of Akt/PKB by the rictor-mTOR complex. Science. 2005;307: 1098–1101. 10.1126/science.1106148 [DOI] [PubMed] [Google Scholar]
- 30.Palu RAS, Thummel CS. Sir2 Acts through Hepatocyte Nuclear Factor 4 to maintain insulin Signaling and Metabolic Homeostasis in Drosophila. PLoS Genet. 2016;12: e1005978 10.1371/journal.pgen.1005978 [DOI] [PMC free article] [PubMed] [Google Scholar]
- 31.Dietzl G, Chen D, Schnorrer F, Su KC, Barinova Y, Fellner M, et al. A genome-wide transgenic RNAi library for conditional gene inactivation in Drosophila. Nature. 2007;448: 151–6. 10.1038/nature05954 [DOI] [PubMed] [Google Scholar]
- 32.Lee G, Park JH. Hemolymph sugar homeostasis and starvation-induced hyperactivity affected by genetic manipulations of the adipokinetic hormone-encoding gene in Drosophila melanogaster. Genetics. 2004;167: 311–23. [DOI] [PMC free article] [PubMed] [Google Scholar]
- 33.Brand AH, Manoukian AS, Perrimon N. Ectopic expression in Drosophila. Methods Cell Biol. 1994;44: 635–54. [DOI] [PubMed] [Google Scholar]
- 34.Rovenko BM, Perkhulyn NV, Gospodaryov DV, Sanz A, Lushchak OV, Lushchak VI. High consumption of fructose rather than glucose promotes a diet-induced obese phenotype in Drosophila melanogaster. Comp Biochem Physiol A Mol Integr Physiol. 2015;180: 75–85. 10.1016/j.cbpa.2014.11.008 [DOI] [PubMed] [Google Scholar]
- 35.Lushchak OV, Gospodaryov DV, Rovenko BM, Yurkevych IS, Perkhulyn NV, Lushchak VI. Specific dietary carbohydrates differentially influence the life span and fecundity of Drosophila melanogaster. J Gerontol A Biol Sci Med Sci. 2014;69: 3–12. 10.1093/gerona/glt077 [DOI] [PubMed] [Google Scholar]
- 36.Rovenko BM, Kubrak OI, Gospodaryov DV, Yurkevych IS, Sanz A, Lushchak OV, et al. Restriction of glucose and fructose causes mild oxidative stress independently of mitochondrial activity and reactive oxygen species in Drosophila melanogaster. Comp Biochem Physiol A Mol Integr Physiol. 2015;187: 27–39. 10.1016/j.cbpa.2015.04.012 [DOI] [PubMed] [Google Scholar]
- 37.Lushchak OV, Rovenko BM, Gospodaryov DV, Lushchak VI. Drosophila melanogaster larvae fed by glucose and fructose demonstrate difference in oxidative stress markers and antioxidant enzymes of adult flies. Comp Biochem Physiol A Mol Integr Physiol. 2011;160: 27–34. 10.1016/j.cbpa.2011.04.019 [DOI] [PubMed] [Google Scholar]
- 38.Galenza A, Hutchinson J, Campbell SD, Hazes B, Foley E. Glucose modulates Drosophila longevity and immunity independent of the microbiota. Biol Open. 2016;5: 165–173. 10.1242/bio.015016 [DOI] [PMC free article] [PubMed] [Google Scholar]
- 39.Uttenweiler-Joseph S, Moniatte M, Lagueux M, Van Dorsselaer A, Hoffmann JA, Bulet P. Differential display of peptides induced during the immune response of Drosophila: a matrix-assisted laser desorption ionization time-of-flight mass spectrometry study. Proc Natl Acad Sci U S A. 1998;95: 11342–11347. 10.1073/pnas.95.19.11342 [DOI] [PMC free article] [PubMed] [Google Scholar]
- 40.Robinson MD, McCarthy DJ, Smyth GK. edgeR: a Bioconductor package for differential expression analysis of digital gene expression data. Bioinforma Oxf Engl. 2010;26: 139–140. 10.1093/bioinformatics/btp616 [DOI] [PMC free article] [PubMed] [Google Scholar]
- 41.Huang DW, Sherman BT, Lempicki RA. Systematic and integrative analysis of large gene lists using DAVID bioinformatics resources. Nat Protoc. 2009;4: 44–57. 10.1038/nprot.2008.211 [DOI] [PubMed] [Google Scholar]
Associated Data
This section collects any data citations, data availability statements, or supplementary materials included in this article.
Supplementary Materials
Three biological replicates were used for each sample type.
(DOCX)
Data Availability Statement
Full raw expression data can be found at the NIH’s Gene Expression Omnibus (GEO) dataset GSE121059. (https://www.ncbi.nlm.nih.gov/geo/query/acc.cgi?acc=GSE121059) All other data is fully contained within the manuscript.


