

Abstract
Context:
More than 80% of Americans live in urban areas. Over the past 20 years, an increasing number of local governmental public health departments, particularly those in big cities, have taken pioneering action to improve population health. This article focuses on members of the Big Cities Health Coalition (BCHC) who participated in the 2017 Public Health Workforce Interest and Needs Survey (PH WINS). If the impact of these health departments is to be sustained, they will require a workforce prepared for the challenges of 21st-century public health practice.
Objective:
To characterize workforce interests and needs among staff in 26 large, urban health departments who are BCHC members.
Design:
Administered PH WINS survey to staff in BCHC member health departments to assess perceptions about the workplace environment and job satisfaction; training needs; awareness of national trends; and demographics.
Setting:
In total, 26 of 30 BCHC member health departments, United States.
Participants:
In total, 7453 of 17 613 staff members (response rate 43.4%) from participating departments.
Results:
The workforce consists predominantly of women (75%) and people of color (68%). Staff is satisfied with their job (81%), the organization (71%), and pay (59%), but more than a quarter are considering leaving within the year. The agency's mission drives staff, but it lacks an environment fostering creativity and innovation. Training needs include budgeting/financial management, change management, and strategic thinking.
Conclusions:
BCHC departments must improve retention, provide opportunities for advancement, enhance communication between leadership and staff, foster creativity and innovation, and align labor allocation with disease burden in local communities. Findings from the second iteration of PH WINS allow a comprehensive, comparable analysis of the workforce across the 26 BCHC member health departments that participated. These data expand upon the ability to assess and monitor improvement in the workforce environment, job satisfaction, awareness of national trends, and training needs.
Keywords: cities, local health departments, public health workforce
The United States continues to urbanize. Today, more than 80% of Americans live in urban areas, which account for only 3% of the nation's land mass.1 This concentration of population gives the nation's largest, most urban health departments (HDs) an outsized impact on the health of the nation. However, improving health status is made more difficult by greater income inequality, lack of housing affordability, and other social, economic, and environmental challenges affecting cities.1
The Big Cities Health Coalition (BCHC) was created in 2002 to be a forum for leaders of the nation's largest city (or in some cases, county) governmental HDs serving its most urban areas to exchange strategies and align resources and policy priorities to jointly address their unique health challenges.2 Together, these public health officials impact the health and well-being of 55 million, or 1 in 6, Americans. The founding and current operating assumption of the BCHC is that through strong leadership, collaboration, and policy innovation, BCHC member HDs will impact not only those they serve directly but also those in communities across the country by spreading and scaling best and promising practices.
Over the past decade, BCHC HDs have taken pioneering action to address health issues such as rising obesity rates, coronary heart disease, tobacco initiation among youth, and the opioid epidemic. For example, in 1997, in response to public outcry stemming from a foodborne illness outbreak, the Los Angeles County Health Department implemented a restaurant inspection grading system that required public posting of letter grades (A, B, C).3 Today, restaurant grading has become a standard in cities across the nation.3 In the mid- to late-2000s, New York City (NYC) became the first jurisdiction in the United States to require calories to be posted on restaurant menus and ban the use of partially hydrogenated oil in city restaurants.4,5 Following NYC's lead, a number of cities and states and 40 national restaurant chains also restricted use of artificial trans-fat. This pioneering work led to national policy change when the US Food and Drug Administration implemented a rule to require chain restaurants to disclose calorie information on menus6 and also ordered food manufacturers to remove partially hydrogenated oil from products by 2018.7
Cities continue to explore innovative challenges to the nation's most pressing challenges. San Antonio, through the leadership of the HD director, recently became the first city in Texas to pass a Tobacco 21 law, raising the minimum age for sale of tobacco products from 18 to 21 years.8 Several BCHC member jurisdictions, including Seattle and King County, NYC, San Francisco, and Philadelphia, at the urging of their elected officials and in partnership with other municipal agencies, are pursuing harm reduction strategies to stem the tide of the opioid epidemic. Under the direction of local elected officials, Public Health Seattle and King County is working to establish “Community Health Engagement Locations,” which are supervised sites to promote safer consumption of substances and immediate treatment when overdoses occur, as well as access to multiple health and social services required to reduce harm and promote health for individuals experiencing substance use disorder.9 These are just a few examples to demonstrate the ability of BCHC HDs to influence public health policy and spur innovation across the country.
If the impact of the BCHC HDs is to continue and expand, they will require a fully competent workforce with the skills, knowledge, and abilities necessary for 21st-century public health practice. Just as an understanding of common problems has led to collaboration on some of the nation's most pressing health challenges, an understanding of BCHC member HDs' workforce development challenges could bring an equal sense of urgency and cooperation. Although some departments conduct their own workforce assessments, they are not standardized and they rarely share similar administration protocols or questions, rendering comparisons nearly impossible.10 However, in 201411 and 2017, the Public Health Workforce Interests and Needs Survey (PH WINS) was fielded as a common assessment in which BCHC HDs were asked to participate. In the most recent wave, 26 of the 30 participated, an increase from 14 participating HDs in 2014.
The purpose of this article is to provide a cross-sectional description of the workforce in BCHC HDs and to characterize perceptions of the workplace environment, job satisfaction, training needs, and awareness of national trends in public health practice.
Methods
Conducted first in 2014 and again in 2017, PH WINS characterizes the perceptions of state and local governmental public health employees in the United States. The full methodology is described elsewhere.12 The survey was fielded via a Web-based interface to more than 100 000 staff members in fall/winter 2017. This article draws from a subsample of the 2017 fielding, focusing on BCHC member HDs. In 2017, all BCHC member HDs (n = 30) were invited to participate. Twenty-six directors/commissioners consented to their respective agencies participation. Each HD then provided e-mail addresses of staff. The PH WINS team directly e-mailed survey invitations, as well as 5 reminders over the course of 8 weeks, to 17 158 staff members. An additional 455 e-mails were sent out to staff who had bad contact information initially (n = 17 613 in total).* The response rate for the BCHC subsample of PH WINS 2017 was 43.4% (n = 7453). As such, the perspectives of respondents discussed herein reflect less than half the workforce in BCHC member HDs.
The instrument focused on 4 domains: (1) perceptions about the workplace environment and job satisfaction; (2) training needs; (3) awareness of national trends; and (4) demographics. The training needs assessment identified critical skills that were grouped into 1 of 8 focus areas: (1) Effective Communication; (2) Data for Decision Making; (3) Cultural Competence; (4) Budget and Financial Management; (5) Change Management; (6) Systems and Strategic Thinking; (7) Developing a Vision for a Healthy Community; and (8) Cross-Sectoral Partnerships. Staff indicated both the importance of and their proficiency level in specific skills aligned with each focus area. Skill gaps were defined as when respondents not only judged a skill as being “somewhat” or “very” important in their day-to-day work but also judged themselves as being a “beginner” or “unable to perform” the skill. Similarly, a focus area was identified as having a gap if respondents had a gap in any skill associated within that focus area. This article provides descriptive statistics as well as bivariate comparisons by supervisory status and job classification. Rao-Scott χ2 and Tukey's test for multiple comparisons were utilized as appropriate. Agency-based nonresponse adjustments were performed utilizing balanced repeated replication weights. All data were managed and analyzed in Stata 15.1 (StataCorp LLC, College Station, Texas).
Results
Characterizing the BCHC public health workforce
Respondents were racially and ethnically diverse (Table 1), with more than two-thirds being people of color. Although two-thirds of supervisors were also people of color, only about half of executives were nonwhite. While three-fourths of respondents were female (95% CI, 73%-77%), only two-thirds (66%) of those who self-identified as executives were women (95% CI, 53%-76%); this gender distribution was statistically significant for nonsupervisors compared with executives (P = .028). The average age was 45.9 years (95% CI, 45.0%-46.8%). Twenty-eight percent of respondents (95% CI, 26%-30%) were 55 years or older.
TABLE 1. Demographic and Workforce Characteristics of BCHC Staff in 2017.
| Estimate (95% CI) | |
|---|---|
| Gender | |
| Male | 24% (21%-27%) |
| Female | 75% (73%-77%) |
| Nonbinary | 1% (1%-1%) |
| Race/ethnicity | |
| American Indian or Alaska Native | 0% (0%-1%) |
| Asian | 12% (8%-19%) |
| Black or African American | 22% (16%-29%) |
| Hispanic or Latino | 26% (20%-32%) |
| Native Hawaiian/Pacific Islander | 1% (0%-1%) |
| White | 32% (23%-44%) |
| ≥2 races | 7% (6%-7%) |
| Age | |
| Up to 25 y | 3% (2%-4%) |
| 26-35 y | 22% (18%-25%) |
| 36-45 y | 27% (27%-29%) |
| 46-55 y | 27% (26%-29%) |
| 56-65 y | 21% (19%-24%) |
| 66-75 y | 3% (3%-4%) |
| ≥76 y | 0% (0%-0%) |
| Job classification | |
| Administrative/clerical | 35% (30%-40%) |
| Clinical and Lab | 23% (21%-26%) |
| Public Health Sciences | 33% (29%-37%) |
| Social Sciences and All Other | 9% (7%-11%) |
| Program area | |
| Chronic Disease and Injury Prevention | 5% (4%-6%) |
| Communicable Disease | 12% (11%-14%) |
| Environmental Health | 11% (8%-15%) |
| Maternal/Child Health | 11% (7%-17%) |
| Other Health Care | 8% (6%-10%) |
| All Hazards | 1% (1%-2%) |
| Assessment | 8% (6%-10%) |
| Communications | 4% (3%-5%) |
| Organizational Competencies | 13% (10%-16%) |
| Other | 28% (26%-30%) |
| Supervisory status | |
| Nonsupervisor | 73% (71%-76%) |
| Supervisor | 16% (14%-18%) |
| Manager | 8% (6%-11%) |
| Executive | 2% (2%-3%) |
| Tenure in current position | |
| 0-5 y | 59% (55%-63%) |
| 6-10 y | 16% (14%-17%) |
| 11-15 y | 10% (9%-11%) |
| 16-20 y | 8% (7%-10%) |
| ≥21 y | 7% (5%-8%) |
| Tenure in current agency | |
| 0-5 y | 43% (38%-48%) |
| 6-10 y | 17% (16%-18%) |
| 11-15 y | 14% (12%-15%) |
| 16-20 y | 13% (11%-14%) |
| ≥21 y | 14% (12%-17%) |
| Tenure in public health practice | |
| 0-5 y | 30% (27%-34%) |
| 6-10 y | 18% (16%-20%) |
| 11-15 y | 15% (14%-16%) |
| 16-20 y | 14% (13%-16%) |
| ≥21 y | 22% (20%-25%) |
| Tenure in management | |
| 0-5 y | 31% (26%-35%) |
| 6-10 y | 22% (19%-25%) |
| 11-15 y | 19% (16%-21%) |
| 16-20 y | 14% (11%-17%) |
| ≥21 y | 15% (13%-17%) |
| Educational attainment | |
| No college degree | 16% (14%-19%) |
| Associate | 11% (9%-12%) |
| Bachelor's | 36% (33%-39%) |
| Master's | 31% (29%-33%) |
| Doctoral | 6% (5%-7%) |
| Any degree in public health | |
| (Any level) | 19% (17%-21%) |
| Bargaining unit/union | |
| Yes | 51% (39%-63%) |
| No | 49% (37%-61%) |
| Full-time position | |
| Yes | 95% (92%-97%) |
| No | 5% (3%-8%) |
Abbreviations: BCHC, Big Cities Health Coalition; CI, confidence interval.
With nearly three-fourths of respondents (73%; 95% CI, 71%-76%) being nonsupervisory, these results reflect the perceptions of the “rank and file” workers in BCHC member HDs. Overall, about one-third of the BCHC workforce characterized itself as “administrative/clerical,” a third as “public health sciences,” a quarter “clinical/lab,” and the remainder as “social services/all other.” Those with less than a college degree tended to fall into the administrative/clerical category (64%; 95% CI, 55%-73%). The majority of responding staff indicated that they were full-time (95%; 95% CI, 92%-97%), and half were part of a Bargaining unit/union (51%; 95% CI, 39%-63%).
About one-third of respondents worked in the foundational areas of public health practice on communicable disease (12%), environmental health (11%), and maternal and child health (11%).13 Only 5% worked in chronic disease or injury prevention (e.g., obesity, diabetes, drug overdose, and tobacco). Table 1 outlines a number of these demographic and workforce characteristics.
Tenure, job satisfaction, and intent to leave
On average, respondents worked in their current job for 7.2 years (95% CI, 6.5%-7.9%), current agency for 10.3 years (95% CI, 9.4%-11.3%), and public health practice for 13.2 years (95% CI, 12.5%-13.9%). Approximately 59% had been in their current job for 5 years or less, and 7% had been in their job for 21 years or more. A quarter of respondents (26%) had been in the same position 6 to 15 years. This was driven in part by administrative/clerical staff who tended to have longer tenure than other job classifications of the workforce—nearly 80% had been in their positions for 6 to 15 years.
Overall, 81% of respondents were somewhat or very satisfied with their job (95% CI, 79%-83%), 74% with their job security (95% CI, 69%-79%), 71% with their organization (95% CI, 67%-75%), and 59% with their pay (95% CI, 53%-65%). Compared with executives, nonsupervisors had lower job satisfaction (92% vs 80%, P = .01) and pay satisfaction (72% vs 58%, P = .042). Among supervisors and managers,† 84% (95% CI, 81%-87%) and 82% (95% CI, 78%-86%), respectively, were somewhat or very satisfied with their jobs, and 60% of supervisors (95% CI, 52%-67%) and 67% of managers (95% CI, 58%-75%) were somewhat/very satisfied with their pay.
Despite relatively strong satisfaction, more than a quarter of respondents (28%; 95% CI, 26%-30%)—excluding those planning to retire—were considering leaving their organization within the year. Intent to leave did not differ significantly by supervisory status (nonsupervisors, 28%; supervisors, 26%; managers, 29%; and executives, 27%). Of those considering leaving in the next year for reasons other than retirement, 22% would do so for another job in governmental public health (95% CI, 16%-28%), 12% for another governmental job not in public health (95% CI, 10%-15%), 8% for a nongovernmental public health job (95% CI, 5%-12%), and 8% for a job that is in neither government nor public health (95% CI, 5%-11%). In addition, 37% (95% CI, 34%-41%) planned to leave in the next year for other (unspecified) reasons.
About 19% of respondents were planning to retire within 5 years (95% CI, 18%-21%), with slightly more managers and executives saying so: 29% of managers (95% CI, 23%-35%) and 32% of executives (95% CI, 24%-41%) compared with 22% of supervisors (95% CI, 20%-24%) and 17% of nonsupervisors (95% CI, 16%-19%). Forty-two percent of respondents were considering leaving in the next year or retiring within 5 years (95% CI, 40%-44%); this did not differ by job classification.
Lack of opportunities for advancement (46%; 95% CI, 42%-51%), followed by pay (41%; 95% CI, 32%-49%), and workplace environment (35%; 95% CI, 32%-38%) were the most common reasons for intending to leave. Some differences were observable by supervisory status but were generally not statistically significantly different (Figure 1).
FIGURE 1.
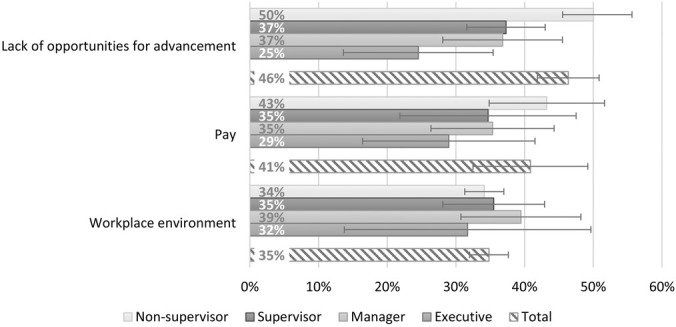
Top Three Reasons for Considering Leaving, by Supervisory Status
Note: Percentages reflect percent of staff selecting item as reason for considering leaving.
Workplace environment
Respondents indicated their perceptions about a number of workplace environment items including statements about themselves, their supervisor, and their HD (Table 2). They were clear about their mission, with nearly 89% saying they knew how their individual work related to the agency's goals and priorities (95% CI, 87%-90%) and that their work was important (95%; 95% CI, 94%-96%). Almost all respondents were determined to give their best effort at work every day (strongly agreed; 94%, agreed; 95% CI, 93%-95%). However, there were also challenges. Just less than half of respondents thought creativity and innovation were rewarded (45%; 95% CI, 43%-48%) or that communication between senior leadership and employees was good (48%; 95% CI, 44%-52%).
TABLE 2. Perceptions of Workplace Environment, by Supervisory Status.
| Nonsupervisor % (95% CI) | Supervisor % (95% CI) | Manager % (95% CI) | Executive % (95% CI) | |
|---|---|---|---|---|
| About me | ||||
| I know how my work relates to the agency's goals and priorities | 88% (86%-90%) | 91% (89%-93%) | 92% (88%-95%) | 98% (95%-100%) |
| The work I do is important | 94% (94%-95%) | 96% (95%-97%) | 96% (94%-97%) | 97% (95%-100%) |
| I feel completely involved in my work | 81% (80%-83%) | 86% (83%-89%) | 84% (80%-87%) | 92% (86%-98%) |
| I am determined to give my best effort at work every day | 94% (93%-95%) | 95% (93%-97%) | 96% (94%-98%) | 97% (94%-100%) |
| My training needs are assessed | 56% (50%-61%) | 55% (48%-61%) | 46% (39%-52%) | 46% (38%-54%) |
| I have had opportunities to learn and grow in my position | 66% (64%-69%) | 78% (74%-81%) | 79% (75%-84%) | 85% (80%-91%) |
| I am satisfied that I have the opportunities to apply my talents and expertise | 66% (63%-69%) | 75% (72%-79%) | 74% (69%-79%) | 83% (76%-90%) |
| About the organization | ||||
| Creativity and innovation are rewarded | 44% (41%-46%) | 48% (45%-52%) | 51% (42%-59%) | 64% (56%-71%) |
| Communication between senior leadership and employees is good in my organization | 48% (43%-52%) | 49% (44%-53%) | 47% (39%-55%) | 57% (42%-71%) |
| Supervisors/team leaders work well with employees of different backgrounds | 70% (67%-73%) | 79% (76%-82%) | 73% (67%-78%) | 77% (67%-87%) |
| Supervisors/team leaders in my work unit support employee development | 68% (66%-71%) | 78% (74%-82%) | 79% (74%-85%) | 82% (72%-91%) |
| Employees have sufficient training to fully utilize technology needed for their work | 55% (51%-60%) | 55% (50%-61%) | 47% (41%-54%) | 43% (35%-51%) |
| Employees learn from one another as they do their work | 82% (80%-84%) | 85% (82%-87%) | 83% (79%-87%) | 88% (81%-95%) |
| I recommend my organization as a good place to work | 71% (68%-74%) | 75% (70%-79%) | 73% (67%-79%) | 83% (76%-90%) |
| About my supervisor | ||||
| My supervisor and I have a good working relationship | 81% (79%-83%) | 86% (84%-88%) | 83% (79%-87%) | 87% (84%-91%) |
| My supervisor treats me with respect | 82% (81%-84%) | 85% (83%-88%) | 85% (81%-88%) | 88% (84%-91%) |
| My supervisor provides me with opportunities to demonstrate my leadership skills | 63% (60%-65%) | 81% (78%-84%) | 81% (77%-85%) | 86% (81%-92%) |
Abbreviation: CI, confidence interval.
Notable differences were observed between nonsupervisors and other staff, the most extreme of which was seen when nonsupervisors were compared with executives. Statistically significant differences in perceptions regarding opportunities to both learn and grow in their position (66% vs 85%; P < .001) and apply their talents and expertise (66% vs 83%; P < .001) were observed.
Training needs
Respondents indicated their perceptions regarding the importance of more than 20 individual skills to their day-to-day work, as well as their ability to accomplish each. Items were grouped into 8 categories (Table 3). Skill or knowledge “gaps” were said to exist when respondents indicated that any one item in the category was “somewhat” or “very important” and that they were “unable to perform” or were a “beginner” at that skill. Categories with gaps for nonsupervisors and supervisors/managers included “budget and financial management” (55% overall; 95% CI, 52%-59%), “change management” (44%; 95% CI, 41%-47%), and “systems and strategic thinking” (48%; 95% CI, 44%-52%). Substantial differences were observed across tiers, and, on average, executives had fewer gaps in the categories. Notably, about 40% of executives said they need training in budget and financial management (39%; 95% CI, 28%-49%) and systems and strategic thinking (43%; 95% CI, 29%-58%).
TABLE 3. Categories of Skill Gaps and Training Needs, by Supervisory Status.
| Category | Percent Who Said Skill/Ability Was Important But Proficiency Was Low | ||
|---|---|---|---|
| Nonsupervisors % (95% CI) | Supervisors/Managers % (95% CI) | Executives % (95% CI) | |
| Effective Communication | 19% (17%-21%) | 15% (12%-17%) | 10% (1%-19%) |
| Data for Decision-Making | 29% (26%-32%) | 27% (25%-30%) | 12% (7%-18%) |
| Cultural Competency/Competence | 29% (26%-33%) | 37% (33%-41%) | 25% (17%-33%) |
| Budget and Financial Management | 55% (51%-60%) | 56% (54%-59%) | 39% (28%-49%) |
| Change Management | 46% (43%-50%) | 41% (37%-44%) | 26% (17%-35%) |
| Systems and Strategic Thinking | 45% (41%-49%) | 56% (54%-59%) | 43% (29%-58%) |
| Developing a Vision for a Healthy Community | 43% (39%-47%) | 49% (46%-52%) | 34% (23%-44%) |
| Cross-Sectoral Partnerships | 36% (32%-39%) | 37% (34%-39%) | 24% (16%-31%) |
Abbreviation: CI, confidence interval.
National trends and the social determinants of health
Respondents were asked about their awareness and perceptions of 6 emerging concepts in public health (Table 4). With the exception of Health in All Policies (HiAP), about three-fourths of respondents had heard of each concept. There was substantial variation in perceived impact of the trend on the respondent's day-to-day work. Nonsupervisors were much less likely to have heard of a given concept than other staff and somewhat less likely, for each item, to indicate it impacted their work.
TABLE 4. Awareness and Perceptions of Emerging Concepts in Public Health, by Supervisory Status.
| Concept | Nonsupervisor | Supervisor/Manager/Executive | Total | |||
|---|---|---|---|---|---|---|
| Heard of Concept % (95% CI) | Concept Impacts Day-to-Day Work Fair Amount/Great Deal % (95% CI) | Heard of Concept % (95% CI) | Concept Impacts Day-to-Day Work Fair Amount/Great Deal % (95% CI) | Heard of Concept % (95% CI) | Concept Impacts Day-to-Day Work Fair Amount/Great Deal % (95% CI) | |
| Cross-jurisdictional sharing of public health services | 75% (72%-78%) | 56% (52%-61%) | 83% (80%-86%) | 58% (55%-60%) | 77% (74%-80%) | 56% (53%-60%) |
| Fostering a culture of quality improvement | 83% (78%-87%) | 69% (66%-72%) | 92% (90%-94%) | 80% (76%-83%) | 86% (82%-88%) | 72% (69%-74%) |
| Public health and primary care integration | 81% (79%-83%) | 57% (53%-61%) | 88% (85%-90%) | 59% (55%-62%) | 83% (80%-85%) | 57% (54%-60%) |
| Evidence-based public health practice | 83% (80%-85%) | 66% (65%-68%) | 91% (88%-93%) | 72% (70%-73%) | 85% (83%-87%) | 68% (66%-69%) |
| Health in All Policies | 65% (60%-69%) | 54% (50%-58%) | 72% (68%-76%) | 56% (52%-59%) | 66% (61%-71%) | 54% (51%-57%) |
| Multisectoral collaboration | 72% (69%-75%) | 62% (58%-66%) | 83% (80%-85%) | 70% (67%-72%) | 75% (72%-78%) | 64% (61%-67%) |
Abbreviation: CI, confidence interval.
Respondents were also asked how involved they thought their agency should be in several “nonhealth” areas that, broadly speaking, comprise the social determinants of health, including education, the economy, housing, and transportation (Appendix Table). Large majorities across all levels of the workforce thought that their HD should be involved in affecting K-12 education (66%; 95% CI, 62%-70%), the economy (64%; 95% CI, 60%-68%), the built environment (61%; 95% CI, 57%-66%), housing (70%; 95% CI, 66%-74%), and transportation quality (62%; 95% CI, 57%-67%). Furthermore, 80% thought their HD should be involved in the quality of social support systems (95% CI, 76%-84%) and health equity (88%; 95% CI, 84%-90%). This differed substantially by supervisory status. Ascending supervisory status was uniformly associated with an increased frequency of indicating that the agency ought to be somewhat/very involved in a given area. Executives felt most strongly about their HD's involvement, with agreement ranging from a low of 79% saying they should help affect the economy to a high of 98% saying their work should affect health equity.
Discussion
The nation's largest, most urban HDs (BCHC member HDs) will continue to have an outsized impact on our evolving ability to improve health. Ensuring a skilled and competent workforce should be a central strategy for maintaining and improving the nation's health. These data identify some immediate workforce needs to be addressed. If they are not, the nation risks its ability to protect and promote the health of the 55 million Americans served by the BCHC HDs. However, developing and maintaining a skilled public health workforce require a diverse and sometimes different set of skills to be held by leaders in governmental public HDs. Leaders will need to develop strategies to ensure that workforce development is done in partnership with those who have the requisite skills. Just as a public health leader would not ignore a disease outbreak, these data should be approached with the same seriousness and with a focus on both prevention and response. Training alone is not enough to reorient the public health system for 21st-century health problems; shifts in focus and/or thinking are also needed.
Retirement and retention
Previous studies that explored the potential for vacancies in the workforce focused on the large number of governmental public health workers who were retirement-eligible.14 This survey found that 17% of the workforce intends to retire by 2022. Excluding retirement, an additional 28% report intending to leave in the next year. Almost a quarter (24%) of the workforce is considering leaving governmental public health, and 7% of the workforce is considering leaving for another governmental public health job, with the rest planning to remain. Thus, while individual HDs need to address retention, investments in building staff skills and knowledge will benefit the public health field writ large.
Routine turnover of the BCHC workforce, coupled with fierce competition for skilled public health workers in urban areas, makes hiring a challenge. Declining budgets can cause vacated positions to remain unfilled or underfilled (ie, hiring at a lower salary/experience level). Proactive workforce development strategies are paramount. Stretch assignments (in which an employee takes on a challenging new task, project, or role that is beyond his or her knowledge or skill level in order to “stretch” and grow), formal mentoring programs, job enrichment, shadowing, and/or detailing staff into temporary assignments must be prioritized. These strategies not only support succession planning15 but also can bolster employee satisfaction. Changes in satisfaction and perceptions about growth opportunities can be measured by reassessing employee agreement, especially among nonsupervisors, with the following statements: “I have had opportunities to learn and grow in my position,” “I am satisfied that I have the opportunities to apply my talents and expertise,” and “Supervisors/team leaders in my work unit support employee development.” Also, as HDs develop and implement recruitment and retention strategies, there is an opportunity to address disparities in those who work their way up the leadership ranks, by focusing on recruiting and/or promoting women and other underrepresented groups into executive positions.
Communication
Communication stands out as an area in need of improvement. Among executives in BCHC member HDs, 57% agreed or strongly agreed with the following statement: “Communication between senior leadership and employees is good in my organization.” Agreement did not exceed 50% for any other group. The Boston Public Health Commission (Commission) identified this challenge in its agency based on PH WINS 2014 data. Through an implementation project supported by the PH WINS Research to Action learning collaborative,16 Boston initiated a series of quality improvement processes using a “PDSA cycle”17 approach to improve its internal communication. It developed a plan to test certain interventions for change (“Plan”); carried out the test (“Do”); observed and learned from the consequences (“Study”); and determined what modifications should be made (“Act”). After several PDSA cycles, the Commission thoughtfully analyzed the results and implemented a set of interventions. For example, electronic bulletin boards were installed to more consistently disseminate announcements across multiple facilities, an electronic suggestion box was created for staff feedback, the Executive Director launched a weekly e-mail to all staff members, and an internal communications plan was developed and implemented.18 In less than 3 years, PH WINS 2017 results showed measurable improvement in the percentage of nonsupervisory staff who agreed or strongly agreed that communication with senior leadership was good, increasing from 33% in 2014 to 43% in 2017.19
Creativity
Public health workers are skilled, motivated, mission-driven people who use a combination of creativity, abilities, talent, skills, and knowledge to solve problems. In 1959, Peter Drucker20 described this kind of worker as a “knowledge worker.” Although creativity is key for the knowledge worker, less than half of respondents agreed or strongly agreed with the statement “Creativity and innovation are rewarded.” Moving this metric will take concerted effort on the part of BCHC member HD leadership to develop and deploy specific strategies to increase creativity across the workforce. One example could be the creation of multidisciplinary “strike” teams to solve complex problems and harness this desire for creativity. Often a simple change in practice can cultivate a work environment that promotes sharing creative thoughts and actions, which can be difficult in a government environment.
Cross-disciplinary work exposes participants to new thought models and problem-solving paradigms, often leading to creative outcomes that would not have been recognized otherwise. BCHC member HDs such as Chicago and San Francisco have invested in and named innovation as departmental priorities. Chicago, for example, created “Foodborne Chicago,” building on the first-ever open-source municipal, predictive analytics platform to optimize the city's food inspection process, discovering critical violations 7 days earlier than through its traditional restaurant inspection.21 San Francisco has an internal Center for Learning and Innovation tasked with fostering a culture of learning, trust, and innovation.22 Tactics and strategies such as these not only will benefit the workplace environment but also have the potential to unearth new ideas that could directly impact health outcomes.
21st-century disease burden and funding for public health activities
These data suggest that small percentages of the BCHC workforce focus primarily on chronic disease (diabetes, tobacco, obesity) or injury prevention (opioids and violence), which are currently the leading causes of death in United States.23 This survey finds approximately 5%, but few parameters were given to respondents on how to answer this question and what categories to include in their answer. This apparent mismatch in staffing and disease burden is consistent with as-yet-unpublished data collected at approximately the same time on a BCHC Epidemiological Capacity Assessment done in collaboration with the Council of State and Territorial Epidemiologists. It also aligns with arguments by public health thought leaders including Tom Frieden, MD,24 who asserted in 2007 that local HDs are “asleep at the wheel” when it comes to chronic disease, and John Auerbach, MBA,25 who suggested HDs should realign their efforts to better consider 21st-century disease burden and health challenges. If this mismatch is indeed a reality, it is due in large part to the way in which HDs are funded. Because funding streams focus on program- or disease-specific activities, new health challenges (e.g., violence prevention or chronic disease) and social determinants (e.g., housing) often get short shrift. While staff in HDs may (and should) contribute to these areas, without dedicated resources for these 21st-century health challenges, they become less of a priority. This is an area ripe for further research, and moving the field from an anecdotal discussion to a data-informed one would be an important contribution. As an aside, many of today's public health problems stem from products that are powerful industries and/or have lobbyists working on their behalf, which may or may not have a real-world effect on whether and how they are being addressed. This is another issue that would benefit from additional research.
Social determinants of health
These data demonstrate that the BCHC HD workforce has an understanding of the importance of addressing the social determinants of health, but opportunity to grow that knowledge exists. A majority believe that they should be somewhat or very involved with issues such as housing and education. However, if the field of public health is to shift so that this becomes the majority of its work, the proportion of the workforce believing that they should be very involved will need to increase. More than a third of nonsupervisors and managers and a quarter of executives identified “forming cross-sector partnerships” as a training gap. The need was even greater for “developing a vision for a healthy community,” where a third of executives experienced a skill gap. Similarly, a gap exists in the awareness of “HiAP” and its perceived importance. Less than three-fourths of the workforce recognized the term, and among those who did, only half felt it was important to their day-to-day work. Recognition of the need of involvement in the social determinants of health is a good start, but unless these training gaps are addressed, real progress in addressing the determinants of health will lag. Furthermore, different skills such as policy development, which will be necessary to address social determinants such as housing and education, and persuasive communication, which will be key to forming cross-sector partnerships, will need to be developed among governmental public health workers. These data related to perceived involvement in affecting the social determinants of health have not been measured in previous studies, and it will be important to track changes in this perception over time to ensure that this shift in focus continues.
Limitations
Twenty-six of 30 BCHC member departments and 43% of potential respondents in those departments participated in PH WINS 2017. Generalizability may be limited to participating agencies if meaningful differences exist between participating and nonparticipating HDs. An analysis of organizational characteristics does not reveal structural differences, but some may exist. Any differences between nonrespondents and respondents could also limit generalizability. As with all self-reported studies, there may be significant disagreement on some items (e.g., abilities and skills), where respondents may not always answer the question accurately. Regarding benefits, staff were asked about weakening of benefits but not the adequacy of benefits to begin with. Also, the list of benefits was not exhaustive; although teleworking/flexibility was included, maternity/paternity leave was not. Finally, to ensure comparability across states, big cities, and other local health departments, a single instrument was administered in all agencies. Questions were not tailored to LHDs. Some items may have been less applicable (e.g., Program Area—WIC) or may not have resonated with local respondents, the effect of which is unknown.
Conclusion
This is the second iteration of a comprehensive national assessment of the governmental public health workforce gathering data on job environment and satisfaction, awareness of national trends, and training needs in 26 BCHC governmental public HDs. As such, this research informs national workforce development priorities for urban public health practice. A highly competent workforce is critical for BCHC HDs to continue to have an outsized impact on the public's health.
In particular, BCHC HDs must focus on improving retention, developing succession plans to mitigate the effects of retirement, providing opportunities for advancement, enhancing communication between leadership and staff, fostering creativity and innovation, and aligning labor allocation with 21st-century disease burden in their communities. These are indeed complex challenges. They must be addressed with the same urgency and zeal that mission-driving public health workers bring to improving the population's health, as it is foundational to their capability and capacity to do so. Much as assessment is a core function of public health, our ability to understand and address public health practice and workforce challenges is similarly fundamental. It is, therefore, important to continue to collect and analyze information about public health workforce interests and needs to not only monitor our progress but, more importantly, catalyze action as well.
Implications for Policy & Practice
Retirement and employee turnover remain a challenge in BCHC local health departments (HDs). To address this, they should provide opportunities for advancement as well as engage in succession planning.
Lack of creativity and innovation is a challenge, as is communication between HD leadership and staff. To address both of these issues, BCHC HDs should engage in continuous quality improvement and experiment with cross-program teams to foster creativity and innovation.
Labor allocation and/or the funding that supports HDs should be better aligned with disease burden.
While BCHC HD staff are familiar with the social determinants of health, there is room to grow this knowledge into concrete action(s) leading to cross-sector partnerships and visioning around healthy communities.
APPENDIX TABLE.
Health Department Involvement in Areas Affecting Certain Social Determinants of Health (by Supervisory Status)
| Social Determinant | % Who Agree/Strongly Agree Their Health Department Should Be Involved (95% CI) | |||
|---|---|---|---|---|
| Nonsupervisor | Supervisor | Manager | Executive | |
| K-12 education system | 65% (62%-69%) | 65% (60%-70%) | 70% (66%-75%) | 85% (79%-92%) |
| Economy | 63% (59%-67%) | 63% (59%-67%) | 70% (66%-74%) | 79% (72%-86%) |
| Built environment | 59% (55%-63%) | 61% (55%-67%) | 72% (68%-77%) | 85% (76%-94%) |
| Quality of housing | 69% (65%-73%) | 71% (67%-75%) | 78% (74%-82%) | 87% (81%-94%) |
| Quality of transportation | 61% (56%-65%) | 61% (54%-68%) | 70% (66%-73%) | 82% (76%-88%) |
| Health equity | 87% (83%-90%) | 89% (86%-92%) | 92% (89%-95%) | 98% (95%-100%) |
| Quality of social support systems for individuals | 79% (75%-84%) | 82% (77%-87%) | 86% (84%-87%) | 93% (90%-97%) |
Abbreviation: CI, confidence interval.
For all but one HD, a census of all employees was conducted. Because of survey fatigue and burden from competing surveys, one HD did not wish to invite all staff members to participate. In an attempt to yield at least a 50% response rate for the entire department, we randomly sampled 80% of staff members in the department. For this department, results were adjusted to account for the sampling design.
Where supervisors were defined as individuals who are responsible for employees' performance appraisals and approval of their leave but do not supervise other supervisors; and managers were defined as being in a management position and supervising 1 or more supervisors; and executives were defined as members of the senior executive service or equivalent. Nonsupervisors were defined as a staff member who does not supervise other employees.
PH WINS was carried out with funding from the de Beaumont Foundation, largely through a grant to ASTHO. That grant also supported staff time at NACCHO to work with BCHC member local health departments on their participation in this survey. Dr Leider was a contractor to ASTHO for the project.
The authors thank the staff in the participating health departments who responded to our survey as well as those who assisted in its administration.
The authors declare no conflicts of interest.
References
- 1.US Department of Commerce. 2010 Urban Area Facts—Geography. Washington, DC: US Census Bureau; 2013. https://www.census.gov/geo/reference/ua/uafacts.html. Accessed August 6, 2018. [Google Scholar]
- 2.National Association of County and City Health Officials. Big Cities Health Coalition—About Us. Washington, DC: National Association of County and City Health Officials; 2018. http://www.bigcitieshealth.org/about-us-big-cities-health-coalition-bchc. Accessed August 6, 2018. [Google Scholar]
- 3.Fielding JE, Aguirre A, Spear MC, Frias LE. Making the grade: changing the incentives in retail food establishment inspection. Am J Prev Med. 1999;17(3):243–247. [DOI] [PubMed] [Google Scholar]
- 4.Pomeranz JL. The unique authority of state and local health departments to address obesity. Am J Public Health. 2011;101(7):1192–1197. [DOI] [PMC free article] [PubMed] [Google Scholar]
- 5.Dowell D, Farley TA. Prevention of non-communicable diseases in New York City. Lancet. 2012;380(9855):1787–1789. [DOI] [PubMed] [Google Scholar]
- 6.Food and Drug Administration. Food labeling: nutrition labeling of standard menu items in restaurants and similar retail food establishments. Final rule. Fed Regist. 2014;79(230):71155–71259. https://www.federalregister.gov/documents/2014/12/01/2014-27833/food-labeling-nutrition-labeling-of-standard-menu-items-in-restaurants-and-similar-retail-food. Accessed October 4, 2018. [PubMed] [Google Scholar]
- 7.Food and Drug Administration. Final determination regarding partially hydrogenated oils. Notification; declaratory order; extension of compliance date. Fed Regist. 2018;83(98):23358–23359. https://www.federalregister.gov/documents/2018/05/21/2018-10714/final-determination-regarding-partially-hydrogenated-oils. Accessed October 4, 2018. [PubMed] [Google Scholar]
- 8.The City of San Antonio–Official City Website. Metropolitan Health District. Healthy Living—Tobacco 21. San Antonio, TX; 2018. https://www.sanantonio.gov/Health/HealthyLiving/Smoking. Accessed August 6, 2018. [Google Scholar]
- 9.Public Health—Seattle & King County. Heroin and Prescription Opiate Addiction Task Force. https://www.kingcounty.gov/depts/community-human-services/mental-health-substance-abuse/task-forces/heroin-opiates-task-force.aspx#recommendations. Published December 28, 2017. Accessed August 6, 2018.
- 10.Hemans-Henry C, Blake J, Parton H, Koppaka R, Greene CM. Preparing master of public health graduates to work in local health departments. J Public Health Manag Pract. 2016;22(2):194–199. [DOI] [PubMed] [Google Scholar]
- 11.Sellers K, Leider JP, Harper E, et al. The Public Health Workforce Interests and Needs Survey: the first national survey of state health agency employees. J Public Health Manag Pract. 2015;21(suppl 6):S13–S27. [DOI] [PMC free article] [PubMed] [Google Scholar]
- 12.Leider J, Pineau V, Bogaert K, Ma Q. The methods of PH WINS 2017: approaches to refreshing nationally-representative state-level estimates and creating nationally-representative local-level estimates of public health workforce interests and needs. J Public Health Manag Pract. 2019;25(suppl 2):S49–S57. [DOI] [PMC free article] [PubMed] [Google Scholar]
- 13.The Public Health National Center for Innovations. Foundational Public Health Services. Alexandria, VA: The Public Health National Center for Innovations; 2014. https://phnci.org/fphs. Accessed August 6, 2018. [Google Scholar]
- 14.Leider JP, Coronado F, Beck AJ, Harper E. Reconciling supply and demand for state and local public health staff in an era of retiring baby boomers. Am J Prev Med. 2018;54(3):334–340. [DOI] [PMC free article] [PubMed] [Google Scholar]
- 15.Harper E, Leider JP, Coronado F, Beck AJ. Succession Planning in State Health Agencies in the United States: A Brief Report. J Public Health Manag Pract. 2017;24(5):473–478. [DOI] [PMC free article] [PubMed] [Google Scholar]
- 16.Association of State and Territorial Health Officials. PH WINS: Research to Action. Washington, DC: Association of State and Territorial Health Officials; 2018. http://www.astho.org/Workforce-Development-and-Research/PH-WINS-Research-to-Action. Accessed August 6, 2018. [Google Scholar]
- 17.Langley GJ, Nolan KM, Nolan TW. The foundation of improvement. Qual Prog. 1994;27(6):81–86. [Google Scholar]
- 18.McKeown K, Matthies R, Lupi MV, Mortell T. Using data to advance workforce development in public health agencies: perspectives from state and local health officials. J Public Health Manag Pract. 2019;25(suppl 2):S180–S182. [DOI] [PMC free article] [PubMed] [Google Scholar]
- 19.McGinty M, Edmiston A, Cohen B, Hines R. Data to action: applying PH WINS to workforce challenges. Paper presented at: National Network of Public Health Institutes Workforce Forum; 2018; New Orleans, LA. [Google Scholar]
- 20.Drucker PF. Landmarks of Tomorrow. New York, NY: Harper; 1959. [Google Scholar]
- 21.Harvard Kennedy School, Ash Center for Democratic Governance and Innovation. Top 25 and finalists for Innovations in Government Award announced by Ash Center. https://ash.harvard.edu/news/top-25-and-finalists-innovations-government-award-announced-ash-center. Published 2015. Accessed August 6, 2018.
- 22.San Francisco Department of Health, Division of Population Health. Center for Learning and Innovation. https://www.sfdph.org/dph/comupg/tools/cli.asp. Accessed August 6, 2018.
- 23.Centers for Disease Control and Prevention. National Centers for Health Statistics. Deaths and Mortality. Atlanta, GA: Centers for Disease Control and Prevention; 2017. https://www.cdc.gov/nchs/fastats/deaths.htm. Accessed August 6, 2018. [Google Scholar]
- 24.Frieden TR. Asleep at the switch: local public health and chronic disease. Am J Public Health. 2004;94(12):2059–2061. [DOI] [PMC free article] [PubMed] [Google Scholar]
- 25.Public Health Leadership Forum. The High Achieving Governmental Health Department in 2020 as the Community Chief Health Strategist. RESOLVE; 2014. https://www.resolv.org/site-healthleadershipforum/files/2014/05/The-High-Achieving-Governmental-Health-Department-as-the-Chief-Health-Strategist-by-2020-Final1.pdf. Accessed August 6, 2018.