

Abstract
Objectives:
Balance and gait deficits can persist after mild traumatic brain injury (TBI), yet an understanding of the underlying neural mechanism remains limited. The purpose of this study was to investigate differences in attention network modulation in patients with and without balance impairments 2–8 weeks following mild TBI.
Methods:
Using functional magnetic resonance imaging, we compared activity and functional connectivity of cognitive brain regions of the default mode, central-executive and salience networks during a 2-back working memory task in participants with mild TBI and balance impairments (n = 7, age 47 ± 15 years) or no balance impairments (n = 7, age 47 ± 15 years).
Results:
We first identified greater activation in the lateral occipital cortex in the balance impaired group. Second, we observed stronger connectivity of left pre-supplementary motor cortex in the balance impaired group during the working memory task, which was related to decreased activation of regions within the salience and central executive networks and greater suppression of the default mode network.
Conclusions:
Results suggest a link between impaired balance and modulation of cognitive resources in patients in mTBI. Findings also highlight the potential importance of moving beyond traditional balance assessments towards an integrative assessment of cognition and balance in this population.
Keywords: Attention, balance, cognition, functional connectivity, traumatic brain injury
Introduction
Following traumatic brain injury (TBI), 30% of patients report impairments in balance and gait, even from injuries that are classified as mild (1–3). Although TBI is a leading cause of death and long-term disability (4), there is limited support for interventions aimed at reducing balance and gait impairments following mild-moderate TBI (5,6). As a result, these impairments may persist even after so-called ‘good recovery’ (1,7,8). Despite the known cognitive consequences of mild TBI (mTBI) and previously identified links between attention and impairments in balance and gait (9–15), there is a paucity of information regarding the relationship between changes in cognitive neural network function and impaired balance following mTBI.
A fundamental component of postural control is the ability to dedicate cognitive resources to meet postural demands. Recent dual task paradigms, combining postural and cognitive tasks, have revealed important relationships between attention, balance and fall risk (10,13,16). Attentional processes for postural control include cognitive flexibility (ability to shift the allocation of attention) and cognitive capacity (ability to process multiple sources of information at one time) (17). Protective balance responses, in particular, often require attention to shift towards external sensory cues as they relate to a balance perturbation and away from ongoing cognitive activity. Recent evidence regarding the neural underpinnings of such externally focused attention highlights three key brain networks of interest: default mode network (DMN), executive-control network and salience network. The DMN is a set of midline brain regions that deactivate in response to tasks requiring goal directed attention. In line with the theory that large-scale neural networks compete for limited brain resources, the DMN activates reciprocally with the executive-control and salience networks, both of which control externally directed attention (18,19). Although consensus has not been reached regarding the precise role of the DMN, it is generally active during resting conditions, internally directed thoughts and mind-wandering activities (20–22). During attentionally demanding tasks, activity is reduced within the DMN and increased within the frontoparietal and prefrontal regions of the executive-control and salience networks (19,20,23). Modulation of attention has therefore been linked to the magnitude of task-induced deactivation of the DMN during attentional tasks (24,25). Since TBI commonly results in impairments in attention that are associated with increased activation and low functional connectivity of the DMN during externally-triggered tasks (26), these network modulations may also underlie impaired balance control.
In this pilot study, we aimed to compare neuromodulation in the attention network in participants with recent (i.e. <8 weeks prior) mTBI and residual balance impairments to those without ongoing balance impairments. To examine these differences, participants completed the n-back task, which has previously been shown to modulate the extent of task-induced activations and deactivations (27). In general, an increased cognitive load is paralleled by increased task-induced suppression of the DMN, which is also known to be reduced in cognitively impaired older adults (27,28). This decreased suppression is accompanied by increased activation of the frontoparietal network in older compared to young adults, possibly as a compensatory mechanism (27). As such, we hypothesised that patients with mTBI and impaired balance would demonstrate reduced DMN suppression and greater compensatory upregulation of frontoparietal executive regions compared to patients with mTBI and no balance impairments.
Methods
Participants
Fourteen participants with mTBI within 2–8 weeks post injury were identified from a larger ongoing study, which uses a combination of advanced neuroimaging techniques and neuropsychological assessments in patients with TBI. All participants were recruited from the R. Adams Cowley Shock Trauma centre of the University of Maryland Medical centre and provided informed consent as approved by the University of Maryland Institutional Review Board. Participants were included if they had an admission Glasgow Coma Score of 13–15, mechanism of injury consistent with trauma, and either (1) a positive head CT or (2) altered mental status and/or loss of consciousness. While questions regarding loss of consciousness and altered mental status were included in our interview process, participants were generally unable to answer questions regarding duration of these events or gave variable responses during different visits leading us to decide that the length of loss of consciousness or altered mental status given to us by the participants was an unreliable measure in our patient population. Exclusion criteria included contraindications to MRI, stroke, brain tumours or seizures, history of neurological disorders, current medication or treatment for mild psychiatric conditions (depression or anxiety), or history of schizophrenia or bipolar disorder. Participants with balance impairments (BI) were identified based on a response of ≥ 2 on the ‘Loss of Balance’ item of a modified rivermead post-concussion symptom questionaire (mRPSQ) (29) (n = 7, 6 males, mean age 47.0 ± 14.78, range 27–70 years). Participants without balance impairments (NB) were matched by age, gender and education level (measured by number of completed academic years) to participants with balance impairment (BI; n = 7, 6 males, mean age 46.86 ± 15.18, range 28–63 years). Mechanisms of injury for the NB group included three assaults and four falls, and for the BI group included five falls and two road traffic accidents. An independent samples t-test indicated there were no differences in days post-injury at time of MRI between groups (BI: M = 40.14 days, SD = 13.97, range = 25–66 days; NB: M = 35.71 days, SD = 13.01, range = 25–63 days; t(12) = 0.61, p = 0.275). In addition to the mRPSQ, participants completed the military acute concussion evaluation (MACE) (30).
Clinical imaging
Both complicated mTBI (positive admission CT) and uncomplicated mTBI (negative admission CT) were included. Positive admission head CT’s were found in three participants with BI and two participants with NB. Abnormal readings in participants with BI were identified as bilateral frontal contusions and small right anterior subarachnoid hematoma (SAH), small right frontal SAH, extra axial hematoma in left posterior fossa, and left paratentorial subdural hematoma (SDH) and small left frontotemporal extra-axial hematoma. Abnormal readings in participants with NB readings were right temporal SAH and frontal lobe parenchymal contusion, and left posterior parietal SDH.
N-back task
A visual n-back task was employed in the scanner to investigate differences in neural activation and deactivation as a function of increasing task load. Participants practiced the task outside of the scanner to ensure familiarity prior to testing. During scanning, stimuli were presented on a back-projection system. Using Eprime 2.0 (Psychology Software Tools, Inc.), black letters were presented in the centre of a white background. Under three separate conditions, participants were asked to identify whether the letter on the screen was an X (condition 1, 0-back), whether it matched the letter presented immediately before it (condition 2, 1-back) and whether it matched the letter presented 2 letters back (condition 3, 2-back). A button press response was used, in which 1 indicated ‘yes’ and 2 indicated ‘no’. Each condition consisted of 11.5s of instructions followed by 5 task blocks of 48.3s and 5 resting blocks of 23s. Within each task block were 21 trials in which the letters were presented for 1.8s, with a 0.5s response window between letters. For the present study, only the 2-back task was investigated for group differences. Both reaction time and response accuracy were recorded for all participants except one in the BI group due to a technical error.
MRI acquisition
MRI data were obtained using a Siemens 3T Tim Trio scanner with a 12-channel head coil. T1-weighted MPRAGE images acquired 72 interleaved axial slices; 350 × 263 matrix; slice thickness = 2.0 mm; gap = 1 mm; voxel size = 0.9 × 0.9 × 2.0 mm; FOV = 230 mm; TR = 2000 ms; TE = 3.44 ms; flip angle = 9°. Functional T2*-weighted images were acquired using fast gradient-echo echoplanar imaging (EPI) sequence (36 interleaved slices; matrix = 230 × 230; slice thickness = 4.0 mm; gap = 0.0 mm; voxel size = 2.4 × 2.4 × 4.0 mm; TR = 2300 ms; TE = 30 ms; flip angle = 90°).
Functional MRI preprocessing and GLM analysis
All neuroimaging data were analysed using FSL 5.0.4 (http://www.fmrib.ox.ac.uk/fsl) (31). Structural T1-weighted images were first skull stripped using FSL’s brain extraction tool (BET) (32,33). Functional images were preprocessed using the FMRI expert analysis tool (FEAT) (34). Preprocessing steps included motion correction using MCFLIRT (35), non-brain removal using BET, slice timing correction, 5 mm spatial smoothing and high-pass temporal filtering (Gaussian-weighted least-squares straight line fitting, with σ = 72s). An independent-samples t-test indicated that there were no differences in absolute motion between groups BI (M = 0.420, SD = 0.286) and NB (M = 0.27, SD = 0.146), t(12) = 1.213, p = .249, or relative motion between groups BI (M = 0.100, SD = 0.044) and NB (M = .09, SD = .045), t(12) = .355, p = .729. FMRIB’s linear image registration tool (FLIRT) (35,36) was used to register EPI functional datasets into standard Montreal Neurological Institute (MNI) space using the high-resolution T1-weighted image acquired from each participant. Individual subject images were then entered into a general linear model using a voxelwise time series analysis with a corrected voxel p threshold of 0.05. Group effects were then analysed within FEAT’s higher-level analysis, which was carried out using FLAME (FMRIB’s local analysis of mixed effects) stage 1 and stage 2 (37–39). Contrasts were created to model the mean deactivation and activation of both groups, as well as BI>NB and NB>BI. A masking procedure was utilised which restricted analyses to voxels with significant activation or deactivation of both groups to analyse differences in activation and deactivation separately. Final Z (Gaussianised T/F) statistic images were thresholded using clusters determined by Z > 2.3 and a (whole-brain corrected) cluster significance threshold of p = 0.05 (40).
Functional connectivity analysis
A group-based independent component analysis (ICA) was used with dual regression to assess differences in functional connectivity between groups. A temporal concatenation ICA approach was implemented within MELODIC to define common reference network maps across all participants (41). The set of spatial maps from the group-average analysis was used to generate subject-specific versions of the spatial maps, and associated time series, using dual regression (42,43). First, for each subject, the group-average set of spatial maps was regressed (as spatial regressors in a multiple regression) into the subject’s 4D space-time dataset. This resulted in a set of subject-specific time series, one per group-level spatial map. Next, those time series were regressed (as temporal regressors, again in a multiple regression) into the same 4D dataset, resulting in a set of subject-specific spatial maps, one per group-level spatial map. These steps provided a voxel-based measure of network integration in which a positive/negative regression value indicates that the activity of that voxel is correlated/anticorrelated with the average activity time course of the overall network. We then tested for group differences within the network maps of the frontal-parietal and DMNs using FSL’s randomise permutation-testing tool (44).
All functional data were then overlaid on the MNI template available in MRIcro (http://www.sph.s.c.edu/comd/rorden/mricro.html) to display activation and deactivation brain maps.
Results
Clinical assessments
An independent-samples t-test indicated that total mRPSQ scores were significantly higher for BI (M = 24.4, SD = 15.8) than for NB (M = 8.3, SD = 6.3), t(8) = 2.50, p = .0187, d = 1.3. For the purposes of this analysis, the ‘loss of balance’ item was removed since this item was used to stratify the two groups. Also, Levene’s test indicated unequal variances (F = 11.57, p = .0053), so degrees of freedom were adjusted from 12 to 8. A subsequent group comparison of the individual mRPSQ and MACE item scores (Table 1) indicated that, in addition to the ‘loss of balance’ inclusion criteria, the only other test items that demonstrated differences between BI and NB groups related to cognition and attention (i.e. ‘trouble concentrating’, ‘fatigue’, ‘slow thinking’ and ‘memory problems’), with higher median scores in the BI group. All other symptoms such as headaches, dizziness, irritability, depression, frustration, impaired vision and restlessness, were generalised across both groups (Table 1).
Table 1.
Group comparison of clinical assessment items.
| Assessment item | NB median |
BI median |
Mann-Witney U p-value |
|---|---|---|---|
| mRPSQ | |||
| Headaches | 1 | 2 | 0.383 |
| Dizziness | 1 | 2 | 0.209 |
| Sleep disturbances | 2 | 2 | 0.383 |
| Depression | 0 | 0 | 1.000 |
| Anxiety | 0 | 0 | 0.902 |
| Trouble concentrating | 0 | 2 | 0.038* |
| Fatigue | 0 | 3 | 0.038* |
| Slow thinking | 1 | 3 | 0.026* |
| Double or blurred vision | 0 | 1 | 0.165 |
| Sensitivity to light | 0 | 0 | 0.209 |
| Sensitivity to noise | 0 | 0 | 0.383 |
| Memory problems | 0 | 2 | 0.038* |
| Irritability | 0 | 0 | 0.535 |
| Nausea | 0 | 0 | 0.710 |
| Hyperactivity | 0 | 0 | 1.000 |
| Vertigo | 0 | 1 | 0.165 |
| Poor coordination | 0 | 1 | 0.073 |
| Loss of balance | 0 | 2 | NC |
| Hearing difficulty | 0 | 0 | 1.000 |
| Numbness or tingling | 0 | 2 | 0.128 |
| Changes in taste and/or | 0 | 0 | 0.710 |
| smell | |||
| Difficulty making decisions | 0 | 1 | 0.073 |
| MACE | |||
| Orientation | 5 | 5 | 1.000 |
| Immediate Memory | 14 | 14 | 1.000 |
| Concentration | 4 | 3 | 0.318 |
| Delayed Memory | 4 | 4 | 0.805 |
2-back task performance
An independent-samples t-test indicated that there were no significant between group differences in reaction time (BI mean±SD = 1016.08 ± 97.17 ms, NB mean ±SD = 984.90 ± 141.90 ms, t(11) = 0.453, p = 0.659, d = 0.26) or accuracy (BI mean±SD = 0.80 ± 0.20, NB mean ±SD = 0.80 ± 0.1, t(11) = 0.442, p = 0.667, d = 0).
Balance impairment-related differences in activation
BOLD signal differences in task-induced activation and deactivation between the groups were found in two areas which demonstrated greater activation in the BI group compared to the NB group (Table 2). These areas included the left lateral occipital cortex (loss of consciousness) (x = −30, y = −90, z = 2, peak voxel Z score = 3.69, cluster size = 204) and right lateral occipital cortex (x = 40, y = –72, z = –12, peak voxel Z score = 3.91, cluster size = 132). Corresponding maps of differences in brain activation can be observed in Figure 1.
Table 2.
BI group: greater task induced activation.
| MNI coordinates | |||||
|---|---|---|---|---|---|
| Anatomical area | Z | x | y | z | Cluster size |
| L Lateral occipital cortex | 3.69 | −30 | −90 | 2 | 204 |
| R Lateral occipital cortex | 3.91 | 40 | −72 | −12 | 132 |
Figure 1.
Contrast images of activation differences between groups. Brain regions showing greater activation of balance impaired (BI) group than the non-balance impaired (NB) group. MNI coordinates are shown.
Functional connectivity analyses
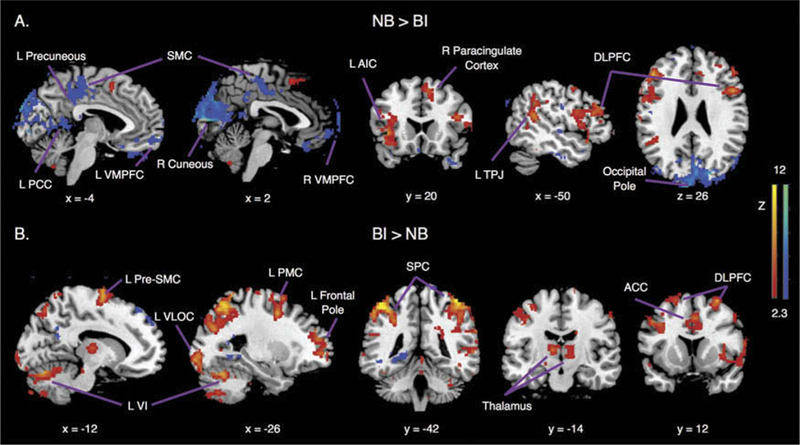
ICA analysis defined 38 spatial components common to both NB and BI groups. Two reference components of interest were selected, 7 and 22, that captured lateralised anticorrelated brain regions of the DMN, central-executive and salience networks (Figure 2). Component 7 demonstrated anticorrelated network activity between regions of DMN (i.e. ventromedial prefrontal cortex, VMPFC) and central-executive (i.e. right dorsolateral prefrontal cortex, dorsolateral pre-frontal cortex (DLPFC); right superior parietal cortex, SPC). Component 22, demonstrated anticorrelated network activity between regions of the salience (i.e. anterior cingulate cortex, ACC) and central-executive networks (i.e. left DLPFC; left SPC). Due to the anticorrelated nature of the networks within identified components, DMN and central-executive network (component 7) as well as salience and central-executive networks (component 22) were separated prior to analysis of between-group contrasts.
Figure 2.

Functional connectivity reference independent components (IC). (A) Component 7, (B) Component 22, from results of ICA analysis that reflect right and left lateralised anticorrelated brain regions of the default mode network (DMN), central-executive network (CEN) and salence network (SN).
Dual regression revealed significant differences in functional connectivity of component 22 between the NB and BI groups at the left pre-supplementary motor cortex (L pre-SMC) (x = –14, y = –10, z = 72; p < 0.05 false discovery rate (FDR) corrected) with higher negative functional integration values for the BI group (M = –10.5; SD = 2.7) compared to the NB group (M = –0.8; SD = 1.1). In other words, L pre-SMC demonstrated greater negative functional connectivity within the salience network in the BI group.
Post-hoc correlation analysis
We then assessed how connectivity of L pre-SMC affected brain activation across both BI and NB groups using a covariate-of-interest analysis. This higher-level post-hoc analysis was carried out using a fixed effects model, by forcing the random effects variance to zero in FLAME (FMRIB’s local analysis of mixed effects) (37–39). The fixed effects model was chosen in consideration of the small sample sizes of the groups. Individual subject’s L pre-SMC integration values were included as covariates and final statistical images were thresholded using Gaussian random field-based cluster inference with a height threshold of Z > 2.3 and a whole-brain corrected cluster significance threshold of p > 0.05 (40). Given that this analysis utilised a fixed-effects model, we extracted individual subject’s percent signal change for only the areas of maximum peak activation within identified clusters. Resulting coordinates of the correlated regions of activation and their correlation values are presented in Table 3. Brain coordinates of these regions were anatomically defined based on a meta-analysis of resting state fMRI data (45) and a meta-analysis of motor and premotor cortical fMRI data (46). Resulting regions included areas of the DMN, central-executive, salience and motor networks (18). Corresponding scatterplots of these areas depicting the correlations with functional integration values can be observed in Figure 3.
Table 3.
Correlations with L pre-SMC connectivity.
| MNI Coordinates | |||||||
|---|---|---|---|---|---|---|---|
| Cluster Size |
|||||||
| Anatomical Area | Z | x | y | z | rs | p | |
| Central-Executive Network | |||||||
| L Dorsolateral prefrontal cortex | 8.77 | −44 | 30 | 34 | 1654 | 0.701 | 0.0052 |
| R Dorsolateral prefrontal cortex | 8.33 | 50 | 14 | 26 | 2165 | 0.613 | 0.0197 |
| Salience network | |||||||
| L Temporoparietal junction | 7.04 | −60 | −50 | 12 | 1760 | 0.631 | 0.0156 |
| Default mode network | |||||||
| L Precuneus | 6.52 | −8 | −70 | 20 | 2858 | 0.543 | 0.0449 |
Figure 3.

L Pre-SMC functional connectivity correlates with task activation. Network integration at the L pre- SMC displaying greater (negative) integration of the L Pre-SMC correlated with: (A) Greater suppression of the L Precuneous. (B) Less activation of the R DLPFC and (C) Less activation of the L TPJ in the BI group (displayed as magenta) compared to the NB group (displayed as green). RL = left; SMC = supplementary motor cortex; R = right; DLPFC = dorsolateral prefrontal cortex; TPJ = temporoparietal junction.
Discussion
Our results show, for the first time, differences in the activity and connectivity of attention networks in patients with mTBI and balance deficits compared to those without balance deficits. These results are important for understanding the underlying mechanisms of impaired balance in this population. We used a working memory task and both univariate and multivariate statistical approaches to explore global and regional changes in functional connectivity and activation patterns. We first identified greater activation of bilateral loss of consciousness in the BI group. Second, we observed greater negative network integration of pre-SMC in the BI group. Finally, to bring further meaning to our data, a post-hoc correlation analysis identified a relationship between the connectivity of left pre-SMC with activity within the L temporoparietal junction (TPJ), bilateral DLPFC and L Precuneous during the working memory task.
Working memory load and balance impairment
Although we expected to find activation differences in the frontoparietal network, parietal and occipital areas have both previously illustrated load-dependent responses during visual working memory tasks (47–51). More specifically, multiple studies have suggested that the loss of consciousness cortex is not only important for processing immediate visual information, but also retains this sensory information without the presence of the original stimulus to support attentional processing (52–54). Our results indicate that patients with mTBI and without balance impairments have a greater load-dependent response in the loss of consciousness area compared to patients with mTBI and balance impairments. This finding indirectly suggests that balance impairments in this population may be linked with impairments in visual working memory. Although there were no differences in performance of the task between patient groups, it is plausible that when combined with demands of another task, such as maintaining balance, the altered working memory processing would induce performance differences. Indeed, prior research involving a working memory task resulted in reduced movement time and accuracy of arm responses to balance perturbations (55). However, future studies which include objective balance measures are required to investigate this link directly in patients with TBI.
Additional functional integration of sensorimotor area within cognitive networks
Activation differences within regions of the frontoparietal or DMN networks do not necessarily imply differences in the engagement of these networks. Therefore, we extended our analysis to investigate group differences in functional connectivity and demonstrated negative connectivity of the pre-SMC in the balance-impaired group. Given that the SMC lies within the sensorimotor network, we sought to understand the relationship of this anticorrelated network connectivity with activation differences found within cognitive networks. Our results revealed that greater (more negative) functional integration of pre-SMC corresponded with less activation of the TPJ and DLPFC. The TPJ, in particular, lies within the salience network and is known to be co-activated with the executive control network, including DLPFC, during externally driven shifts in spatial attention. Therefore, the connectivity of pre-SMC in the balance-impaired group potentially modulated the reorienting role of the salience network. Consistent with this notion, Bonnelle et al. (26), showed that impaired structural connectivity between the salience network and DMN is specifically predicted by the amount of white matter damage connecting the right anterior insula of the salience network with the pre-SMC. Behaviourally, this impaired connectivity also correlated with stop signal reaction time (used as estimate of efficiency of inhibitory processing) as well as assessments of cognitive flexibility and inhibitory control (26).
Tasks that demand attention to external sensory cues are known to suppress activity in the DMN (20) and engage the executive control and salience networks (56). This intrinsically negative relationship is thought to subserve the opposing cognitive processes of task-focused attention (executive control network) and the reorienting of attention (salience network) away from internally directed thoughts (DMN) (23). Behaviourally, decreased DMN suppression during stimulus driven tasks are considered a reflection of cognitive disturbances (57), including lapses in attention in both healthy individuals (25), and individuals with TBI (26). Our results are consistent with these reports in that the participants with balance impairments also demonstrated cognitive deficits of impaired concentration and memory as was also self-reported on the mRPSO. Further, though we did not find group differences in suppression of the DMN, greater (more negative) functional integration of pre-SMC corresponded to greater suppression of the precuneous. As such, the connectivity of pre-SMC in the balance-impaired group potentially modulated the suppression of the DMN, specifically within the precuneous, which has previously been shown to demonstrate a strong relationship with sustained attention (26).
Clinical implications
Although a relationship between cognition and balance is well established, the search for an underlying mechanistic theory of cognitive contributions is impeded by a tendency to study balance using dual task paradigms. Evidence suggests that attention to relevant sensory and environmental information is necessary during balance recovery from unexpected perturbations (58). Since attention and memory networks are normally limited in capacity, the task irrelevant information that is inherent to dual task paradigms, such as counting while avoiding obstacles, serves to restrict one’s ability to access information pertaining to balance control. The results of this study suggest a link between impaired balance and over-activation of activity associated with task relevant information. Therefore, the balance deficits in these individuals may have resulted from impaired attentional processes, specifically, visual working memory. Impaired patterns of connectivity (i.e. engaging and disengaging the DMN and central executive network) are also thought to imply deficits in task induced switching during a working memory task in patients with post traumatic stress disorder (PTSD) (59), providing further support for the clinical implications of our results.
Limitations
A few limitations of this study are worth considering. First, the balance impairments were self-reported. As such, we cannot be certain that the subjective score of the mRPSQ accurately reflected objective balance impairment. Second, in addition to TBI, inner ear pathologies are also potential contributions to balance impairments, but were not directly measured and therefore, cannot be completely ruled out. However, since dizziness is typically associated with inner conditions and our data indicated no group differences in self-reported dizziness, we are relatively confident that group differences in inner ear pathologies, if present, are negligible. Differences between BI and NB groups were only found across TBI symptoms relating to cognition and attention and not to other general symptoms, which appears to further strengthen the link between cognition/attention and impaired balance. In addition, our results are based on a small sample size of patients in a population known to have variable mechanisms of injury. Therefore, our results may not be representative of all patients following TBI with balance impairments. We attempted to minimise the variability between patients by carefully matching our two groups based on a number of variables. Finally, although we utilised random effects statistical comparisons for our activation and connectivity analyses, it is possible that our statistical differences occurred by chance given the multiple comparisons of our small sample size. Therefore, our findings and interpretations should be considered cautiously. Future studies can build upon these preliminary results using a larger sample size and an objective comprehensive balance measure, such as the mini Balance Evaluation Systems Test (mini BESTest) (60).
Conclusions
Participants with TBI and balance impairments that participated in this study were matched by both age and education with the group without balance impairments, allowing us to generalise our findings as one potential mechanism underlying balance deficits. We are encouraged by the fact that individuals without balance deficits demonstrated preserved load-dependent activation of the loss of consciousness and self-reported intact concentration and memory, highlighting the relevance of these variables to an effective balance intervention. Future studies should seek to elucidate whether remediation of these cognitive factors, such as impaired working memory, lead to improved balance control and changes in neural activity when integrated into a comprehensive balance rehabilitation programme.
Funding
This research was supported by the Department of Defense award #W81XWH-08-1-0725 and #W81XWH-12-1-0098.
References
- 1.Basford JR, Chou L-S, Kaufman KR, Brey RH, Walker A, Malec JF, Moessner AM, Brown AW. An assessment of gait and balance deficits after traumatic brain injury. Arch Phys Med Rehabil. 2003;84:343–49. [DOI] [PubMed] [Google Scholar]
- 2.Powell JM, Temkin NR, Machamer JE, Dikmen SS. Nonrandomized studies of rehabilitation for traumatic brain injury: can they determine effectiveness? Arch Phys Med Rehabil. 2002;83:1235–44. [DOI] [PubMed] [Google Scholar]
- 3.Williams G, Morris ME, Schache A, McCrory PR. Incidence of gait abnormalities after traumatic brain injury. Arch Phys Med Rehabil. 2009;90:587–93. [DOI] [PubMed] [Google Scholar]
- 4.Langlois JA, Rutland-Brown W, Wald MM. The epidemiology and impact of traumatic brain injury: a brief overview. J Head Trauma Rehabil. 2006;21:375–78. [DOI] [PubMed] [Google Scholar]
- 5.Teasell R, Bayona N, Marshall S, Cullen N, Bayley M, Chundamala J, Villamere J, Mackie D, Rees L, Hartridge C, et al. A systematic review of the rehabilitation of moderate to severe acquired brain injuries. Brain Inj. 2007;21:107–12. [DOI] [PubMed] [Google Scholar]
- 6.Bland DC, Zampieri C, Damiano DL. Effectiveness of physical therapy for improving gait and balance in individuals with traumatic brain injury: a systematic review. Brain Inj. 2011;25:664–79. [DOI] [PMC free article] [PubMed] [Google Scholar]
- 7.Gurr B, Moffat N. Psychological consequences of vertigo and the effectiveness of vestibular rehabilitation for brain injury patients. Brain Inj. 2001;15:387–400. [DOI] [PubMed] [Google Scholar]
- 8.Cicerone KD, Kalmar K. Persistent postconcussion syndrome: the structure of subjective complaints after mild traumatic brain injury. J Head Trauma Rehabil. 1995;10:1–17. [Google Scholar]
- 9.Siu K-C, Chou L- S, Mayr U, Van Donkelaar P, Woollacott MH. Attentional mechanisms contributing to balance constraints during gait: the effects of balance impairments. Brain Res. 2009;1248:59–67. [DOI] [PMC free article] [PubMed] [Google Scholar]
- 10.Woollacott M, Shumway-Cook A. Attention and the control of posture and gait: a review of an emerging area of research. Gait Posture. 2002;16:1–14. [DOI] [PubMed] [Google Scholar]
- 11.Stins JF, Michielsen ME, Roerdink M, Beek PJ. Sway regularity reflects attentional involvement in postural control: effects of expertise, vision and cognition. Gait Posture. 2009;30:106–09. [DOI] [PubMed] [Google Scholar]
- 12.Parker TM, Osternig LR, Lee H-J, Donkelaar PV, Chou L- S. The effect of divided attention on gait stability following concussion. Clin Biomech (Bristol, Avon). 2005;20:389–95. [DOI] [PubMed] [Google Scholar]
- 13.McCulloch KL, Buxton E, Hackney J, Lowers S. Balance, attention, and dual-task performance during walking after brain injury: associations with falls history. J Head Trauma Rehabil. 2010;25:155–63. [DOI] [PubMed] [Google Scholar]
- 14.Catena RD, Van Donkelaar P, Chou L-S. The effects of attention capacity on dynamic balance control following concussion. J Neuroeng Rehabil. 2011;8:8. [DOI] [PMC free article] [PubMed] [Google Scholar]
- 15.Catena RD, Van Donkelaar P, Chou L-S. Cognitive task effects on gait stability following concussion. Exp Brain Res. 2007;176:23–31. [DOI] [PubMed] [Google Scholar]
- 16.Smolders C, Doumas M, Krampe RT. Posture and cognition interfere in later adulthood even without concurrent response production. Hum Mov Sci. 2010;29:809–19. [DOI] [PubMed] [Google Scholar]
- 17.McDowd JM. An overview of attention: behavior and brain. J Neurol Phys Ther. 2007;31:98–103. [DOI] [PubMed] [Google Scholar]
- 18.Menon V, Uddin LQ. Saliency, switching, attention and control: a network model of insula function. Brain Struct Funct. 2010;214:655–67. [DOI] [PMC free article] [PubMed] [Google Scholar]
- 19.Fox MD, Snyder AZ, Vincent JL, Corbetta M, Van Essen DC, Raichle ME. The human brain is intrinsically organized into dynamic, anticorrelated functional networks. Proc Natl Acad Sci USA. 2005;102:9673–78. [DOI] [PMC free article] [PubMed] [Google Scholar]
- 20.Raichle ME, Snyder AZ. A default mode of brain function: A brief history of an evolving idea. Neuroimage. 2007;37:1083–90. [DOI] [PubMed] [Google Scholar]
- 21.Gusnard DA, Akbudak E, Shulman GL, Raichle ME. Medial pre-frontal cortex and self-referential mental activity: relation to a default mode of brain function. Proc Natl Acad Sci USA. 2001;98:4259–64. [DOI] [PMC free article] [PubMed] [Google Scholar]
- 22.Christoff K, Gordon AM, Smallwood J, Smith R, Schooler JW. Experience sampling during fMRI reveals default network and executive system contributions to mind wandering. Proc Natl Acad Sci USA. 2009;106:8719–24. [DOI] [PMC free article] [PubMed] [Google Scholar]
- 23.Buckner RL, Andrews-Hanna JR, Schacter DL. The brain’s default network: anatomy, function, and relevance to disease. Ann N Y Acad Sci. 2008;1124:1–38. [DOI] [PubMed] [Google Scholar]
- 24.Kelly AMC, Uddin LQ, Biswal BB, Castellanos FX, Milham MP. Competition between functional brain networks mediates behavioral variability. Neuroimage. 2008;39:527–37. [DOI] [PubMed] [Google Scholar]
- 25.Weissman DH, Roberts KC, Visscher KM, Woldorff MG. The neural bases of momentary lapses in attention. Nat Neurosci. 2006;9:971–78. [DOI] [PubMed] [Google Scholar]
- 26.Bonnelle V, Leech R, Kinnunen KM, Ham TE, Beckmann CF, De Boissezon X, Greenwood RJ, Sharp DJ. Default mode network connectivity predicts sustained attention deficits after traumatic brain injury. J Neurosci. 2011;31:13442–51. [DOI] [PMC free article] [PubMed] [Google Scholar]
- 27.Prakash RS, Heo S, Voss MW, Patterson B, Kramer AF. Age-related differences in cortical recruitment and suppression: implications for cognitive performance. Behav Brain Res. 2012;230:192–200. [DOI] [PubMed] [Google Scholar]
- 28.Sambataro F, Murty VP, Callicott JH, Tan H-Y, Das S, Weinberger DR, Mattay VS. Age-related alterations in default mode network: impact on working memory performance. Neurobiol Aging. 2010;31:839–52. [DOI] [PMC free article] [PubMed] [Google Scholar]
- 29.King NS, Crawford S, Wenden FJ, Moss NE, Wade DT. The rivermead post concussion symptoms questionnaire: a measure of symptoms commonly experienced after head injury and its reliability. J Neurol. 1995;242:587–92. [DOI] [PubMed] [Google Scholar]
- 30.French L, McCrea M, Baggett M. The Military Acute Concussion Evaluation (MACE). Journal of special operations medicine. J Spec Oper Med. 2008;8:68–77. [Google Scholar]
- 31.Jenkinson M, Beckmann CF, Behrens TEJ, Woolrich MW, Smith SM. FSL. Neuroimage. 2012;62:782–90. [DOI] [PubMed] [Google Scholar]
- 32.Jenkinson M, Pechaud S, Smith M. BET2: MR-based estimation of brain, skull and scalp surfaces. In Eleventh annual meeting of the organization for human brain mapping. 2005;17:176. [Google Scholar]
- 33.Smith SM. Fast robust automated brain extraction. Hum Brain Mapp. 2002;17:143–55. [DOI] [PMC free article] [PubMed] [Google Scholar]
- 34.Smith SM, Jenkinson M, Woolrich MW, Beckmann CF, Behrens TEJ, Johansen-Berg H, Bannister PR, De Luca M, Drobnjak I, Flitney DE, et al. Advances in functional and structural MR image analysis and implementation as FSL. Neuroimage. 2004;23(Suppl 1):S208–19. [DOI] [PubMed] [Google Scholar]
- 35.Jenkinson M, Bannister P, Brady M, Smith S. Improved optimization for the robust and accurate linear registration and motion correction of brain images. Neuroimage. 2002;17:825–41. [DOI] [PubMed] [Google Scholar]
- 36.Jenkinson M, Smith S. A global optimisation method for robust affine registration of brain images. Med Image Anal. 2001;5:143–56. [DOI] [PubMed] [Google Scholar]
- 37.Beckmann CF, Jenkinson M, Smith SM. General multilevel linear modeling for group analysis in FMRI. Neuroimage. 2003;20:1052–63. [DOI] [PubMed] [Google Scholar]
- 38.Woolrich MW, Behrens TEJ, Beckmann CF, Jenkinson M, Smith SM. Multilevel linear modelling for FMRI group analysis using Bayesian inference. Neuroimage. 2004;21:1732–47. [DOI] [PubMed] [Google Scholar]
- 39.Woolrich M Robust group analysis using outlier inference. Neuroimage. 2008;41:286–301. [DOI] [PubMed] [Google Scholar]
- 40.Worsley K Statistical analysis of activation images. Funct MRI Introd Methods. 2001;14:251–70. [Google Scholar]
- 41.Beckmann CF, DeLuca M, Devlin JT, Smith SM. Investigations into resting-state connectivity using independent component analysis. Philos Trans R Soc London Ser B Biol Sci. 2005;360:1001–13. [DOI] [PMC free article] [PubMed] [Google Scholar]
- 42.Beckmann M, Filippini S. Group comparison of resting-state FMRI data using multi-subject ICA and dual regression. Neuroimage. 2009;47:S148. [Google Scholar]
- 43.Filippini N, MacIntosh BJ, Hough MG, Goodwin GM, Frisoni GB, Smith SM, Matthews PM, Beckmann CF, Mackay CE. Distinct patterns of brain activity in young carriers of the APOE-epsilon4 allele. Proc Natl Acad Sci USA. 2009;106:7209–14. [DOI] [PMC free article] [PubMed] [Google Scholar]
- 44.Winkler AM, Ridgway GR, Webster MA, Smith SM, Nichols TE. Permutation inference for the general linear model. Neuroimage. 2014;92:381–97. [DOI] [PMC free article] [PubMed] [Google Scholar]
- 45.Watanabe T, Hirose S, Wada H, Imai Y, Machida T, Shirouzu I, Konishi S, Miyashita Y, Masuda N, Fox MD, et al. A pairwise maximum entropy model accurately describes resting-state human brain networks. Nat Commun. 2013;4:1370. [DOI] [PMC free article] [PubMed] [Google Scholar]
- 46.Mayka MA, Corcos DM, Leurgans SE, Vaillancourt DE. Three-dimensional locations and boundaries of motor and premotor cortices as defined by functional brain imaging: a meta-analysis. Neuroimage. 2006;31:1453. [DOI] [PMC free article] [PubMed] [Google Scholar]
- 47.Todd JJ, Marois R. Capacity limit of visual short-term memory in human posterior parietal cortex. Nature. 2004;428:751–54. [DOI] [PubMed] [Google Scholar]
- 48.Vogel EK, Machizawa MG. Neural activity predicts individual differences in visual working memory capacity. Nature. 2004;428:748–51. [DOI] [PubMed] [Google Scholar]
- 49.Xu Y, Chun MM. Dissociable neural mechanisms supporting visual short-term memory for objects. Nature. 2006;440:91–95. [DOI] [PubMed] [Google Scholar]
- 50.Todd JJ, Marois R. Posterior parietal cortex activity predicts individual differences in visual short-term memory capacity. Cogn Affect Behav Neurosci. 2005;5:144–55. [DOI] [PubMed] [Google Scholar]
- 51.Xu Y Distinctive neural mechanisms supporting visual object individuation and identification. J Cogn Neurosci. 2008;21:511–18. [DOI] [PubMed] [Google Scholar]
- 52.Gläscher J, Rose M, Büchel C. Independent effects of emotion and working memory load on visual activation in the lateral occipital complex. J Neurosci. 2007;27:4366–73. [DOI] [PMC free article] [PubMed] [Google Scholar]
- 53.Harrison SA, Tong F. Decoding reveals the contents of visual working memory in early visual areas. Nature. 2009;458:632–35. [DOI] [PMC free article] [PubMed] [Google Scholar]
- 54.Matsuyoshi D, Ikeda T, Sawamoto N, Kakigi R, Fukuyama H, Osaka N, Cowan N, Luck S, Vogel E, Rainer G, et al. Differential roles for parietal and occipital cortices in visual working memory. PLoS One. 2012;7:e38623. [DOI] [PMC free article] [PubMed] [Google Scholar]
- 55.Westlake KP, Johnson BP, Creath RA, Neff RM, Rogers MW. Influence of non-spatial working memory demands on reach-grasp responses to loss of balance: effects of age and fall risk. Gait Posture. 2016;45:51–55. [DOI] [PMC free article] [PubMed] [Google Scholar]
- 56.Corbetta M, Shulman GL. Control of goal-directed and stimulus-driven attention in the brain. Nat Rev Neurosci. 2002;3:201–15. [DOI] [PubMed] [Google Scholar]
- 57.Lustig C, Snyder AZ, Bhakta M, Brien KCO, Mcavoy M, Raichle ME, Morris JC, Buckner RL. Functional deactivations: change with age and dementia of the Alzheimer type. Proc Natl Acad Sci USA. 2003;100:14504–09. [DOI] [PMC free article] [PubMed] [Google Scholar]
- 58.Maki BE, Zecevic A, Bateni H, Kirshenbaum N, McIlroy WE. Cognitive demands of executing postural reactions: does aging impede attention switching? Neuroreport. 2001;12:3583–87. [DOI] [PubMed] [Google Scholar]
- 59.Daniels JK, Mcfarlane AC, Bluhm RL, Moores KA, Richard Clark C, Shaw ME, Williamson PC, Densmore M, Lanius RA. Switching between executive and default mode networks in posttraumatic stress disorder: alterations in functional connectivity. J Psychiatry Neurosci. 2010;35:258–66. [DOI] [PMC free article] [PubMed] [Google Scholar]
- 60.Franchignoni F, Horak F, Godi M, Nardone A, Giordano A. Using psychometric techniques to improve the balance evaluation systems test: the mini-bestest. J Rehabil Med. 2010;42:323–31. [DOI] [PMC free article] [PubMed] [Google Scholar]