Abstract
Transformation toughening has been used in commercial products for several decades in order to increase the toughness of brittle materials. Composites made from an elastic matrix and elastic-plastic inclusions similarly exhibit increased toughness and R-curve behavior due to the residual stress induced in the wake of the crack tip by the unloaded, plastically deforming fillers. These two mechanisms, in which the eigenstrains in the wake of a major crack lead to toughening, belong to the same class. In this study, we investigate the effect of the elastic heterogeneity of the matrix on such toughening mechanisms and observe that increasing the elastic heterogeneity amplifies the effect. The analysis is relevant for bone, which is a highly heterogeneous hierarchical material, in which localized plastic deformation has been recently shown to occur at dilatational bands. Understanding toughening in bone is a subject of current interest in the context of age-related fragility. The heterogeneity-enhanced eigenstrain toughening effect is of interest for a broad range of engineering applications.
Keywords: Transformation toughening, R-curve, Elastic heterogeneity, Bone, Dilatational bands
1. Introduction
Toughening of brittle materials has been studied for almost half a century and a number of engineering solutions have been developed and adopted industrially (Pearson et al., 2000; Qin and Ye, 2015). Brittle materials fail in tension by the propagation of a major, critical crack. Failure occurs in compression either through wedging followed by sample splitting produced by a major crack that grows in the direction of the principal compressive load (the wing crack mechanism) (Cannon et al., 1990) or, in presence of confinement, through the formation of a shear band which links through a large number of microcracks produced during preliminary loading (Jaeger et al., 2007).
Toughening mechanisms are sought to enhance the material toughness measured in tension, which is typically much lower than that in compression. The main toughening mechanisms are crack bridging, crack deflection, crack pinning and transformation toughening. Crack bridging refers to the formation of ligaments behind the crack tip which restrict the crack opening displacement and hence lead to a reduction of the effective crack tip stress intensity factor (Swanson et al., 1987; Erdogan and Joseph, 1989; Evans and Hutchinson, 1989). Crack deflection is related to the presence of material heterogeneity. Strong obstacles to crack propagation lead to crack deflection, which increases the tortuosity of the crack path and the roughness of crack surfaces (Faber and Evans, 1983; Ahn et al., 1998). Crack pinning is similarly caused by material heterogeneity. Considering the crack to be planar and the material toughness to be spatially non-uniform, crack growth is slower in regions of higher resistance and the crack front becomes rough (Spanoudakis and Young, 1984). Transformation toughening is a more complex mechanism associated with the presence of material sub-domains that undergo a phase transformation under the action of the stress field in the region of the crack tip. This transformation produces eigenstrains in the surrounding elastic and non-transforming matrix, which, in turn, act on the crack, reducing the effective stress intensity factor. While the transformation occurs mainly in front of the crack, the toughening effect is due to the eigenstrains of the transformed sub-domains located in the wake of the tip. Hence, an R-curve effect is observed, the effective toughness increasing as the crack grows. The toughness eventually reaches a plateau once the wake is fully formed (Sakai et al., 1988). The transformation toughening mechanism has been used to toughen ceramics by the incorporation of yttria-stabilized zirconia particles in the respective material (Garvie et al., 1975; Budiansky et al., 1983; Ortiz, 1987). These particles are metastable and undergo a phase transformation when loaded by the large stress field in the vicinity of a crack tip. The eigenstrain produced during this transformation leads to the toughening effect described above.
In composites with elastic matrix and elastic-plastic inclusions, localized plastic deformation in fillers is expected in the vicinity of the crack tip. This energy dissipation leads to an increase of the critical energy release rate. As the crack advances, the inclusions that deform plastically in the process zone of the crack move in the wake of the tip and are unloaded. Since the surrounding matrix is elastic, these inclusions are forced to return to a strain state close to the initial undeformed configuration and consequently, an eigenstress is produced in the matrix. This mechanism is qualitatively similar to that of transformation toughening or process zone toughening and has similar effects on the crack. The common ground of the two mechanisms is that toughening is associated with the occurrence of eigenstrains which act on the crack. Here we demonstrate the impact of such mechanisms on fracture toughness and further analyze the effect of rendering the matrix elastically heterogeneous. A finite element (FEM) model is developed aimed to isolate the contribution of eigenstrain toughening from the other toughening mechanisms expected in heterogeneous materials, specifically, crack deflection and crack pinning. We also inquire whether rendering the matrix material heterogeneous may enhance the effectiveness of the eigenstrain toughening mechanisms.
This investigation is motivated in part by the need to understand toughness of bone. Many of the toughening mechanisms mentioned above have been discussed in relation to bone toughness (Vashishth et al., 1997; Nalla et al., 2003; 2004; Tang and Vashishth, 2007; Koester et al., 2008; Launey et al., 2010). Crack deflection has been observed on the microscale, especially for cracks transverse to osteons. Crack deflection leads to rough crack surfaces, interlocking of these asperities and enhanced resistance to crack growth in both mode I and mode II (Koester et al., 2008). Recent studies (Pro et al., 2015; Abid et al., 2018) on stochastic microstructures of bio-composite show that crack deflection toughening depends on the statistical variability of the microstructure. Specifically, in the case of nacre, the toughness decreases as the microstructural variability increases. Nucleation of microcracks in front of a major crack tip followed by coalescence with the main crack was also documented (Vashishth et al., 1997; Tang and Vashishth, 2007). Uncracked ligaments and collagen fibrils bridging have been observed on micrometer to sub-micrometer length scales (Nalla et al., 2003; 2004; Koester et al., 2008). Poundarik et al. (2015) demonstrated that microcracking controls and interacts with other toughening mechanisms in bone. However, eigenstrain toughening has not been considered so far as a potential toughening mechanism in bone.
Recently, the occurrence of submicron diffuse damage regions was reported in fatigued cortical bone samples (Diab and Vashishth 2005; Diab et al., 2006; Vashishth, 2007). Sub-domains in which inelastic deformation takes place are known as dilatational bands (Poundarik et al., 2012; Seref-Ferlengez and Basta-Pljakic, 2014). The specific mechanical behavior of bone within a dilatational band is largely unknown. However, due to co-localization with non-collagenous protein (NCPs) complexes (i.e. osteocalcin, osteonectin and osteopontin), it has been suggested that the dilatational bands formation is a result of protein complex denaturation (Poundarik et al., 2012). Also, nanoindentation experiments performed in such regions indicate an effective modulus 13% lower than that of the surrounding material (Poundarik et al., 2012). This level of reduction is probably an underestimate of the actual modulus reduction since probing was performed in dilatational bands embedded in undamaged bone and the effect of this confinement on the measured effective stiffness was not evaluated.
The physical picture proposed here is that the dilatational bands occurring in the vicinity of a major crack tip behave similar to elastic-plastic particles embedded in an elastic matrix of a composite. Before the dilatational bands form, the material is linear elastic. Subsequently, the material becomes plastic in the dilatational band sub-domains. Upon unloading, these sub-domains produce eigenstress, which in turn act on the crack leading to a reduction of the effective stress intensity factor and hence to toughening. This process takes place only upon unloading and hence is effective in the region behind the crack tip. In the following sections, we evaluate the magnitude of the toughening effect for several volume fractions of dilatational bands. Further, we investigate the effect of the elastic heterogeneity in regions of the model surrounding the dilatational bands (matrix elastic heterogeneity) on the toughening mechanism proposed. This investigation is motivated by the observation that bone is indeed a heterogeneous material (Nicolella et al., 2005; Tai et al., 2007; Thurner, 2009). The coefficient of variation of bone elastic moduli within a given sample and in absence of dilation bands is reported by Tai et al. (Tai et al., 2007) to be approximately 0.4, while a broader range, from 0.2 to 0.5, was inferred by Thurner (2009) for human cortical bone, based on literature data. This concept is also relevant for toughening of engineering brittle materials, case in which it is of interest to inquire whether material stochasticity may enhance the effect of the eigenstrain toughening mechanisms.
2. Model description
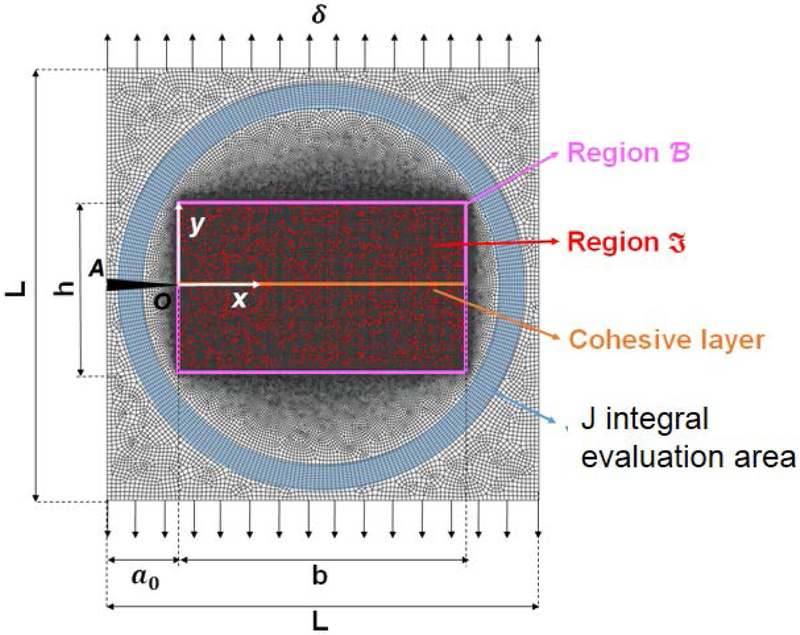
A schematic of the compact tension specimen used in this study is shown in Fig. 1. The model has dimensions L in the directions parallel and perpendicular to the crack. The initial crack length is a0 = L/6 and the crack growth is restricted to the y = 0 plane containing the initial crack. Restricting the crack to be planar helps separate the effect eigenstrain toughening from that of other toughening mechanisms caused by heterogeneity. To enforce this restriction, cohesive elements are used along this plane, as indicated in Fig. 1. This set-up ensures that the crack remains planar and hence the crack deflection mechanism plays no role in the analysis. A region B of dimensions b × h is defined in the range x / L ∈ (0,2/3) and y/L ∈ (−1/6, 1/6), where elastic-plastic inclusions are defined. These inclusions are non-overlapping, of identical size (diameter 0.0011L)) and are randomly distributed in region B. The area fraction of inclusions is ϕt ⪡ 1 and their reunion is denoted by ℑ.
Fig. 1.
Schematic representation of the compact tension specimen used in this study. B denotes the region where elastic-plastic/transformation sub-domains and/or matrix elastic heterogeneity are defined. The reunion of the transformation sub-domains in region B (red dots) is denoted by ℑ. A crack of initial length a0 is introduced along segment OA (O is at the origin of the coordinate system) and a cohesive zone is defined along plane y = 0 in front of the crack. The circular domain surrounding region B (shown in blue) is used for the calculation of the J integral. δ is the displacement boundary condition applied at the top and bottom boundaries. Heterogeneity is limited to region B.
Region B − ℑ contains a homogeneous or a heterogeneous linear elastic material, in separate simulations. The structure in both ℑ and B − ℑ is symmetric with respect to the y = 0 plane. This includes the distribution of inclusions and, in cases for which the matrix is considered heterogeneous, the spatial distribution of elastic constants. This assumption imposes no limitations on the studied phenomena and ensures that the crack tip is loaded in mode I at all times. Loading the crack in mixed mode would introduce a driving force for crack growth in the out of plane direction. The circular domain outside B contains a linear elastic homogeneous material in all cases. This domain is used to compute the energy release rate based on the J integral (Rice, 1968).
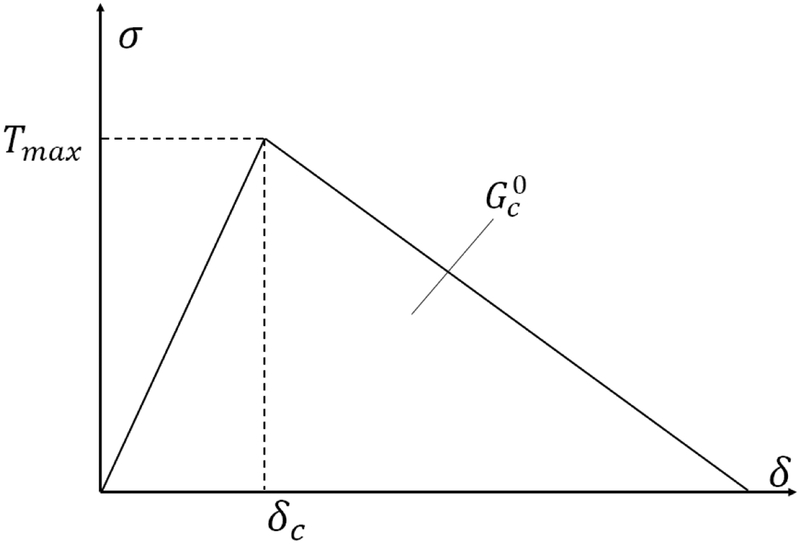
The cohesive zone along plane y = 0, defining the crack growth direction, has parameters and the maximum stress Tmax (as shown in Fig. 2), and acts in the opening mode. represents the critical energy release rate (which is equal to the value of J computed from the far field at crack propagation) when the material is homogeneous and no toughening mechanisms are active. Since the crack is restricted to grow along plane y = 0 and is constant along this plane, we ensure that the heterogeneity in B does not lead to crack pinning, as needed in order to separate the effects of multiple mechanisms. Models of this type have been used previously in the literature. Tvergaard and Hutchinson (1992) study the interplay between cohesive zone parameters and the elastic-plastic deformation of the body on the effective toughness. Deshpande et al. (2002) used a similar model when studying the effect of plasticity represented by discrete dislocation dynamics on toughness.
Fig. 2.
Traction-separation function of the cohesive zone. The area under the curve represents the fracture energy and δc is the opening displacement when the cohesive layer is subjected to the maximum stress Tmax.
The material behavior in B − ℑ and outside B is linear elastic and isotropic with Young’s modulus E0 and Poisson ratio v0. The material behavior of inclusions, region ℑ, is bilinear elastic-plastic with the same Young’s modulus and Poisson ratio. The plastic behavior is described by the standard J2 plasticity with yield stress in uniaxial tension σy and strain hardening defined by the tangent modulus Ep = 0.41E0. Hence, once plastic deformation occurs in a sub-domain of ℑ, a residual strain is expected. As the crack grows, the respective sub-domain moves behind the crack tip and unloads. Since the surrounding material (B − ℑ) is linear elastic, it forces the inclusion to return to zero strain which, in turn, leads to the build-up of an eigenstress in ℑ and an associated longer range field in the surrounding material, B − ℑ. This field loads the crack and leads to toughening in a manner similar to the mechanism described in the literature for transformation toughening (Budiansky et al., 1983; Garvie et al., 1975).
In separate simulations, region B − ℑ is rendered heterogeneous, but the material behavior remains linear elastic. This allows investigating the effect of heterogeneity on the toughening mechanism discussed above. To this end, the Young’s modulus in this region, E, is allowed to vary spatially and is selected at random (and spatially uncorrelated) from a Gamma distribution of mean E0 and coefficient of variation, CVE. The coefficient of variation is kept as a parameter and is varied from 0 to 0.5. The Poisson ratio is kept constant. In heterogeneous cases the effective modulus of the material is identical to that of the homogeneous case. This allows the direct comparison of the effective energy release rates computed with homogeneous and heterogeneous models.
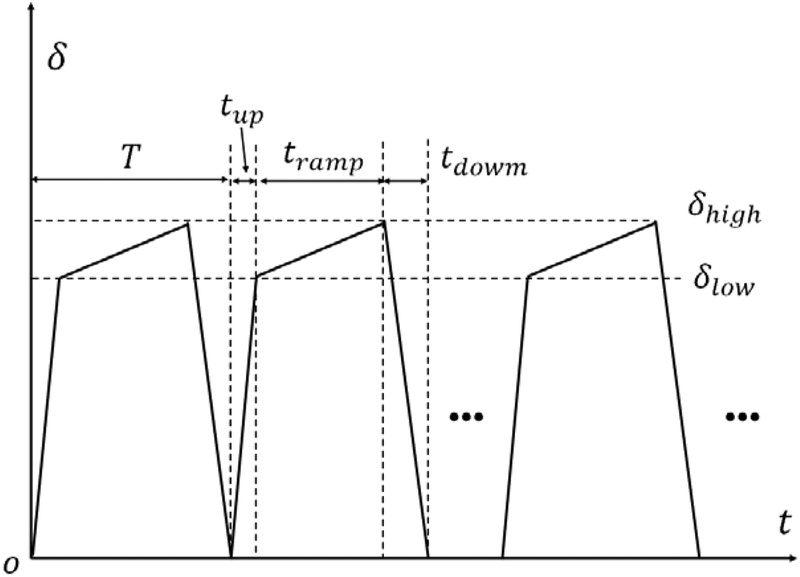
Displacement boundary conditions are applied in the y-direction along the top and bottom of the model in Fig. 1 (at y = −L/2 and L/2), while the other model edges and degrees of freedom are traction free. A sketch of the loading sequence is shown in Fig. 3. In each loading period, T, the load is incremented initially fast for a period tup, followed by a slower ramp regime during tramp in order to capture the moment of crack propagation. Once the crack propagates, the model is unloaded. During the unloading time tdown the crack stops. The effective critical energy release rate, Gc, is evaluated by computing the J integral at the moment of crack extension. In general, the critical energy release rate has the form:
| (1) |
where J∞ is the value of the J-integral calculated from the far-field at crack propagation and ΔJ is the effect of the toughening mechanism of interest. The J integral is computed using the area integration formulation (Li et al., 1985) over the circular domain shown in blue in Fig. 1, outside region B. This standard formulation of J can be used since the integration domain is homogeneous. A modified version (Eischen et al., 1987; Zheng et al., 2000) should be used if the path would run through the heterogeneous region B. This issue is also discussed by Chen (1996).
Fig. 3.
Schematic showing the loading scheme applied. The applied displacement is increased rapidly during tup, up to a value δlow which is close, but smaller than the critical displacement producing crack growth, δhigh. The displacement is further increased at a smaller rate during tramp, up to δhigh. The model is unloaded once the crack advances and consequently the crack stops. The cycle is repeated in order to probe the toughness at multiple sites along the crack path.
In the case of the crack growing in a homogeneous material with no transformation in ℑ, the crack propagates unstably throughout the model. In all other cases, the crack stops at positions defined by the random distribution of heterogeneity in B − ℑ. We re-emphasize that this crack trapping is exclusively due to the elastic field as neither the transformation nor the elastic heterogeneity affect the critical energy release rate of the cohesive zone, , directly. The trapping effect becomes more pronounced as ϕt and/or CVE increase. The process of loading-unloading is repeated for the new position of the tip and a new value of Gc, which corresponds to the current crack tip position and depends on the heterogeneity in the respective region, is determined. The simulation ends once the crack reaches x ~ 2a0, in order to avoid size effects associated with excessively small unbroken ligaments. This process is repeated for multiple replicas for each case (n =10 replicas for homogeneous cases and n = 20 replicas for heterogeneous cases) in order to account for variability induced by the various stochastic parameters of the problem.
The specific material parameters used in the simulations correspond to cortical bone and are listed in Table 2. The model represents a 180 × 180 μm2 domain of cortical bone carrying a crack of length a0 = 30 μm. In this application, inclusions represent dilatational bands and their area fraction ϕt is varied from 5% to 20%, which corresponds to the range reported in the literature (Poundarik et al., 2012). The occurrence of dilatational bands close to crack tips has been observed in confocal microscopy as ellipsoidal stained areas with dimensions on the order of hundreds of nanometers. Cortical bone is orthotropic, with elastic constants (E1 = 12.01GPa , E2 = 20.16GPa,E3=13.48GPa , G23 = 6.23GPa , G12 = 5.61GPa ,G13 = 5.61GPa,v12 = 0.378,v23=0.21)(Cowin and Sadegh, 1991). The Young’s modulus considered here, E0, is computed as the Voigt average of the actual anisotropic elastic constants of bone. The bilinear constitutive behavior of inclusions is calibrated based on the anelastic behavior reported by Bonfield and O’Connor (1978) who observed a hysteresis loop in micro tensile test of bovine cortical bone; an applied stress of 70 MPa led to a residual strain of 60 ×10−6 , while a load of 20 MPa did not lead to any measurable residual strain or hysteresis. The yield stress of the inclusions is selected to be σy = 70 MPa. The strain hardening is Ep = 6 GPa, corresponding to the modulus of mineralized collagen fibrils (Jäger and Fratzl, 2000). The toughness considered is , which corresponds to microscale cracks; the value was measured by cube-corner indentation (Mullins, L.P. et al., 2007). This toughness value is smaller than that usually reported for cortical bone obtained from macroscopic measurements (Koester et al., 2008). The difference is due to the presence and operation of various toughening mechanisms in bone at scales from few microns to the millimeter scale (Nalla et al., 2004). Finally, for models in which the matrix is considered elastically heterogeneous, the coefficient of variation of the distribution of elastic constants, CVE, is varied from 0 to 0.5 in order to cover the range reported for bone, which is 0.2 to 0.5 (Tai et al., 2007; Thurner, 2009).
3. Results and discussion
3.1. Effect of the inclusion density
In the first part of this study, we demonstrate the toughening effect and determine the effect of the area fraction of inclusions ϕt. To this end, we use the model with homogeneous linear elastic behavior in the region B − ℑ.
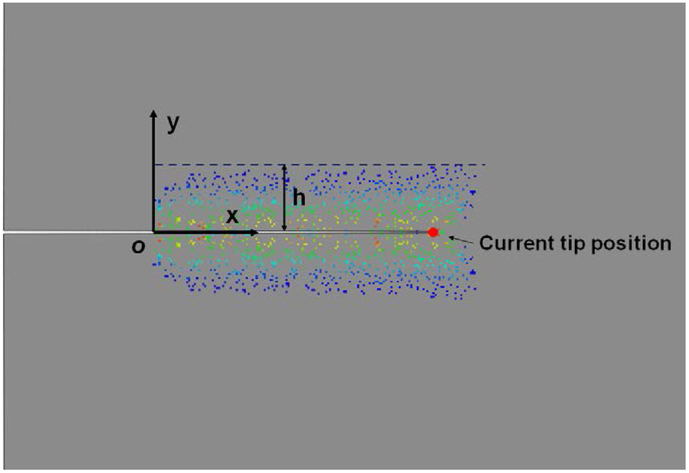
Fig. 4 shows a representative configuration with ϕt = 100% after a crack extension by Δa/a0 = 2 , where a0 is the initial crack length. The color map represents the maximum principal plastic strain over the loading history taking place in the randomly distributed sub-domains ℑ. A wake forms extending along the entire crack. An eigenstress field is produced in the wake and acts on the crack.
Fig. 4.
Distribution of inclusions that underwent plastic deformation, with colors representing the maximum principal plastic strain over the loading history (ranging from 60 × 10−6, blue, to 5 × 10⁻³, red). The current crack tip position is marked by the red circle, while the initial crack tip position is at O.
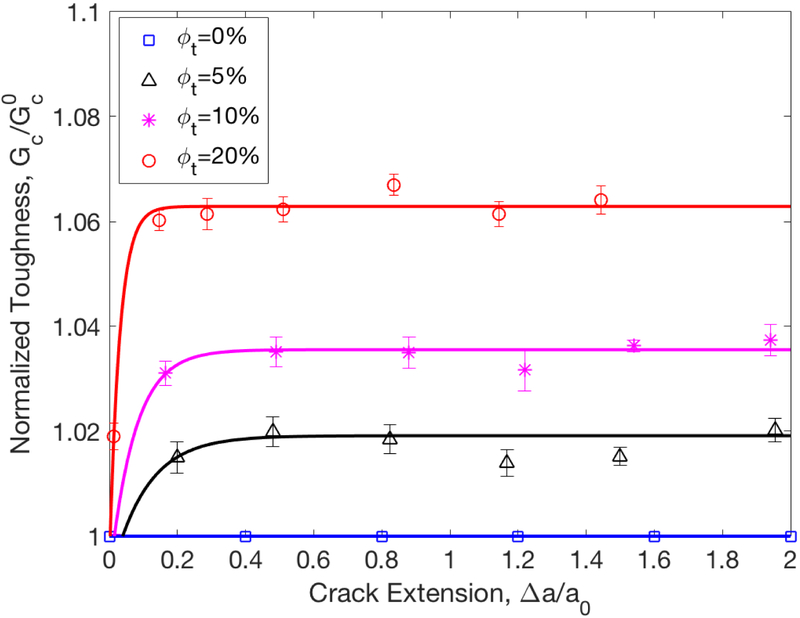
The toughening effect associated with this process is shown in Fig. 5 for three values of ϕt = 5%, 10% and 20%. The curve for the reference case with ϕt = 0 is also shown. As expected, no toughening is observed for ϕt = 0, case for which . For ϕt > 0, the apparent toughness increases with increasing crack length (R-curve) and reaches a plateau at a normalized crack extension of Δa/a0 ≈ 0.2, i.e. once the wake is fully developed. The toughening effect, i.e. the difference between the apparent toughness for ϕt > 0 and the toughness of the reference case ϕt = 0, measured in the plateau region, increases approximately linearly with ϕt. R-curves are known to result by similar mechanisms even when plastic deformation is not confined to inclusions in ℑ as, for example, described by Tvergaard and Hutchinson (1992).
Fig. 5.
Normalized effective toughness versus crack extension for models with ϕt = 0%, 5%, 10% and 20%. The bars represent the standard deviation computed over 10 replicas. The solid lines are guides to the eye, showing the R-curve behavior.
The value of the yield stress σy affects toughening through two mechanisms. Reducing the yield stress leads to an increase of the width of the wake, h (Fig. 4). Similar to the case of zirconia-containing ceramics, where the transforming particles acquire uniform dilatation, h is inversely proportional to the square of the critical transformation stress σc and the toughening is proportional to square root of the wake width h (Evans and Faber, 1983).
Therefore, the degree of toughening is inversely proportional to the critical stress σy. On the other hand, decreasing σy should lead to an increase of the residual stress level. We conclude that the level of toughening depends markedly on the value of the yield stress in inclusions and increases as the yield stress decreases. In this analysis we consider a value of the yield stress at the upper end of the range reported for bone (σy = 70 MPa) in order to obtain a conservative value for the toughening induced by this mechanism.
3.2. Effect of elastic heterogeneity
It is of interest to inquire further whether rendering the matrix material elastically heterogeneous can enhance the toughening effect shown in Fig. 5. Heterogeneity is present at various scales in most engineering materials. Furthermore, with the development of modern manufacturing methods, such as additive manufacturing, it is now possible to control the level of heterogeneity in the microstructure. Identifying the extent to which this parameter can be used to enhance specific material properties is therefore of interest. In the context of material toughness, the role of heterogeneity in material properties has been discussed broadly, mostly in the context of crack pinning and cracks deflection (Ramanathan et al., 1997; Bolander and Sukumar, 2005). These direct crack-heterogeneity interaction mechanisms are purposely avoided in the current study, as we seek to identify the field-mediated effect of elastic heterogeneity on the transformation toughening mechanism.
To our knowledge, the effect of material stochasticity on the eigenstrain toughening mechanisms was not discussed in the literature, whether in the context of bone or related to brittle engineering materials in general. Notably, the investigation is particularly appropriate for bone, which is an elastically heterogeneous material, with effective modulus ranging from 2GPa to 30GPa (Tai et al., 2007).
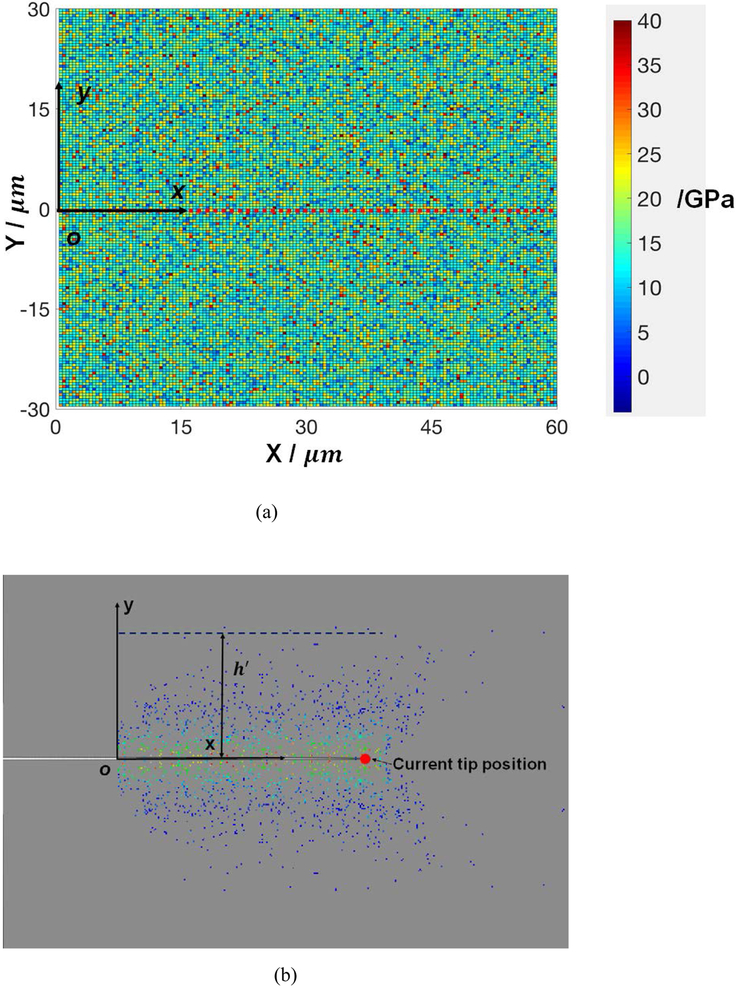
To study this effect, we render the modulus E in the domain B − ℑ stochastic, while preserving the structure and material parameters of ℑ unchanged. Figure 6(a) shows region B of the model in which the elastic constants are selected from a Gamma distribution of mean identical to the elastic modulus of the homogeneous B case and coefficient of variation CVE = 0.4. Fig. 6(b) shows the maximum plastic strains over the loading history reached in inclusions and the formation of a wake, as the crack advances from the original position O to the current position marked by the red circle. The model has ϕt = 10% and the configuration in Fig. 6(b) is shown for a crack extension of Δa/a0 = 2, such that this state can be compared directly with that in Fig. 4. The difference between Figs. 6(b) and 4 is substantial and is due exclusively to the elastic heterogeneity in B − ℑ.
Fig. 6.
(a) Region B of the model with elastic constants in B − ℑ selected from a Gamma distribution with coefficient of variation CVE = 0.4. The colors represent the local value of the stiffness, E. Inclusions forming sub-domain ℑ are not shown. (b) Distribution of inclusions that underwent plastic deformation as the crack tip moved from O to the current location marked by the red circle. The system corresponds to the case in (a). The colors represent the maximum principal plastic strain in inclusions over the loading history (ranging from60 × 10−6, in blue, to 8 × 10⁻³, in red). The heterogenity in B − ℑ is not shown. This figure can be compared with Fig. 4.
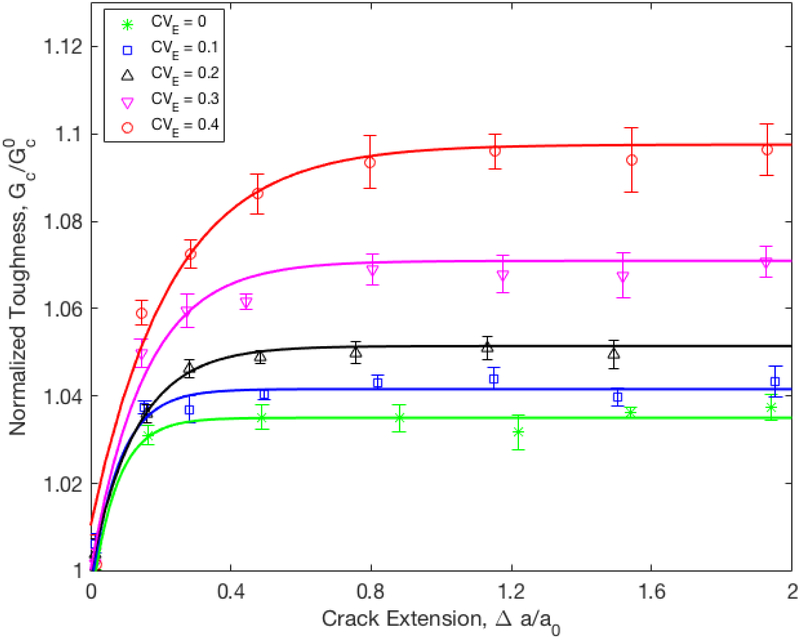
Fig. 7 and 8 make this observation quantitative. Fig. 7 shows the effective normalized toughness, , versus crack extension, Δa/a0 for the system with ϕt = 10% and several values of CVE. The data from Fig. 5 corresponding to ϕt = 10% and to CVE = 0 are added for reference. Several observations can be made. First, the heterogeneity enhances significantly the toughening effect. The effect increases as the distribution becomes broader, i.e. as CVE increases. Second, rendering the elastic constants in region B − ℑ stochastic increases the magnitude of crack trapping and hence increases the noise in the quantity reported in Fig. 7. Third, the toughening effect reaches a plateau at larger crack extensions than in the homogeneous case CVE = 0, for all values of CVE. This is due to the fact that increasing the level of heterogeneity requires larger stresses to be applied for crack propagation and hence the width of the transforming region increases. Hence, the trend seen here follows from the observation that the R-curve levels off once Δa/a0 becomes larger than the width of the transforming region.
Fig. 7.
Normalized effective toughness versus crack extension for models with ϕt = 10% and values of the coefficient of variation of the distribution of elastic moduli in B − ℑ, CVE ranging from 0 to 0.4. The bars represent the standard deviation computed over 20 replicas. The solid lines are guides to the eye.
Fig. 8.
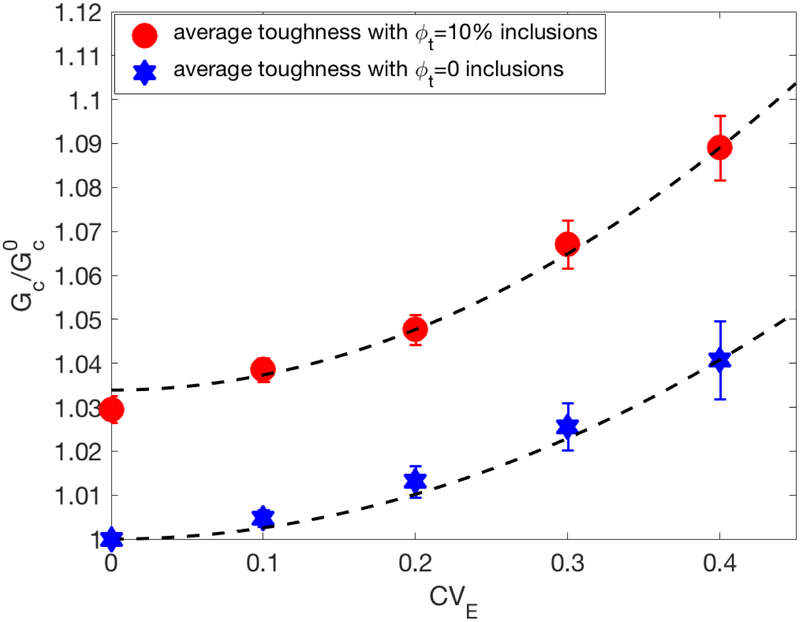
Enhancement of the toughening effect in presence of elastic heterogeneity in region B. This is entirely a field-mediated effect as the heterogeneity does not affect the local toughness, . The blue data points indicate the reference case with no eigenstrain toughening. The first red data point, at CVE = 0, represents the toughening produced by the eigenstrain mechanism in absence of elastic heterogeneity. The bars represent the average standard deviation in the plateau region for each value of the coefficient of variance CVE. The dashed lines are quadratic fits to the data, eq. (2).
Fig. 8 shows the variation of the value of the plateau in Fig. 7 with the coefficient of variation, CVE. The standard deviation of Gc due to enhanced stochasticity, as expected. The toughening effect increases considerably as the level of heterogeneity of the material elasticity increases. The curve indicates a toughening effect between 5% and 11% for bone with CVE in the range 0.2 to 0.5 (Thurner, 2009). If the material is considered homogeneous and with ϕt = 10% (Poundarik et al., 2012), the toughening effect is smaller, of only 2.9%. Allowing the elasticity to be heterogeneous with a coefficient of variation CVE = 0.4 the toughening effect increases to 8.9% relative to the homogeneous case with no dilatational bands. Therefore, the present study demonstrates the important role dilatational bands play in the overall bone mechanics.
It is also of interest to investigate the coupling effect between eigenstrain toughening and the elastic heterogeneity. To this end we consider cases with no transforming inclusions, ϕt = 0, and repeat the analysis using the elastically heterogeneous model. The data is shown in Fig. 8 (blue stars). Toughening is observed in this case to be due to the interaction of the crack tip with the elastic heterogeneity.
The variation of with CVE can be fitted with a quadratic function:
| (2) |
The fit is shown in Fig. 8 with dashed line.
The two curves in Fig. 8 are approximately parallel. The data sets corresponding to case with and without eigenstrain toughening can be fitted with eq. (2) and with α = 0.3447 and 0.2549 in the two cases, respectively. This indicates that the eigenstrain toughening and the toughening associated with the elastic heterogeneity of the material interact weakly and their effects are approximately additive. For the material parameter set considered here (Table 2), the eigenstrain toughening mechanism increases the effective material toughness by about 3%, while elastic heterogeneity adds another ~4% when CVE = 0.4.
4. Conclusions
Toughening mechanisms based on the occurrence of eigenstrains in the wake of the crack tip, such as transformation toughening and localized plasticity taking place in sub-domains/inclusions confined by an elastic matrix, are standard toughening mechanism for brittle materials. In this study, we investigate the effect of elastic heterogeneity on toughening and observe a significant enhancement of toughness as the level of elastic heterogeneity increases. The eigenstrain toughening effect increases approximately linearly with the area fraction of inclusions. The toughening induced by the elastic heterogeneity increases quadratically with the coefficient of variation of the distribution of elastic moduli. The results are discussed in the context of bone, in which dilatational bands are observed to occur in the vicinity of macrocrack tips. These are regions in which protein denaturation leading to inelastic strains takes place. The toughening effect of the dilatational bands acting independently from other toughening mechanisms is evaluated. Their effect is comparable with that of crack bridging which is currently considered the main toughening mechanism at small scales in bone.
Acknowledgement:
This work is supported by the US National Science Foundation (NSF) through grant CMMI 1363526.
References
- Abid N, Mirkhalaf M, Barthelat F, 2018. Discrete-element modeling of nacre-like materials: Effects of random microstructures on strain localization and mechanical performance. Journal of the Mechanics and Physics of Solids 112, 385–402. doi: 10.1016/j.jmps.2017.11.003 [DOI] [Google Scholar]
- Ahn BK, Curtin WA, Parthasarathy TA, Dutton RE, 1998. Criteria for crack deflection/penetration criteria for fiber-reinforced ceramic matrix composites. Composites Science and Technology. 58, 1775–1784. doi: 10.1016/S0266-3538(98)00043-8 [DOI] [Google Scholar]
- Bolander JE, Sukumar N, 2005. Irregular lattice model for quasistatic crack propagation. Physics Review. B 71, 094106. doi: 10.1103/PhysRevB.71.094106 [DOI] [Google Scholar]
- Bonfield W, O’Connor P, 1978. Anelastic deformation and the friction stress of bone. Journal of Materials Science. 13, 202–207. doi: 10.1007/BF00739292 [DOI] [Google Scholar]
- Budiansky B, Hutchinson JW, Lambropoulos JC, 1983. Continuum theory of dilatant transformation toughening in ceramics. International Journal of Solids and Structures. 19, 337–355. doi: 10.1016/0020-7683(83)90031-8 [DOI] [Google Scholar]
- Cannon NP, Schulson EM, Smith TR, Frost HJ, 1990. Wing cracks and brittle compressive fracture. Acta Metallurgica et Materialia. 38, 1955–1962. [Google Scholar]
- Chen Y-H, 1996. On the contribution of discontinuities in a near-tip stress field to the J-integral. International Journal of Engineering Science 34, 819–829. doi: 10.1016/0020-7225(95)00124-7 [DOI] [Google Scholar]
- Cowin SC, Sadegh AM, 1991. Non-interacting modes for stress, strain and energy in anisotropic hard tissue. Journal of Biomechanics. 24, 859–867. doi: 10.1016/0021-9290(91)90311-A [DOI] [PubMed] [Google Scholar]
- Deshpande VS, Needleman A, Van der Giessen E, 2002. Discrete dislocation modeling of fatigue crack propagation. Acta Materialia 50, 831–846. doi: 10.1016/S1359-6454(01)00377-9 [DOI] [Google Scholar]
- Diab T, Condon KW, Burr DB, Vashishth D, 2006. Age-related change in the damage morphology of human cortical bone and its role in bone fragility. Bone. 38, 427–431. [DOI] [PubMed] [Google Scholar]
- Eischen JW, Herrmann G, 1987. Energy release rates and related balance laws in linear elastic defect mechanics, Journal of Applied Mechanics 54, 388. [Google Scholar]
- Erdogan F, Joseph PF, 1989. Toughening of Ceramics through Crack Bridging by Ductile Particles. Journal of the American Ceramic Society. 72, 262–270. doi: 10.1111/j.1151-2916.1989.tb06112.x [DOI] [Google Scholar]
- Evans AG, Faber KT, 1983. Crack-Growth Resistance of Microcracking Brittle Materials. Journal of Applied Mechanics. 67, 255–260. [Google Scholar]
- Evans AG, Hutchinson JW, 1989. Effects of non-planarity on the mixed mode fracture resistance of bimaterial interfaces. Acta metallurgica. 37, 909–916. [Google Scholar]
- Faber KT, Evans AG, 1983. Crack deflection processes—I. Theory. Acta metallurgica 31, 565–576. [Google Scholar]
- Garvie RC, Hannink RH, Pascoe RT, 1975. Ceramic steel? Nature. 258, 703–704. doi: 10.1038/258703a0 [DOI] [Google Scholar]
- Jaeger JC, Cook NGW, Zimmerman RW, 2007. Fundamentals of rock mechanics. [Google Scholar]
- Jäger I, Fratzl P, 2000. Mineralized Collagen Fibrils: A Mechanical Model with a Staggered Arrangement of Mineral Particles. Biophysical Journal. 79, 1737–1746. doi: 10.1016/S0006-3495(00)76426-5 [DOI] [PMC free article] [PubMed] [Google Scholar]
- Koester KJ, Ager JW, Ritchie RO, 2008. The true toughness of human cortical bone measured with realistically short cracks. Nat Mater 7, 672–677. doi: 10.1038/nmat2221 [DOI] [PubMed] [Google Scholar]
- Launey ME, Buehler MJ, Ritchie RO, 2010. On the Mechanistic Origins of Toughness in Bone. Annu. Rev. Mater. Res 40, 25–53. doi: 10.1146/annurev-matsci-070909-104427 [DOI] [Google Scholar]
- Li FZ, Shih CF, Needleman A, 1985. A comparison of methods for calculating energy release rates. Engineering Fracture Mechanics. 21, 405–421. [Google Scholar]
- Mullins LP, Bruzzi MS, McHugh PE, 2007. Measurement of the microstructural fracture toughness of cortical bone using indentation fracture. Journal of Biomechanics 40, 3285–3288. doi: 10.1016/j.jbiomech.2007.04.020 [DOI] [PubMed] [Google Scholar]
- Nalla RK, Kinney JH, Ritchie RO, 2003. Mechanistic fracture criteria for the failure of human cortical bone. Nature Material. 2, 164–168. doi: 10.1038/nmat832 [DOI] [PubMed] [Google Scholar]
- Nalla RK, Kruzic JJ, Ritchie RO, 2004. On the origin of the toughness of mineralized tissue: microcracking or crack bridging? Bone. 34, 790–798. doi: 10.1016/j.bone.2004.02.001 [DOI] [PubMed] [Google Scholar]
- Nicolella D, Bonewald L, Moravits D, Lankford J 2005. Measurement of microstructural strain in cortical bone. European Journal of Morphology. 42, 23–29. doi: 10.1080/09243860500095364 [DOI] [PMC free article] [PubMed] [Google Scholar]
- Ortiz M, 1987. A Continuum Theory of Crack Shielding in Ceramics. Journal of Applied Mechanics 54, 55–58. [Google Scholar]
- Ortiz M, 1988. Microcrack Coalescence and Macroscopic Crack Growth Initiation in Brittle Solids. International Journal of Structures 23, 231–250. [Google Scholar]
- Pearson RA, Sue HJ, Yee AF, 2000. Toughening of plastics : advances in modeling and experiments. ACS symposium series: 759. [Google Scholar]
- Poundarik AA, Diab T, Sroga GE, Ural A, Boskey AL, Gundberg CM, Vashishth D, 2012. Dilatational band formation in bone. Proceedings of the National Academy of Sciences 109, 47, 19178–19183. doi: 10.1073/pnas.1201513109/-/DCSupplemental [DOI] [PMC free article] [PubMed] [Google Scholar]
- Poundarik AA, Wu P-C, Evis Z, Sroga GE, Ural A, Rubin M, Vashishth D, 2015. A direct role of collagen glycation in bone fracture. Journal of the Mechanical Behavior of Biomedical Materials. 52, 120–130. doi: 10.1016/j.jmbbm.2015.08.012 [DOI] [PMC free article] [PubMed] [Google Scholar]
- Pro JW, Lim RK, Petzold LR, Utz M, Begley MR, 2015. The impact of stochastic microstructures on the macroscopic fracture properties of brick and mortar composites. Extreme Mechanics Letters 5, 1–9. doi: 10.1016/j.eml.2015.09.001 [DOI] [Google Scholar]
- Qin Q, Ye J, 2015. Toughening mechanisms in composite materials. [Google Scholar]
- Ramanathan S, Ertaş D, Fisher DS, 1997. Quasistatic crack propagation in heterogeneous media. Physics Review Letter. 79, 873–876. doi: 10.1103/PhysRevLett.79.873 [DOI] [Google Scholar]
- Rice JR, 1968. A path independent integral and the approximate analysis of strain concentration by notches and cracks. Journal of Applied Mechanics. 35, 379. doi: 10.1115/1.3601206 [DOI] [Google Scholar]
- Sakai M, Yoshimura J-I, Goto Y, Inagaki M, 1988. R-curve behavior of a polycrystalline graphite: microcracking and grain bridging in the wake region. Journal of the American Ceramic Society.78, 609–616. [Google Scholar]
- Seref-Ferlengez Z, Basta-Pljakic J, 2014. Structural and mechanical repair of diffuse damage in cortical bone in vivo. Journal of Biomedical Research. 1–8. doi: 10.1002/jbmr.2366) [DOI] [PMC free article] [PubMed] [Google Scholar]
- Spanoudakis J, Young RJ, 1984. Crack propagation in a glass particle-filled epoxy resin. Journal of Materials Science.19, 473–486. doi: 10.1007/BF00553571 [DOI] [Google Scholar]
- Swanson PL, Fairbanks CJ, Lawn BR, Mai Y-W, Hockey BJ, 1987. Crack-interface grain bridging as a fracture resistance I, mechanism in ceramics: I, experimental study on alumina. Journal of the American Ceramic Society. 70, 279–289. doi: 10.1111/j.1151-2916.1987.tb04982.x [DOI] [Google Scholar]
- Tai K, Dao M, Suresh S, Palazoglu A, Ortiz C, 2007. Nanoscale heterogeneity promotes energy dissipation in bone. Nature Material. 6, 454–462. doi: 10.1038/nmat1911 [DOI] [PubMed] [Google Scholar]
- Tang SY, Vashishth D, 2007. A non-invasive in vitro technique for the three-dimensional quantification of microdamage in trabecular bone. Bone 40, 1259–1264. doi: 10.1016/j.bone.2006.10.031 [DOI] [PMC free article] [PubMed] [Google Scholar]
- Thurner PJ, 2009. Atomic force microscopy and indentation force measurement of bone. WIREs: Nanmed Nanobiotech. 1, 624–649. doi: 10.1002/wnan.56 [DOI] [PubMed] [Google Scholar]
- Tvergaard V, Hutchinson JW, 1992. The relation between crack growth resistance and fracture process parameters in elastic-plastic solids. Journal of the Mechanics and Physics of Solids 40, 1377–1397. doi: 10.1016/0022-5096(92)90020-3 [DOI] [Google Scholar]
- Vashishth D, 2007. Hierarchy of bone microdamage at multiple length scales. International Journal of Fatigue. 29, 1024–1033. doi: 10.1016/j.ijfatigue.2006.09.010 [DOI] [PMC free article] [PubMed] [Google Scholar]
- Vashishth D, Behiri JC, Bonfield W, 1997. Crack growth resistance in cortical bone: Concept of microcrack toughening. Journal of Biomechanics. 30, 763–769. doi: 10.1016/S0021-9290(97)00029-8 [DOI] [PubMed] [Google Scholar]
- Zheng Y, Chang SW, Yuan Z, 2000. Path-independent integral for heterogeneous media with respect to field discontinuities. Computational Materials Science 18, 212–224. doi: 10.1016/S0927-0256(00)00102-6 [DOI] [Google Scholar]


