

ABSTRACT
The state of nutritional health in the United States in the early part of the twentieth century was very different from today. Nutrient deficiencies and dental caries were prevalent health concerns for many Americans. In 1940, the US National Defense Advisory Commission asked the National Academy of Sciences for help in studying problems of nutrition in the United States. The outcome was issuance of the first RDAs. The goal of the RDAs was to recommend “…allowances sufficiently liberal to be suitable for maintenance of good nutritional status.” In the subsequent decades, a very different nutritional health challenge began to emerge for an increasing proportion of the population, that of overweight and obesity and risk of diet-related chronic disease. In part, as a response to this challenge, the RDA process was revised and the Dietary Reference Intakes (DRIs) were developed. The DRIs are a set of reference values that, when adhered to, predict a low probability of nutrient inadequacy or excessive intake. Recently, new DRI guidelines were proposed to define reference points for nutrient and food component intakes that influence risk of chronic disease. Developing DRIs for chronic disease endpoints presents unique challenges, notably, chronic diseases are multifactorial in nature and not directly nutrient-specific; the body of evidence supporting nutrients and other food substances as modifiers of risk of chronic disease is generally limited; and there is a lack of consistency in findings across study types. In addition, the latency of dietary exposures and chronic disease outcomes makes it difficult to demonstrate causality. Adapting the DRI model to meet the needs of the general population in the current context suggests a need to redefine the boundaries that describe the health of the population and to re-examine how indicators of chronic disease can be integrated effectively into the DRI process.
Keywords: dietary reference intakes, recommended dietary allowance, chronic disease, obesity, public health
Introduction
The DRI model has a rich history, beginning in the 1940s with the development of the first RDAs, for estimating nutrient intakes required to prevent nutrient deficiencies, support growth, and maintain health. The DRI process has evolved from the RDA, a single value, to specification of multiple reference values that encompass a safe range of intake. In recent years, as greater proportions of the population are living with ≥1 chronic diseases, interest has grown in considering chronic disease risk reduction when developing DRIs. In this review, our aims are, first, to illustrate how the process by which the current framework for deriving DRIs has developed in response to changes in the nutritional status of the US population; second, to review the strengths and weaknesses of the DRI framework in consideration of risk of chronic disease; and, third, to suggest future directions for filling evidence gaps as the DRI framework continues to evolve.
Development of the RDAs
In the first half of the twentieth century, nutritional deficiencies were more common than they are today in the general US population. For example, pellagra, a disease of niacin deficiency, was responsible for approximately 100,000 deaths in the United States from 1906 to 1940 (1). At the onset of World War II, 25% of military draftees were found to have evidence of current or past malnutrition and tooth loss was a frequent cause of rejection for military service (2). In response to the prevalence of malnutrition in the United States, the National Defense Advisory Commission (now called the Department of Defense), in 1940, asked the NRC of the National Academy of Sciences for aid in studying problems of nutrition in the United States. As an outcome of this request, the NRC established 2 new committees: the Committee on Food Habits and the Committee on Food and Nutrition (3). The product of the work of the Committee on Food and Nutrition was the RDAs, presented to the National Nutrition Conference for Defense in 1941, and subsequently published by the NRC in 1943 (4) (Figure 1). The goal of the RDAs was to recommend “…allowances sufficiently liberal to be suitable for maintenance of good nutritional status” (4). Nutrient allowances were established to maintain good nutrition in principally the total population, and not to meet the minimal needs of the average individual in a population. Further, the RDAs were designed to maintain the nutritional health of the population “under present conditions” (5). This meant that the RDAs included a margin of sufficiency above the minimal requirement to account for variations such as stress, as well as for growth and changes in physiologic function, but not to account for treatment of disease states or remediation of frank nutrient deficiency.
FIGURE 1.

Timeline of events in the development of the dietary reference intakes (4, 9, 10).
The RDAs derived during this period included recommendations for total energy, protein, iron, calcium, vitamins A and D, thiamin, riboflavin, niacin, and vitamin C (4). These nutrients were selected based on nutritional concerns related to national defense as well as to provide recommendations to the general population (6). Among the nutrients that were known at the time, but not included in the early RDAs were carbohydrate, fat, water, iodine, phosphorus, vitamin K, and sodium. These and other nutrients did appear in the narrative report in the 1945 revision as “further recommendations,” but they were not given RDA values. There was a narrative recommendation for salt (not sodium), but it only recognized that the usual daily intake exceeded the amount needed to replace normal losses (7). The evidence on physiological requirements for fat, iodine, phosphorus, and vitamin K was scant and likely not sufficient to determine an RDA value for all age and sex groups in the population (8). Based on the state of scientific knowledge for the nutrients, each subsequent edition of the RDAs included an expanded number of nutrients that were not covered in the previous editions.
The eighth revised edition (1974) of the RDAs introduced the concept of meeting the nutritional needs of the general “healthy” population (11). Specifically, the RDAs were defined as “the levels of intake of essential nutrients considered, in the judgment of the Food and Nutrition Board, on the basis of available scientific knowledge, to be adequate to meet the known nutritional needs of practically all healthy persons” (11, p. 2). Specification of the “healthy” population in the RDA definition, as in the previous definition, excluded individuals with frank disease states that required nutritional support beyond that which could be provided for from a normal dietary pattern. Notably, the definition did not include chronic disease in the general population.
Over the next several decades, as nutritional deficiency diseases receded from public health concern, risk of chronic disease began to emerge as a new public health concern. This included concern about the increasing prevalence of overweight and obesity across the population. In response, a number of events influenced how nutrient intake requirements were considered. An important contribution to the conversation was the landmark report, Diet and Health, which clearly identified the link between diet and chronic disease risk (Figure 1) (9). This report comprehensively reviewed the evidence available at the time on relations between dietary intake patterns and nutrient intake, and risk of major chronic diseases, including cardiovascular disease (CVD), hypertension, diabetes, cancer, osteoporosis, liver disease and dental caries (9). The 10th and last edition of the RDAs (1989) (12) responded to concerns about energy imbalance in the population by changing the way that the reference body weight was calculated—that is, from using ideal body weight as a baseline to a calculated reference weight based on resting energy expenditure plus an activity factor. In addition, the 10th edition, for the first time, acknowledged the potential role of “other substances in food” (12, pp. 262–272), although it did not establish any recommended intake values for them.
From RDAs to DRIs
The impetus for change in the RDA model was strengthened when the Food and Nutrition Board, in 1993, held a symposium and public hearing to explore questions about how future RDAs should be revised. This included consideration for expanding the RDA model to bring together the concepts of a health-promoting diet to reduce risk of chronic disease while meeting essential nutrient requirements (13). The report built on the concepts underpinning the existing RDA process. At that time, this meant identifying the target population groups within the generally healthy population, determining an average requirement for each group, statistically modeling the range of individual variability, assessing nutrient bioavailability in the food supply, and deriving allowances for each age and sex group that would include a margin of safety. What was new in the proposed revision was the introduction of the concept of how nutrient intake recommendations could play a role in prevention and management of chronic disease risk. The proposed revision was to expand the recommendations to include several reference points that could serve as a systematic approach to organizing and assessing the strengths and limitations in the supporting data for nutrients undergoing review.
Subsequently, the board initiated development of the new paradigm, the DRIs, to establish quantitative reference values that included both desirable and safe nutrient intake amounts. The reference values were developed jointly for the United States and Canada using a statistical model to predict a low probability of nutrient inadequacy or of excessive intake (Figure 2) (14). The reference points for nutrient and food component intakes were bounded by the estimated average requirement, and the safe upper level of intake (UL), which was based on a toxicological risk assessment model (14) to address concerns about the potential for harm from consuming high amounts of nutrients from fortified foods as well as dietary supplements. It also introduced the concept of a safe intake range and included recommendations for a variety of uses beyond what was feasible with the RDAs alone, including labeling and nutritional risk assessment (Figure 2) (14, 15). The newly developed DRI paradigm currently comprises a set of reference values, including the RDA, that represent quantitative estimates of nutrient intakes that can be used to assess and plan diets for both individuals and groups (Table 1).
FIGURE 2.
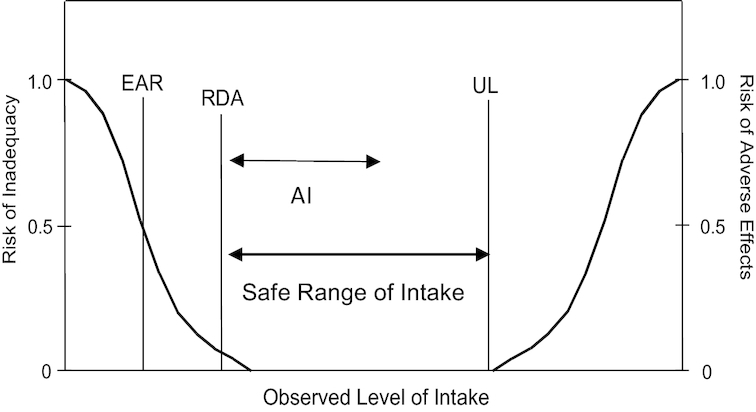
Relationship between dietary reference intake values. The estimated average requirement (EAR) is the intake at which the risk of inadequacy is 50% to an individual. The RDA is the intake at which the risk of inadequacy is very small, 2–3%. The Adequate Intake (AI) does not bear a consistent relation to the EAR or the RDA because it is set without the estimate of the requirement. At intakes between the RDA and the tolerable upper intake level (UL), the risks of inadequacy and of excess are both close to zero. At intakes above the UL, the risk of adverse effects may increase. Reprinted from references 14, 15 with permission.
TABLE 1.
DRI values defined
| DRI value | Definition |
|---|---|
| RDA | The average daily dietary nutrient intake sufficient to meet the nutrient requirements of nearly all (97–98%) healthy individuals in a particular life stage and gender group |
| AI | The recommended average daily intake based on observed or experimentally determined approximations or estimates of nutrient intake by a group (or groups) of apparently healthy people that are assumed to be adequate—used when an RDA cannot be determined |
| UL | The highest average daily nutrient intake that is likely to pose no risk of adverse health effects to almost all individuals in the general population. As intake increases about the UL, the potential risk of adverse effects may increase |
| EAR | The average daily nutrient intake estimated to meet the requirement of half the healthy individuals in a particular life stage and gender group |
| AMDR | The percentage of total energy intake. Intakes that fall above or below the range increase the potential for elevated risk of chronic disease, or risk of inadequate consumption of essential nutrients |
1The DRI categories represent quantitative estimates of recommended nutrient intakes. AI, Adequate Intake; AMDR, acceptable macronutrient distribution ranges; EAR, estimated average requirement; UL, tolerable upper intake level. Adapted from reference (26) with permission.
Current Status of Knowledge
Obesity as a public health concern
In 1974, when the RDAs were conceptually defined “to meet the known nutritional needs of practically all healthy persons” (11, p. 3), the prevalence of overweight and obesity in the United States was <15% across the population (16). In fact, the 1974 RDA report stated, “RDAs are intakes of nutrients that meet the needs of healthy people and do not take into account special needs arising from infections, metabolic disorders, chronic diseases, or other abnormalities that require special dietary treatment” (11, p. 3). Thus, the problems of overweight and obesity and associated risks were not considered in derivation of nutrient intake recommendations at the time.
However, over the subsequent 3–4 decades, overweight and obesity emerged as a major public health concern. Evidence for a continuing rise in the prevalence of obesity in the United States is well documented in data from the NHANES. Figure 3 and Figure 4 indicate an inflection point in the years 1976–1980, when the prevalence of obesity among children and adults, respectively, began to rise in the US population (17, 18). Dr. C. Everett Koop noted this trend in prevalence of overweight and obesity in his 1988 US Surgeon General's report: “As problems of nutritional deficiency have diminished in the US, they have been replaced by problems of dietary imbalance and excess” (19, p. 2). The marked increase in the prevalence of overweight and obesity in the US population was formally documented, and recognized in 1994, with publication of data on prevalence and BMI, collected between 1960 and 1991 in the NHANES (20).
FIGURE 3.
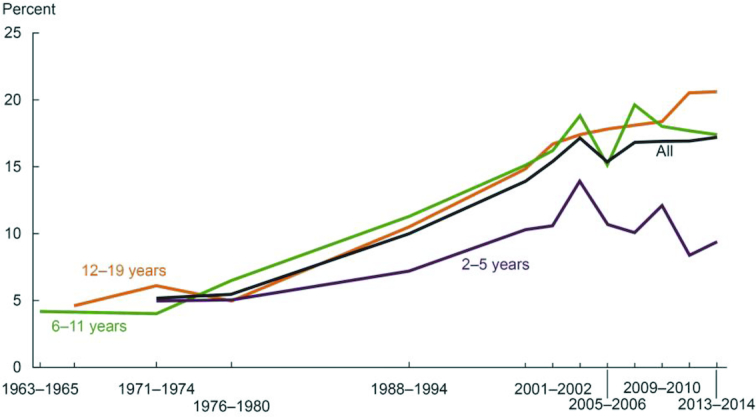
Trends in obesity among children and adolescents aged 2–19 y, by sex: United States, select years 1963–1965 through 2013–2014 (17). Obesity is defined as a BMI ≥ the sex- and age-specific 95th percentile from the 2000 Centers for Disease Control and Prevention Growth Chart.
FIGURE 4.
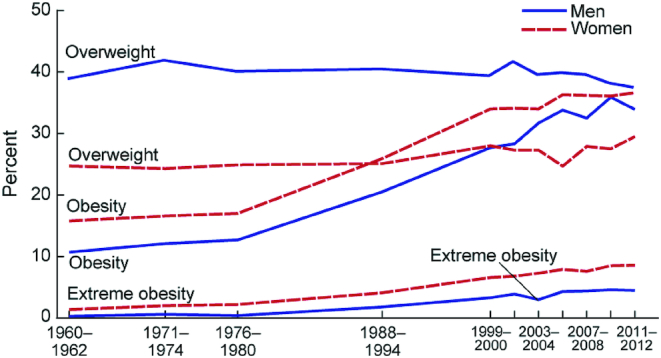
Trends in adult overweight, obesity, and extreme obesity among men and women aged 20–74 years: United States, selected years 1960–1962 through 2011–2012 (18). Age-adjusted by the direct method to the year 2000 US Census Bureau estimates using age groups 20–39 y, 40–59 y, and 60–74 y. Pregnant females were excluded. Overweight is a BMI ( kg/m2) of 25–29.9 ; obesity is BMI >30; and extreme obesity is a BMI >40.
As a public health concern, obesity is a major risk factor in many chronic diseases, including type 2 diabetes (T2D), cancers, hypertension, and CVD. The metabolic abnormalities of obesity, such as alterations in lipid amounts, insulin resistance and hyperinsulinemia, hypertension, and low-grade inflammation often lead to the metabolic syndrome and subsequently to T2D and coronary heart disease (CHD) or CVD (21). Many of the pathologic features of obesity that lead to the metabolic syndrome and T2D are also linked to cancer, such as metabolic imbalances, hormonal and growth factor imbalances, and chronic inflammation (22). As the prevalence of overweight and obesity have continued to rise in the United States, risk of chronic disease has increased as well, indicative of a shift in the overall health of the general population, despite recognition of the problem at a national level (23, 10). Whether this trend will continue is unknown. However, because chronic disease risk is long term, even if obesity prevalence stabilizes or decreases in the near term, the risk of chronic disease will remain in the population at large.
When the RDAs were replaced with the DRIs, beginning with the first DRI report in 1997 (Figure 1), the concept that “…the criterion or criteria chosen for a specific nutrient is for the healthy US and Canadian populations…” was retained (24, p. 22). At the same time, however, the new reference values were designed to include, where data existed and were sufficient, consideration of reduction in the risk of chronic degenerative disease—not just the absence of deficiency—in derivation of a recommended intake (24). Although the concept of a “healthy population” in these first DRI reports was not defined at the level of specificity noted in the 1974 RDA report (11), the rising prevalence of obesity and its associated risk of chronic disease clearly was recognized (20); and the determination of specific reference values in the DRI process included the concept of reducing risk of chronic disease.
Chronic disease risk and the DRI process
The first DRI values were derived for 35 micronutrients, energy, carbohydrate, fiber, fat, fatty acids, protein, and amino acids (25). The new paradigm also included a mechanism for deriving reference values for nonessential functional dietary components (e.g., isoflavones, flavonoids, and carotenoids) in foods. In the initial round of nutrient reviews that followed the new DRI process, several nutrients and fiber were reviewed in light of chronic disease endpoints or surrogate markers for risk of disease. These included risk of osteoporosis for vitamin D and calcium (24), dental caries for fluoride (24), CHD for fiber (26), and markers of hypertension for sodium and potassium (27). For these nutrients and fiber, the evidence to support the DRI process did not lend itself to derivation of an RDA and, in some cases, a UL was not possible, or no risk from high intakes was indicated. Nonessential dietary components and nutrients are not nutrients of adequacy, and thus do not fit the DRI model in which an intake distribution curve serves as the basis for identifying the percentage of the population with adequate intakes (Figure 5) (12). At the time of the review of these food components and nutrients with potential chronic disease endpoints, the only reference value that could be assigned to them was the Adequate Intake (AI), an estimate of nutrient adequacy by an apparently healthy population (Figure 2) (14, 15). For nutrients with chronic disease endpoints, although AIs can be useful as reference values for estimating intake requirements, they present a challenge to public health applications. For example, a major impediment to using the AI in planning for groups is the uncertainty in estimating prevalence of inadequate intakes for a proportion of the population (28).
FIGURE 5.
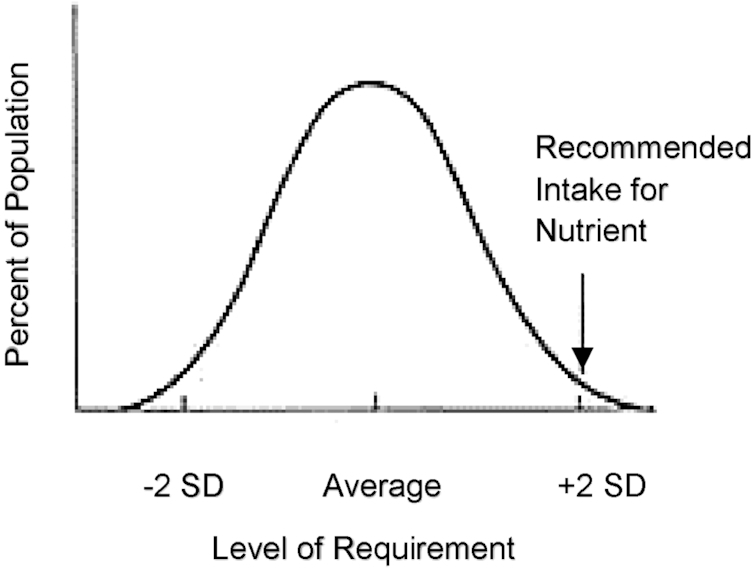
Population intake distribution curve. The 50th percentile (average) represents the point at which half the population has intakes at or above the estimated average requirement, and half of the population intakes are less than the average requirement. Reprinted from references 12, 15 with permission.
Among the nutrients and food substances previously considered for chronic disease, only vitamin D and calcium are nutrients of adequacy, that is, those for which there is a known nutritional requirement. In a subsequent review of calcium and vitamin D, the evidence was sufficient to derive an RDA based on bone health outcomes (29). Sodium is unique in that, although it is an essential nutrient, given dietary patterns and food sources in the United States, there is effectively no evidence of inadequacy for this nutrient. Thus, for sodium the concern is one of excess intake. For fiber, a small set of prospective population studies reviewed in the 2002/2005 DRI report on macronutrients (26) found a strong relation between total dietary fiber intake from foods and CHD risk. These studies, however, found a continuous effect of fiber on heart disease risk across a range of intakes, thus it was not possible to set an estimated average requirement. The AI derived for fiber was based on calculation of g consumed.kcal−1.d−1. In addition, no UL was set based on the assumption that high intake would be self-limited (26). A subsequent outcome of the DRI process that moved the field forward in chronic disease risk was derivation of a formal definition for dietary fiber (30). This important result helped substantiate the evidence establishing a link between a dietary factor, fiber, and risk of a chronic disease, CHD, identified in the previous DRI review (26).
Challenges for future DRIs with chronic disease endpoints
Establishing causality in developing DRIs for chronic disease endpoints presents a particular set of challenges. These include, among others, the multifactorial nature of chronic diseases, the extended period of time between exposure and outcome, variance in results across different study designs, and the limited ability, or inability, to establish a relative risk of developing a given health outcome based on dietary intake.
Chronic diseases are multifactorial in nature and not directly nutrient-specific, therefore identification of a dose-response relation relative to a given health outcome is difficult. In addition, risk factors for chronic disease can be established early in life, such as during fetal development through epigenetic mechanisms (31, 32). Other modifiable and nonmodifiable risk factors accumulate over decades of exposure, contributing to the overall probability of a disease outcome (33).
The body of evidence supporting nutrients and other food substances as modifiers of risk of chronic disease is generally limited, and often there is a lack of consistency of findings across different study types. Randomized controlled trials (RCTs) are useful for demonstrating causality, but they rarely reflect the range of habitual intakes among free-living individuals and a direct causal relation is difficult to replicate in an RCT when exposure and outcome are separated by a long period of time. Observational evidence, on the other hand, although more reflective of “real life” dietary intakes, has limited utility in supporting a causal relation between intake and health outcome, and observational results do not always replicate those obtained from RCTs. Further, because of the probability of confounding, determinations of disease risk from observational studies are never precise in a population or subgroup.
Recently, consideration of options for ways to include chronic disease endpoints in future DRI reviews was undertaken by an expert panel convened by the National Academies of Sciences, Engineering, and Medicine (34). In the course of the study, the panel identified 2 conceptual and methodological challenges as central to developing DRIs for chronic disease endpoints. These are 1) evaluating dietary intake measures, and 2) identifying and measuring chronic disease health outcomes. Often there is uncertainty in the projected magnitude and/or direction of risk reduction effectiveness of any dietary substance for a given chronic disease outcome. Critical to establishing a dose-response or causal relation between a nutrient or food substance and a given health outcome is the ability to measure dietary intake while minimizing factors, such as confounding and risk of bias, that contribute to uncertainty. Methodologies currently used to assess intakes among free-living individuals, however, have long been known to underestimate actual intakes based on the uncertainties inherent in self-reporting (35, 36, 37). As with measuring dietary intake, equally critical is the ability to identify measures of a chronic disease outcome such as surrogate markers, intermediate endpoints, or other biomarkers of effect (38). Absent validated biomarkers of long-term intake and accurate quantitative intake assessment from self-reported intake data, identifying a clear causal relation is difficult. Taken together, these challenges set a high bar for deriving an approach to incorporating chronic disease endpoints into the DRI process. The 2017 committee to develop guidelines for chronic disease DRIs, however, undertook the challenge and made its recommendations for a pathway forward for future DRI review committees (34).
Options for modifying the DRI process to include chronic disease endpoints
As part of its task, the 2017 committee to develop guidelines for chronic disease DRIs was given a summary paper of various options for answering questions about diet-disease relations underlying risk of chronic disease (39). The paper, referred to as the “options report” was the outcome of a multidisciplinary working group sponsored by the Canadian and US government DRI steering committees. The group's objective was to provide options in response to scientific challenges related to setting DRIs for nutrients or other food components associated with chronic disease endpoints. The working group focused on 3 crucial questions. First, what are the important evidentiary challenges for selecting and using chronic disease endpoints in future DRI reviews? Second, what intake-response models can future DRI committees consider when using chronic disease endpoints? Lastly, what are the arguments for and against continuing to include chronic disease endpoints in future DRI reviews? The options report further outlined the range of options identified by the working group for responding to these questions and included an assessment of the strengths and weaknesses of each option (39).
Among the options (34) considered by the chronic disease DRI committee were:
Whether to maintain the existing process of incorporating chronic disease endpoints into the current DRI development approach or develop a distinct process to complement the existing DRI process;
Whether to continue to consider, as a distinct process, food substances that may be either interrelated in their apparent causal relationship, or clustered according to their apparent causal relationship to a given chronic disease;
When to apply surrogate markers of disease rather than chronic disease endpoints, based on disease prevalence; and
What level of certainty would be needed to support a judgment that an observed association could be considered as causal?
In response to the challenge of evaluating dietary intake measures, the committee concluded that the nature and quality of nutrient intake instruments are diverse; and that self-reported measures might be essential for some purposes even though they inherently suffer from both random errors and systematic biases. In addition, although biomarkers of intake, which are more objectively quantifiable, can replace self-report for some purposes, only a few nutrients have validated biomarkers. Lastly, no one single approach accurately measures dietary intake in a comprehensive manner for all nutrients, thus each study methodology must be assessed based on its own merits (40).
In response to the challenge of identifying and measuring chronic disease health outcomes, the committee concluded that studies that explore relations between nutrients or food substances and chronic disease outcomes vary in the nature and quality of the health outcome measure. High-quality measures of chronic disease outcomes are ideal when developing DRIs based on reducing risk of chronic disease. However, outcome measures may be flawed, and sufficient data on associations between nutrient exposure and expected outcome do not always exist. The criteria for a qualified surrogate marker are 1) that analytical validation exists; 2) the surrogate marker is on the causal pathway in disease pathogenesis; 3) the surrogate marker is significantly associated with the disease in a target population; 4) the surrogate marker consistently changes with the health outcome in response to a nutritional intervention; 5) a change in the surrogate marker supports a substantial change in the disease response to exposure to the nutrient or food substance; and 6) the context of the surrogate's use is defined (40, 41). The committee supported the option that studies that measure qualified surrogate markers should be considered when evaluating evidence for a causal relation; however, it did not support using nonqualified intermediate markers, because they could lead to serious misinterpretation of DRIs by users (34).
In response to the issue of uncertainty in establishing causality, the committee noted the importance of the selection of methodological tools used to evaluate evidence. In considering chronic disease endpoints, the challenge in obtaining evidence using a RCT approach, is that, because conducting randomized trials is often not feasible, the available evidence is principally observational. Problems such as confounding, bias, and inaccuracy in determining exposure-response relations introduce a high level of uncertainty into the assessment process for this type of evidence. To address these issues, the committee recommended use of a well-designed systematic review to identify relevant studies, including observational evidence as a complement to available RCTs, then applying the Grading of Recommendations, Assessment, Development and Evaluation assessment to determine the strength of the evidence. Importantly, for observational studies to show a causal relation between exposure and outcome, the Grading of Recommendations, Assessment, Development and Evaluation assessment would have to show at least a moderate rating for the relevant evidence base (34).
Conclusions
The current framework of the DRIs is built on a rich history of dietary recommendations, linked to and intertwined with changes in the nutritional status of the US population. The DRI process has evolved from the RDA, a single value, to specification of multiple reference values that encompass a safe range of intake. Now this process faces new challenges with respect to using endpoints for the reduction of risk of chronic diseases such as CHD, CVD, hypertension, T2D, cancer, osteoporosis, dental caries, and nonalcoholic liver disease, which have become increasingly prevalent in the US and Canadian populations. However, establishing a relation between a nutrient or food substance and a given health outcome is complicated by the multifactorial nature of chronic disease risk, the length of time from exposure to outcome, and the difficulty of using biomarkers or surrogate endpoints to predict disease risk.
Although the first DRI reviews included consideration of chronic disease risk in setting recommended values, to date, with the exception of calcium and vitamin D and bone health, there has been no RDA derived for any other nutrient or food substance associated with a chronic disease endpoint. There are additional challenges to setting a UL for a chronic disease endpoint. These include identification and/or quantification of a threshold of toxicity among a large and diverse population, variability within the population in sensitivity to high exposure to a given nutrient, bioavailability of the nutrient, and possible nutrient-nutrient interactions (i.e., confounders of disease risk).
Thus, the current DRI model has not been shown to be particularly adaptable to setting DRI values for chronic disease endpoints. With the AI, and possibly UL, as the only feasible options for many nonessential food substances and some nutrients, such as sodium, for which there is no evidence for toxicity that could be used to establish a UL, clearly a different approach is needed. In response to these challenges, a committee of the National Academies undertook the task of considering a range of options for deriving chronic disease DRIs. Their recommendations have now been published as guidance for future DRI reviews, although how these options will be applied in future reviews has yet to be decided.
Topics for future action
The DRI paradigm, as originally conceived, included 2 types of endpoints—to ensure adequacy of intake and to avoid excess. This model was developed with the concept of including both nonchronic (essential nutrients), and chronic (nonessential nutrients and other food substances) disease endpoints in deriving reference values. In practice, however, the derivation of reference values for chronic disease endpoints has proven to be challenging, largely because the model is based on the concept of assuring intake adequacy and, for the UL, an upper limit threshold based on adverse outcomes. An additional challenge will be to identify health outcomes that are representative of the general population.
For both nonchronic and chronic disease outcomes, as the process for deriving nutrient reference values continues to evolve, questions about how to consider target populations in the DRI process will arise. With nearly 40% of the adult population currently at risk of ≥1 chronic disease, it is clear that the concept of a healthy population needs to be reconsidered. In addition, it will be important to re-examine how indicators of chronic disease can be integrated effectively into the DRI process. This could include developing specific DRIs for at-risk subgroups, including adults and children, within the general population when relevant study design(s) and approaches to risk stratification are sufficiently robust.
Future research in support of DRI development might include such areas as biomarker validation for nutrients and other food substances, including bioactive compounds; dose-response research to identify safe and effective upper and lower intakes for both essential and nonessential nutrients and other food substances; and evaluation of the relevance of extrapolating data from adults to children and infants.
Although there are research gaps that need to be filled, as new DRI reviews are undertaken and the recommendations for chronic disease DRIs are incorporated into the process, generating intake recommendations to support a health-promoting diet to reduce risk of chronic disease and meet essential nutrient requirements is a feasible goal.
ACKNOWLEDGEMENTS
The authors thank Shiriki Kumanyika and Maria Oria for their careful review of the manuscript and helpful suggestions. The authors’ responsibilities were as follows—ALY and ACR: contributed equally to the development and writing of the manuscript; and read and approved the final paper.
Notes
No direct support was provided to the authors.
Author disclosures: ALY and ACR, no conflicts of interest. The author's work was conducted independently of their roles as director (ALY) and member (ACR) of the Food and Nutrition Board. Any views not attributed to reports of the Health and Medicine Division are those of the authors and do not necessarily represent the views of The National Academies of Sciences, Engineering, and Medicine.
Abbreviations used: AI, Adequate Intake; CHD, coronary heart disease; CVD, cardiovascular disease; RCTs, randomized controlled trials; T2D, type 2 diabetes; UL, tolerable safe upper intake level.
References
- 1. Bollet AJ. Politics and pellagra: the epidemic of pellagra in the U.S. in the early twentieth century. Yale J Biol Med. 1992; 65:211–21. [PMC free article] [PubMed] [Google Scholar]
- 2. Centers for Disease Control and Prevention (CDC). Safer and healthier foods. MMWR Morb Mortal Wkly Rep. 1999; 48(40):905–13. [PubMed] [Google Scholar]
- 3. NAS (National Academy of Sciences). The Food and Nutrition Board 1940–1965: twenty-five years in retrospect. Washington (DC): National Academy of Sciences, National Research Council; 1965. [Google Scholar]
- 4. National Research Council (NRC). Recommended Dietary Allowances. Reprint and Circular Series no. 115. Washington (DC): National Research Council: 1943. [Google Scholar]
- 5. NAS. Recommended Dietary Allowances. Pub 589, Washington (DC): National Academy of Sciences - National Research Council: 1958. [Google Scholar]
- 6. Roberts LJ. Beginnings of the recommended dietary allowances. J Am Diet Assoc. 1958; 34:903–8. [PubMed] [Google Scholar]
- 7. NRC. Recommended Dietary Allowances. Washington (DC): National Research Council; 1945. [Google Scholar]
- 8. Roberts LJ. Scientific basis for the recommended dietary allowances. N Y State J Med. 1944; 44:59–65. [Google Scholar]
- 9. NRC. Diet and health: implications for reducing chronic disease risk. Washington (DC): National Academies Press; 1989. [PubMed] [Google Scholar]
- 10. IOM. Accelerating progress in obesity prevention. Washington (DC): National Academies Press; 2012. [PubMed] [Google Scholar]
- 11. NRC. Recommended Dietary Allowances. Washington (DC): National Academy of Sciences; 1974. [Google Scholar]
- 12. NRC. Recommended Dietary Allowances. 10th edition Washington (DC: ): National Academies Press; 1989. [PubMed] [Google Scholar]
- 13. Institute of Medicine (IOM). How should the Recommended Dietary Allowances be revised?. Washington (DC): National Academies Press; 1994. [PubMed] [Google Scholar]
- 14. IOM. Dietary reference values. A risk assessment model for establishing upper intake levels for nutrients. Washington (DC): National Academies Press, 1998. [PubMed] [Google Scholar]
- 15. IOM. Dietary Reference Intakes: guiding principles for nutrition labeling and fortification. Washington (DC): National Academies Press; 2003. [PubMed] [Google Scholar]
- 16. Organisation for Economic Co-operation and Development (OECD). Obesity update [Internet] OECD Directorate for Employment, Labour and Social Affairs. 2014. Available from: http://www.oecd.org/els/. [Google Scholar]
- 17. Fryar CD, Carroll MD, Ogden CL. Prevalence of overweight and obesity among children and adolescents: United States, 1963–1965 through 2013–2014 [Internet]. 2016. Available from: https://www.cdc.gov/nchs/data/hestat/obesity_child_13_14/obesity_child_13_14.pdf.
- 18. Fryar CD, Carroll MD, Ogden CL. Prevalence of overweight and obesity among adults: United States, 1960–1962 through 2011–2012 [Internet]. 2014. Available from: https://www.cdc.gov/nchs/data/hestat/obesity_adult_11_12/obesity_adult_11_12.htm.
- 19. U.S. Department of Health and Human Services (DHHS). The Surgeon General's Report on Nutrition and Health. Public Health Service publication no. 88–50210. US Government Printing Office; 1988. [Google Scholar]
- 20. Kuczmarski RJ, Flegal KM, Campbell SM, Johnson CL. Increasing prevalence of overweight among US adults. JAMA. 1994; 272(3):205–11. [DOI] [PubMed] [Google Scholar]
- 21. Tarry-Adkins JL, Ozanne SE. Mechanisms of early life programming: current knowledge and future directions. Am J Clin Nutr. 2011; 94(Suppl):1765S–71S. [DOI] [PubMed] [Google Scholar]
- 22. Goodwin PJ, Stambolic V. Impact of the obesity epidemic on cancer. Annu Rev Med. 2015; 66:281–96. [DOI] [PubMed] [Google Scholar]
- 23. O'Flanagan CH, Bowers LW, Hursting SD. A weighty problem: metabolic perturbations and the obesity-cancer link. Horm Mol Biol Clin Investig. 2015; 23:47–57. [DOI] [PMC free article] [PubMed] [Google Scholar]
- 24. IOM. Dietary Reference Intakes for calcium, phosphorus, magnesium, vitamin D, and fluoride. Washington (DC): National Academies Press; 1997. [PubMed] [Google Scholar]
- 25. Otten J, Pitzi Hellwig J, Meyer LD. Dietary Reference Intakes: the essential guide to nutrient requirements. Washington (DC): National Academies Press; 2006. [Google Scholar]
- 26. IOM. Dietary Reference Intakes for energy, carbohydrate, fiber, fat, fatty acids, cholesterol, protein, and amino acids. Washington (DC): National Academies Press; 2002/2005. [DOI] [PubMed] [Google Scholar]
- 27. IOM. Dietary Reference Intakes for water, potassium, sodium, chloride, and sulfate. Washington (DC): National Academies Press; 2005. [Google Scholar]
- 28. IOM. Dietary Reference Intakes: applications in dietary planning. Washington (DC): National Academies Press; 2003. [PubMed] [Google Scholar]
- 29. IOM. Dietary Reference Intakes: calcium and vitamin D. Washington (DC): National Academies Press; 2011. [PubMed] [Google Scholar]
- 30. IOM. Dietary Reference Intakes: proposed definition of dietary fiber. Washington (DC): National Academies Press; 2001. [PubMed] [Google Scholar]
- 31. Van De Maele K, Devlieger R, Gies I. In utero programming and early detection of cardiovascular disease in the offspring of mothers with obesity. Atherosclerosis. 2018; 275:182–95. [DOI] [PubMed] [Google Scholar]
- 32. Parekh N, Zizza C. Life course epidemiology in nutrition and chronic disease research: a timely discussion. Adv Nutr. 2013; 4:551–3. [DOI] [PMC free article] [PubMed] [Google Scholar]
- 33. National Academies of Sciences, Engineering, and Medicine (NASEM). Driving Action and Progress on Obesity Prevention and Treatment: proceedings of a workshop. Washington (DC): National Academies Press; 2017. [PubMed] [Google Scholar]
- 34. NASEM. Developing Dietary Reference Intakes based on chronic disease. Washington (DC): National Academies Press; 2017. [PubMed] [Google Scholar]
- 35. Schoeller DA. How accurate is self-reported dietary energy intake? Nutr Rev. 1990; 48(10):373–9. [DOI] [PubMed] [Google Scholar]
- 36. Tran KM, Johnson RK, Soultanakis RP, Matthews DE. In-person vs telephone-administered multiple-pass 24-hour recalls in women: validation with doubly labeled water. J Am Diet Assoc. 2000; 100:777–80., 783. [DOI] [PubMed] [Google Scholar]
- 37. Wacholder S. When measurement errors correlated with the truth: surprising effects of nondifferential misclassification. Epidemiology. 1995; 6:157–61. [DOI] [PubMed] [Google Scholar]
- 38. IOM. Perspectives on biomarker and surrogate endpoint evaluation. Washington (DC): National Academies Press; 2011; [PubMed] [Google Scholar]
- 39. Yetley EA, MacFarlane AJ, Greene-Finestone LS, Garza C, Ard JD, Atkinson SA, Bier DM, Carriquiry AL, Harlan WR, Hattis D et al.. Options for basing Dietary Reference Intakes (DRIs) on chronic disease endpoints: report from the joint US/Canadian sponsored working group. Am J Clin Nutr. 2017; 105(Suppl):249S–85S. [DOI] [PMC free article] [PubMed] [Google Scholar]
- 40. Calder PC, Boobis A, Braun D, Champ CL, Dye L, Einother S, Greyling A, Matthy C, Putz P, Woperesis S et al.. Improving selection of markers in nutrition research: evaluation of the criteria proposed by the ILSI Europe Marker Validation Initiative. Nutr Res Rev. 2017; 30(1):73–81. [DOI] [PubMed] [Google Scholar]
- 41. IOM. Evaluation of biomarkers and surrogate endpoints in chronic disease. Washington (DC): National Academies Press; 2010. [PubMed] [Google Scholar]