Abstract
Electrochemical skin conductance (ESC) has been suggested as a noninvasive diabetic screening tool. We examined the relevance of ESC method for screening type 2 diabetes. A meal tolerance test (MTT) was conducted for 40 diabetic and 42 control subjects stratified by age, sex and body mass index (BMI). The glucose levels and ESC were measured before the MTT and every 30 min after meal intake up to 120 min. There was no correlation between the blood glucose level and ESC (r = 0.249) or ESC variability (ESCV) (r = − 0.173). ESC (ESCV) was higher (lower) in diabetic patients than in normal control (p = 0.02 for ESC and p = 0.06 for ESCV). Receiver operating characteristic analysis showed that the area under the curve (AUC) values of the ESC and ESCV were 0.654 and 0.691, respectively. The novel variable, ESCV, showed 5.7% higher AUC than ESC. Contrary to some previous reports, ESC values in diabetic patients was higher than in age, sex and BMI matched control group. In our study, ESC or ESCV showed a marginal accuracy to be used as a screening tool for diabetes mellitus.
Keywords: Electrochemical skin conductance (ESC), Diabetes, Noninvasive diagnosis, Oral glucose tolerance test
Introduction
According to the National Health Insurance Corporation data released by the Ministry of Health and Welfare of Korea in 2016, the incidence of diabetes in Korea increased by 25% from approximately 2 million to 2.5 million between 2010 and 2015. Globally, it has increased four times between 1980 and 2014, reaching 422 million people, accounting for approximately 8.5% of the world’s population [1]. Signs of early diabetes mellitus are not well documented, and early detection is difficult because the rate of progression is significantly slower than that in most diseases. Diabetes is also associated with neuropathy, vascular injury and various complications [2–4]. Because diabetes is irreversible and requires continuous blood glucose management, continuous blood glucose monitoring is essential for the health maintenance of diabetic patients. Blood glucose monitoring is commonly practiced by invasive blood sampling, which can be both uncomfortable and unsanitary. Recently, various non-invasive blood glucose monitoring methods have been proposed to overcome the disadvantages of conventional blood glucose monitoring [5]. The techniques used for the measurement of non-invasive blood glucose include reverse iontophoresis, bioimpedance spectroscopy, heat irradiation spectroscopy, absorption spectroscopy, photoacoustic spectroscopy, Raman spectroscopy, ultrasound, electromagnetic measurement, temperature control local reflection, and optical coherence tomography.
Recently, electrochemical skin conductance (ESC) has been used as a noninvasive diabetic screening tool [6] to measure the concentration of ions released from sweat glands by applying a voltage to the skin and measuring the change in electrical conductivity. ESC is based on reverse iontophoresis and electrochemistry. For example, when an applied voltage is gradually increased by attaching an electrode to a peripheral limb with high sweat gland density (e.g., a hand or a foot), a voltage value at which a current begins to flow can be measured to determine the concentration of the discharged ions. Here, the concentration of the discharged ions through the voltage application is related to the degree of activity of the sweat glands [7, 8]. As diabetes progresses, degeneration of the peripheral nerve fibers reduces the nerve distribution of the exocrine glands and eventually leads to diminished gland function [9, 10]. Therefore, ESC has the potential to be used as a non-invasive tool to screen diabetes mellitus and its progression [6].
Attempts to verify the association between ESC and diabetes mellitus have been reported in recent publications. In particular, ESC classifies patients with diabetic neuropathy as relatively high performance (AUC 0.7) [11]. However, some studies [9, 12–18] have limited clinical validity because they did not adequately account for confounding effects such as age, gender or obesity. In addition, many studies have focused on patients with diabetes-related complications such as heart disease and neuropathy.
In this study, ESC measurements were performed on patients with type 2 diabetes without regard to the specific complications associated with diabetes mellitus in order to test the validity of ESC experimentally. For this purpose, we emphasize that we selected the control group through stratified sampling considering the demographic information of diabetic patients. We proposed a novel approach using ESC as a non-invasive method of testing the diabetes mellitus. A protocol was developed and experimentally tested to verify this method.
Methods
Study design and participants
A clinical study was conducted from June 2016 to February 2017, with the approval of the Institutional Review Board at Dunsan Korean Medicine Hospital of Daejeon University (IRB number: DJDSKH-16-BM-04), and was registered with the Clinical Research Information Service (registration number: KCT0002132). Subjects with hypertension (SBP(Systolic blood pressure) is greater than 160 mmHg or DBP(Diastolic blood pressure) greater than 90 mmHg), hypothyroidism, severe renal disease, liver dysfunction, cardiovascular disease, thyroid disease, pacemaker, hypersensitivity to electronic devices, anemia and physical handicaps were excluded. Pregnant or lactating women, or those with taking contraceptives were also excluded.
Diabetic patients were defined as those with mild and moderate diabetes mellitus regardless of type of diabetes, fasting blood glucose (FPG) levels greater than 126 mg/dl, or glycated hemoglobin (HbA1c) greater than or equal to 48 mmol/mol (6.5%). Patients whose FPG level was higher than 250 mg/dl or HbA1c concentration higher than 69.4 mmol/mol (8.5%) were excluded due to the risk. For the patient group, concomitant medications related to regulating blood glucose were allowed during the study. Controls were defined those with no history of diabetes, FPG levels < 100 mg/dl and HbA1c levels < 42 mmol/mol (6%). The FPG and HbA1c concentrations were measured from blood plasma using standardized laboratory methods. All participants were informed about the purpose and method of the study and agreed to participate in the study with written informed consent.
Based on the results of the 2010 Population and Housing Census [19] and 2014 National Health and Nutrition Examination [19] released by the Korea Statistical Office for sampling, the data was collected according to sex, age group (40 s, 50 s, and 60 years old and older), and body mass index (BMI) (less than 25 and more than 25) and were used as stratification variables; sample allocation based on Neyman’s method was performed for a total of 12 layers.
Measurements
We established a standard meal tolerance test (MTT) protocol to investigate the influence of diabetes mellitus on ESC at the stage of fasting and blood glucose modulation (Fig. 1). As shown in Fig. 1, a basic questionnaire, measurement of physical information, and Privacy Policy Agreement were conducted at the first visit (Visit 1). A second visit (Visit 2) was arranged within 1 week for the eligible subjects. Glucose and ESC were measured according to the MTT protocol.
Fig. 1.
Outline of the study protocol. Participants visited twice. The questionnaire and measurement of physical information were obtained at the first visit, and physiological data such as temperature, glucose level, and Sudoscan measurement were obtained at the second visit
At Visit 2, after 8 h of fasting, vital signs such as body temperature and blood pressure were measured, and blood was collected from the vein. ESC was measured on both hands and feet using a Sudoscan device (Impeto Medical, Paris, France) [20]. SUDOSCAN is a device capable of measuring galvanic skin responses as shown in Table 1. Sudoscan is a quick, non-invasive device for the assessment of sudomotor function through evaluation of sweat gland secretory function as an early reflection of sympathetic nerve impairment [21]. Measurement is based on an electrochemical reaction between electrodes and chloride ions, after stimulation of sweat glands by a low-voltage current. A measurement of conductance for the hands and feet is generated from the derivative current associated with the applied voltage [11].
Table 1.
The specification of Sudoscan
| Value | |
|---|---|
| Sampling frequency | 100 Hz |
| Resolution | 1 nanoSiemens |
| Precision | ± 1% |
| Measurement voltage | 1–4 V DC |
| Frequency | 0 Hz (DC current) |
| Number of electrodes | each two electrodes for foot and hands |
The electrodes of the Sudoscan were kept clean by removing dust at every measurement, as shown in Fig. 2. Each Sudoscan measurement lasted approximately 5 min. After the fasting period, the subjects were given a pre-prepared amount of food: bread and juice containing a calorie equivalent to that of 75 grams of glucose. Blood sampling and ESC measurement by Sudoscan were performed at 30, 60, 90 and 120 min after the food intake. At each measurement point, the blood glucose levels were monitored not to exceed the risk level using a portable glucose monitoring device (Johnson & Johnson, New Jersey, USA).
Fig. 2.
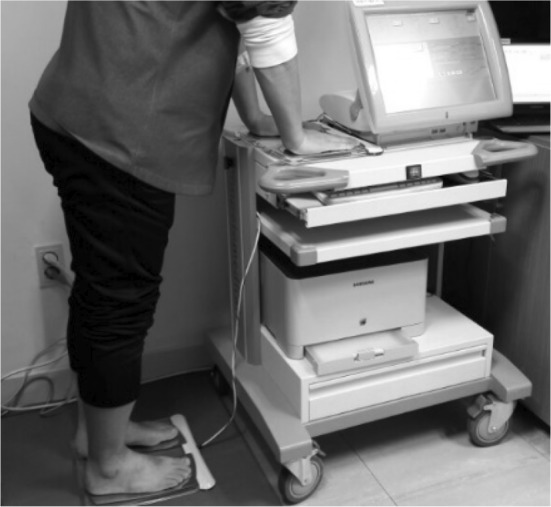
Measuring ESC using a Sudoscan device. The subject puts his/her hands and feet on the electrodes
For classification of diabetic patients, we used fasting-state ESC (ESC0), as well as ESC values at 30 min (ESC30), 60 min (ESC60), 90 min (ESC90), and 120 min (ESC120) after the meal intake. In addition, we defined ESC variability (ESCV) in Eq. (1) in order to reduce the individual difference and used it for the analysis with the assumption that the electrophysiological changes due to the MTT would be different between the diabetic patients and control group.
| 1 |
ESCV represents the difference between the maximum and minimum of the ESC values measured five times within 2 h according to the MTT protocol. We obtained ESCVs at the hands (ESCVhands) and feet (ESCVfeet) by Eq. (1) and further calculated their average (ESCVavg) by ESCVavg = (ESCVhands + ESCVfeet)/2.
Statistical analyses
The statistical significance for all analyses was set to (95%). Continuous and categorical variables were summarized by their mean and standard deviation (SD) and frequency and percentage, respectively. Independent two-sample t test was performed for each variable to investigate the difference between the diabetic patient and control group. We calculated the area under the curve (AUC) of the receiver operating characteristic (ROC) curve to assess the discriminant performance for ESC measures based on linear predictors derived from logistic regression through tenfold cross validation. In addition, the relationship between the duration of diabetes and ESC measurement was assessed by one-way analysis of variance (ANOVA).
Results
Patient enrolment and classification
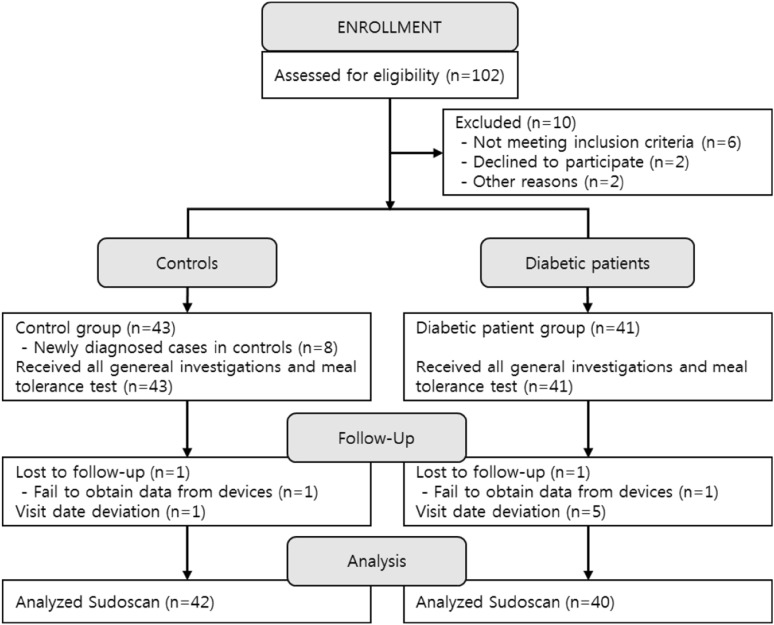
As shown in Fig. 3, 46 diabetic patients and 46 healthy controls were recruited for the study. In clinical trials, one patient dropped out of each group due to missing measurement data. In the data review process after the completion of the clinical trial, eight patients were found to be classified differently from the HbA1c standard of the clinical trial plan and were excluded from the analysis. Finally, we analyzed the results of 82 patients, including 40 diabetic patients (23 men and 17 women) and 42 control subjects (24 men and 18 women).
Fig. 3.
Flow diagram of the study
The mean ages of diabetic patients (n = 40) and control group patients (n = 42) were 61.4 ± 8.6 years and 61.4 ± 8.6 years, respectively. There were no significant differences in the age, height, weight, BMI, waist circumference, hip circumference, systolic blood pressure, diastolic blood pressure, pulse, and body temperature of the patients and controls. As shown in Table 2, the ratio of the waist circumference to hip circumference (WHR), glycated hemoglobin, and fasting blood glucose showed a significant difference between the patient group and the control group. The glycemic hemoglobin was 6.7 ± 0.8% in the patient group and 5.6 ± 0.4% in the control group. The fasting blood glucose level was 133.7 ± 30.4 mg/dL and 101.7 ± 9.3 mg/dL, respectively. WHR was 0.93 ± 0.1 in the patient group and 0.89 ± 0.0 in the control group, respectively.
Table 2.
Baseline characteristics of diabetes patients and controls
| Variables | Diabetes patients (n = 40) | Controls (n = 42) | P value |
|---|---|---|---|
| Sex | |||
| Male | 23 (57.5%) | 24 (57.1%) | |
| Female | 17 (42.5%) | 18 (42.9%) | |
| Age (year) | 61.4 ± 8.6 | 58.2 ± 8.8 | 0.096 |
| Anthropometrics | |||
| Height (cm) | 161.0 ± 10.6 | 161.4 ± 8.8 | 0.828 |
| Weight (kg) | 65.5 ± 10.6 | 64.1 ± 12.3 | 0.572 |
| Body mass index (kg/m2) | 25.3 ± 3.2 | 24.4 ± 3.4 | 0.258 |
| Waist circumference (cm) | 89.8 ± 8.5 | 86.1 ± 8.7 | 0.052 |
| Hip circumference (cm) | 97.1 ± 5.7 | 97.2 ± 6.8 | 0.969 |
| WHR | 0.93 ± 0.10 | 0.89 ± 0.00 | 0.002 |
| Vital signs | |||
| Systolic blood pressure (mmHg) | 125.9 ± 12.4 | 122.0 ± 14.1 | 0.195 |
| Diastolic blood pressure (mmHg) | 77.8 ± 9.1 | 75.6 ± 10.3 | 0.713 |
| Pulse rate (bpm) | 74.4 ± 10.3 | 70.4 ± 10.3 | 0.086 |
| Body temperature (°C) | 36.6 ± 0.3 | 36.6 ± 0.2 | 0.640 |
| Blood parameters | |||
| Glycated hemoglobin (%) | 6.7 ± 0.8 | 5.6 ± 0.4 | 0.000 |
| Fasting plasma glucose (mg/dL) | 133.7 ± 30.4 | 101.7 ± 9.3 | 0.000 |
WHR, waist to hip circumference; fasting glucose, glucose level before meal intake
ESC analysis
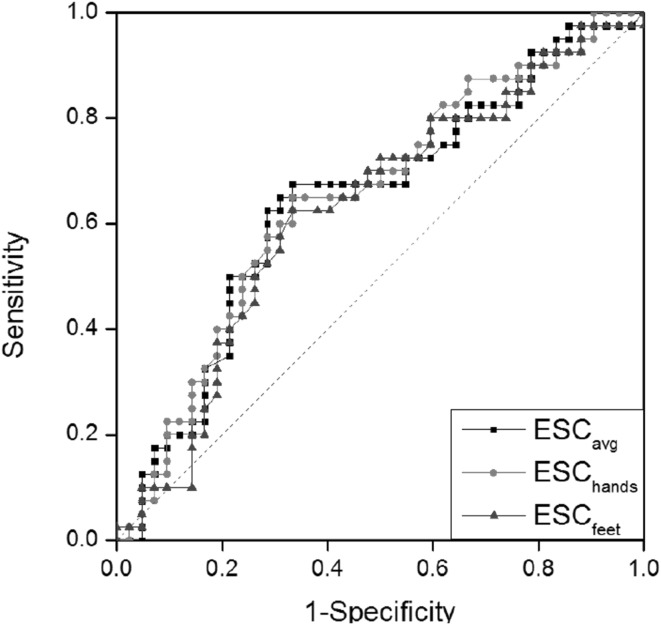
The ESC values measured at both the hands and feet using Sudoscan in the fasting state are shown in Table 3 for patients and normal control subjects. Figure 4 shows the receiver operating characteristic (ROC) of ESC values for diabetic patients. The AUC values obtained using ESC measurements at the hands (ESChands), ESC measurements at the feet (ESCfeet), and average ESC (ESCavg) at the hands and feet were 0.650, 0.626, and 0.644, respectively.
Table 3.
Mean ESC values of diabetes patients and controls
| Diabetes patients (n = 40) | Controls (n = 42) | P value | |
|---|---|---|---|
| ESCavg (μS) | 68.1 ± 13.6 | 60.8 ± 15.7 | 0.027 |
| ESChands (μS) | 64.2 ± 16.2 | 55.1 ± 19.1 | 0.022 |
| ESCfeet (μS) | 72.0 ± 13.6 | 66.5 ± 14.7 | 0.084 |
Fig. 4.
ROC curve for the measured ESC values
ESC variability (ESCV)
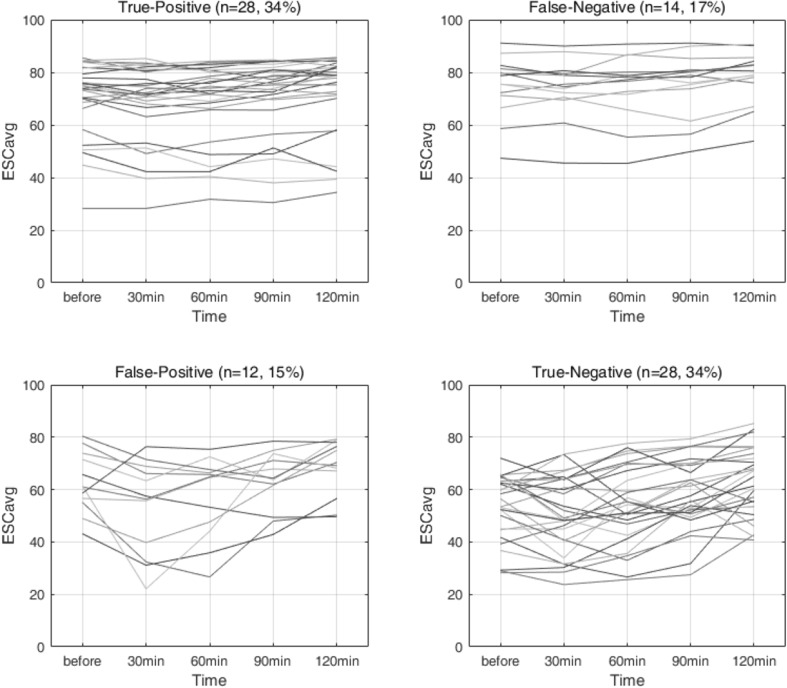
The difference (ESCV) between the maximum and minimum values of the five ESCs was 11.4 μS in the patient group and 15.1 μS in the control group as shown in Table 4. Both the mean of the ESC standard deviation and ESCV were smaller in patients. To examine the utility of ESCV, the five ESCs (ESC0, ESC30, ESC60, ESC90, and ESC120 were measured according to the MTT protocol) and were selected a criterion for ESCV to obtain a 2 × 2 confusion matrix. Figure 5 shows the resulting confusion matrix of true-positive (top left), false-negative (top right), false-positive (bottom left), and true-negative (bottom right) with the ESCV criterion of 10.5 μS for both patients and control subjects. To provide an illustration, the graph at the upper left represents a group of people whose ESCV is less than 10.5 μS and are predicted as patients (first column) among true patients (first row). As a result, due to the MTT, 70.0% of the patients were changed to smaller than 10.5 μS of ESC and 66.7% of the control group were changed to larger than 10.5 μS of ESC: sensitivity, 70.0%; specificity, 66.7%; accuracy, 68.3%.
Table 4.
Mean ESCV values of diabetes patients and controls
| Diabetes patients (n = 40) | Controls (n = 42) | P value | |
|---|---|---|---|
| ESCVavg (μS) | 11.4 ± 9.5 | 15.1 ± 7.7 | 0.063 |
| ESCVhands (μS) | 15.2 ± 10.7 | 19.0 ± 9.3 | 0.086 |
| ESCVfeet (μS) | 10.1 ± 9.1 | 12.9 ± 8.0 | 0.137 |
Fig. 5.
ESC changes according to the measurement time for 4 groups divided by the criterion of ESCV = 10.5 μS. Top-left: true positive. Top-right: false negative. Bottom-left: false positive. Bottom-right: true negative
To test the classification performance of ESC and ESCV, we conducted a tenfold cross-validation test. The accuracy values and AUCs using the ESC and ESCV values of the hands, feet and both the hands and feet were examined and presented in Table 5. The best results were shown to be with the ESCV of the feet with AUC = 0.703. In all cases, the AUCs of ESCV were a little higher than those of ESCs. The correlation between blood glucose level and ESC is r = 0.249, between the blood glucose level and ESCV is r = − 0.173, and between ESC and ESCV is r = − 0.542.
Table 5.
Accuracy and AUC of ROC curve analysis with a tenfold cross-validation
| Both hands and feet | Hands | Feet | ||||
|---|---|---|---|---|---|---|
| Accuracy | AUC | Accuracy | AUC | Accuracy | AUC | |
| ESC | 0.611 | 0.654 | 0.572 | 0.626 | 0.588 | 0.653 |
| ESCV | 0.649 | 0.691 | 0.613 | 0.676 | 0.539 | 0.703 |
The correlation between blood glucose level and ESC is r = 0.249, between the blood glucose level and ESCV is r = − 0.173, and between ESC and ESCV is r = − 0.542
Duration of disease and ESC response
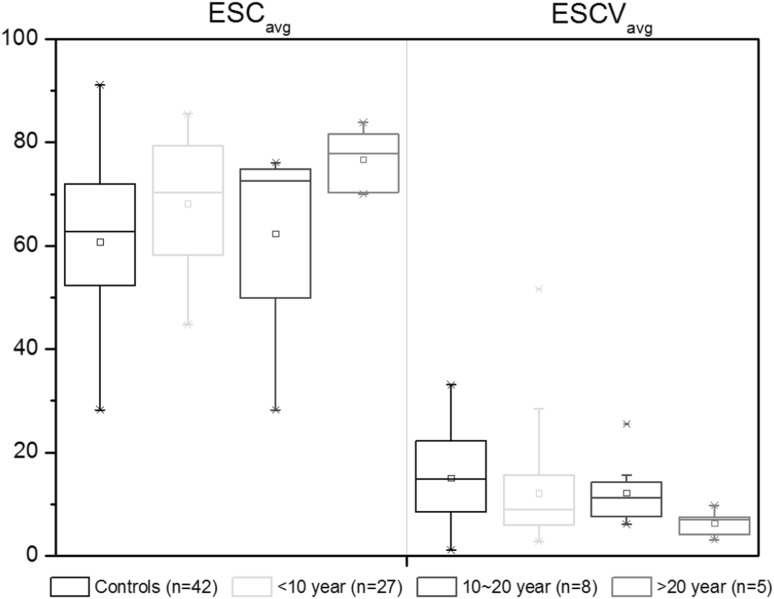
To test the ESC and ESCV responses according to the duration of the disease, we divided the patients into three groups: less than 10 years of disease duration (n: 27, age: 59.8 ± 8.3), between 10 years and 20 years (n: 8, age: 65.1 ± 10.3), over 20 years (n: 5, age: 64.2 ± 5.5). No significant difference was found between the control group and three sub-groups of the patients. In Fig. 6, we presented the ESCavg and ESCVavg of all participants according to the duration of the disease. In terms of disease duration, the mean value of ESCVavg showed decreasing tendency from 12.2 ± 10.9 μS to 6.3 ± 2.7 μS as the duration of the disease increased, even though it was not statistically significant (Fig. 6).
Fig. 6.
ESC and ESCV of controls and patients by the disease duration. No statistical significance was found between subgroups
Discussion
There was a statistically significant difference in ESC values between diabetic patients group and normal control group as shown in Table 3. Previous studies reported that ESC value was higher in the healthy normal group than in the diabetic patient’s group due to impaired sweat gland function or autonomic nerve response [22]. However, similar to our results, some studies reported the opposite behaviour; skin conductive increased in the diabetic patients in the stage when the sympathetic nerve is promoted due to Yin deficiency symptom, in Korean Medicine [23–25]. As in Table 2, there was no statistically significant difference in sex, age, vital signs and anthropometric data, but the patient group and the control group were clearly distinguishable from the blood glucose level. It certified that the patient group and control group were appropriately sampled. Together with our results, the reliability of ESC in its simple form is not yet justified for discriminating diabetic mellitus because of inconsistent or controversial reports [26]. The AUC to discriminate diabetic patients from normal control was only 0.644, which was far less accurate than that of the blood test (AUC = 0.906).
In the case of diabetic nephropathy, the ESC measured at feet was reported more sensitive than that at hands [11]. In contrast, in our study, the ESC at hands showed better performance than at feet. In the case of diabetic nephropathy, neuropathic damages would occur more severely at feet than at hands. Another possibility for this contrasting behavior is that the drugs taken by diabetic patients may regulate the autonomic nervous system [27, 28]. Time-dependent changes of bio-signals within an individual may be used for health examination [27-29]. In this study, we proposed a novel ESCV, the change in the ESC value from the same subject during an MTT. The accuracy was improved slightly from ESC.
This study was limited as follows. First, it was studied in a clinic with a small sample size. The age-dependent trend of the ESC may exist and site-dependency should be cross-checked by a multicenter study. Second, this was a cross-sectional study. A long-term follow-up study will be needed to discuss changes dependent on disease-period in the ESC and ESCV.
Conclusion
Using a standard MTT protocol for 40 diabetic patients and 42 control subjects with matched age, sex and BMI, the variability of ESC before and after MTT showed better performance than ESC in classifying diabetic patients. The classification accuracy was marginal to be used as a screening tool for diabetes mellitus, as AUC = 0.654 for ESCavg and AUC = 0.691 for ESCVavg by a ROC curve analysis (tenfold cross-validation). Diverse drugs taken by diabetic patients accompany electrophysiological changes through autonomic nervous responses, which uncontrollably affects ESC values and have limited the applicability of the noninvasive ESC for the screening and monitoring of diabetes. The reduced values of ESCV for diabetic patients may imply that diabetic patients have degraded electrophysiological adaptability to maintain homeostasis after a physiological load such as an MTT. Studies with larger populations or with an animal model are needed for the verification of clinical usefulness of ESC technique for diabetic mellitus.
Authors’ contribution
SK and JHC wrote the manuscript and analysed data. BK designed the clinical study and analyzed data. MHJ analysed data. GK designed and monitored the clinical study. HRY and SSP performed the clinical study. JUK conceived the study, analysed data and wrote the manuscript.
Funding
This work was supported by a Grant (KSN1812170, K17012) from the Korea Institute of Oriental Medicine (KIOM), funded by the Korean government.
Conflict of interest
The authors declare that they have no conflict of interest.
Availability of data and materials
Data will be available upon individual request.
Ethical approval
All procedures involving human participants were in accordance with the ethical standards of the institutional research board and with the 1964 Helsinki declaration and its successive amendments.
Footnotes
Publisher's Note
Springer Nature remains neutral with regard to jurisdictional claims in published maps and institutional affiliations.
Soochan Kim and JungHee Cho have contributed equally to this work.
Contributor Information
Soochan Kim, Email: sckim@hknu.ac.kr.
Junghee Cho, Email: xtin@kiom.re.kr.
Boncho Ku, Email: secondmoon@kiom.re.kr.
Minho Jun, Email: mino@kiom.re.kr.
Gahye Kim, Email: kkh2@kiom.re.kr.
Horyong Yoo, Email: hryoo@dju.kr.
Sangsoo Park, Email: pssna007@dju.kr.
Jaeuk U. Kim, Email: jaeukkim@kiom.re.kr
References
- 1.Collaboration NRF. Worldwide trends in diabetes since 1980: a pooled analysis of 751 population-based studies with 4.4 million participants. The Lancet. 2016;387(10027):1513–1530. doi: 10.1016/S0140-6736(16)00618-8. [DOI] [PMC free article] [PubMed] [Google Scholar]
- 2.Prichep LS, et al. Quantitative EEG correlates of cognitive deterioration in the elderly. Neurobiol Aging. 1994;15(1):85–90. doi: 10.1016/0197-4580(94)90147-3. [DOI] [PubMed] [Google Scholar]
- 3.Hwang MH, Lee S. Insulin resistance: vascular function and exercise. Integr Med Res. 2016;5(3):198–203. doi: 10.1016/j.imr.2016.06.001. [DOI] [PMC free article] [PubMed] [Google Scholar]
- 4.Vashist SK, Luong JH. Point-of-care glucose detection for diabetic monitoring and management. Boca Raton: CRC Press; 2017. [Google Scholar]
- 5.Vashist SK. Non-invasive glucose monitoring technology in diabetes management: a review. Anal Chim Acta. 2012;750:16–27. doi: 10.1016/j.aca.2012.03.043. [DOI] [PubMed] [Google Scholar]
- 6.Vinik AI, et al. Neurovascular function and sudorimetry in health and disease. Curr Diab Rep. 2013;13(4):517–532. doi: 10.1007/s11892-013-0392-x. [DOI] [PubMed] [Google Scholar]
- 7.Mao F, et al. Sudoscan is an effective screening method for asymptomatic diabetic neuropathy in Chinese type 2 diabetes mellitus patients. J Diabetes Investig. 2017;8(3):363–368. doi: 10.1111/jdi.12575. [DOI] [PMC free article] [PubMed] [Google Scholar]
- 8.Khalfallah K, et al. Noninvasive galvanic skin sensor for early diagnosis of sudomotor dysfunction: application to diabetes. IEEE Sens J. 2012;12(3):456–463. doi: 10.1109/JSEN.2010.2103308. [DOI] [Google Scholar]
- 9.Gin H, et al. Non-invasive and quantitative assessment of sudomotor function for peripheral diabetic neuropathy evaluation. Diabetes Metab. 2011;37(6):527–532. doi: 10.1016/j.diabet.2011.05.003. [DOI] [PubMed] [Google Scholar]
- 10.Calvet Jh, Duplin J, Deslypere JP. Screening of cardiovascular autonomic neuropathy in patients with diabetes by quick and simple assessment of sudomotor function. J Diabetes Metab. 2012;03(04):2. doi: 10.1016/j.diabet.2012.09.004. [DOI] [PubMed] [Google Scholar]
- 11.Selvarajah D, et al. SUDOSCAN: a simple, rapid, and objective method with potential for screening for diabetic peripheral neuropathy. PLoS ONE. 2015;10(10):e0138224. doi: 10.1371/journal.pone.0138224. [DOI] [PMC free article] [PubMed] [Google Scholar]
- 12.Mayaudon H, Miloche PO, Bauduceau B. A new simple method for assessing sudomotor function: relevance in type 2 diabetes. Diabetes Metab. 2010;36(6 Pt 1):450–454. doi: 10.1016/j.diabet.2010.05.004. [DOI] [PubMed] [Google Scholar]
- 13.Yang Z, et al. Autonomic test by EZSCAN in the screening for prediabetes and diabetes. PLoS ONE. 2013;8(2):e56480. doi: 10.1371/journal.pone.0056480. [DOI] [PMC free article] [PubMed] [Google Scholar]
- 14.Freedman BI, et al. Relationships between electrochemical skin conductance and kidney disease in Type 2 diabetes. J Diabetes Complicat. 2014;28(1):56–60. doi: 10.1016/j.jdiacomp.2013.09.006. [DOI] [PMC free article] [PubMed] [Google Scholar]
- 15.Freedman BI, et al. Electrochemical skin conductance in diabetic kidney disease. Am J Nephrol. 2015;41(6):438–447. doi: 10.1159/000437342. [DOI] [PMC free article] [PubMed] [Google Scholar]
- 16.He T, et al. Electrochemical skin conductance may be used to screen for diabetic cardiac autonomic neuropathy in a Chinese population with diabetes. J Diabetes Res. 2017;8289740. [DOI] [PMC free article] [PubMed]
- 17.Casellini CM, et al. Sudoscan, a non-invasive tool for detecting diabetic small fiber neuropathy and autonomic dysfunction. Diabetes Technol Ther. 2013;15(11):948–953. doi: 10.1089/dia.2013.0129. [DOI] [PMC free article] [PubMed] [Google Scholar]
- 18.Yajnik CS, et al. Quick and simple evaluation of sudomotor function for screening of diabetic neuropathy. ISRN Endocrinol. 2012;103714. [DOI] [PMC free article] [PubMed]
- 19.Duffy FH, McAnulty GB, Albert MS. The pattern of age-related differences in electrophysiological activity of healthy males and females. Neurobiol Aging. 1993;14(1):73–84. doi: 10.1016/0197-4580(93)90025-7. [DOI] [PubMed] [Google Scholar]
- 20.The Sudoscan Principle, Impetomedical, France. https://www.impeto-medical.com/the-sudoscan-principle/.
- 21.Vinik AI, Nevoret ML, Casellini C. The new age of sudomotor function testing: a sensitive and specific biomarker for diagnosis, estimation of severity, monitoring progression, and regression in response to intervention. Front Endocrinol (Lausanne) 2015;6:94. doi: 10.3389/fendo.2015.00094. [DOI] [PMC free article] [PubMed] [Google Scholar]
- 22.Ramachandran A, et al. A new non-invasive technology to screen for dysglycaemia including diabetes. Diabetes Res Clin Pract. 2010;88(3):302–306. doi: 10.1016/j.diabres.2010.01.023. [DOI] [PubMed] [Google Scholar]
- 23.Park YS. Endocrine diseases in diabetes mellitus. Hanyang Med. Rev. 2012;32(4):171–178. doi: 10.7599/hmr.2012.32.4.171. [DOI] [Google Scholar]
- 24.Lee DH, et al. Assessment of diabetic autonomic neuropathy by power spectrum analysis. Korean J Med. 1991;41(5):628–642. [Google Scholar]
- 25.Park YJ, Nam TH, Park YB. A study on correlation between bian zheng with autonomic functions-based on skin resistance variability, Han Zheng, Re Zheng and Xu Zheng. J Korea Inst Orient Med Diagn. 1999;6(1):123–134. [Google Scholar]
- 26.Ang L, et al. Sudomotor dysfunction as a measure of small fiber neuropathy in type 1 diabetes. Auton Neurosci Basic Clin. 2017;205:87–92. doi: 10.1016/j.autneu.2017.03.001. [DOI] [PMC free article] [PubMed] [Google Scholar]
- 27.Kang MS, Kim CH. Management of diabetic peripheral neuropathy. Korean J Med. 2015;89(3):277–281. doi: 10.3904/kjm.2015.89.3.277. [DOI] [Google Scholar]
- 28.Chun SW, Ko KS. Summary of the update to the diabetic neuropathy management guidebook. J Korean Diabetes. 2012;13(3):115–123. doi: 10.4093/jkd.2012.13.3.115. [DOI] [Google Scholar]
Associated Data
This section collects any data citations, data availability statements, or supplementary materials included in this article.
Data Availability Statement
Data will be available upon individual request.


