Abstract
Recent studies have developed simple techniques for monitoring and assessing sleep. However, several issues remain to be solved for example high-cost sensor and algorithm as a home-use device. In this study, we aimed to develop an inexpensive and simple sleep monitoring system using a camera and video processing. Polysomnography (PSG) recordings were performed in six subjects for four consecutive nights. Subjects’ body movements were simultaneously recorded by the web camera. Body movement was extracted by video processing from the video data and five parameters were calculated for machine learning. Four sleep stages (WAKE, LIGHT, DEEP and REM) were estimated by applying these five parameters to a support vector machine. The overall estimation accuracy was 70.3 ± 11.3% with the highest accuracy for DEEP (82.8 ± 4.7%) and the lowest for LIGHT (53.0 ± 4.0%) compared with correct sleep stages manually scored on PSG data by a sleep technician. Estimation accuracy for REM sleep was 68.0 ± 6.8%. The kappa was 0.19 ± 0.04 for all subjects. The present non-contact sleep monitoring system showed sufficient accuracy in sleep stage estimation with REM sleep detection being accomplished. Low-cost computing power of this system can be advantageous for mobile application and modularization into home-device.
Keywords: Sleep stage, Body movement, Video monitoring, Video image processing
Introduction
Sleep is an important factor for recovering from fatigue and reducing stress. Therefore, usual and natural sleep monitoring at home can contribute to healthcare and stress management [1, 2]. The sleep quality is objectively assessed by sleep cycles representing time-course change of sleep stages such as rapid-eye movement (REM) and non-REM sleep at the clinical sites. However, two common problems arise for monitoring sleep at home. Firstly, sleep stages are judged based on polysomnography (PSG) data, a global standard method in the clinical setting, but this makes subjects or patients feel highly constrained because the test requires physical attachment to electrodes for the acquisition of three core measurements: electroencephalograms (EEG), which require at least six electrodes and codes; and electroocculograms (EOG), which require two electrodes and codes; and electromyograms (EMG), which require two electrodes and codes [3]. The second problem is the necessity for a specialist. The device settings and PSG scoring are required intervention and visual observation by a trained sleep technician [4]. Sleep stages are judged by a sleep technologist at a clinical site by visual observation following American academy of sleep medicine (AASM) scoring manual [5].
In order to solve the above-mentioned problems, some unconstrained sleep monitoring devices capable of automatically estimating sleep stage have been developed. These devices measure some biological signals which changes with sleep stage change such as Electrocardiogram (ECG) and respiratory movement. For example, Hwang and et al. developed a mattress-type sensor and estimated sleep stage by measuring body movement and respiration signals with an accuracy close to 79.0% [6]. Kagawa et al. estimated sleep stage using body movement and respiratory interval measured by a multiple radar sensor and their average estimation accuracy was 71.9% [7]. Their method is able to classify four stages including REM sleep. However, contact-type sensors are expensive because high sensitivity transducer is needed for detecting slightly change of respiratory movement. Recently, some mobile applications have been developed that can monitor sleep with a smartphone [8]. Although these applications are inexpensive, in most cases they assess sleep condition by their own rules and scales rather than providing authentic sleep stages based on PSG. Sleep monitoring at home should output sleep stages for healthcare.
About the relationship between body movements and sleep stages, it is reported that there is a significant difference in frequency of body movements at each sleep stages [9, 10]. In addition, as a new parameter, we focused on the duration time of motionless related to frequency of body movements. We previously developed a technique to measure body movement using a camera in order to estimate sleep stages without contact [11, 12]. In this system, sleep was classified into three stages such as WAKE, LIGHT and DEEP since it was difficult to detect REM sleep. Therefore, the present study aimed to develop sleep monitoring system that can estimate sleep stages including REM sleep. Sleep stages were estimated by machine learning based on non-contact body movement measurement using a camera and video processing. Moreover, based on a device that most consumers use at home, we aimed to construct an inexpensive system using a web camera and simple video processing. As end goal, we suppose that body movement is detected and sleep stages are estimated by a smartphone for easy to use.
Methods
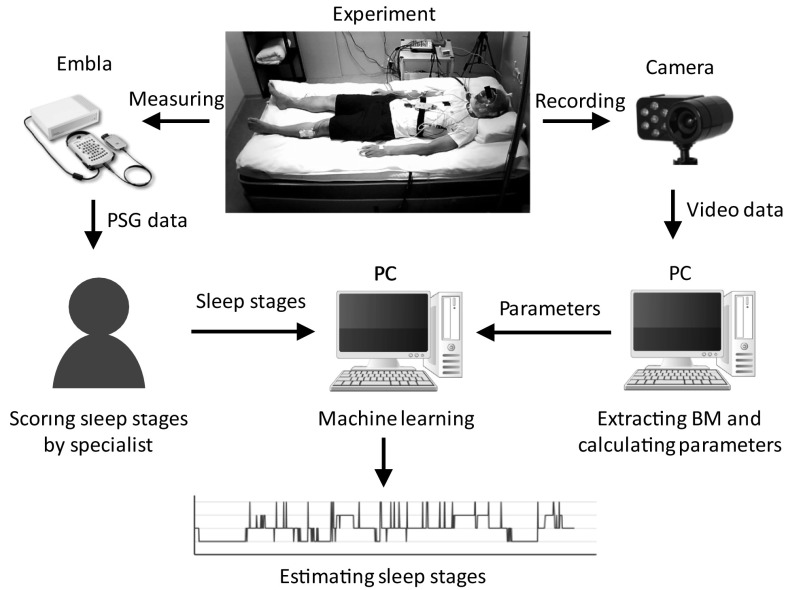
In this study, body movement was extracted from video images using a PC. In addition, PSG recording was performed to produce training data for machine learning and to evaluate estimation accuracy. Figure 1 shows the experimental procedure and analysis. Six healthy males (24.8 ± 2.6 years old) participated in this experiment. Subjects’ mean height, weight, and body mass index were 170.2 ± 4.6 cm, 57.8 ± 6.5 kg and 19.9 ± 1.5 kg/m2, respectively. Written informed consent was obtained from all subjects. The experiment was performed with the approval of the ethics committee of the Osaka University Dental Hospital and the Graduate School of Density (H29-48). PSG recordings were conducted for four consecutive nights in the sleep research laboratory at Osaka University Graduate School of Dentistry. In this experiment, PSG recording was performed to obtain multiple biosignals for sleep stage estimation. At the same time, the object, that was sleeping subject, was recorded with a camera to obtain body movement data. The PSG data and recorded video data were stored on the PC. A sleep technologist judged sleep stage from the PSG data off-line. Body movement information was extracted from the video data using video processing and five parameters for machine learning were calculated from the body movement data. Sleep stage from the PSG data was used as the correct answer data and estimated from parameters using support vector machine (SVM) machine learning.
Fig. 1.
Procedure of experiment and analysis
PSG recording and sleep stage scoring
The PSG montage included the following biosignals; EEG (C3-A2, C4-A1, O1-A2, O2-A1, F3-A2, and F4-A1 based on international 10–20 system [13]), EOG and EMG (chin/suprahyoid). All signals were recorded using a PSG amplifier (Embla N7000, Natus Medical Inc., USA). Subjects went to bed between 22:30 and 23:00 after the electrodes were set and woke up between 6:30 and 7:00. The data were collected by REMbrandt software (Natus Medical Inc., USA). A trained sleep technologist scored the sleep stages according to AASM scoring criteria version 2.1 based on 30-s PSG data. Stage N1 and stage N2 were defined as LIGHT, stage N3 were defined as DEEP. Stage R was defined as REM and stage W was defined as WAKE.
Body movement detection
The state of sleeping subject was recorded using a web camera (DC-NCR300U, Hanwha Q CELLS Japan co. ltd., Japan) equipped with an infrared LED light. This is an inexpensive web camera for a typical laptop PC.The camera can record a subject’s movements in a dark room and image resolution was set at 640 × 480 (width × height) and video recorded at 2 frames/s. The camera was set on the wall of the bedroom as shown in Fig. 2. Body movements were extracted from recorded video data through inter-frame difference video processing. The inter-frame difference algorithm is a general method used for detecting a moving target [14–16]. Differences of each pixel’s luminance value are calculated between the Nth and (N − 1)th frames of a video and the differences indicate moving objects.
Fig. 2.
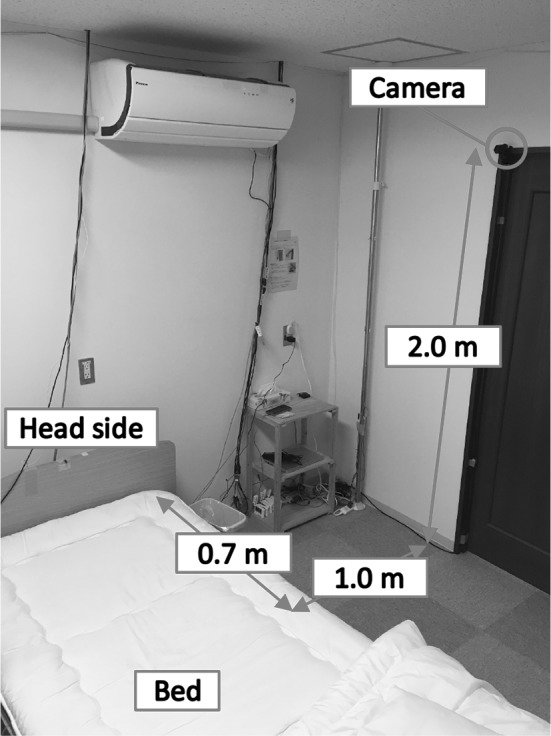
Location of camera
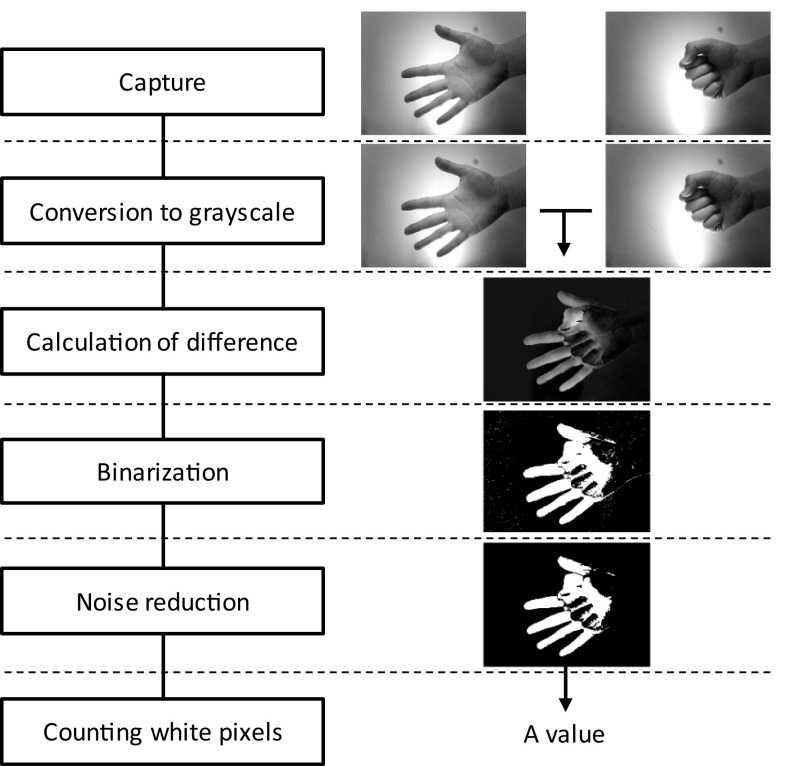
Figure 3 shows the video processing algorithm and examples of a processing result. Initially, the video image is converted into grayscale images because colour information is not needed for calculating the inter-frame difference. Secondly, the difference of luminance value between two frames at every pixel is calculated. If the luminance value difference at a pixel is over a set threshold, the pixel is converted into white (luminance value is 255) or black otherwise (luminance value is 0) for binarization. Next, noise in the inter-frame difference is reduced through dilation and erosion. Finally, the number of white pixels is counted and the summed value is regarded as a measure of the amount of body movement. Inter-frame differences are calculated between Nth and (N − 1)th frame where N is any arbitrary frame. We calculated two types of frame interval in this study. The first is a one-frame interval (oneFI) meaning 0.5 s intervals because video was recorded at 2 frames/s. At the second, differences are calculated between Nth and (N − 6)th frame to give a six-frame interval (sixFI) meaning 3.0 s intervals. Fast movement increases difference of inter-frame and slow movement decreases difference of inter-frame. High FPS decreases difference of inter-frame and low FPS increases difference of inter-frame. Therefore, detection of fast movement is easier than slow movement and can be detected oneFI. For detection of slow movement, we proposed that the interval of inter-frame difference is made longer (artificially fps is made low = sixFI). Body movements can be detected, if there are results monochrome pictures of inter-frame difference. Since the original movie is not stored during processing, the privacy of the user is protected.
Fig. 3.
Video processing algorithm and an illustrative example results
Sleep stage estimation
Sleep stages were estimated through an SVM machine learning using only body movement data [17, 18]. In order to estimate sleep stage by machine learning, it was necessary to prepare several parameters that represent features of each sleep stage. Body movement during sleep is characterized by sleep stages [9, 10]. During WAKE, body movements are large and occur frequently with high magnitude because it is close to arousal. The occurrence frequency is high during LIGHT and REM following WAKE. However, body movement during REM is smaller than LIGHT and very few body movements occurs in DEEP. Five parameters representing these characteristics were calculated by the following method. These parameters were calculated every 30 s in each because sleep stage was judged at once every 30 s.
Parameter 1: Eq. (1), n = 1, 61, 121, …. Since oneFI and sixFI are calculated every 0.5 s, this parameter represents the mean value of the body movement in every 30 s and was prepared to classify WAKE and other stages. In WAKE, body movement is larger because it is close to arousal.
| 1 |
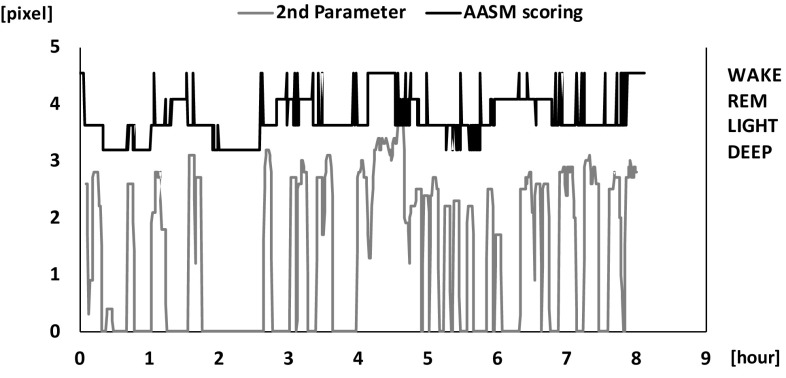
Parameter 2: Eq. (2), n = 1, 61, 121, …. Since oneFI and sixFI are calculated every 0.5 s, this parameter represents a moving average over 5 min. When the antilogarithm is less than 1, the value of this parameter is replaced to 0 because that it means there is no body movement. This parameter represents the occurrence frequency of body movement over 5 min and was used to classify LIGHT and REM with high body movement occurrence frequency. Moreover, this parameter was expected to detect continuous WAKE states with high frequencies of large body movements.
| 2 |
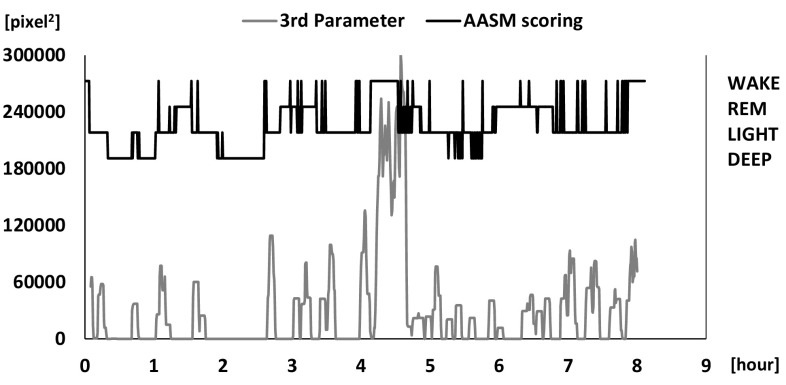
Parameter 3: Eq. (3), n = 1, 61, 121, …. Since oneFI and sixFI are calculated every 0.5 s, this parameter represents a moving average over 5 min. This parameter represents the volume of body movement for 5 min and was used to classify DEEP, whose body movements are rare than the other Stage.
| 3 |
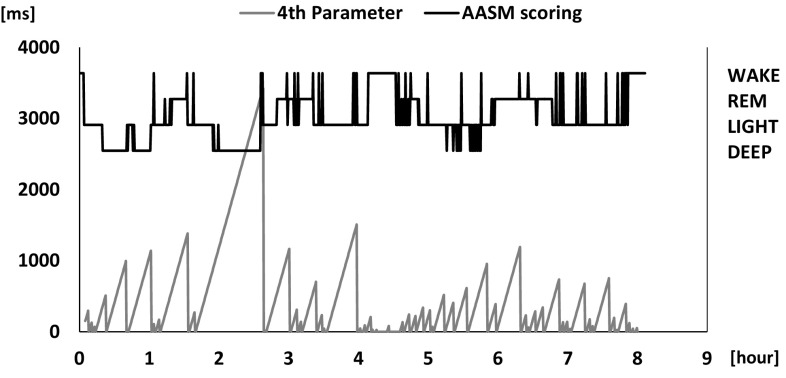
Parameter 4: Based on parameter 3 and measures the number of seconds passed since the last body movement was detected. This parameter was used for classifying DEEP because body movement frequency is very low and the duration of still periods is long.
Parameter 5: The time elapsed since measurement began. DEEP is predominant in the first half of sleep and less so in the second. In contrast, REM occurs less in the first half of sleep and more in the second. This parameter was therefore used to reduce misclassification between DEEP and REM.
These five parameters were used for training and test data for SVM. The test dataset consisted of one subject’s data and the training dataset consisted of the other subjects’ data. For example, if the sleep stage of subject 1 was estimated, the test data consisted of subject 1’s data and training data consisted of subjects 2–6’s data.
Evaluation method
The evaluation methods are explained in Table 1 as a confusion matrix. For example, DD represents the number that actual DEEPs classified as DEEP by the SVM while DL represents the number of actual DEEPs classified as LIGHT. Results of sleep stage estimation were evaluated based on sensitivity, specificity and accuracy for each stage, and the three indices were calculated for each subject and each stage.
Table 1.
Confusion matrix for evaluation
| Results of estimation | ||||
|---|---|---|---|---|
| DEEP | LIGHT | REM | WAEK | |
| Actual | ||||
| DEEP | DD | DL | DR | DW |
| LIGHT | LD | LL | LR | LW |
| REM | RD | RL | RR | RW |
| WAKE | WD | WL | WR | WW |
DALL, LALL, RALL, and WALL are defined as follows:
| 4 |
| 5 |
| 6 |
| 7 |
In the case of DEEP, sensitivity (Sens.) was calculated with Eq. (8), specificity (Spec.) with Eq. (9) and accuracy (Acc.) with Eq. (10).
| 8 |
| 9 |
| 10 |
Moreover, total accuracy was calculated with Eq. (11) and kappa static was calculated [19, 20].
| 11 |
Results and discussions
Sleep stage assessed by PSG scoring
Video was not recorded on the third night for subject 6 and body movement data was therefore not obtained. Thus, a total of 23 nights were used for analysis. Table 2 shows the percentage of sleep periods from the PSG data.
Table 2.
The ratio each stage in nocturnal sleep (%)
| Night | DEEP | LIGHT | REM | WAKE | |
|---|---|---|---|---|---|
| Subject 1 | 1st | 17.6 | 50.1 | 29.1 | 3.2 |
| 2nd | 13.9 | 52.2 | 26.9 | 6.9 | |
| 3rd | 18.2 | 52.8 | 25.5 | 4.4 | |
| 4th | 18.5 | 54.9 | 24.3 | 2.3 | |
| Subject 2 | 1st | 19.7 | 58.5 | 15.9 | 5.8 |
| 2nd | 18.9 | 62.6 | 13.9 | 3.6 | |
| 3rd | 23.3 | 59.1 | 15.9 | 1.6 | |
| 4th | 19.7 | 54.5 | 23.9 | 1.9 | |
| Subject 3 | 1st | 26.1 | 55.0 | 15.3 | 3.7 |
| 2nd | 28.3 | 51.2 | 20.9 | 9.5 | |
| 3rd | 29.8 | 53.2 | 18.4 | 8.6 | |
| 4th | 18.2 | 47.4 | 22.7 | 11.7 | |
| Subject 4 | 1st | 32.4 | 50.5 | 13.9 | 3.2 |
| 2nd | 32.1 | 43.8 | 22.2 | 1.9 | |
| 3rd | 27.4 | 45.6 | 24.2 | 2.7 | |
| 4th | 28.9 | 48.7 | 18.1 | 4.3 | |
| Subject 5 | 1st | 12.0 | 62.6 | 23.8 | 2.6 |
| 2nd | 15.6 | 62.2 | 20.1 | 3.2 | |
| 3rd | 18.9 | 56.7 | 22.5 | 1.9 | |
| 4th | 14.8 | 47.8 | 29.8 | 7.6 | |
| Subject 6 | 1st | 12.8 | 48.0 | 4.0 | 33.2 |
| 2nd | 23.7 | 52.9 | 14.2 | 9.2 | |
| 3rd | – | – | – | – | |
| 4th | 20.8 | 54.6 | 17.0 | 7.6 |
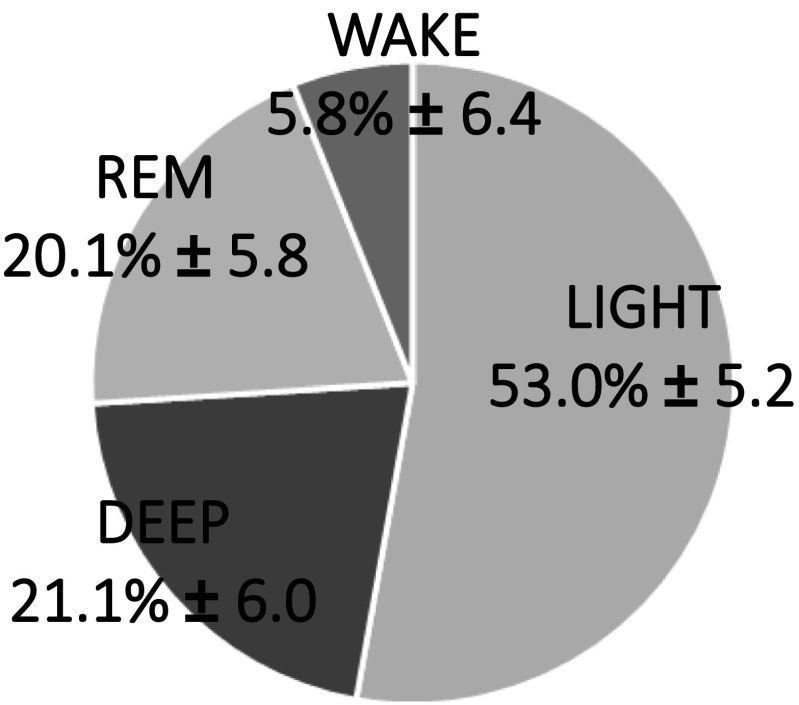
Figure 4 shows the average of each sleep stages in all subjects and all nights.
Fig. 4.
The Average of Sleep stage ratio in all subjects and all nights
The percentage of DEEP was high for subjects 3 and 4 but low for subject 5. The proportion of LIGHT was high for subjects 2 and 5 while REM was high for subject 5. WAKE was highest for subject 6 on the 1st night where there was a 137-min period of consecutive awakening. The sleep structures of all subjects were in the normal range for young adults [21, 22].
Parameters calculation for machine learning
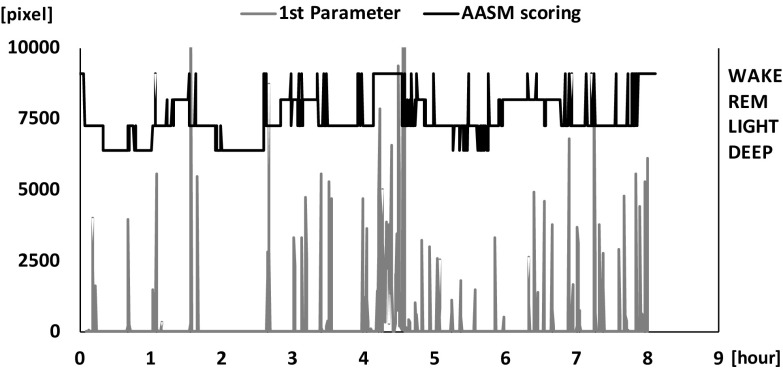
A representative calculation of parameters 1 to 4 is shown in Figs. 5, 6, 7, 8. Parameter 5 is the elapsed time and is not shown because it simply a straight line with a fixed slope. Figure 5 shows that parameter 1 exhibited large values in WAKE and almost 0 in DEEP. Parameter 1 contributed to the detection of short WAKE periods and fulfilled its purpose. Figure 6 shows that parameter 2 exhibited large values at times where WAKE was continuous and values in LIGHT and REM after WAKE. There was a little difference between LIGHT and REM. As with parameter 1, most of the values were 0 in DEEP. Parameter 2 contributed to the classification of consecutive WAKE periods, in line with its purpose. In contrast, its use for classification of LIGHT and REM was difficult. This was due to the similar frequency of body movements in LIGHT and REM [10]. Figure 7 shows that parameter 3 exhibited large values in WAKE. And as with parameter 1, most of the values were 0 in DEEP. However, in REM, there were some periods producing values close to 0. As with DEEP, the same phenomenon occurred in LIGHT. This is due to the fact that the small body movements could not be detected by our video processing algorithm and the duration time of stillness was calculated longer than the actual. Figure 8 shows that parameter 4 showed large values in continuous DEEP and frequently also exhibited large values in REM. In the intermittent DEEP occurring in the latter half of sleep, its values were equivalent to values in LIGHT and REM. Parameters 1 to 3 were almost 0 and parameter 4 was larger in DEEP. This result indicated that body movement mostly did not occur in DEEP and relatively made the classification of DEEP easy. However, in intermittent DEEP, stillness durations became shorter (parameter 4) and classification became difficult.
Fig. 5.
Results of calculated parameter 1 and sleep stage
Fig. 6.
Results of calculated parameter 2 and sleep stage
Fig. 7.
Results of calculated parameter 3 and sleep stage
Fig. 8.
Results of calculated parameter 4 and sleep stage
Sleep stage estimation
The percentages of sleep stages estimated from body movements and compared with those from PSG data are shown in Table 3.
Table 3.
Confusion matrices and evaluation indices for each subject
| Estimation [%] | Evaluation [%] | ||||||
|---|---|---|---|---|---|---|---|
| DEEP | LIGHT | REM | WAKE | Sens. | Spec. | Acc. | |
| Subject 1 | |||||||
| Actual | |||||||
| DEEP | 52.8 | 20.3 | 8.0 | 18.9 | 52.8 | 90.5 | 84.0 |
| LIGHT | 9.6 | 30.7 | 33.5 | 26.3 | 30.7 | 76.0 | 52.6 |
| REM | 10.3 | 28.4 | 48.4 | 12.8 | 48.4 | 73.8 | 67.1 |
| WAKE | 2.9 | 11.8 | 12.4 | 72.9 | 72.9 | 78.8 | 78.6 |
| Subject 2 | |||||||
| Actual | |||||||
| DEEP | 54.5 | 14.8 | 16.8 | 13.9 | 54.5 | 94.9 | 87.0 |
| LIGHT | 5.0 | 31.5 | 29.4 | 34.1 | 31.5 | 77.3 | 51.4 |
| REM | 1.7 | 28.5 | 43.5 | 26.2 | 43.5 | 76.0 | 70.5 |
| WAKE | 13.1 | 30.5 | 2.2 | 54.2 | 54.2 | 71.6 | 70.3 |
| Subject 3 | |||||||
| Actual | |||||||
| DEEP | 68.6 | 7.5 | 5.6 | 18.3 | 68.6 | 86.8 | 83.0 |
| LIGHT | 15.5 | 29.7 | 23.3 | 31.5 | 29.7 | 82.3 | 55.3 |
| REM | 12.5 | 33.2 | 40.0 | 14.3 | 40.0 | 83.3 | 74.9 |
| WAKE | 0.6 | 7.2 | 3.6 | 88.6 | 88.6 | 75.1 | 76.3 |
| Subject 4 | |||||||
| DEEP | 56.1 | 11.4 | 17.9 | 14.7 | 56.1 | 89.5 | 79.5 |
| LIGHT | 12.1 | 27.7 | 42.1 | 18.1 | 27.7 | 75.3 | 53.1 |
| REM | 7.2 | 46.1 | 29.2 | 17.4 | 29.2 | 67.9 | 60.4 |
| WAKE | 7.8 | 20.5 | 22.3 | 49.4 | 49.4 | 83.1 | 81.7 |
| Subject 5 | |||||||
| Actual | |||||||
| DEEP | 37.3 | 25.0 | 15.7 | 22.0 | 37.3 | 93.1 | 84.5 |
| LIGHT | 8.0 | 38.2 | 28.6 | 25.2 | 38.2 | 68.1 | 51.3 |
| REM | 5.4 | 38.7 | 40.9 | 15.0 | 40.9 | 74.8 | 66.5 |
| WAKE | 0.0 | 15.8 | 12.2 | 71.9 | 71.9 | 77.9 | 77.7 |
| Subject 6 | |||||||
| Actual | |||||||
| DEEP | 51.8 | 20.7 | 24.5 | 3.0 | 51.8 | 83.7 | 77.5 |
| LIGHT | 13.4 | 35.5 | 31.6 | 19.4 | 35.5 | 75.4 | 54.8 |
| REM | 24.2 | 35.0 | 36.2 | 4.6 | 36.2 | 73.1 | 68.6 |
| WAKE | 19.5 | 22.0 | 15.5 | 43.0 | 43.0 | 86.6 | 79.0 |
In Table 4, sensitivity, specificity and accuracy was averaged for all subjects. In Table 5, the calculation results of total accuracy and kappa were represented.
Table 4.
Evaluation indices for all subjects
| Sensitivity | Specificity | Accuracy | |
|---|---|---|---|
| DEEP | 53.3 ± 14.8 | 90.1 ± 4.5 | 82.8 ± 4.7 |
| LIGHT | 32.0 ± 5.8 | 75.9 ± 7.0 | 53.0 ± 4.0 |
| REM | 41.5 ± 14.4 | 74.9 ± 5.7 | 68.0 ± 6.3 |
| WAKE | 66.3 ± 21.3 | 78.5 ± 6.1 | 77.2 ± 6.0 |
| Average | 48.3 ± 12.9 | 79.8 ± 6.0 | 70.3 ± 11.3 |
Table 5.
Results of total accuracy and kappa for each subject
| Subject1 | Subject2 | Subject3 | Subject4 | Subject5 | Subject6 | Average | |
|---|---|---|---|---|---|---|---|
| Total accuracy | 41.1 | 39.6 | 44.8 | 37.4 | 40.0 | 40.1 | 40.5 ± 2.2 |
| Kappa | 0.20 | 0.19 | 0.27 | 0.15 | 0.15 | 0.18 | 0.19 ± 0.04 |
In classification of DEEP, sensitivity was highest with Subject 3 at 68.6% with the least miss-classification being to REM. DEEP sensitivity was the lowest in subject 5 at 37.3% and miss-classification to REM was the greatest. For all subjects, sensitivity was 53.3 ± 14.8%, but standard deviation was large. Conversely, specificity was over 90% and standard deviation was small. Average accuracy of all subjects was 82.8 ± 4.7%. In Subject 3, the ratio of DEEP was large in nocturnal sleep and its duration was long. They contributed to the high classification accuracy of DEEP. On the other hand, as in subject 5 in the case that the ratio of DEEP was small and intermittent like for 5–6 h in Fig. 5, the classification accuracy of DEEP was low. This was because the classification of DEEP depends on parameter 4.
In cases where body movement occurred in the middle of a continuous DEEP, parameter 4 (duration time of stillness) became smaller, and it became more difficult to classify the stage as DEEP. Yoon and et al. reported that sensitivity was 67.22 ± 15.70% and accuracy was 89.80 ± 3.47% in the classification of DEEP using a contact-type electrocardiogram measurement [23]. Compared with this result, our system has sufficient accuracy as a non-contact type sleep monitoring methodology. Sensitivity and accuracy of LIGHT were low for all subjects. This was due to the fact that LIGHT comprises about half of nocturnal sleep and also includes the transition period to other stages. Even when a technologist judges sleep stage, it is difficult to identify the transition period [24, 25]. It is therefore inevitable that miss-classification increases in machine learning. In Subject 5, because that proportion of LIGHT was larger than in the other subjects, sensitivity was the lowest. Parameter 2 was expected to classify LIGHT and other stages but differentiation between LIGHT and REM was difficult due to that the similar occurrence frequency of body movements.
Accuracy of REM was 68.0 ± 6.3% and there were many miss-classifications to LIGHT. REM was expected to be classified by parameter 2 but it was difficult for the same reason as LIGHT. In addition, the value of parameter 4 increased in REM, and it was sometimes misclassified as DEEP. It is possible that this is because body movements in REM could not be detected by our video processing algorithm. Small body movements that are not gross body movements cannot be detected. Komine et al. reported on the classification of REM using contact-type measurement of body movement and respiration cycle, and the accuracy of REM was 80 ± 9% [26]. In addition, Kortelainen et al. reported classified REM using contact-type measurement of body movements and heart beat interval, the accuracy of REM was 80 ± 10% [27]. Since our system is a non-contact-type measurement of only body movements, its classification accuracy of REM is sufficient.
The average sensitivity of WAKE for all subjects was high but the standard deviation was also high. Miss-classifications to LIGHT were more than to the other stages. In cases where body movement was small in single or short WAKE, the period was classified to LIGHT because the value of parameter 1 is at the same level as in LIGHT. Parameters 2 and 3 are unable to detect short WAKE because these parameters use a moving average of 5 min. For subject 7, there were many miss-classifications to DEEP. This is because there was a continuous WAKE of 137 min on the first night where the subject tried intentionally tried not to move in order to get back to sleep. This was an unnatural action on this single night where the duration of stillness had been artificially lengthened (and the value of parameter 4 became large), and thus the section was miss-classified to DEEP.
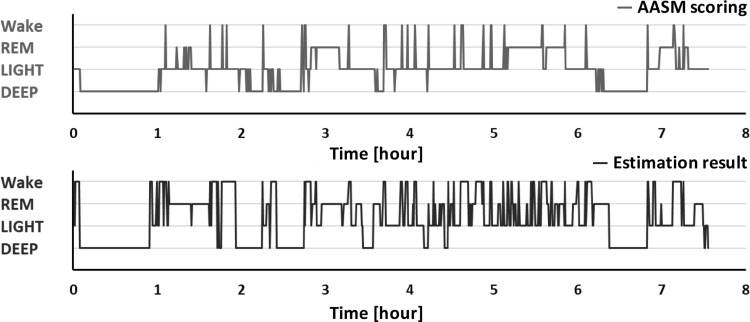
Figure 9 shows a typical result of sleep stage scored by a sleep technologist (AASM scoring) and estimated by our technique. Classification accuracy of consecutive DEEP was high. REM was estimated to be long or intermittent but the times of its appearance were approximately in agreement. These results demonstrate the possibility of estimating sleep cycle, although average of total accuracy was 40.5 ± 2.2% and average kappa was 0.19 ± 0.04 (slight agreement) [28].
Fig. 9.
Sleep cycle of AASM scoring and estimation results
Wei et al. reported that estimation total accuracy of three stages using single-lead EEG measurement was 77% [29]. Hong et al. reported that classification total accuracy of the four sleep stages as defined here was 81% using body movement and respiration measurement from a Doppler radar sensor [30]. Classification accuracy by our method is inferior to their study but we did not use autonomic nervous system information to reduce system cost. Our system is sufficiently accurate as a device for easy home use. Our sleep monitoring system requires only one inexpensive camera to measure bio-signals. The cost of the computing power necessary for video processing and parameter calculation is also low compared with the other technique. Therefore, it can also be built into a smartphone and modularized based on microcomputer if camera is attached. These considerations are advantageous in the development of a home use device.
Our system does have limitations. It is unable to produce high classification accuracy suitable for medical use, because it is for home use and utilizes only body movement. If higher classification accuracy is required, an index of autonomic nerve activity will also need to be measured to provide additional parameters for machine learning, for example heat rate or respiration frequency [31]. There are possible that classification accuracy of LIGHT an REM is improved by these autonomic nerve indices. In our system, Two-dimensional moving data converted one-dimension during process of inter-frame difference. Accordingly, two-dimensional information like direction of body movements is lost. However, our system can obtain more information than one-dimension sensor like infrared motion detection sensor, because that information of two-dimension is included as volume of body movement in one-dimension data of our system. If these two dimensional data is applied, detection of respiration frequency,direction of body movements and movements of each four limbs using camera is technologically possible even though cost becomes high [32]. The results of six subjects indicate an availability of our system for home use. However, more subjects are needed to generalize. The results of six subjects indicate an availability of our system for home use. However, considering environmental factors and user’s age, there is a possibility that the number of subjects is not enough to generalize.
In the future work, we would like to collect data for generalization. Moreover, using a high-resolution camera to improve the ability to detect fine body movement and respiratory movement may improve accuracy sufficiently for clinical use. Additionally, since video processing has been simplified sufficiently for home use in this study, further improvements in software are still possible. For home use, we aim to further develop a method to monitor individuals even when several people are sleeping in the same bed or room.
Conclusion
In this study, we developed an inexpensive and simple sleep monitoring system for home use using an inexpensive camera and low-cost computing power. Our system made it possible to estimate sleep stages, including REM, using two types of video inter-frame difference to improve the ability to detect body movement and five parameters representing features of body movement in each sleep stage. Classification accuracy of four sleep stages, including REM, was sufficient for a home use, as non-contact device, and the potential for estimating sleep cycle stages was demonstrated. This indicates that our method can be used as a basis for environmental control for sleep according to sleep cycle stage.
Acknowledgements
We thank sleep laboratory technicians (Kamimura M, Nonoue S, Mashita M, Maekawa T, Y Teshima, Koda S, Yamamoto A, Hirai N, Nakamura Y, Iwaki A and Nishida M) for their technical assistance.
Funding
This study was funded by Center of Innovation Science and Technology based Radical Innovation and Entrepreneurship Program (COISTREAM), and partially supported by the Grant-in-Aid for Challenging Research (Exploratory)(#17K19753, #15K12721).
Conflict of interest
We declares that we have no conflict of interest.
Ethical approval
All procedures performed in studies involving human participants were in accordance with the ethical standards of the institutional and/or national research committee and with the 1964 Helsinki declaration and its later amendments or comparable ethical standards.
Informed consent
Informed consent was obtained from all individual participants included in the study.
Footnotes
Publisher's Note
Springer Nature remains neutral with regard to jurisdictional claims in published maps and institutional affiliations.
References
- 1.Van Reeth O, Weibel L, Spiegel K, Leproult R, Dugovic C, Maccari S. Physiology of sleep (review)—interactions between stress and sleep: from basic research to clinical situations. Sleep Med Rev. 2000;4(2):201–219. [Google Scholar]
- 2.Becker NB, Jesus SN, Marguilho R, Viseu J, Del Rio KA, Buela-Casal G. Sleep quality and stress: a literature review. In: 8th international conference on modern research in psychology, (June). 2015. p. 53–60.
- 3.Rechtschaffen A, Kales A. A manual of standardized terminology: techniques and scoring system for sleep stages of human subjects. Washington D.C.: U.S. Public Health Service, U.S. Government Printing Office; 1968.
- 4.Silber MH, Ancoli-Israel S, Bonnet MH, Chokroverty S, Grigg-Damberger MM, Hirshkowitz M, Kapen S, Keenan SA, Kryger MH, Penzel T, Pressman MR, Iber C. The visual scoring of sleep in adults. J Clin Sleep Med. 2007;3(02):121–131. [PubMed] [Google Scholar]
- 5.Berry RB, Brooks R, Gamaldo CE, Harding SM, Lloyd RM, Marcus CL, Vaughn BV. The AASM manual for the scoring of sleep and associated events: rules, terminology and technical specifications. Version.2.2. American Academy of Sleep Medicine, Darien, IL; 2015.
- 6.Hwang SH, Lee YJ, Jeong DU, Park KS. Unconstrained sleep stage estimation based on respiratory dynamics and body movement. Methods Inf Med. 2016;55(06):545–555. doi: 10.3414/ME15-01-0140. [DOI] [PubMed] [Google Scholar]
- 7.Kagawa M, Sasaki N, Suzumura K, Matsui T. Sleep stage classification by body movement index and respiratory interval indices using multiple radar sensors. In: Conference proceedings of the IEEE engineering in medicine and biology society; 2015. p. 7606–7609. [DOI] [PubMed]
- 8.Ko PT, Kientz JA, Choe EK, Kay M, Landis CA. Consumer sleep technologies: a review of the landscape. J Clin Sleep Med. 2015;11(12):1455–1456. doi: 10.5664/jcsm.5288. [DOI] [PMC free article] [PubMed] [Google Scholar]
- 9.Aaronson ST, Rashed S, Biber MP, Hobson JA. Brain state and body position; a time-lapse video study of sleep. Arch Gen Psychiatry. 1982;39(3):330–335. doi: 10.1001/archpsyc.1982.04290030062011. [DOI] [PubMed] [Google Scholar]
- 10.Wilde-Frenz J, Schulz H. Rate and distribution of body movements and during sleep in humans. Percept Mot Skills. 1983;56(1):275–283. doi: 10.2466/pms.1983.56.1.275. [DOI] [PubMed] [Google Scholar]
- 11.Okada S, Ohno Y, Shimizu S, Kato-Nishimura K, Mohri I, Taniike M, Makikawa M. Development and preliminary evaluation of video analysis for detecting Gross movement during sleep in children. Biomed Eng Lett. 2011;1(4):220–225. [Google Scholar]
- 12.Okada S, Shimizu S, Ohno Y, Mohri I, Taniike M, Makikawa M. Novel sleep stage estimation method for children using body movement. J Public Health Front. 2013;2(2):61–68. [Google Scholar]
- 13.Jasper HH. The ten-twenty electrode system of the international federation. Electroencephalogr Clin Neurophysiol. 1958;10:371–375. [PubMed] [Google Scholar]
- 14.Jun-chao C, Jun-hao Z, Shi-jia L, Xiao-feng L. Improved target detection algorithm based on background modeling and frame difference. J Comput Eng. 2011;37:171–173. [Google Scholar]
- 15.Bang J, Kim D, Eom H. Motion object and regional detection method using block-based background difference video frames. In: IEEE 18th international conference on RTCSA. 2012.
- 16.Sood M, Sharma R, Dipakkumar C. Motion human detection & tracking based on background subtraction. Int J Eng Invent. 2013;2(6):34–37. [Google Scholar]
- 17.Cortes C, Vapnik V. Support-vector networks. Mach Learn. 1995;20(3):273–297. [Google Scholar]
- 18.Suykens JAK, Vandewalle J. Least squares support vector machine classifiers. Neural Process Lett. 1999;9:293–300. [Google Scholar]
- 19.Cohen J. A coefficient of agreement for nominal scales. Educ Psychol Meas. 1960;20:37–46. [Google Scholar]
- 20.Landis JR, Koch GG. The measurement of observer agreement for categorical data. Biometrics. 1977;33(1):159–174. [PubMed] [Google Scholar]
- 21.Ohayon MM, Carskadon MA, Guilleminault C, Vitiello MV. Meta-analysis of quantitative sleep parameters from childhood to old age in healthy individuals: developing normative sleep values across the human lifespan. Sleep. 2004;27(7):1255–1273. doi: 10.1093/sleep/27.7.1255. [DOI] [PubMed] [Google Scholar]
- 22.Rosipal R, Lewandowski A, Dorffner G. In search of objective components for sleep quality indexing in normal sleep. Biol Psychol. 2013;94(1):210–220. doi: 10.1016/j.biopsycho.2013.05.014. [DOI] [PMC free article] [PubMed] [Google Scholar]
- 23.Yoon H, Hwang SH, Choi JW, Lee YJ, Jeong DU, Park KS. Slow-wave sleep estimation for healthy subjects and OSA patients using R-R intervals. IEEE J Biomed Health Inform. 2018;22(1):119–128. doi: 10.1109/JBHI.2017.2712861. [DOI] [PubMed] [Google Scholar]
- 24.Rosenberg RS, Van Hout S. The American Academy of Sleep Medicine inter-scorer reliability program: respiratory events. J Clin Sleep Med. 2014;10(4):447–454. doi: 10.5664/jcsm.3630. [DOI] [PMC free article] [PubMed] [Google Scholar]
- 25.Nonoue S, Mashita M, Haraki S, Mikami A, Adachi H, Yatani H, Kato T. Inter-scorer reliability of sleep assessment using EEG and EOG recording system in comparison to polysomnography. Sleep Biol Rhythms. 2017;15(1):39–48. [Google Scholar]
- 26.Komine T, Takadama K, Nishino S. Toward the next-generation sleep monitoring/evaluation by human body vibration analysis. In: 2016 AAAI spring symposium series. AAAI Publications; 2016. p. 369–374.
- 27.Kortelainen JM, Mendez MO, Bianchi AM, Matteucci M, Cerutti S. Sleep staging based on signals acquired through bed sensor. IEEE Trans Inf Technol Biomed. 2011;14(3):776–785. doi: 10.1109/TITB.2010.2044797. [DOI] [PubMed] [Google Scholar]
- 28.Kambayashi Y, Higashi N. Estimating sleep cycle using body movement density. In: 5th international conference on biomedical engineering and informatics; 2012. p. 1081–1085.
- 29.Wei R, Zhang X, Wang J, Dang X. The research of sleep staging based on single-lead electrocardiogram and deep neural network. Biomed Eng Lett. 2018;8:87. doi: 10.1007/s13534-017-0044-1. [DOI] [PMC free article] [PubMed] [Google Scholar]
- 30.Hong H, Zhang L, Member S, Gu C. Noncontact sleep stage estimation using a CW Doppler radar. IEEE Trans Emerg Sel Top Circuits Syst. 2017;3357(c):1–11. [Google Scholar]
- 31.Long X, Foussier J, Fonseca P, Haakma R, Aarts RM. Analyzing respiratory effort amplitude for automated sleep stage classification. Biomed Signal Process Control. 2014;14:197–205. [Google Scholar]
- 32.Nochino T, Ohno Y, Okada S. Development of noncontact respiration monitoring method with web-camera during sleep. In: 2017 IEEE 6th global conference on consumer electronics (GCCE); 2017. p. 677–678.


