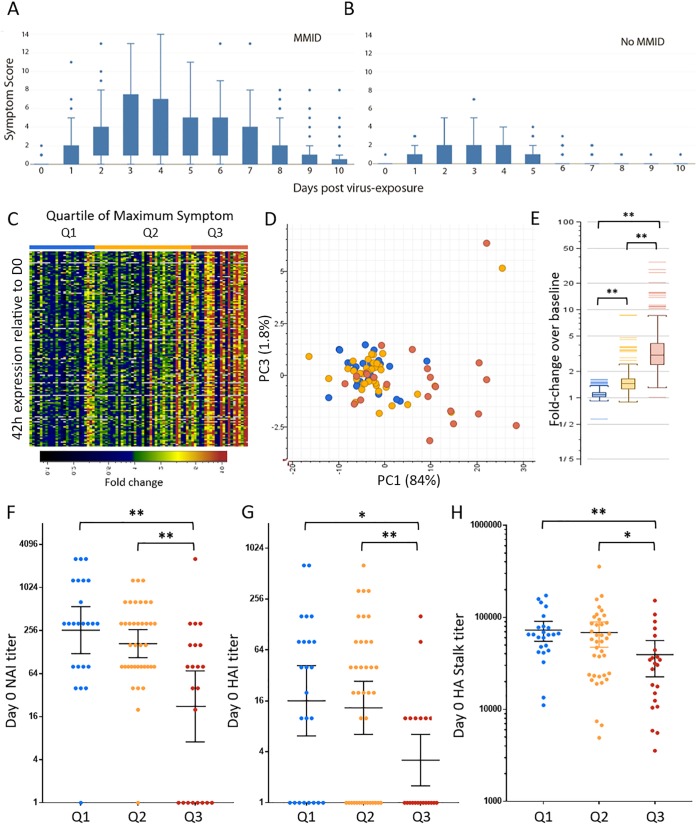
FIG 5.
PBL expression signatures present at 42 h correlated with later disease severity. (A and B) Box plot of range of daily symptom scores in participants with mild-to-moderate influenza disease (MMID) (A) and participants with No MMID (B). (C) Heatmap showing expression profiles of transcripts (n = 126) at 42 h postinfection that correlate (r ≥ 0.5) positively with maximum symptom score. Genes shown in green to red were increased and genes shown in blue to black were decreased relative to each participant’s day 0 expression. (D) Principal-component analysis of maximum symptom-correlated genes at 42 h postinfection colored by quartile of maximum symptom score. (E) Graph of average 42 h expression of maximum symptom-correlated genes relative to day 0 grouped by quartile of maximum symptom score. (F to H) Statistical analysis of preexisting antibodies between participants grouped by quartile of maximum symptom score as measured by day 0 NAI titer (F), HAI titer (G), and HA stalk ELISA titer (H). Statistical significance between groups was assessed using rank sum t test and indicated as follows: *, P ≤ 0.05; **, P < 0.01.

