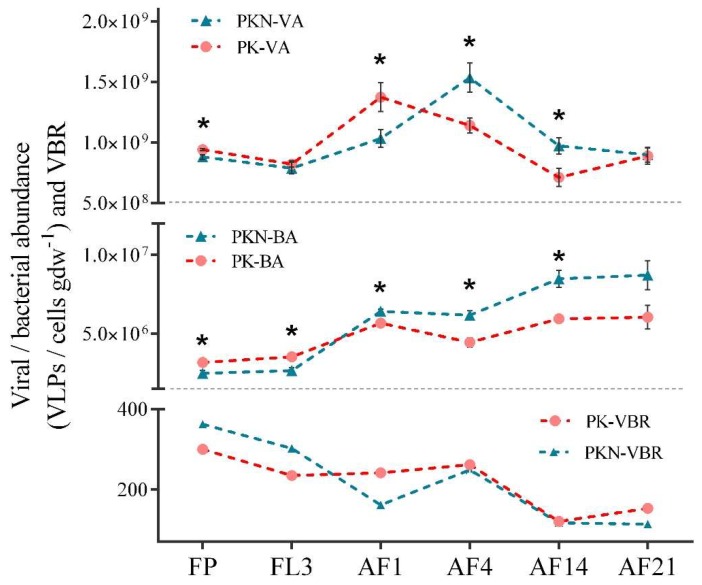
Figure 2.
Dynamics in viral abundance (VA), bacterial abundance (BA) and virus-to-bacterium ratio (VBR) in the phosphate and potassium fertilizer (PK) and phosphate, potassium, and nitrogen fertilizer (PKN) groups. The asterisks indicate significant differences are obtained from matched samples (T-test; *, p < 0.05). FP, representing spring fallow period measurements; FL3, third day of flooding; AF1, 4, 14, 21 refer to the first, fourth, 14th, and 21st days after fertilization, respectively.

