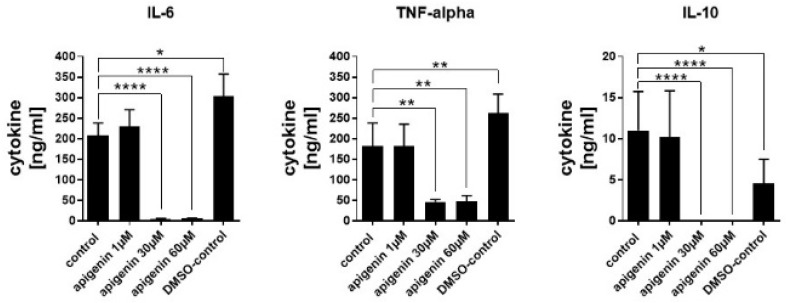
Figure 10.
Quantification of cytokines in the supernatant of human dendritic cells stimulated with vehicle, Api in different concentrations or DMSO for 24 h in presence of LPS. Data are expressed as mean ± standard deviation (SD), significant differences are indicated as * p < 0.05; ** p < 0.01; **** p < 0.0001; n = 3.

