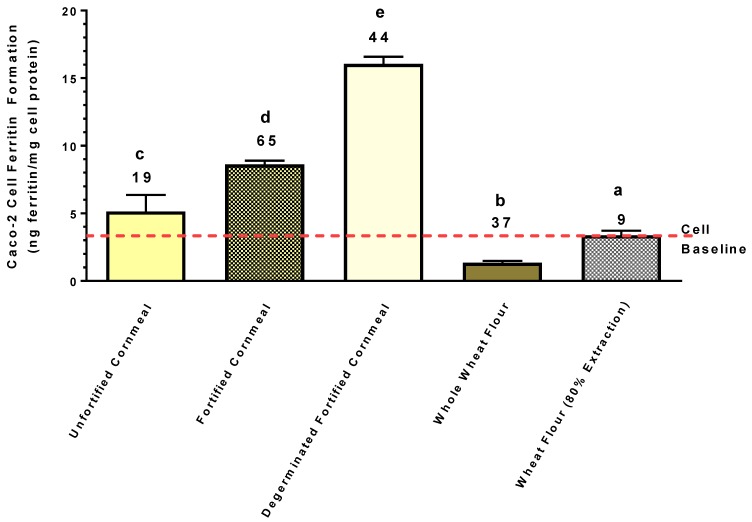
Figure 5.
Iron bioavailability from the cornmeal and wheat flours purchased at a local supermarket. Caco-2 cell ferritin values represent relative Fe bioavailability as cell ferritin formation is proportional to Fe uptake. Numbers on top of bar values represent Fe concentrations (µg/g) of samples. Bar values with no letter in common are significantly different (p < 0.05). Bar values are mean ± SD, n = 3. Dashed red line indicates Caco-2 cell baseline ferritin level when exposed only to the in vitro digest solutions without food samples. A bar value below the baseline indicates strong inhibitory factors that negate the bioavailability of ultra-low background Fe present in the digest solutions.

