

Abstract
The blood brain barrier (BBB) is the main barrier that separates the blood from the brain. Because of the BBB, the drug concentration-time profile in the brain may be substantially different from that in the blood. Within the brain, the drug is subject to distributional and elimination processes: diffusion, bulk flow of the brain extracellular fluid (ECF), extra-intracellular exchange, bulk flow of the cerebrospinal fluid (CSF), binding and metabolism. Drug effects are driven by the concentration of a drug at the site of its target and by drug-target interactions. Therefore, a quantitative understanding is needed of the distribution of a drug within the brain in order to predict its effect. Mathematical models can help in the understanding of drug distribution within the brain. The aim of this review is to provide a comprehensive overview of system-specific and drug-specific properties that affect the local distribution of drugs in the brain and of currently existing mathematical models that describe local drug distribution within the brain. Furthermore, we provide an overview on which processes have been addressed in these models and which have not. Altogether, we conclude that there is a need for a more comprehensive and integrated model that fills the current gaps in predicting the local drug distribution within the brain.
Keywords: Mathematical modeling, Drug transport, Brain extracellular fluid, Blood–brain barrier, Pharmacokinetics
Introduction
The blood–brain barrier (BBB) separates the blood from the brain. The BBB is formed by the brain capillary endothelial cells that constitute the walls of the brain capillaries. Multiprotein complexes called tight junctions are located between adjacent brain capillary endothelial cells and seal the intercellular space, thereby limiting intercellular diffusion. In addition, transport across the BBB is affected by transporters and helper molecules located at the brain capillary endothelial cells that move compounds from the blood to the brain or from the brain to the blood. Consequently, the drug concentration-time profile in the brain may be substantially different from that in the blood [1]. Once in the brain, the drug is subject to distribution and elimination processes: diffusion, bulk flow of the brain extracellular fluid (ECF), extra-intracellular exchange, bulk flow of the cerebrospinal fluid (CSF) and metabolism. Furthermore, the drug may bind to specific binding sites (targets) and non-specific binding sites (brain tissue components). Consequently, the drug concentration-time profile in the brain may be substantially different from that in the blood [1], while also local differences in drug concentration-time profiles within the brain may arise. The local concentration-time profiles within the brain are highly important, since drug effects within the central nervous system (CNS) are driven by the concentration-time profile of a drug at the site of its target: the drug needs to be distributed to its target in sufficient concentrations and duration in order to optimally interact with its target and elicit the desired effect. To predict a drug’s effect, therefore, a quantitative understanding is needed on brain target site distribution. However, as the human brain is inaccessible for sampling, measuring drug concentration-time profiles is highly restricted. Mathematical models are a helpful tool to describe and understand the impact of processes that govern drug distribution within the brain. Moreover, while direct measurement of spatial drug distribution within the brain is restricted, mathematical models allow the prediction of the spatial distribution of a drug within the brain. To adequately predict the drug distribution of a drug into and within the brain, a mathematical model should include all of the above mentioned factors that govern the concentration-time profiles of a drug within the brain. However, currently existing models focus on just one or a few of these processes. The aim of this review is to provide an overview of the current state of the art in modelling drug distribution into and within the brain and highlight the need for novel methods that provide a more complete description of the local drug distribution within the brain. We first summarise the factors affecting the drug distribution within the brain (in “Factors affecting drug distribution within the brain”). Then, we give an overview of currently available models on the distribution of compounds into and within the brain and of models that integrate two or more of these aspects (in “Existing models on the local distribution of drugs in the brain”). Finally, in “The need for a refined mathematical model on spatial drug distribution within the brain”, we discuss how we can improve or combine current models to develop a comprehensive model for improved prediction of drug distribution into and within the brain.
Factors affecting drug distribution within the brain
The distribution of a drug within the brain determines the local concentration of drug that is available to bind to its target and thereby induce an effect. Both the structural properties of the brain and those of the drug affect the distribution of the drug within the brain. In this section, we first discuss the brain-specific and drug-specific properties. Then, we describe the processes that affect local drug distribution within the brain. These processes depend on both the brain-specific and drug-specific properties. Finally, we discuss how spatial variations in drug distribution processes may lead to spatial differences in drug concentration-time profiles within the brain.
Brain-specific properties
The brain-specific properties are the structural properties of the brain. The structural properties most important for drug distribution within the brain are highlighted in Fig. 1. Blood is supplied to the brain by arteries feeding the anterior (front) or posterior (back) part of the brain. The arteries branch out into smaller brain capillaries. At the level of the brain capillaries, compounds are exchanged between the blood and the brain tissue. The blood in the brain capillaries is separated from the brain tissue by the BBB (Fig. 1a). The brain capillaries reunite to form veins, from which the blood is carried away from the brain back into the heart. The brain tissue (brain parenchyma) consists of the brain ECF and the brain cells. The brain ECF surrounds the cells and circulates within the brain tissue. The CSF circulates between the sub-arachnoid space (located between the dura mater, a layer of connective tissue surrounding the brain tissue, and the brain tissue, see Fig. 1), the brain ventricles, and the spine (Fig. 1). The blood is separated from the CSF by the blood–CSF barrier (BCSFB) and the blood–arachnoid barrier. The BCSFB is located between the blood in the brain capillaries and the CSF in ventricles of the brain (Fig. 1b). The blood–arachnoid barrier is positioned between the blood in the dura mater and the CSF in the sub-arachnoid space (Fig. 1c). The entire brain contains many potential binding sites for endogenous compounds (that originate within the body) and exogenous compounds (that originate outside the body). In addition, metabolic enzymes residing in the brain may chemically convert substances into new molecules. In the subsequent sections, we highlight the properties of the brain vascular network, the brain barriers, the brain tissue (including the brain ECF and the brain cells), the CSF, the fluid movement within the brain, binding and metabolism.
Fig. 1.

Structure of the human brain: blood, brain tissue, CSF and the brain barriers. Blood vessels (red) infiltrate the brain tissue (grey) and branch out into smaller brain capillaries (inset). At the level of the brain capillaries compounds exchange between the blood and the brain tissue through the BBB. The brain tissue (brain parenchyma) contains the brain cells and the brain ECF. The CSF (blue) is located in the sub-arachnoid space (located between the dura mater, a layer of connective tissue surrounding the brain tissue, and the brain tissue), the brain ventricles and the spine. The blood is separated from the CSF by the BCSFB and the blood–arachnoid barrier. The brain barriers are indicated by black squares a–c. a The BBB is the barrier between the blood in the brain capillaries and the brain tissue. b The BCSFB is the barrier between the blood in the capillaries and the CSF in the brain ventricles. c The blood–arachnoid barrier is the barrier between the blood in the blood vessels of the dura mater and the CSF in the sub-arachnoid space.
a–c are adapted from [242] and licensed under CC BY 4.0. d is adapted with permission from [243]
The brain vascular network
An extensive network of vasculature supplies the brain with oxygen and nutrients (Fig. 2, left). The brain surface is perfused with large arteries and veins that carry oxygen and nutrients to the brain (Fig. 2, middle). The larger brain arteries branch out into smaller arterioles that penetrate the brain cortex and merge into the brain microcirculation, consisting of the brain capillary beds (Fig. 2, right). The brain capillaries that make up the capillary beds surround the brain tissue. Waste products are carried away from the capillary beds by the venules. The venules merge into the veins, which lead the blood and the waste products it contains back to the heart. The brain capillaries have a large surface area: they are the main site for the exchange of oxygen and nutrients with the brain tissue [2]. The brain capillary network is very dense and it is estimated that each neuron is perfused with its own capillary [3]. The average distance between the capillaries in the rat brain is only about 50 [4–7]. The brain capillaries are separated from the brain by the brain barriers, which will be discussed in the next section.
Fig. 2.

The brain vascular network. Left: the network of brain vasculature (public domain image) [245]. Middle: vascular organization of the cerebral cortex [97]. Arterioles (pink) penetrate the brain cortex and branch out into dense capillary beds that feed an active region of the brain (highlighted in red). Venules (dark red) take away the blood from the brain capillary beds. The image by by [97] is licensed under CC BY 3.0. Right: capillaries. A capillary bed consists of a small network of capillaries. The brain capillaries are fed with oxygen and nutrients by the blood flow from the general blood circulation through the arteries and arterioles. Waste products are carried away from the brain capillaries by blood flow back into the heart through the venules and veins.
Adapted with permission from [244]
The barriers of the brain
Three barriers are known that separate the blood in the brain capillaries from the brain:
The BBB, which separates the blood in the brain capillaries from the brain tissue, including the brain ECF and the brain cells.
The BCSFB, which separates the blood in the brain capillaries from the CSF in the brain ventricles.
The blood–arachnoid barrier, which separates the blood in the blood vessels of the dura mater from the CSF in the sub-arachnoid space (see Fig. 1).
The main characteristics of each barrier are summarised in Fig. 3 and described below. Drug transport across these brain barriers is described later in “Processes affecting drug distribution within the brain”.
Fig. 3.

Barriers of the brain. a The BBB. The BBB separates the blood from the brain tissue, including the brain ECF and the cells. The barrier exists at the level of the brain capillary endothelial cells, which are connected by tight junctions. b The BCSFB. The BCSFB separates the blood from the CSF in the brain ventricles. The barrier function exists at the level of the choroid plexus epithelial cells, that are connected by tight junctions. Unlike at the BBB, the capillaries between the blood and the CSF are fenestrated (contain pores) and are not connected by tight junctions. A layer of cells of the ependyma separates the CSF from the brain ECF. c The arachnoid barrier. The arachnoid barrier separates the blood in the blood vessels of the dura mater from the CSF in the sub-arachnoid space. The barrier function is exerted by the arachnoid cells, that are connected by tight junctions. A layer of cells of the pia mater (pial cells) separates the CSF from the brain ECF.
Adapted with permission from [2]
The BBB
The BBB protects the brain against the influx of toxic or harmful substances [8]. Moreover, it helps maintaining brain homeostasis by regulating the transport of ions, molecules and leukocytes into and out of the brain [9]. The BBB separates the blood from the brain and consists of the brain endothelial cells, that constitute the walls of the brain capillaries. Depending on the drug, transport across the BBB might be more or less difficult. Typically, the brain endothelial cells form a firmly closed layer of cells [10] (Fig. 3a). Tight junctions, multiprotein complexes located in the narrow space between the brain endothelial cells, and a lack of fenestrations (small pores) between adjacent brain capillary endothelial cells make it hard for compounds to pass through the intercellular space [11]. Around the brain endothelial cells, astrocytes (supportive cells, see “The brain tissue and the CSF”) connect with neurons and pericytes, the latter regulating the BBB functionality [8]. Together, they form the so-called neurovascular unit, which is the actual barrier of the brain.
The BCSFB
The BCSFB separates the blood in the brain capillaries from the CSF. It regulates the exchange of compound in order to maintain a stable environment for normal brain function. The barrier consists of the epithelial cells of the choroid plexus located in the brain ventricles (Fig. 1). These cells are strongly connected by tight junctions (Fig. 3b). In contrast, the brain capillaries of the BCSFB are, unlike those of the BBB, fenestrated (contain pores) and highly permeable.
The blood–arachnoid barrier
The blood–arachnoid barrier separates the (fenestrated) brain capillaries in the dura mater from the CSF in the sub-arachnoid space (see Fig. 1) [12–14]. The barrier is formed by a layer of arachnoid cells (epithelial cells located between the dura mater and the sub-arachnoid space), that are connected by tight junctions (Fig. 3c).
The brain tissue and the CSF
The brain tissue consists of the brain ECF and the cells containing intracellular fluid (ICF). It is perfused with the brain vasculature (see also “The brain vascular network”) and surrounded by the CSF. The properties of the brain ECF, brain cells and CSF will be discussed below.
The brain ECF
The brain ECF surrounds the brain cells and occupies about of the brain tissue. It is also referred to as the brain interstitial fluid to avoid confusion with the blood plasma, which is in fact also an ECF. The brain ECF is crucial in the transport of both endogenous and exogenous compounds [15, 16]. It is produced by filtration of blood plasma through the brain capillary walls that constitute the BBB. As proteins cannot pass the BBB, the composition of the brain ECF is similar to that of the blood plasma but includes a minimal amount of proteins.
The brain cells
The brain cells can be classified into neurons, supportive cells (glial cells) and pericytes. Neurons are excitable brain cells that transmit information by electrical and chemical impulses. They have a typical morphology, consisting of one long axon and one or multiple shorter dendrites attached to the cell body. Multiple axons can be packed together in so called nervous tracts. The glial cells support and protect the neurons and include astrocytes, oligodendrocytes and microglia [17]. Of these, astrocytes have an important function in regulating local blood flow to match the transport of oxygen and nutrients to neuronal activity [17–21]. The astrocytes are in contact with both brain endothelial cells and neurons. Finally, pericytes surround the brain endothelial cells and help regulate the permeability of the BBB and the brain capillary blood flow by contraction movements [17]. Together, the brain cells make up almost of the volume of the brain tissue [17]. Cellular composition differs between the white matter in the deep parts of the brain and the grey matter in the more superficial parts of the brain. The white matter consists mostly of nervous tracts, that contain long, myelinated axons branching out from neurons. Myelination refers to the insulation of axons by myelin to speed up the transmission of information along the nervous tracts. The grey matter consists of neurons (the cell body, dendrites and unmyelinated axons), glial cells, and brain capillaries.
The CSF
The CSF resides in the four brain ventricles and in the sub-arachnoid space. It provides a mechanical protection of the brain (against shocks and injuries), helps in the discard of waste and compensates blood volume changes in the brain during the cardiac cycle [22]. The CSF is mostly produced by the epithelial cells of the choroid plexus in the ventricles of the brain [23] (Fig. 1). Recently, it has been hypothesised that the CSF is produced within the entire brain CSF circulation, as a result of the filtration of fluid across the brain capillary walls into the brain ECF [24]. The CSF is a clear fluid with a low protein concentration with similar composition as the brain ECF.
Fluid movements within the brain
Regular recycling and clearance of the brain ECF is needed for maintaining homeostasis within the brain tissue [25]. The ependymal cell layer between the brain ECF and the CSF in the brain ventricles (see Fig. 3b) and the pial cell layer between the brain ECF and the CSF in the sub-arachnoid space (see Fig. 3c) are both relatively permeable. Hence, fluid freely circulates between the brain ECF and the CSF [26, 27]. The movement of both the brain ECF and the CSF will be discussed below.
Brain ECF movement
The brain ECF is produced by the secretion of fluid from the brain capillary endothelial wall. This arises from the passive movement of water across the BBB in response to ionic gradients [25]. Within the brain, the brain ECF moves through the extracellular space by the brain ECF bulk flow. The brain ECF bulk flow is driven by hydrostatic pressure [27, 28] or pulsatile movements of the brain arteries [29]. The brain ECF bulk flow is directed towards the CSF in the ventricles and in the sub-arachnoid space. There, the CSF acts as a sink because of its turnover (see “CSF movement”) [30]. Alternatively, the brain ECF may drain directly across the capillary and arterial walls into the lymphatic system [30]. The importance of the brain ECF bulk flow relative to diffusion has been under debate [27, 31, 32]. A recently proposed “glymphatic mechanism“ describes the convective fluid transport from the para-arterial to para-venous space through the brain ECF that is regulated by the glia cells [23, 29, 33, 34]. This “glymphatic mechanism” derives its name from its dependence on glial cells and its resemblance to the removal of waste products by lymph systems outside of the brain [35, 36]. It involves the exchange of fluid between the brain ECF and the CSF, in which the CSF enters the brain ECF from the arteries or arterioles, while the brain ECF exits along the veins or venules [33, 36]. This fluid exchange is suggested to depend on so-called aquaporin-4 channels that are located at the astrocyte endfeet and facilitate the transport of water across barriers [33, 35–37]. The “glymphatic mechanism” lacks a mechanistic basis and therefore, mathematical modelling comes into use. Recent modelling studies taking the “glymphatic mechanism” of brain ECF bulk flow into account demonstrate that transport within the brain ECF is dominated by diffusion [38, 39]. Despite the controversy around the importance of bulk flow within the brain ECF relative to diffusion, there is evidence that the brain ECF bulk flow affects brain diseases, including epilepsy [25].
CSF movement
The CSF is produced by the epithelial cells of the choroid plexus that constitute the BCSFB (Figs. 1b and 3b). The CSF is generally assumed to circulate between the brain ventricles and sub-arachnoid space before reabsorption into the blood of the peripheral blood stream at the level of the arachnoid membrane (Fig. 1c). The CSF can also be absorbed into the lymphatic system [40]. Part of the CSF can be absorbed into the brain tissue via the Virchow–Robin space (fluid-filled canals around the blood vessels that penetrate the brain tissue) or the para-arterial space [25, 31, 41–43]. There is evidence that the Virchow-Robin space functions as a drainage pathway for the clearance of waste molecules from the brain and is also a site of interaction between the brain and the (systemic) immune system [23]. A new view starts to emerge that considers the CSF to be produced within the entire CSF system and describes the CSF circulation as much more complicated [23–25]. There, the CSF circulation includes directed CSF bulk flow, pulsatile back-and-forth movements of fluid between the brain ECF and CSF and the continuous bidirectional exchange of fluid across the BBB and the cell layers between the brain ECF and CSF (see Fig. 3) [23].
Metabolic enzymes
Metabolic enzymes chemically alter substances into new molecules, the metabolites. Important metabolic enzymes include the cytochrome P450 proteins and conjugating enzymes [44]. The liver is the main site for (drug) metabolism and contains high concentrations of cytochrome P450 proteins. In the brain, cytochrome P450 proteins are also present. Particularly in and around the cerebral blood vessels and the brain barriers, cytochrome P450 and conjugating enzymes have been detected [45]. Even though in the brain the cytochrome P450 proteins exist at much lower levels than in the liver, they may substantially affect local metabolism depending on their location [46].
Drug-specific properties
The properties of a drug affect its distribution within the brain. These properties can be classified into molecular properties inherent to the drug and other properties that emerge from the interaction of the drug with its environment. These include the physicochemical properties and binding affinities, that in turn affect the pharmacokinetic properties (Fig. 4). All are discussed below.
Fig. 4.

The properties of a drug affecting its distribution within the brain. The molecular properties are the properties inherent to the drug and affect both its physicochemical and biochemical properties. The physicochemical properties describe the interaction of a drug with its physical environment, while the biochemical properties describe the binding affinities of a drug to other molecules. The pharmacokinetic properties depend on both the physicochemical and biochemical properties
Molecular properties
The molecular properties of the drug are the most basic properties inherent to the drug. The most important structural properties are:
The molecular weight. This is the mass of one molecule of the drug. The molecular weight correlates with absorption, diffusion, transport across the BBB, but also with active transport back into the blood [47]. A low molecular weight is usually related to a better distribution into and within the brain. Most drugs that diffuse through the BBB have a molecular weight below 500 [48].
The shape. This is the outline of the space occupied by the drug and can highly influence the interactions of a drug with its environment (see [49] for a review).
The polar surface area. This is the surface area occupied by all polar (generally nitrogen and oxygen) atoms of the drug. This is important as the polar atoms of a drug are involved in the transport between aqueous (polar) and membrane (non-polar) regions. To diffuse through the BBB, the polar surface area usually needs to be less than 90 [50].
The number of hydrogen bond donors and acceptors. Hydrogen bonds are weak bonds resulting from electrostatic interactions between a hydrogen atom bound to a more electronegative atom (the donor) and another electronegative atom (the acceptor). The number of hydrogen bond donors and acceptors in a drug molecule determines the likeliness of a drug to take part in hydrogen bonding with molecules in its environment (see “Drug-specific properties that depend on the environment” section).
Drug-specific properties that depend on the environment
The molecular properties of a drug affect how a drug interacts with its environment. (Fig. 4). Properties of drug interaction with its environment can be classified into:
- The physicochemical properties. These determine the interaction of a drug with the environment it resides in, including the fluid and tissue components. Important examples of physicochemical properties are:
- The pKa. This is the pH (of the environment) at which the drug exists for in its charged state and for in its uncharged state. As the pH of the body is limited to a narrow range, the pKa of the drug greatly affects its charge. In turn, the charge of a drug affects many factors, including the drug solubility, lipophilicity, binding affinities and pharmacokinetic properties (see “Pharmacokinetic properties” below). While charged drugs generally have a higher solubility, uncharged drugs are more lipophilic and therefore cross cell membranes more easily [47].
- The solubility. This is the ability of a drug to dissolve in the environment it resides in to give a homogeneous system. This is crucial for drug absorption: in order to be absorbed, drug needs to be fully dissolved at the site of absorption.
- The lipophilicity. This describes how easily a drug dissolves in non-polar (i.e. ‘fatty’) solvents compared to in polar solvents, like water. It can be estimated using log Poct/wat, which is the log of the ratio of the drug dissolved in octanol and drug dissolved in water, at a pH for which all drug molecules are non-charged. A drug’s lipophilicity is highly important for drug transport across the (lipophilic) cell membranes.
The biochemical properties. These determine the interaction of a drug with proteins and other molecules and affect the concentration of free drug. They include drug binding affinities to blood plasma proteins, drug targets, transporters, tissue components and metabolic enzymes. Therewith, binding greatly impacts the pharmacokinetic properties of the drug (see “Pharmacokinetic properties” below). The interaction of a drug with binding sites not only depends on strong, covalent binding (when a pair of electrons is shared between two atoms), but can also be greatly affected by weaker hydrogen bonds.
Pharmacokinetic properties
The pharmacokinetic properties depend on both the physicochemical and biochemical properties of the drug. They quantify the disposition of a drug, which refers to its absorption, distribution, metabolism and elimination (also known by the acronym ADME):
Absorption generally refers to drug absorption into the systemic circulation (the blood). The bio-availability is a common measure for the fraction of drug that is absorbed into the blood.
Distribution includes drug transport across barriers, drug transport within fluids (e.g. by diffusion), intra-extracellular exchange and drug binding. The volume of distribution defines the distribution of drug between the blood plasma and the rest of the body. Drugs that highly distribute into tissues, i.e. by exchange with cells or binding to tissue components, or drugs that have a low extent of plasma protein binding, generally have a high volume of distribution.
Metabolism of a drug depends on the concentration of metabolic enzymes, the maximal velocity of the metabolic reaction mediated by the enzymes and the interaction of a drug with the metabolic enzymes (see “Drug-specific properties that depend on the environment” above).
Elimination of a drug generally refers to the processes by which a drug is cleared from the body. Common pharmacokinetic properties related to drug elimination are the drug elimination clearance and drug half-life.
Definitions of the discussed pharmacokinetic properties (italic) are given below.
| Bioavailability = The fraction of drug that enters the systemic circulation unchanged or the rate and extent at which drug enters the systemic circulation | |
| Half-life = The time needed for the concentration of drug to be reduced by a half | |
| Elimination clearance = The rate at which active drug is removed from the brain | |
| Volume of distribution = The apparent volume that is required to keep the drug at the same concentration as is observed in the blood plasma |
Processes affecting drug distribution within the brain
A drug needs to be distributed to its target area in sufficient concentrations in order to interact with its target and exert the desired effect. Drug distribution is affected by both the brain-specific and drug-specific properties discussed in the previous subsections. Within the brain, the unbound drug is exchanged between several components, including the blood plasma, the brain ECF, the CSF and the brain cells. The unbound drug therefore drives the distribution of drug into and within the brain [45, 51]. In order to provide a qualitative understanding of the processes that are related to drug distribution we summarise the relevant processes in this subsection. For this purpose, we give a schematic representation in Fig. 5. We make the following classification of processes related to drug distribution within the brain:
Drug transport through the brain vascular system.
Drug transport across the brain barriers.
Drug transport within the brain fluids.
Drug extra-/intracellular exchange.
Drug binding.
Drug metabolism.
The corresponding numbers can be found in Fig. 5. Below, we provide a description of each of these processes.
Fig. 5.

Schematic presentation of the major compartments of the mammalian brain and routes for drug exchange [45]. 1: drug transport through the brain vascular system. 2: drug transport across the brain barriers, including the BBB and the BCSFB. 3: drug transport within the brain fluids (brain ECF and CSF). 4: drug intra-extracellular exchange. 5: drug binding to binding sites that may be intracellular (brown stars), extracellular (yellow stars) or metabolic enzymes (blue stars). Drug binding sites may be present at different sites within the brain. 6: drug metabolism by metabolic enzymes (blue stars). Black arrows: passive transport. White arrows: active transport. Blue arrows: metabolic reactions. The image by [45] is licensed under CC BY 2.0 and modified for the purpose of this review
Drug transport through the brain vascular system
Drugs within the cerebral circulation are first transported by the cerebral blood flow in the larger blood vessels and finally presented to the brain by the brain capillary blood flow in the microcirculation (i.e. the brain capillaries). Hence, blood flow velocity is important for drug delivery to the brain. In the large arteries and veins, the blood flow rate is about 750 mL min−1. However, within the brain capillaries, where drug is exchanged with the brain tissue, the capillary blood flow rate is only 6–12 nL min−1 [17, 52]. Within the blood, drug may bind to red blood cells or, particularly, blood plasma proteins, such as albumin and 1-acid glycoprotein. The percentage of drug that binds to blood plasma proteins varies strongly among drugs and as much as of the drug may be protein-bound [53]. This greatly reduces the concentration of (unbound) drug that can cross the brain barriers to get into the brain.
Drug transport across the brain barriers
Drugs within the blood in the brain capillaries need to cross the brain barriers in order to enter the brain tissue. The movement of drugs from the blood plasma across the brain barriers into the brain tissue involves the crossing of two separated membranes in series. Drug movement across the brain barriers can be classified into several modes of transport as summarised in Fig. 6 and described below:
Simple passive transport, in which drugs diffuse across the barrier by following a concentration gradient between the blood in the brain capillaries and the fluids in the brain. The rate of diffusion is proportional to the drug concentration difference between both sides of the barrier. The ease of drug diffusion across the barrier is determined by the permeability of the barrier to the drug to cross. This permeability depends on both the intrinsic permeability of the barrier (see “The barriers of the brain” in “Brain-specific properties”) and the molecular characteristics (such as size, shape an charge) of the drug (see “Drug-specific properties”). A drug may diffuse directly through the cells of the barrier (transcellular diffusion) or through the space between the cells (paracellular diffusion). At the BBB, paracellular diffusion is the main route of transport for hydrophilic molecules, that cannot cross the cells. In the healthy brain, paracellular transport is restricted by the presence of the tight junctions in the intercellular space between the BBB endothelial cells. In in vitro experiments, unstirred water layers may form at both the apical (blood-facing) and abluminal (brain-facing) side of the BBB and affect passive transport and thus influence the results [54]. Their presence results in an increased permeability for hydrophilic drugs and a decreased permeability for lipophilic drugs [55, 56].
Facilitated transport, in which the movement across the barrier down a concentration gradient is aided by transport proteins. The availability of these helper molecules is limited and saturation of helper molecules may occur at sufficiently high drug concentrations.
Vesicular transport, in which molecules move through vesicles that are formed within the barrier. The extent of vesicular transport is much higher on the BCSFB than on the BBB [57, 58]. Three known types of vesicular transport exist: fluid-phase endocytosis, adsorptive endocytosis and receptor-mediated endocytosis. Fluid-phase endocytosis, or pinocytosis, is the energy-dependent uptake of ECF by vesicles, taking along any solutes residing in the fluid. In adsorptive endocytosis, positively charged molecules are non-specifically taken up by negatively vesicles based on electrostatic interactions [59, 60]. In receptor-mediated endocytosis, vesicles form after binding of molecules to specific receptors that are then transported across the barrier [61].
Active transport, in which drugs are actively transported into or out of the brain by drug-specific transporters. Active transporters in the brain are membrane-bound transporters that move endogeneous compounds or exogeneous compounds (like drugs) across the brain barriers. In contrast to facilitated transport, this uses up energy and compounds can be transported against the concentration gradient. The affinity of a drug to an active transporter depends on the molecular characteristics of the drug, such as its polarity and molecular surface. Active transport is directional and can be classified into influx transport and efflux transport. Influx transporters help compounds enter the brain, while efflux transporters move compounds out of the brain. Several active transporters are involved in the movement of drugs across the BBB. These include the organic anion-transporting poly-peptide 1A2 (OATP1A2), organic anion transporter 3 (OAT3), monocarboxylate transporter 1 (MCT-1), P-glycoprotein (P-gp), breast-cancer-resistance protein (BCRP) and multidrug-resistance-associated proteins 1-9 (MRP-1-9) [62, 63]. At the BBB, most efflux transporters are located at the apical (blood-facing) membrane of the BBB [64], see Fig. 7. At the BCSFB, BCRP and P-gp are located at the apical (CSF-facing) membrane, while MRP is located at the basolateral (blood-facing) membrane (Fig. 7).
Drug transport into the brain can be affected by metabolic enzymes located at the brain barriers, including the cytochrome P450 haemoproteins and uridine 5′-diphospho (UDP)-glucuronosyltransferases [65]. Metabolic enzymes transform active drugs into inactive substances or facilitate their excretion out of the body. As such, they decrease the concentration of active drugs entering the brain. Alternatively, metabolism at the BBB can be beneficial to the drug in case inactive compounds (“pro-drugs”) are converted into active drugs (see [66] for a review on this topic).
Fig. 6.

Modes of drug transport across the brain barriers. In the figure, the BBB is shown, but the modes of drug transport also apply to the other barriers. In simple passive transport, drugs cross the BBB (or the other brain barriers) passively through the cells (transcellular) or between the cells (paracellular) by diffusion. In facilitated transport, drug diffusion across the BBB is aided by helper molecules. In vesicular transport, drugs move across the BBB through vesicles that are formed within the barrier. In active transport, drugs are actively transported into the brain by specific influx transporters or out of the brain by efflux transporters. TJ tight junction
Fig. 7.

The localization of transporters in the BBB and BCSFB [63]. The BCSFB (top) and BBB (bottom) are shown. Active transporters are located at both sides of the BCSFB, but mostly at the apical (blood-facing) membrane of the BBB. This image by [63] is licensed under CC BY 3.0
Drug transport within the brain fluids
The brain fluids are essential for the distribution of a drug within the brain. Drugs are transported to their targets by diffusion and bulk flow within the brain ECF [26, 27] and the CSF [67].
Diffusion within the brain ECF
Diffusion of a drug within the brain ECF is hindered by many obstacles and therefore the brain ECF can be considered as a porous medium [68]. In other words, diffusion within the brain ECF is hindered by the brain cells that determine the geometry and width of the brain ECF [69]. The intercellular space occupied by the brain ECF is only tens of nanometres wide, which is much narrower than the diameter of the surrounding brain capillaries. The effective diffusion of a drug within the brain ECF can be further reduced by dead-space microdomains. Dead-space microdomains are void spaces within the brain ECF in which molecules can be temporarily trapped. So far dead-space microdomains have been found in the diseased, but not in the healthy rat brain [70, 71]. In addition to the mentioned geometrical factors that determine the shape of the brain extracellular space, the brain ECF contains various binding sites that reduce drug transport. The binding of a drug to proteins of the extracellular matrix, negatively charged molecules or other molecules within the brain ECF prevent diffusion of (free) drug. Due to all mentioned factors, the effective diffusion of a drug in the brain ECF is much lower than the free diffusion of the same drug in water.
Brain ECF bulk flow
The impact of the brain ECF bulk flow on drug distribution within the brain is disputable (see also “Fluid movements within the brain” in “Brain-specific properties”). Some research groups state that the rate of the brain ECF bulk flow is negligible compared to the rate of diffusion, especially on a short distance [69, 72, 73]. However, there is evidence that the brain ECF bulk flow may be a relevant means of drug distribution within the brain [27, 74, 75]. The brain ECF bulk flow is likely most important for drugs with a high molecular weight, for which diffusion in the brain ECF is hindered [38, 76, 77]. The Péclet number is an useful measure to assess the relative importance of drug transport by the brain ECF bulk flow in comparison to drug transport by diffusion [33, 38]. A Péclet number 1 indicates that diffusion dominates, while a higher number indicates that the brain ECF bulk flow is also important. Within the brain ECF, the Péclet numbers range between and which indicates that diffusion dominates [38] (see also “Fluid movements within the brain”).
Drug transport within the CSF
Within the CSF, drug is transported via the CSF bulk flow and diffusion. The CSF bulk flow (see “Fluid movements within the brain”) leads to the rapid removal of drug into the blood. The regular renewal, or turnover, of the CSF may reduce drug concentrations within the CSF [78]. Diffusion mediates the entry of a drug from the CSF into the brain tissue [67]. As the rate of diffusion of drug from the CSF into the brain tissue is much slower than the rate of the CSF bulk flow, the transport of drugs from the CSF into the brain tissue is minimal [67].
Drug extra/intracellular exchange
Within the brain tissue, a drug may have a preference for the space inside or outside the cells (intracellular or extracellular space), depending on its properties (see “Drug-specific properties”) [79]. Intra-extracellular exchange is relevant for the distribution and subsequent exposure of a drug to its target site [51]. Drugs distribute between the cells and the extracellular space by simple diffusion, but active transport is also possible [80, 81]. Generally, compounds that easily cross the BBB by passive diffusion (i.e. transcellular diffusion) also cross cellular membranes easily. However, a drug may be actively transported across the BBB but not across the membrane of the cells within the brain, depending on the presence of active transporters. Within the cells, the pH varies greatly between organelles. This may affect drug distribution. In particular, lysosomes (cellular organelles playing a key role in cellular metabolism) may be a site of accumulation for lipophilic and uncharged drugs. Because of the acidic environment within the lysosomes and the pKa of the drugs (see “Drug-specific properties that depend on the environment”), the drugs get positively charged, which makes them more hydrophilic and limits their diffusion back into the brain cells and the brain ECF [82, 83]
Drug binding
Drug binding can be classified into specific binding, in which a drug binds to a specific binding site (target), and non-specific binding, when a drug binds to components of the brain (Fig. 8). A target site can be a receptor, enzyme, transport protein or ion channel. Based on their location, drug targets may be classified as extracellular or intracellular, where they may be located within the cytoplasm or the nucleus of a cell. The effect of a drug is directly proportional to the amount of drug bound to its target [84] and a drug only induces its effect during the period it is bound to its target [85, 86]. The interaction of a drug with a non-specific binding site does not result in a (desired) effect. Mostly, non-specific binding involves the interaction of a drug with proteins or other components of the brain that the drug is not intended to bind to. Due to their diverse nature, non-specific binding sites are generally more abundant than targets.
Fig. 8.
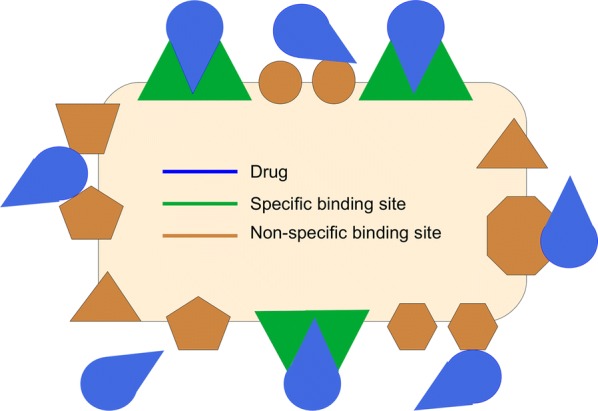
Specific versus non-specific binding. Specific binding involves the (strong) binding of the drug (blue) to the target its intended to bind to (green). Non-specific binding of a drug (blue) to components of the brain (brown) is weaker. However, due to their diverse nature, more non-specific binding sites are present
However, drug binding to non-specific binding sites is generally weaker than drug binding to its target. Upon binding, the drug and its binding site form a complex until the drug dissociates to release the drug and the binding site. Drug binding kinetics describe the concentrations of free and bound drug, based on the time a drug interacts with its binding site. This time is known as the drug residence time. The drug residence time is determined by the rates of association and dissociation of a drug to and from its binding site. These, together with the concentration of free drug and the free binding sites, determine the concentrations of free and bound drug (see [87] for a review on this topic). The drug dissociation rate has been thought of as the main determinant of drug-target interaction [87]. However, a recent study shows that the drug association rate can be equally important to determine the duration of drug-target interactions [88].
Drug metabolism
Metabolic enzymes (see “Brain-specific properties”) convert active drug to inactive drug. Alternatively, they may transform inactive drug into its active form. Either way, the enzymes affect the concentration of active drug. At the level of the BBB and the BCSFB as well as in the ependymal cells (the cells between the brain ECF and the CSF in the brain ventricles, see Fig. 1b), metabolic enzymes may degrade or inactivate drug and thereby limit the transport of active drug across the BBB [45, 65, 89–91]. Within the brain tissue, cytochrome P450 enzymes may be located near drug targets. This may significantly decrease the concentration of active drug and thereby affect drug-target interactions and drug response [46, 92, 93]. The cytochrome P450 metabolic activity on a drug can be affected by competing compounds (compounds that also interact with cytochrome P450), such that co-administration with other drugs or ingestion of certain foods may alter the presence of active drug.
Factors that may lead to spatial differences in concentration-time profiles of drugs in the brain
Brains are not homogeneous in structure and properties. Therefore, the concentration of a drug within the brain is likely to differ over space. The spatial distribution of a drug is affected by all processes discussed in the previous subsections. Local variations in these processes give rise to local variations in drug distribution. A quantitative understanding is needed on how the various factors of variability affect local drug distribution. Below, we summarise common sources of spatial variability affecting local drug concentration-time profiles within the brain.
The brain capillary bed, capillary density and cerebral blood flow
Under normal conditions, the density of the brain capillaries varies within the brain and depends on the local energy needs within the brain [94]. The brain capillary density is higher in grey matter than in white matter due to increased energy demands in grey matter [94–96]. The brain capillary blood flow is also responsive to local brain activity. During stimulation of a functionally active brain area, the corresponding brain arterioles dilate and the blood flow increases in the brain capillaries supplying the area [97, 98]. Both the brain capillary density and the brain capillary blood flow are sensitive to physiological and pathological conditions. Tumours may sprout new blood vessels [99, 100] or may locally reduce blood flow in order to obtain nutrients [100, 101]. Moreover, the brain capillaries may dilate as a response to ischemia (deficiency in blood supply) to increase the influx of oxygen [17, 102–104], while hypertension (high blood pressure) may decrease the number of capillaries [105].
Dynamic regulation of BBB functionality
The BBB functionality is responsive to environmental changes. In certain disease conditions, when the BBB is affected, the width of the space between the brain endothelial cells increases due to disruption of the tight junctions. This allows for an increase in paracellular transport, in particular that of larger molecules which normally cannot pass through the intercellular space [8]. This disruption may be local in case of a local disease, such as a local brain tumour. Disruptions of the BBB have most impact on drugs that normally have difficulty crossing the BBB.
Diffusion and brain ECF bulk flow
Diffusion in the brain ECF differs between the grey matter and the white matter. In the presence of the neural fiber tracts of the white matter, diffusion is anisotropic (i.e. has a different value when measured in different directions) and depends on the arrangement of the fiber tracts [106]. Hence, while the diffusivity of a compound in the brain ECF of grey matter can be described by one single value, the diffusivity of a compound in the brain ECF of white matter should be described by a tensor containing the diffusivities in all directions [106]. The brain ECF bulk flow can be locally increased, for example as a result of oedema [107]. Oedema is the excessive accumulation of fluid in the intracellular or extracellular space of the brain. It is a common symptom of many brain diseases and may be caused by breakdown of the BBB (see “Dynamic regulation of BBB functionality” above), local brain tumours, and altered metabolism.
Intra-/extracellular exchange
The cellular parts that make up the brain tissue differ between the white matter and the grey matter (see also “The brain tissue and the CSF” in “Brain-specific properties”). While the white matter contains few cell bodies and many axons, the grey matter contains many cell bodies and few axons. The white matter consists of the myelinated axons of neurons, glial cells, and brain capillaries. In contrast, the neuronal cell bodies and dendrites make up most of the grey matter in the superficial part of the brain. Not only cell types, but also cell densities have been found to differ per brain region in monkeys [108]. Finally, the concentration of binding sites can differ per cell and cell type, depending on the drug and the target it is aiming for.
Binding
The location of drug targets is crucial, as a drug needs to be able to distribute to this site in order to be effective. In case of local disease, the drug target area, such as a brain tumour, commonly has different physiological properties than the rest of the brain. This affects the drug distribution to its target.
Brain metabolism
The expression of metabolic enzymes may differ locally. A recent study has demonstrated that the spatial distribution of two brain metabolic enzymes, glutamine synthetase and glycogen phosphorylase, is not homogeneous in honeybee brains and differs between as well as within regions [109].
Existing models on the local distribution of drugs in the brain
Understanding how a drug distributes into and within the brain is crucial to accurately predict the effect of a drug that targets the brain. However, much is still unknown about drug distribution within the brain. Mathematical modelling can provide information that is otherwise hard or impossible to obtain by experiments only. Thereby, models help to gain insight into the mechanisms under study. In the next subsections, existing models on (processes related to) drug distribution in the brain are reviewed. In the first two subsections, models on drug transport through the brain capillary system (“Modelling drug transport through the brain capillary system”) and across the BBB (“Modelling drug transport across the BBB”) are described. The next four subsections describe models on the drug distribution within and elimination out of the brain, including drug distribution within the brain ECF (“Modelling drug transport within the brain ECF”), intra-extracellular exchange (“Modelling intra-extracellular exchange”), drug binding kinetics (“Modelling drug binding kinetics”) and drug metabolism (“Modelling drug metabolism in the brain”). Ranges of values and units for the parameters that are relevant for each process are given for rat and human in the Appendix. Models on the exchange between several compartments representing parts of the brain or states of the drug are covered in “Modelling drug exchange between compartments”. A summary is given in Table 2. Finally, in “Integration of model properties”, an overview is given on the current state of the art of models on drug distribution within the brain that integrate mathematical descriptions of drug distribution within the brain. Of this, a summary is given in Table 3.
Table 2.
Examples in which combinations of compartments are used
| Model | Blood | Brain ECF | Brain ICF | Brain tissue | CSF | Periphery |
|---|---|---|---|---|---|---|
| Collins [212] | 1 | – | – | 1 | 1 | – |
| Stevens [136] | 1 | – | – | 1 | – | 1 |
| Jung [210] | 4 | – | – | 1 | 1 | – |
| Linninger [211] | 14 | – | – | 1 | 5 | – |
| Gaohua [145] | 1 | – | – | 1 | 2 | 10+ |
| Westerhout [137] | 1 | 0.5a | 0.5a | 1 | 4 | 1 |
| Nhan [126] | 1 | 1 | 1 | – | b | – |
| Ehlers [106] | 1 | 1 | – | c | – | – |
| Westerhout [138] | 1 | 1 | – | – | 2 | 2 |
| Westerhout [139] | 1 | 1 | – | – | 4 | 2 |
| Kielbasa [140] | 1 | 1 | 1 | – | 1 | – |
| Ball [142] | 1 | 1 | 1 | – | 1 | 8 |
| Yamamoto [141] | 1 | 1 | 1 | – | 4 | 2 |
| Yamamoto [143] | 2 | 1 | 2 | – | 4 | 2 |
A wide range of compartmental models exists and therefore we limit ourselves to descriptions of the examples we have mentioned in the text. Compartments include the blood, the brain ECF, the brain ICF, the brain tissue, the CSF and the periphery. The brain tissue represents the brain ECF and the brain ICF together. The periphery refers to components related to other organs than the brain. Numbers indicate the amount of compartments that are used for each component. For example, in the model of Yamamoto [143] (see Fig. 14), two compartments are used for the blood to describe both the blood in the microvasculature (the brain capillaries) and in the larger vessels, while four compartments are used for the CSF to describe the several regions where the CSF resides. Stripes (–) indicate that the component is not described
aThe brain ECF and brain ICF are modelled as one compartment (the brain tissue)
bThe CSF clearance is included as a loss term in the description of the brain ECF compartment.
cThe brain ECF is taken together with the brain extravascular space in one compartment
Table 3.
Characteristics of models on drug distribution within the brain
| Process | Blood flow | BBB transport | Transport within the brain ECF | Cellular exchange | Binding kinetics | Metabolism | ||
|---|---|---|---|---|---|---|---|---|
| Sections: | “Modelling drug transport through the brain capillary system” | “Modelling drug transport across the BBB” | “Modelling drug transport within the brain ECF” | “Modelling intra-extracellular exchange” | “Modelling drug binding kinetics” | “Modelling drug metabolism in the brain” | ||
| Model | Diffusion | Bulk flow | Specific | Non-specific | ||||
| Brain vasculatue | ||||||||
| [125] | + | * | − | − | − | − | − | * |
| [116] | + | + | + | − | − | − | − | − |
| [121] | + | + | + | − | − | − | − | * |
| Brain ECF | ||||||||
| [133] | + | + | + | − | − | − | − | − |
| [154] | + | + | + | − | + | − | − | + |
| [129] | − | * | + | + | + | * | * | * |
| [71, 150, 150, 156, 182, 182, 184] | − | − | + | − | − | − | − | − |
| [33, 164] | − | − | + | + | − | − | − | − |
| [192] | − | − | + | + | − | − | − | * |
| [127] | − | − | + | + | + | * | * | − |
| [107] | − | * | − | + | + | * | − | * |
| [128] | − | * | + | − | − | − | − | − |
| [135, 152] | − | * | + | − | * | − | − | * |
| [153] | − | * | + | − | + | * | * | * |
| [130, 131] | − | * | + | + | − | * | * | * |
| [134] | − | + | + | − | − | − | * | * |
| Compartmental | ||||||||
| [142] | + | + | − | − | + | − | * | − |
| [145] | + | + | − | − | − | − | * | * |
| [136, 137, 139] | − | + | − | − | − | − | − | − |
| [141] | − | + | − | − | + | − | − | − |
| [140, 143] | − | + | − | − | + | − | * | − |
| Hybrid | ||||||||
| [111] | + | + | + | + | + | − | − | + |
| [212] | − | − | − | − | − | − | − | − |
| [106] | − | − | + | + | − | − | − | − |
| [132] | − | * | + | + | * | * | * | * |
| [54] | − | + | − | + | + | − | * | − |
| [126] | − | + | + | + | + | − | * | − |
Models are categorised based on their inclusion of processes affecting drug distribution within the brain as discussed in this section. In simple compartmental models, discussed in “Modelling drug exchange between compartments”, transport within compartments (such as the brain ECF) is not described, but multiple of the other processes may be covered. Models on drug distribution within the brain are classified into models on transport to the brain from the brain vasculature, transport within the brain ECF (i.e. models that include spatial transport within the brain ECF), simple compartmental models (i.e. models that include drug exchange between several compartments representing components of or related to the brain tissue but do not include spatial distribution within the compartments) and hybrid models (i.e. models that are a combination of multiple classes)
+The process is covered
−The process is not covered
* The process is covered, but by an elimination rate constant rather than by a complete description of the process
Modelling drug transport through the brain capillary system
We only mention models that specifically focus on drug transport into the brain and thereby on drug delivery by the brain capillary network. The distribution of compounds from the capillaries into a tissue, such as the brain, can be represented by a Krogh cylinder. A Krogh cylinder represents the tissue as a cylinder with a single capillary at its centre [110]. The model is well established and has been extensively used to describe the supply of oxygen and other molecules to a wide range of tissues, including the brain [111]. An example of a Krogh cylinder is given in Fig. 9, where a brain capillary is surrounded by layers of brain tissue [111]. There, the brain is represented by four subunits, denoted by Sj(1 j 4). Drug diffusion fluxes occur between the brain capillary and the brain tissue, denoted by 0, and between the brain tissue subunits, denoted by j(1 j 4). The Krogh cylinder can be used to determine the effect of the brain capillary blood flow on simple passive drug transport across the BBB. The rate constant of passive drug transport into the brain, kin, can be related to rate of the brain capillary blood flow, Q, and the fraction of compound extracted into the brain, E, by the Renkin–Crone equation [112, 113]:
| 1 |
with Vbrain (L) the volume of the brain, E the compound extraction ratio, PS (m s−1 m2) the BBB permeability surface area product, Cin (mol L−1) the concentration of drug entering the brain capillary and Cout (mol L−1) the concentration of drug leaving the brain capillary. From Eq. (1), it follows that for a drug that readily crosses the BBB (PS is high), drug extraction from the blood plasma into the brain ECF is limited by the brain capillary blood flow rate. If a drug has difficulties crossing the BBB, (PS is low), drug extraction from the blood plasma into the brain ECF is limited by the permeability of the BBB.
Fig. 9.

Circular representation of the Krogh cylinder. A brain capillary (red point in the middle) is surrounded by four layers of brain tissue, represented by subunits Sj() (blue). Here 0 describes the exchange rate through the BBB and j() describes the drug diffusion flux between the brain tissue subunits.
Adapted with permission from [111]
The Krogh cylinder is limited to a single segment and does not take diffusion along the barrier into account. It drives on the assumption that PS is a physiological constant, while in fact, it is not identical to the physiological permeability as it highly depends on brain capillary blood flow rate and radius [114]. Recently, large-scale anatomical models of brain vascular networks have been developed. There, entire brain vascular networks are constructed based on segmentation of medical images [115–119] or geometric construction [120–124]. These networks consist of a multitude of blood vessel segments connected by nodes, where parameters defining the network (such as blood vessel radius, volume and length) are based on images, experimental data or random distribution. These brain vascular networks can be applied to drug delivery [116, 125]. In a model on drug delivery to brain tumours, an image-based brain capillary network is coupled to a cubic mesh representation of the brain tissue [116]. There, a system of differential equations describes drug transport within the blood vessels, (passive) drug transport to the tissue and drug diffusion and decay within the tissue. A recent mathematical model describes the drug delivery to the brain by the brain capillaries and subsequent active transport across the BBB [125] (Fig. 10, left). In the network, each brain capillary supplies its own volume of brain tissue. The authors do not consider passive transport across the BBB. In this model, a network of brain capillaries is described with a constant topology of cubic lattices. The total network of cubic lattices represents a piece of brain tissue with a volume of 1 cm3. The volumes of the brain tissue lattices in the network are identical and spatial differences within the brain are not considered. A constant concentration of drug enters the network at the left surface (x = 0). The overall blood flow is directed from the left to the right side of the network (from x = 0 to x = 1), see Fig. 10 (right).
Fig. 10.

Model on drug transport within the brain capillaries, active drug transport across the BBB and subsequent metabolism [125]. Spatial differences within the brain are, however, not considered. Left: a simplified model for active drug transport within the capillaries, across the BBB and subsequent metabolism [125]. The black circles represent the drug. Right: a schematic depiction of the lattice refinement process [125]. A cubic lattice (blue) represents a piece of brain tissue with a volume of 1 cm3. The cubic lattice can be replaced by a network of smaller cubic lattices (red). The larger blue unit and the multiple smaller units fill out the same computational volume. The arrow indicates the direction of the blood flow through the large unit. Both images by [125] are licensed under CC BY 4.0
While the rate of drug transport across the BBB is affected by the BBB permeability and the rate of brain capillary blood flow, the amount of drug that crosses the BBB is affected by drug binding to blood plasma proteins. Drug binding to blood plasma proteins reduces the concentration of unbound drug that is able to cross the brain. However, only few modelling studies take drug binding to blood plasma proteins into account. In one example, the high affinity of a chemotherapy drug, Doxorubicin, for blood plasma proteins is described by partitioning the concentration of drug into free and plasma protein-bound drug [126].
Modelling drug transport across the BBB
Most drugs enter the brain from the blood and therefore have to cross the BBB. Therefore, it is important to include the BBB in models on drug distribution within the brain. Passive and active transport across the BBB require different modelling approaches. These are described below.
Passive BBB transport
Drug transport across the BBB is often described as a loss of compound from the brain ECF, i.e. the unidirectional and irreversible transport of drug from the brain ECF to the blood plasma [107, 127–132]. However, passive transport across the BBB is bidirectional: drug is transported from the blood to the brain ECF and from the brain ECF to the blood. Below, several methods of quantification of passive BBB transport are discussed. The passive flux of drug across the BBB between the blood plasma and the brain ECF, , is bidirectional and perpendicular to the BBB. It depends on the BBB permeability and on the drug concentration difference between the blood plasma and the brain ECF. It can be defined as follows [111, 126, 133]:
| 2 |
with pas (mol m−2 s−1) the bidirectional passive flow rate of drug per unit area of the BBB, P (m s−1) the permeability of the BBB to the drug, Cpl (mol m−3) the concentration of drug in the blood plasma and CECF (mol m−3) the concentration of drug in the brain ECF. The change in drug concentration in the brain ECF as a consequence of bidirectional, simple passive drug transport across the BBB can be described using a rate constant [129, 132, 134–136] or transfer clearance parameter [137–142]:
| 3 |
where kBBB (s−1) is the rate constant of drug transport across the BBB, CLBBB (m3 s−1) is the transfer clearance of drug transport across the BBB, AECF (mol) is the molar amount of drug in the brain ECF and VECF (m3) is the volume of the brain ECF. In some studies the amount of drug in the brain tissue (including the brain ECF and the brain ICF) is modelled rather than the amount of drug in the brain ECF, i.e. Abrain is used rather than AECF [134, 136]. The passive flux of drug across the BBB, defined by Eq. (2), is the sum of the passive flux due to transcellular transport and the passive flux due to passive paracellular transport. Therefore, the passive permeability, P, can be given by [143]
| 4 |
where Ptrans (m s−1) is the passive transcellular permeability, Dpara(m2 s−1) is the diffusivity of a drug through the BBB intercellular space and WTJ (m) is the width of the tight junction. Equation (4) is based on the assumption that the width of the tight junction equals the distance travelled by the diffusing drug through the BBB intercellular space. However, electron microscopy shows that the BBB tight junctions have a tortuous shape [144] and therefore WTJ likely underestimates the actual distance travelled by the diffusing drug. Paracellular diffusion only occurs at of the total surface area of the BBB [143]. Therefore, correction factors (BBB surface area fractions) need to be used that take into account the relative contributions of passive paracellular and passive transcellular transport [143]. Transport through unstirred water layers on both sides of the BBB is included in a recent model that extensively describes compound transport across both the apical (blood-facing) and abluminal membranes (brain-facing) of the cells of the BBB [54]. On both sides of the membrane, the effects of passive transcellular permeability, paracellular transport, active permeability and unstirred waterlayers on compound concentrations within the BBB, brain ECF and unstirred water layers are described (Fig. 11).
Fig. 11.
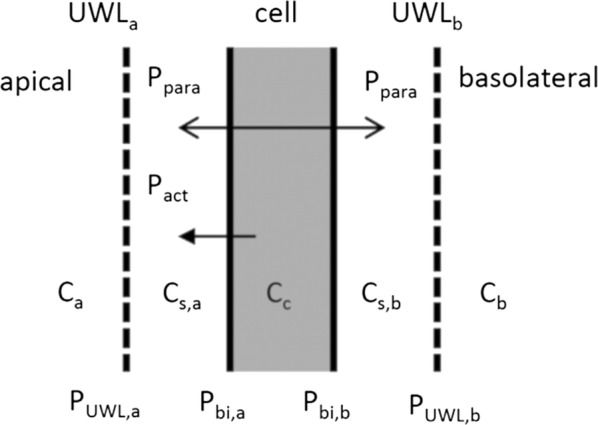
Schematic representation of the model by Trapa [54] discussed in the text. In the model, used to extract active permeability from in vitro transwell permeability experiments, passive (Ppas) and active (Pact) permeability, paracellular (Ppara) transport, and the effects of unstirred water layers (UWLs) are considered on both the apical and basolateral sides of the membrane.
Adapted with permission from [54]
Active BBB transport
Active transport involves the movement of a molecule from one side to the other side of the membrane against the concentration gradient and therefore, it requires energy. Active transport is unidirectional and mediated by active transport proteins and requires other descriptions than those for passive transport. Below, several methods of quantification of active BBB transport are discussed. In its most simple form, the total flux (tot) across the BBB by both passive and active transport is described in the same manner as the passive permeability (Eq. (2)), thereby ignoring the unidirectionality of active transport and saturation of active transport proteins:
| 5 |
where Ptot (s−1) is the rate of total (passive + active) transport) across the BBB, AFin is the affinity of a drug to active transport into the brain [141] and AFout is the affinity of a drug to active transport out of the brain [141].
The total permeability, Ptot, is often described as the product of the passive BBB permeability P multiplied by the blood–brain partition coefficient [1, 138, 139, 141, 142, 145]. Alternatively, active transport of drug out of the BBB can be described by an active permeability, Pact [54]. This active permeability, Pact can be specific for particular transporters, such that Pact equals the sum of active BBB transport by individual transporters, including PP-gp and PBCRP for P-gp and BCRP (see “Drug transport across the brain barriers”) [54]. The descriptions of the total flux, tot, in Eq. (5) are not valid in the presence of paracellular transport, because in that case the compound circumvents the cells and does not interact with active transporters on the cells [54]. Then, Eq. (2) should be used. Active transport is commonly assumed to work according to Michaelis-Menten kinetics, which are originally used to describe enzyme conversion. In this way, the active clearance, CLact, of drug across the BBB into or out of the brain is modelled as follows [1, 127, 138, 139, 146, 147]:
| 6 |
with Tm () the maximum rate of drug transport across the BBB (negative for outward transport), Km () the concentration of free drug at which half of Tm is reached and C () the concentration of drug in the blood plasma, Cpl (in case of active inward transport) or in the brain ECF, CECF (in case of active outward transport).
Modelling drug transport within the brain ECF
On a microscopic scale, diffusion of a compound can be described by a random walk of the molecules and on a macroscopic scale this translates to the diffusion equation [148]. This equation describes the distribution of a compound through a medium, such as the brain ECF:
| 7 |
with D the diffusion coefficient () and C the concentration of the compound in the medium ().
Within the brain ECF, diffusion of molecules is reduced by the hindrance of obstacles, including cells (see “Drug transport within the brain fluids” in “Processes affecting drug distribution within the brain”). To take the complexity of the brain ECF into account, the diffusion equation should be modified by including the tortuosity () and brain ECF volume fraction () [16, 149]. Here, describes the hindrance posed on diffusion by a geometrically complex medium, such as the brain ECF, in comparison to a medium without obstacles, such as water [150]. The parameter is the ratio of the volume of the brain extracellular space to the volume of the total brain tissue. As indicated before, the distribution of a drug within the brain is also affected by exchange with the brain capillaries (see “Modelling drug transport through the brain capillary system” and “Modelling drug transport across the BBB”), the brain ECF bulk flow, intra-extracellular exchange (see “Modelling intra-extracellular exchange”), drug binding (see “Modelling drug binding kinetics”) and drug metabolism (see “Modelling drug metabolism in the brain”). Charles Nicholson has done a considerable amount of work to accurately describe the distribution of a drug within the brain ECF and the processes that affect it. One of the main results of his work is a modified diffusion equation that describes the distribution of a drug within the brain ECF [151]. There, he assumes that the drug is administered directly to the brain. The entry of a compound from the blood across the BBB into the brain ECF is not taken into account. The modified diffusion equation is widely used to investigate drug distribution within the brain ECF [127, 128, 152, 153]. and is as follows:
| 8 |
with C the concentration of drug within the brain ECF, and , with .
The first term describes the diffusion of a compound with an effective diffusion coefficient D* (m2 s−1). This is the normal diffusion coefficient (D) corrected by the tortuosity, , describing the hindrance by cells imposed on diffusion of the compound within the brain ECF (see “Drug transport within the brain fluids”). The second term is a source term, where Q (mol L−1 s−1) describes the local release of substances within the tissue, e.g. by injection or infusion. The factor corrects for the fact that drug is released into the brain tissue but distributes only within the brain ECF. The third term describes the transport of a compound by brain ECF bulk flow, where v (m s−1), is the bulk flow velocity of the brain ECF. The fourth term includes k′, which is a first order elimination rate constant that describes the permanent loss of a compound into the cells or into the blood. Finally, f(C) (mol L−1 s−1) describes the binding of molecules to the extracellular matrix, specific receptors or transporters. This term, however, does not include drug binding kinetics and does not distinguish between specific and non-specific binding. Again, the factor corrects for the fact that drug resides in the brain ECF only.
Modelling cells in the modified diffusion equation
Cells are the major hindrance to movement by diffusion within the brain ECF. However, by default the modified diffusion equation (8) only implicitly includes cells by taking their hindrance into account by the tortuosity. In other models on drug distribution within the brain, brain cells are commonly represented as one compartment. There, drug can be exchanged between the cellular compartment and the extracellular compartment [106, 126, 132, 140, 154, 155] (see “Modelling drug exchange between compartments”). However, both the tortuosity and the compartmental representation of cells are simplifications of a more complex geometry. To more realistically represent transport within the brain ECF, other models explicitly describe cells and their shape [33, 71, 131, 150, 156]. In a recent study on solute transport within the brain ECF, the cells in the brain ECF are modelled as Voronoi cells (cells of which the boundaries are determined by the distance between the cell center and the center of other cells) to represent the heterogeneity of brain cells [33]. Moreover, a three-dimensional representation of the brain neuropil (i.e. the brain grey matter) together with its brain ECF allows for a realistic representation of the brain extracellular space and transport within the brain ECF [38, 131, 157]. These studies use ‘sheets and tunnels’ to represent the brain ECF. There, ‘sheets’ represent the small space between two adjacent cells, while ‘tunnels’ represent the space at the junction of three or more cells [38] (Fig. 12).
Fig. 12.
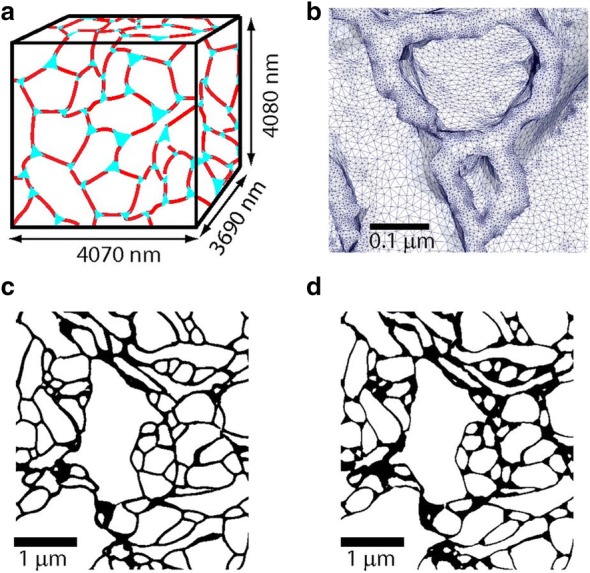
Model systems and microscopic structure of the brain extracellular space as formulated in [38]. a Schematic representation of the reconstruction of the brain extracellular space generated by electron microscopy. Sheets (the spaces between two adjacent cells) are in red, while tunnels (the spaces at the junctions of three or more cells) are in cyan. b Close-up of the electron microscopy reconstruction showing typical sizes of the 84 million tetrahedrons used in the simulation. c, d Electron microscopy reconstruction of the brain extracellular space by Kinney et al. [157] with a small tunnel volume fraction (c) and with a larger tunnel volume fraction (d).
Adapted with permission from [38]
Determining the parameters
The values of parameters in the modified diffusion equation, such as (tortuosity) and (brain ECF volume fraction), can be obtained by experimental techniques, computational simulations and theoretical calculations. Experimental techniques include dual-probe microdialysis, integrative optical imaging, real-time iontophoresis, tracer-based magnetic-resonance imaging (MRI) and diffusion tensor imaging. The characteristics of the experimental techniques are summarised in Table 1. All of the techniques except diffusion tensor imaging are invasive and therefore usually performed in the rat. Diffusion tensor imaging is non-invasive and provides information about diffusion within the human brain. The techniques provide information on drug transport within the brain ECF, such as the geometry of the brain extracellular space and local drug concentrations at different points in space. From this, parameter values related to diffusion, including , and the diffusion tensor (measuring the diffusivity in several directions) can be calculated. Computational methods are used to estimate values of coefficients for the modified diffusion equation. When experimental data do not suffice, the remaining parameters can be estimated based on a fit with experimental data. This is often done in pharmacokinetic models (see “Modelling drug exchange between compartments”. In addition, more rigorous methods exist for determining parameter values of drug transport within the brain, as is explained in [158]. To estimate parameter values without any experimental data, Monte Carlo simulations are commonly used. These are predictive simulations in which molecules perform a random walk in a pre-set geometry of the brain extracellular space to mimic molecular diffusion [69, 150, 159, 160]. These simulations then give information on how the geometry of the brain extracellular space (see “Drug transport within the brain fluids”) affects diffusion of a drug within the brain ECF. Theoretical calculations can be used to calculate diffusion in the brain ECF and the brain ECF bulk flow velocity. Diffusion in the brain ECF compared to diffusion in a cell-free medium is quantified by the tortuosity. The tortuosity is calculated based on the effect of the presence and geometrical arrangement of cells on diffusion. This effect is measured either as the increase in distance travelled by the diffusing drug [161–163] or as the increase in time needed for the diffusing drug to travel from point A to point B [71, 150]. The brain ECF bulk flow velocity is commonly determined from the fluid velocity field computed with the Navier-Stokes equations (a set of partial differential equations describing the movement of fluid) [33] or with equations using the pressure of the brain ECF and the hydraulic conductivity (the ease with which a fluid can move through a porous medium like the brain extracellular space) [132, 164].
Table 1.
Experimental techniques to determine parameter values for the diffusion equation
| Technique | Explanation | References |
|---|---|---|
| Dual-probe microdialysis | A probe measures local drug concentration after diffusion from the first (release) probe | [128, 152] |
| Integrative optical imaging | Microscopical imaging of macromolecule attached to fluorescent marker. Uses the hypothesis of restricted diffusiona | [72, 76, 156, 160, 168–174] |
| Real-time iontophoresis | Changes in electrical potential induced by charged ions are recorded | [149, 175] |
| Tracer-based MRIb | Magnetic sensitive contrast agents are attached to water molecules and imaged | [30, 176] |
| Diffusion MRI/diffusion tensor imaging | Non-invasive techniques to study the random movement of molecules and obtain the diffusion tensorc | [130, 131, 166, 177] |
aThis states that with increasing molecule size, diffusion becomes less as the molecules approach the width of the brain extracellular space [178, 179]
bCurrently the only measurement to provide a three-dimensional visualization of the brain ECF bulk flow [30, 176]
cThe diffusion tensor measures the diffusivity in several directions, thereby assessing tissue anisotropy
Model input can also be derived from subject-specific data [130, 131, 165–167]. In a recent study, the brain matter was reconstructed from MRI-images using open source software in order to model protein transport within the brain tissue with a basic reaction-diffusion equation [167].
Applications of the modified diffusion equation
The modified diffusion equation (8) can be adjusted according to the specific purpose of a study. For example, to take bidirectional BBB transport into account, one or two rate constants (s−1) can be included that specifically quantify the concentration-dependent exchange between the blood plasma and the brain ECF in one or two directions [128, 133, 135, 180, 181]. To account for the anisotropic diffusion within the white matter, a diffusion tensor can also be used instead of the effective diffusivity D* [182]. The modified diffusion equation has proven useful in predicting the local distribution profile of a drug after several invasive experimental measurements, such as microdialysis [128, 135, 152, 181, 183–188]. Using the diffusion equation to predict the impact of invasive experimental techniques on the local distribution of a drug helps to evaluate experimental measurements. For instance, predictive studies have suggested that microdialysis increases and thereby may affect the spatial drug distribution profile of a substance [135, 181]. The predictions of diffusion equation may be used to better target local drug delivery. For example, a mathematical model containing the diffusion equation is developed to aid the optimization of treatments by controlled release polymer implants [153]. There, optimization refers to a trade-off between effective drug distribution within the brain and minimization of side effects [153]. Other examples using Eq. (8) include studies on the local distribution of a drug within the rat [153, 180, 189–191], dog [133], pig [192] and human [166, 192, 193] brain around the site of application after direct administration of drug into the brain ECF through polymer implants [153, 189], perfusion [133, 180, 185, 192] or convection-enhanced delivery (the delivery of drug by a pressure gradient directly to the brain ECF, thereby bypassing the BBB) [166, 185, 190–193].
Modelling drug transport within the CSF
Modelling drug transport within the CSF has great similarities to modelling drug transport within the brain ECF. Yet for the sake of completeness, drug transport within the CSF will be shortly discussed below. Drug transport within the CSF is generally described with an advection–diffusion equation [194, 195]:
| 9 |
with C the concentration of drug within the CSF, D the diffusion of drug within the CSF (note that hindrance by the cells imposed on diffusion is not taken into account as there are no cells in the CSF), and v the CSF bulk flow. It is clear that Eq. (9) is very similar to Eq. (8). The equation has been applied to study the effect of drug-specific and system-specific properties on drug distribution within the CSF. In one recent study, the equation is used to predict drug distribution in patient-specific CSF and with these predictions improve CSF drug delivery [196]. In another recent study, a model is proposed to study the transport of a solute within the CSF [195]. There, a solute refers to drug that is dissolved into the CSF. The solute diffusivity is measured by the Schmidt number, that relates the diffusivity of the drug to the viscosity of the drug-carrying fluid. Due to the ‘slender’ morphology of the spine, that has a length much larger than its diameter and width, diffusion is assumed to be uni-directional. In addition, the brain CSF bulk flow is modelled as a time-averaged Lagrangian velocity (see also [197] for more information).
Data on CSF flow, in some cases subject-specific [198–200] can be provided by mathematical models of CSF dynamics [198–202]. The models can be coupled to models on drug distribution within the CSF, e.g. by providing data on the CSF bulk flow velocity.
Modelling intra-extracellular exchange
Modelling drug transport across the membranes of the brain cells is analogous to modelling drug transport across the brain barriers (discussed in “Modelling drug transport across the BBB”). In its simplest form, intra-extracellular exchange is quantified by a rate constant, k’, that describes the linear uptake of drug into cells [compare to the fourth term of Eq. (7)] [129, 203]. This rate constant is usually multiplied by the brain ECF volume fraction, , to account for the space the cells occupy within the brain:
However, like BBB transport (discussed in “Modelling drug transport across the BBB”), transport across the cell membrane is bidirectional and passive transport across the cell membrane is driven by the concentration gradient between the brain ECF and the brain ICF. The passive flux of drug across cell membranes between the brain ECF and the brain ICF is therefore analogous to Eq. (2). Analogous to Eq. (3), the change in drug concentration within the cells of the brain can be described as [126, 135, 140, 141, 143, 204]:
where CICF () is the concentration of drug within the brain ICF, kcell (s−1) is the rate constant of drug transport across the cell membrane, CLcell is (L s−1) the transfer clearance of drug across the cell membrane and VICF(L) is the apparent volume of drug distribution in the brain ICF. Alternatively, the cell membrane permeability surface area product PScell (m3 s−1) can be used instead of CLcell [142]. Active, saturable, transport into or out of the cells is, like active BBB transport (discussed in “Drug transport across the brain barriers”), usually described by Michaelis–Menten kinetics [111, 127, 205] [see also Eq. (6)]:
| 10 |
where CLact-cell is the active transfer clearance of free drug across the cell membrane between the brain ECF and brain ICF, C is the concentration of drug within the brain ECF or within the brain ICF, Tm-cell represents the maximal velocity of the transporter (negative for outward transport) and Km-cell is the Michaelis–Menten constant, which is generally assumed to represent the rate of dissociation of drug from its binding sites on the cellular membrane [203, 205].
Modelling drug binding kinetics
Drug binding within the brain is most commonly modelled by a rate constant, that describes the loss of free compound to binding sites [54, 127, 129–131, 140, 142, 145, 153, 185]. However, the kinetics of drug binding, which include the rates of association and dissociation of a drug to its binding sites are not considered. Also the concentration-time profiles of free and bound drug are not considered. In a recent study on drug distribution within brain tumours after administration by convection-enhanced delivery, the association and dissociation rates of drug interaction with binding sites in the brain ECF and brain ICF of brain tumours and surrounding tissue are described [132] (Fig. 13). There, free drug in the brain extracellular space distributes between the tumour and surrounding normal tissue by diffusion and bulk flow. Both tumour and normal tissue consists of three compartments: the brain extracellular space, the cell membrane and the intracellular space. Only free drug can cross the membrane to exchange between compartments. Within the extracellular and intracellular space drug binds with proteins. However, this study does not distinguish between binding association and dissociation rate constants, nor does it consider the concentration of binding sites and possible saturation thereof [132]. Models describing concentration changes in free drug and free binding sites do exist for other areas of the body than the brain. A recent work on the local delivery of drug to the arterial wall describes concentration changes of free and bound drug in the (non-brain) ECF [206–208]. Notably, also a distinction between drug binding to specific binding sites and non-specific binding sites (see “Drug binding”) is made [208].
Fig. 13.

Schematic representation of a model on drug transport in brain tumour and surrounding normal tissue after treatment with convection-enhanced delivery [132]. Both the tumour and the surrounding normal brain tissue consist of three compartments: the extracellular space, the cell membrane and the intracellular space. F and B represent free and protein-bound drug, respectively. Free drug in the brain extracellular space distributes between the tumour and the surrounding tissue by diffusion and brain ECF bulk flow. Within each region, only free drug is available for transport across the cell membrane to the extracellular and intracellular space.
Adapted with permission from [132]
Modelling drug metabolism in the brain
Drug metabolism within the brain is commonly represented by a loss term, such as an elimination rate constant (s−1) [107, 130, 131, 134, 135, 152, 181, 192] or efflux clearance (L s−1) [145, 155]. Like BBB transport and cellular uptake, enzyme-mediated metabolic clearance of a drug can be more explicitly described using Michaelis–Menten kinetics [111, 153]:
| 11 |
with met () the flux of the enzymatic metabolic reaction, Vmax (mmol L−1) min−1) the maximum flux of this reaction, C (mmol L−1) the concentration of the substrate (i.e. drug within the brain ECF or brain ICF), and Km (mmol L−1) the affinity coefficient of the substrate for the enzyme. Equation (1) could be extended as is done in a recent model on brain cellular metabolism [111]. This model accounts for reactions where phosphorylation, oxidation or reduction occurs [111]. There, the reaction flux met defined in Eq. (10) is multiplied with the factor . In this factor, r is the reaction state (i.e. the percentage of metabolites in the phosphorised or reduced state after phosphorylation or reduction by metabolic enzymes) and v is a dimensionless affinity factor of the molecule to the reaction [111].
Modelling drug exchange between compartments
Compartmental models often include several of the processes discussed in the previous sections. The main aim of compartmental models is to predict the concentration-time profile of a drug in several regions, or ‘compartments’, of the body. Typically, compartmental models are pharmacokinetic models that provide a mathematical representation of the exchange of drug between virtual compartments of the body. A compartment represents a body part or drug state (i.e. bound or unbound) that is well-stirred and behaves as one ‘compartment’. Body parts commonly represented by compartments include the blood, entire tissues (e.g. the brain) and components of a tissue (e.g. the brain ECF, the CSF, the brain cells). Transport to, from and between the compartments is described by mass balance equations, usually ordinary differential equations. In general, two assumptions are made:
In each compartment, the concentration of drug is homogeneous.
The rate of transport between two compartments is proportional to the concentration differences between these compartments and a rate constant (s−1) or volumetric clearance ( s−1).
Pharmacokinetic models can be empirical or physiologically-based. Empirical pharmacokinetics models are “top down”: a model is developed by improving its fit with available experimental data. This improvement of fit can be established by adding additional compartments or parameters or fine-tuning the values of existing parameters. In contrast, physiologically-based pharmacokinetic models are “bottom-up”: the model is developed based on known physiological data, including both system-specific and drug-specific parameters. The distinction between drug-specific and system-specific parameters allows for a more accurate prediction of drug concentration-time profiles in the different compartments. Moreover, differences between species can be modelled more reliably by setting the parameter values to match the physiological values of the species of interest [209]. Hybrid models exist that integrate empirical pharmacokinetic models and physiologically-based pharmacokinetic models into one model. A detailed sketch of such a model is given in Fig. 14, where the coupling of a empirical pharmacokinetic model of the blood plasma to a physiologically-based pharmacokinetics model of the CNS is shown. There, the parameters for the empirical pharmacokinetic model of the blood plasma are estimated, while the parameters for the physiologically-based pharmacokinetic model of the CNS are experimentally measured brain-specific and drug-specific parameters. Different research questions and different drugs require different compartmental models and parameters. In Table 2, we summarise the brain components that are described by compartments in several studies. As a wide range of compartmental models exists, we thereby limit ourselves to the descriptions of examples we mention in this review. Note that the brain ECF and the brain ICF are sometimes taken together as the brain tissue. Depending on the purpose of the study, other components may be added to the model or one component may be described by more than one compartment. For example, the CSF is often described by multiple compartments, since it is widely distributed over the CNS. In [143], the CSF is described by four compartments where each compartment represents another location of the CSF, see Fig. 14. This study also includes lysosomes as an additional compartment to cover the accumulation of basic drugs in lysosomes (see “Drug extra/intracellular exchange”). In other examples, the blood is described by multiple compartments including those describing the arteries, arterioles, brain capillaries, venules, veins and the sinus sagittalis (a venous channel located between the layers of the dura mater that drains blood from the brain back into the blood) [210, 211]. To develop a compartmental model that best fits its purpose, usually, more models are compared and the model that best fits the experimental data, is chosen [137]. Compartmental models may cover multiple processes affecting the drug distribution within the brain by extending the model. The disadvantage of simple compartmental models, however, is that they do not describe drug distribution within the compartments. For that, hybrid models were developed to integrate compartmental exchange with distribution within the brain ECF, as will be discussed below.
Fig. 14.

Example of a full physiologically-based pharmacokinetic drug distribution model of the CNS [143]. In this example model, the parameters for the plasma pharmacokinetic model are estimated (black) as input for the full model, while the parameters for the physiologically-based pharmacokinetic model are system-specific (blue) and drug-specific (green). Peripheral compartment 1 and 2 are used in cases where the plasma pharmacokinetic model requires an adequate description of drug concentration in the blood plasma. Here, brainmv: brain microvascular, CSFLV: CSF in the lateral ventricle, CSFTFV: CSF in the third and fourth ventricle, CSFCM: CSF in the cisterna magna, CSFSAS: CSF in the sub-arachnoid space, QCBF: cerebral blood flow, QtBBB: transcellular diffusion clearance at the BBB, QpBBB: paracellular diffusion clearance at the BBB, QtBCSFB1: transcellular diffusion clearance at the BCSFB, QpBCSFB1: paracellular diffusion clearance at the BCSFB1, QtBCSFB2: transcellular diffusion clearance at the BCSFB2, QpBCSFB2: paracellular diffusion clearance at the BCSFB2, QBCM: passive diffusion clearance at the brain cell membrane, QLYSO: passive diffusion clearance at the membrane of lysosomes, QECF: brain ECF flow, QCSF: CSF flow, AFin1-3: asymmetry factor into the CNS compartments 1-3, AFout1-3: asymmetry factor out from the CNS compartments 1-3, PHF1-7: pH-dependent factor 1-7, BF: binding factor. Image by [143] is licensed under CC BY 4.0
Integration of model properties
The drug distribution within the brain ECF is affected by many processes. In this section, we first described currently existing mathematical models of the different processes affecting drug distribution within the brain. A sketch of the processes of drug distribution discussed in this review is given in Fig. 15 (left). In the previous subsection (“Modelling drug exchange between compartments”) we discussed compartmental models, that provide a simplified representation of drug distribution within the brain in which exchange between compartments but not within compartments is described (Fig. 15, right). Models on drug distribution within the brain ECF (see “Modelling drug transport within the brain ECF”) often include descriptions of other processes affecting drug distribution as have been discussed in this section. In addition, simple compartmental models (that do not include spatial distribution within the compartments, such as the brain ECF) may also cover multiple of the processes affecting drug distribution. Below, we will briefly describe how multiple processes are covered in both classes of models. A summary of this is provided in Table 3. Models on drug distribution within the brain ECF usually describe the BBB with a simple elimination rate constant (see “Modelling drug transport across the BBB”). Only few models take (passive) bidirectional drug transport across a concentration gradient into account [133, 134, 154]. Cellular exchange and metabolism are described with a simple rate constant or using a more extensive description involving saturation of active transporters or metabolic enzymes (see “Modelling intra-extracellular exchange” and “Modelling drug metabolism in the brain”). None of the models on drug transport within the brain ECF includes complete descriptions of drug binding kinetics (see “Modelling drug binding kinetics”). Compartmental models often include passive BBB transport and cellular exchange by describing them as the concentration-dependent, bi-directional transport of drug between the blood and the brain ECF or between the brain ECF and brain ICF compartment, respectively. Some models also include active transport across the BBB [1, 138, 139, 147]. Binding can be described as a distribution of drug between a bound and an unbound compartment (see e.g. [88] and “Modelling drug exchange between compartments”). Metabolism can be quantified by including a rate constant in the model.
Fig. 15.

Mathematical representations of drug distribution within the brain. Left: “schematic presentation of the major compartments of the mammalian brain and routes for drug exchange” [45]. The image shows the processes of drug distribution within the brain covered by mathematical models. Processes include cerebral blood flow and plasma binding (see “Modelling drug transport through the brain capillary system”), BBB transport (see “Modelling drug transport across the BBB”), transport within the brain ECF (see “Modelling drug transport within the brain ECF)” intra-extracellular exchange (see “Modelling intra-extracellular exchange”), binding (see “Modelling drug binding kinetics”) and metabolism (see “Modelling drug metabolism in the brain”). The image by [45] is licensed under CC BY 2.0 and modified for the purpose of this review. Right: simplified representation of drug distribution within the brain by a compartmental model. See Table 2 for references. Drug exchange between compartments but not within compartments is described (see “Modelling drug exchange between compartments”)
Hybrid models
Compartmental models are able to cover most of the properties discussed in the previous sections. However, simple compartmental models lack descriptions of the spatial distribution of a drug within the compartments. Models that include drug transport within the brain ECF and other components of the brain give a more detailed representation of drug distribution within the brain. These models combine models on drug distribution within the brain ECF with compartmental models. Examples of these hybrid models will be described below. Their properties are summarised in Table 3. The model of Collins and Dedrick [212] is one of the earliest models that not only describes drug exchange between the CSF and the brain ECF, but also the drug transport within both brain fluids by diffusion and bulk flow [212]. Moreover, the spatial distribution of the brain capillaries is taken into account, from which the drug enters the brain ECF. Ehlers and Wagner [106] have developed a multi-scale model of the human brain tissue. On the microscale, the brain tissue is compartmentalised into the blood, the solid skeleton (consisting of the brain tissue cells and the vascular walls) and the brain ECF. Also, the authors model the brain ECF fluid transport within the brain ECF by bulk flow and diffusion. On the macroscale, all individual properties are homogenized for a reduced and simper representation of drug distribution within the brain ECF. A recent model on brain metabolism (discussed in “Modelling drug metabolism in the brain”) demonstrates the importance of spatial distribution [111]. The model shows that the distance between the synapse and the brain capillaries significantly affects the time course of metabolic fluxes and concentrations of metabolites. Importantly, it also shows the effect of dimension on the model outcome. While a three-dimensional representation is most realistic, it is computationally intensive and expensive. In contrast, a one-dimensional representation is computationally cheap, but less realistic. A reduced two-dimensional model provides a traid-off between computational cost and realism. A recent model on the transport of chemotherapeutics within a brain tumour and its surroundings after convection-enhanced delivery offers a close to complete description of drug distribution within the brain [132]. It describes drug transport over several regions of the brain as well as drug exchange between multiple compartments representing components of the brain. The model takes into account all key processes of drug distribution, such as diffusion, the brain ECF bulk flow, drug efflux to the brain capillaries, and metabolism. However, the binding kinetics are not described and neither is a distinction made between specific and non-specific binding. In conclusion, the hybrid models all include many important factors affecting drug distribution within the brain. However, none of the studies describes all factors and, more importantly, none of them explicitly describes drug binding kinetics.
The need for a refined mathematical model on spatial drug distribution within the brain
In this review, we have described several classes of models on drug distribution within the brain:
Models on processes affecting drug distribution within the brain ECF (described in “Modelling drug transport through the brain capillary system”, “Modelling drug transport across the BBB”, “Modelling drug transport within the brain ECF”, “Modelling intra-extracellular exchange”, “Modelling drug binding kinetics” and “Modelling drug metabolism in the brain”).
Models on drug exchange between compartments (described in “Modelling drug exchange between compartments”).
Models that integrate multiple properties and/or combine class (1) and (2) (described in "Integration of model properties").
We have touched upon many mathematical models for each class, see Table 3 for an overview. However, none of these models captures all of these processes, while this is crucial for a complete understanding of drug distribution within the brain. Models on drug distribution within the brain often incompletely describe BBB transport and drug binding by simple sink terms that do not take into account bidirectional or saturable transport and binding kinetics. Clearly, a model is needed that covers both drug transport across the BBB and the subsequent distribution within the brain, including drug transport and drug binding. It is important to study the fate of a drug after it crosses the BBB, as many processes within the brain can affect the drug concentration within the brain and thereby influence its effect. For example, a drug can easily pass the BBB, but if subsequent drug transport is slow or if non-specific binding is high, drug-target binding and effect will still be minimal. In “Factors affecting drug distribution within the brain”, we have shown that many factors influence the local distribution of a drug within the brain. Therefore, it is necessary to study the local drug distribution within the brain as well as how this is affected by drug-specific and system-specific parameters. Especially parameters related to drug binding are crucial, as a drug will only exert its desired effect when it is bound to a local target. There is a high demand for approaches that integrate all the aspects discussed in this review into one model. Therefore, a spatial drug distribution model is necessary that predicts the concentration of drug over both time and space and that allows for integration of physiological parameters. In particular, a three-dimensional model is desired, as this will provide the most realistic representation of the three-dimensional brain. The results of such a model can be compared with experimental data of specific drugs in order to gain more insights into the unknowns, including unknown parameter values but in particular the spatial distribution of a drug. Moreover, a model like this can be used to study the influence of regional differences on drug distribution. In summary, setting up a three-dimensional model that integrates BBB transport, drug transport and drug binding within the brain will lead to a more accurate and fine-tuned prediction of drug distribution in the brain.
Authors' contributions
ECM has made the outline of the review. EV, VR and ECM have written the manuscript All authors read and approved the final manuscript.
Acknowlegements
Not applicable.
Competing interests
The authors declare that they have no competing interests.
Availability of data and materials
Not applicable.
Consent for publication
Not applicable.
Ethics approval and consent to participate
Not applicable.
Funding
No funding was received for the writing of this manuscript.
Publisher’s Note
Springer Nature remains neutral with regard to jurisdictional claims in published maps and institutional affiliations.
Abbreviations
- BBB
blood–brain barrier
- BCSFB
blood–cerebrospinal fluid barrier
- CNS
central nervous system
- CSF
cerebrospinal fluid
- ECF
extracellular fluid
- ICF
intracellular fluid
Appendix: Ranges of values and units of parameters on drug distribution into and within rat and human brain
Value ranges and units of parameters related to drug distribution into and within the brain are summarized for rat and human in Tables 4, 5, 6, 7, 8 and 9. The tables are in line with the structure of the section “Existing models on the local distribution of drugs in the brain."
Table 4.
Parameters and units of the brain capillary system. The physiological range of values of the parameters is given for rat and human, based on references from the literature
| Parameter | Value (rat) | Value (human) |
|---|---|---|
| Capillary radius (10−6 m) | 0.8–4.8 [4, 5, 7, 213] | 3−5 [17, 214, 215] |
| S, capillary surface area (m2) | 1.3 [216] | 15–25 [17, 113, 217] |
| Intercapillary distance (10−6 m) | 14–72 [4, 5, 213] | 40 [17, 129, 218]–60 [214] |
| Q, capillary blood flow rate (10−9 L min−1) | 4.82–8.83 [219] | 0.3–200 [114] |
| Vbrain, brain volume (g) | 1.8 [171, 220] | 1400 [41] |
| Capillary blood flow velocity (10−4 m s−1) | 0.5−50 [221–226] | – |
Table 5.
Parameters and units of drug transport across the brain barriers. The physiological range of values of the parameters is given for rat and human, based on references from the literature
| Parameter | Value (rat) | Value (human) |
|---|---|---|
| P, BBB passive permeability (m s−1) | 10–10–10−5 [17] | 6 × 10⁻⁸–10−6 [227] |
| kBBB, BBB rate constant (s−1) | 3.5 × 10⁻⁵–1.17 × 10⁻³ [128, 134, 135] | 1.4 × 10⁻⁴–1.4 × 10⁻² [132] |
| CLBBB, BBB transfer clearance (10−5 L s−1) | 0.15–8.5 [143] | 113–850 [227] |
| Ptrans, BBB transcellular permeability (10−7 m s−1) | 10−3–102 [17] | 0.6–10 [227] |
| Dpara, BBB paracellular diffusivity (10−12 m2 s−1) | 467–767 [143] | 550–767 [227] |
| WTJ, width tight junction (10−6 m) | 0.3–0.5 [143, 228] | 0.3–0.5 [227, 228] |
| Tm, active transporter velocity | 10−5−10−8mol s−1 [229] | 22–167 mol L−1 s−1 [111] |
| Km, concentration to reach half of Tm (103 mol L−1) | 10−2−101 [230] | 4.5–5 [111] |
| Surface area BBB (m2) | 150 × 10−4–263 × 10−4 [231–233] | 12–18 [2, 17] |
| Surface area BCSFB (m2) | 25 × 10−4–75 × 10−4 [232–234] | 6–9 [17] |
Table 6.
Parameters and units of drug transport within the brain tissue. The physiological range of values of the parameters is given for rat and human, based on references from the literature
| Parameter | Value (rat) | Value (human) |
|---|---|---|
| D*, effective diffusion constant (10−10 m−2 s−1) | 0.1–1 [129, 203] | 0.1–15 [131, 189, 235] |
| , tortuosity | 1.44–3.5 [69, 168] | 1.50–1.77 [69] |
| , brain ECF volume fraction | 0.05–0.47 [168] | 0.23–0.49 [69, 111] |
| vECF, brain ECF bulk flow velocity (10−7 m s−1) | 0.5–50 [22, 236] | 2–8 [132] |
| CSF flow rate (10−7 L s−1) | 0.37 [27, 220] | 50–67 [237] |
Table 7.
Parameters and units of intra-extracellular exchange. The physiological range of values of the parameters is given for rat and human, based on references from the literature
Table 8.
Parameters and units of drug binding kinetics. The physiological range of values of the parameters is given for rat and human, based on references from the literature
| Parameter | Value (rat) | Value (human) |
|---|---|---|
| Association rate constant (μmol L−1 s−1) | 2.8 × 10⁻⁴–2.8 × 10² [238] | 2.8 × 10⁻⁵–2.8 × 10² [88, 239, 240] |
| Dissociation rate constant (s−1) | 2.8 × 10⁻⁷– 2.8 × 10⁻¹[238] | 2.8 × 10⁻⁷–2.8 × 100[88, 239, 240] |
| Binding site concentration (μmol L−1) | 1 × 10⁻⁴– 1 × 10⁻² [238] | 1 × 10⁻³–5 × 10⁻¹ [88] |
Table 9.
Parameters and units of drug metabolism in the brain. The physiological range of values of the parameters is given for rat and human, based on references from the literature
Contributor Information
Esmée Vendel, Email: e.vendel@math.leidenuniv.nl.
Vivi Rottschäfer, Email: vivi@math.leidenuniv.nl.
Elizabeth C. M. de Lange, Email: ecmdelange@lacdr.leidenuniv.nl
References
- 1.Hammarlund-Udenaes M, Paalzow LK, de Lange ECM. Drug equilibration across the blood–brain barrier-pharmacokinetic considerations based on the microdialysis method. Pharm Res. 1997;14(2):128–134. doi: 10.1023/a:1012080106490. [DOI] [PubMed] [Google Scholar]
- 2.Abbott JN, Patabendige AAK, Dolman DEM, Yusof SR, Begley DJ. Structure and function of the blood–brain barrier. Neurobiol Dis. 2010;37(1):13–25. doi: 10.1016/j.nbd.2009.07.030. [DOI] [PubMed] [Google Scholar]
- 3.Zlokovic BV. Neurovascular mechanisms of Alzheimer’s neurodegeneration. Trends Neurosci. 2005;28(4):202–208. doi: 10.1016/j.tins.2005.02.001. [DOI] [PubMed] [Google Scholar]
- 4.Jucker M, Bättig K, Meier-Ruge W. Effects of aging and vincamine derivatives on pericapillary microenvironment: stereological characterization of the cerebral capillary network. Neurobiol Aging. 1990;11(1):39–46. doi: 10.1016/0197-4580(90)90060-d. [DOI] [PubMed] [Google Scholar]
- 5.Schlageter KE, Molnar P, Lapin GD, Groothuis DR. Microvessel organization and structure in experimental brain tumors: microvessel populations with distinctive structural and functional properties. Microvasc Res. 1999;58(3):312–328. doi: 10.1006/mvre.1999.2188. [DOI] [PubMed] [Google Scholar]
- 6.Pardridge WM. The blood–brain barrier: bottleneck in brain drug development. NeuroRx. 2005;2(1):3–14. doi: 10.1602/neurorx.2.1.3. [DOI] [PMC free article] [PubMed] [Google Scholar]
- 7.Tata DA, Anderson B. A new method for the investigation of capillary structure. J Neurosci Methods. 2002;113(2):199–206. doi: 10.1016/s0165-0270(01)00494-0. [DOI] [PubMed] [Google Scholar]
- 8.Hawkins BT, Davis TP. The blood–brain barrier/neurovascular unit in health and disease. Pharmacol Rev. 2005;57(2):173–185. doi: 10.1124/pr.57.2.4. [DOI] [PubMed] [Google Scholar]
- 9.Abbott NJ, Rönnbäck L, Hansson E. Astrocyte–endothelial interactions at the blood–brain barrier. Nat Rev Neurosci. 2006;7(1):41. doi: 10.1038/nrn1824. [DOI] [PubMed] [Google Scholar]
- 10.Fenstermacher J, Kaye T. Drug “difuusion” within the brain. Ann N Y Acad Sci. 1988;531(1):29–39. doi: 10.1111/j.1749-6632.1988.tb31809.x. [DOI] [PubMed] [Google Scholar]
- 11.Kniesel U, Wolburg H. Tight junctions of the blood–brain barrier. Cell Mol Neurobiol. 2000;20(1):57–76. doi: 10.1023/A:1006995910836. [DOI] [PMC free article] [PubMed] [Google Scholar]
- 12.Schachenmayr W, Friede R. The origin of subdural neomembranes. I. Fine structure of the dura-arachnoid interface in man. Am J Pathol. 1978;92(1):53. [PMC free article] [PubMed] [Google Scholar]
- 13.Vandenabeele F, Creemers J, Lambrichts I. Ultrastructure of the human spinal arachnoid mater and dura mater. J Anat. 1996;189(Pt 2):417. [PMC free article] [PubMed] [Google Scholar]
- 14.Yasuda K, Cline CB, Vogel P, Onciu M, Fatima S, Sorrentino BP, Thirumaran RK, Ekins S, Urade Y, Fujimori K, et al. Drug transporters on arachnoid barrier cells contribute to the blood–cerebrospinal fluid barrier. Drug Metab Dispos. 2013 doi: 10.1124/dmd.112.050344. [DOI] [PMC free article] [PubMed] [Google Scholar]
- 15.Schmitt FO, Samson FE. Brain cell microenvironment. Neurosci Res Prog Bull. 1969;7:277–417. [Google Scholar]
- 16.Nicholson C, Syková E. Extracellular space structure revealed by diffusion analysis. Trends Neurosci. 1998;21(5):207–215. doi: 10.1016/s0166-2236(98)01261-2. [DOI] [PubMed] [Google Scholar]
- 17.Wong A, Ye M, Levy A, Rothstein J, Bergles D, Searson PC. The blood–brain barrier: an engineering perspective. Front Neuroeng. 2013;6:7. doi: 10.3389/fneng.2013.00007. [DOI] [PMC free article] [PubMed] [Google Scholar]
- 18.Zonta M, Angulo MC, Gobbo S, Rosengarten B, Hossmann K-A, Pozzan T, Carmignoto G. Neuron-to-astrocyte signaling is central to the dynamic control of brain microcirculation. Nat Neurosci. 2003;6(1):43. doi: 10.1038/nn980. [DOI] [PubMed] [Google Scholar]
- 19.Iadecola C. Neurovascular regulation in the normal brain and in Alzheimer’s disease. Nat Rev Neurosci. 2004;5(5):347. doi: 10.1038/nrn1387. [DOI] [PubMed] [Google Scholar]
- 20.Takano T, Tian G-F, Peng W, Lou N, Libionka W, Han X, Nedergaard M. Astrocyte-mediated control of cerebral blood flow. Nat Neurosci. 2006;9(2):260. doi: 10.1038/nn1623. [DOI] [PubMed] [Google Scholar]
- 21.Iadecola C, Nedergaard M. Glial regulation of the cerebral microvasculature. Nat Neurosci. 2007;10(11):1369. doi: 10.1038/nn2003. [DOI] [PubMed] [Google Scholar]
- 22.Hladky SB, Barrand MA. Mechanisms of fluid movement into, through and out of the brain: evaluation of the evidence. Fluids Barriers CNS. 2014;11(1):1. doi: 10.1186/2045-8118-11-26. [DOI] [PMC free article] [PubMed] [Google Scholar]
- 23.Brinker T, Stopa E, Morrison J, Klinge P. A new look at cerebrospinal fluid circulation. Fluids Barriers CNS. 2014;11(1):10. doi: 10.1186/2045-8118-11-10. [DOI] [PMC free article] [PubMed] [Google Scholar]
- 24.Orešković D, Klarica M. A new look at cerebrospinal fluid movement. Fluids Barriers CNS. 2014;11(1):16. doi: 10.1186/2045-8118-11-16. [DOI] [PMC free article] [PubMed] [Google Scholar]
- 25.Marchi N, Banjara M, Janigro D. Blood–brain barrier, bulk flow, and interstitial clearance in epilepsy. J Neurosci Methods. 2016;260:118–124. doi: 10.1016/j.jneumeth.2015.06.011. [DOI] [PMC free article] [PubMed] [Google Scholar]
- 26.Cserr HF, Bundgaard M. Blood–brain interfaces in vertebrates: a comparative approach. Am J Physiol-Regul Integr Comp Physiol. 1984;246(3):277–288. doi: 10.1152/ajpregu.1984.246.3.R277. [DOI] [PubMed] [Google Scholar]
- 27.Abbott JN. Evidence for bulk flow of brain interstitial fluid: significance for physiology and pathology. Neurochem Int. 2004;45(4):545–552. doi: 10.1016/j.neuint.2003.11.006. [DOI] [PubMed] [Google Scholar]
- 28.Davson H, Segal MB. Physiology of the CSF and blood–brain barriers. Boca Raton: CRC Press; 1995. [Google Scholar]
- 29.Iliff JJ, Wang M, Zeppenfeld DM, Venkataraman A, Plog BA, Liao Y, Deane R, Nedergaard M. Cerebral arterial pulsation drives paravascular CSF-interstitial fluid exchange in the murine brain. J Neurosci. 2013;33(46):18190–18199. doi: 10.1523/JNEUROSCI.1592-13.2013. [DOI] [PMC free article] [PubMed] [Google Scholar]
- 30.Lei Y, Han H, Yuan F, Javeed A, Zhao Y. The brain interstitial system: anatomy, modeling, in vivo measurement, and applications. Prog Neurobiol. 2017 doi: 10.1016/j.pneurobio.2015.12.007. [DOI] [PubMed] [Google Scholar]
- 31.Johanson CE, Duncan JA, Klinge PM, Brinker T, Stopa EG, Silverberg GD. Multiplicity of cerebrospinal fluid functions: new challenges in health and disease. Cerebrospinal Fluid Res. 2008;5(1):10. doi: 10.1186/1743-8454-5-10. [DOI] [PMC free article] [PubMed] [Google Scholar]
- 32.Bulat M, Klarica M. Recent insights into a new hydrodynamics of the cerebrospinal fluid. Brain Res Rev. 2011;65(2):99–112. doi: 10.1016/j.brainresrev.2010.08.002. [DOI] [PubMed] [Google Scholar]
- 33.Jin B-J, Smith AJ, Verkman AS. Spatial model of convective solute transport in brain extracellular space does not support a “glymphatic” mechanism. J Gen Physiol. 2016;148(6):489–501. doi: 10.1085/jgp.201611684. [DOI] [PMC free article] [PubMed] [Google Scholar]
- 34.Abbott NJ, Pizzo ME, Preston JE, Janigro D, Thorne RG. The role of brain barriers in fluid movement in the CNS: is there a ‘glymphatic’ system? Acta Neuropathol. 2018 doi: 10.1007/s00401-018-1812-4. [DOI] [PubMed] [Google Scholar]
- 35.Nedergaard M. Garbage truck of the brain. Science. 2013;340(6140):1529–1530. doi: 10.1126/science.1240514. [DOI] [PMC free article] [PubMed] [Google Scholar]
- 36.Xie L, Kang H, Xu Q, Chen MJ, Liao Y, Thiyagarajan M, O’Donnell J, Christensen DJ, Nicholson C, Iliff JJ, et al. Sleep drives metabolite clearance from the adult brain. Science. 2013;342(6156):373–377. doi: 10.1126/science.1241224. [DOI] [PMC free article] [PubMed] [Google Scholar]
- 37.Iliff JJ, Wang M, Liao Y, Plogg BA, Peng W, Gundersen GA, Benveniste H, Vates GE, Deane R, Goldman SA, et al. A paravascular pathway facilitates csf flow through the brain parenchyma and the clearance of interstitial solutes, including amyloid . Sci Transl Med. 2012;4(147):147–111147111. doi: 10.1126/scitranslmed.3003748. [DOI] [PMC free article] [PubMed] [Google Scholar]
- 38.Holter KE, Kehlet B, Devor A, Sejnowski TJ, Dale AM, Omholt SW, Ottersen OP, Nagelhus EA, Mardal K-A, Pettersen KH. Interstitial solute transport in 3D reconstructed neuropil occurs by diffusion rather than bulk flow. Proc Natl Acad Sci. 2017;114(37):9894–9899. doi: 10.1073/pnas.1706942114. [DOI] [PMC free article] [PubMed] [Google Scholar]
- 39.Smith AJ, Yao X, Dix JA, Jin B-J, Verkman AS. Test of the ǵlymphatich́ypothesis demonstrates diffusive and aquaporin-4-independent solute transport in rodent brain parenchyma. Elife. 2017;6:27679. doi: 10.7554/eLife.27679. [DOI] [PMC free article] [PubMed] [Google Scholar]
- 40.McComb JG. Recent research into the nature of cerebrospinal fluid formationand absorption. J Neurosurg. 1983;59(3):369–383. doi: 10.3171/jns.1983.59.3.0369. [DOI] [PubMed] [Google Scholar]
- 41.Begley D, Bradbury M. The role of brain extracellular fluid production and efflux mechanisms in drug transport to the brain. In: Kreuter J, editor. The blood–brain barrier and drug delivery to the CNS. New York: Marcel Dekker; 2000. [Google Scholar]
- 42.Iliff JJ, Goldman SA, Nedergaard M. Implications of the discovery of brain lymphatic pathways. Lancet Neurol. 2015;14(10):977–979. doi: 10.1016/S1474-4422(15)00221-5. [DOI] [PMC free article] [PubMed] [Google Scholar]
- 43.Simon MJ, Iliff JJ. Regulation of cerebrospinal fluid (CSF) flow in neurodegenerative, neurovascular and neuroinflammatory disease. Biochim Biophys Acta. 2016;1862(3):422–451. doi: 10.1016/j.bbadis.2015.10.014. [DOI] [PMC free article] [PubMed] [Google Scholar]
- 44.Guengerich FP. Cytochrome p450 and chemical toxicology. Chem Res Intoxicol. 2007;21(1):70–83. doi: 10.1021/tx700079z. [DOI] [PubMed] [Google Scholar]
- 45.de Lange ECM. The mastermind approach to CNS drug therapy: translational prediction of human brain distribution, target site kinetics, and therapeutic effects. Fluids Barriers CNS. 2013;10(1):12. doi: 10.1186/2045-8118-10-12. [DOI] [PMC free article] [PubMed] [Google Scholar]
- 46.Ferguson CS, Tyndale RF. Cytochrome p450 enzymes in the brain: emerging evidence of biological significance. Trends Pharmacol Sci. 2011;32(12):708–714. doi: 10.1016/j.tips.2011.08.005. [DOI] [PMC free article] [PubMed] [Google Scholar]
- 47.Seelig A. The role of size and charge for blood–brain barrier permeation of drugs and fatty acids. J Chem Inf Model. 2007;33:32–41. doi: 10.1007/s12031-007-0055-y. [DOI] [PubMed] [Google Scholar]
- 48.Banks WA. Characteristics of compounds that cross the blood–brain barrier. BMC Neurol. 2009;9(1):3. doi: 10.1186/1471-2377-9-S1-S3. [DOI] [PMC free article] [PubMed] [Google Scholar]
- 49.Kortagere S, Krasowski MD, Ekins S. The importance of discerning shape in molecular pharmacology. Trends Pharmacol Sci. 2009;30(3):138–147. doi: 10.1016/j.tips.2008.12.001. [DOI] [PMC free article] [PubMed] [Google Scholar]
- 50.Hitchock SA, Pennington LD. Structure-brain exposure relationships. J Med Chem. 2006;49(26):7559–7583. doi: 10.1021/jm060642i. [DOI] [PubMed] [Google Scholar]
- 51.Hammarlund-Udenaes M. Active-site concentrations of chemicals—are they a better predictor of effect than plasma/organ/tissue concentrations? Basic Clin Pharmacol Toxicol. 2010;106(3):215–220. doi: 10.1111/j.1742-7843.2009.00517.x. [DOI] [PubMed] [Google Scholar]
- 52.Kamiya A, Bukhari R, Togawa T. Adaptive regulation of wall shear stress optimizing vascular tree function. Bull Math Biol. 1984;46(1):127–137. doi: 10.1007/BF02463726. [DOI] [PubMed] [Google Scholar]
- 53.Rowland M, Tozer TN. Clinical pharmacokinetics and pharmacodynamics. Philadelphia: Lippincott Williams and Wilkins; 2005. [Google Scholar]
- 54.Trapa PE, Belova E, Liras JL, Scott DO, Steyn SJ. Insights from an integrated physiologically based pharmacokinetic model for brain penetration. J Pharm Sci. 2016;105(2):965–971. doi: 10.1016/j.xphs.2015.12.005. [DOI] [PubMed] [Google Scholar]
- 55.Korjamo T, Heikkinen AT, Mönkkönen J. Analysis of unstirred water layer in in vitro permeability experiments. J Pharm Sci. 2009;98(12):4469–4479. doi: 10.1002/jps.21762. [DOI] [PubMed] [Google Scholar]
- 56.Loftsson T. Drug permeation through biomembranes: cyclodextrins and the unstirred water layer. Die Pharmazie Int J Pharm Sci. 2012;67(5):363–370. [PubMed] [Google Scholar]
- 57.Balusu S, Van Wonterghem E, De Rycke R, Raemdonck K, Stremersch S, Gevaert K, Brkic M, Demeestere D, Vanhooren V, Hendrix A, Libert C, Vandenbroucke RE. Identification of a novel mechanism of blood–brain communication during peripheral inflammation via choroid plexus-derived extracellular vesicles. Mol Pharm. 2016;8(10):1162–1183. doi: 10.15252/emmm.201606271. [DOI] [PMC free article] [PubMed] [Google Scholar]
- 58.Andreone BJ, Chow BW, Tata A, Lacoste A, Ben-Zvi B, Bullock K, Deik AA, Ginty DD, Clish CB, Gu C. Blood–brain barrier permeability is regulated by lipid transport-dependent suppression of caveolae-mediated transcytosis. Neuron. 2017;94(3):581–594. doi: 10.1016/j.neuron.2017.03.043. [DOI] [PMC free article] [PubMed] [Google Scholar]
- 59.Gonatas NK, Stieber A, Hickey WF, Herbert SH, Gonatas JO. Endosomes and Golgi vesicles in adsorptive and fluid phase endocytosis. J Cell biol. 1984;99(4):1379–1390. doi: 10.1083/jcb.99.4.1379. [DOI] [PMC free article] [PubMed] [Google Scholar]
- 60.Hervé F, Ghinea N, Schermann J-M. CNS delivery via adsorptive transcytosis. AAPS J. 2008;10(3):455–472. doi: 10.1208/s12248-008-9055-2. [DOI] [PMC free article] [PubMed] [Google Scholar]
- 61.Pardridge WM. Receptor-mediated peptide transport through the blood–brain barrier. Endocr Rev. 1986;3(7):314–330. doi: 10.1210/edrv-7-3-314. [DOI] [PubMed] [Google Scholar]
- 62.Urquhart BL, Kim RB. Blood–brain barrier transporters and response to CNS-active drugs. Eur J Clin Pharmacol. 2009;65(11):1063. doi: 10.1007/s00228-009-0714-8. [DOI] [PubMed] [Google Scholar]
- 63.Dalvi S, On N, Nguyen H, Pogorzelec M, Miller DW, Hatch GM. The blood brain barrier-regulation of fatty acid and drug transport. In: Heinbockel T, editor. Neurochemistry, Chap. 1. Rijeka: IntechOpen; 2014. [Google Scholar]
- 64.Pardridge WM. Drug transport across the blood–brain barrier. J Cereb Blood Flow Metab. 2012;32(11):1959–1972. doi: 10.1038/jcbfm.2012.126. [DOI] [PMC free article] [PubMed] [Google Scholar]
- 65.Ghersi-Egea J-F, Leninger-Muller B, Suleman G, Siest G, Minn A. Localization of drug-metabolizing enzyme activities to blood–brain interfaces and circumventricular organs. J Neurochem. 1994;62:1089–1096. doi: 10.1046/j.1471-4159.1994.62031089.x. [DOI] [PubMed] [Google Scholar]
- 66.Zawilska JB, Wojcieszak J, Olejniczak AB. Prodrugs: a challenge for the drug development. Pharmacol Rep. 2013;65(1):1–14. doi: 10.1016/s1734-1140(13)70959-9. [DOI] [PubMed] [Google Scholar]
- 67.Pardridge WM. Drug transport in brain via the cerebrospinal fluid. Fluids Barriers CNS. 2011;8(1):7. doi: 10.1186/2045-8118-8-7. [DOI] [PMC free article] [PubMed] [Google Scholar]
- 68.Butler SL, Kohles SS, Thielke RJ, Chen C, Vanderby R. Interstitial fluid flow in tendons or ligaments: a porous medium finite element simulation. Med Biol Eng Comput. 1997;35(6):742–746. doi: 10.1007/BF02510987. [DOI] [PubMed] [Google Scholar]
- 69.Syková E, Nicholson C. Diffusion in brain extracellular space. Physiol Rev. 2008;88(4):1277–1340. doi: 10.1152/physrev.00027.2007. [DOI] [PMC free article] [PubMed] [Google Scholar]
- 70.Hrabětová S, Hrabe J, Nicholson C. Dextran decreases extracellular tortuosity in thickslice ischemia model. J Cereb Blood Flow Metab. 2000;20(9):1306–1310. doi: 10.1097/00004647-200009000-00005. [DOI] [PubMed] [Google Scholar]
- 71.Hrabětová S, Hrabe J, Nicholson C. Dead-space microdomains hinder extracellular diffusion in rat neocortex during ischemia. J Neurosci. 2003;23(23):8351–8359. doi: 10.1523/JNEUROSCI.23-23-08351.2003. [DOI] [PMC free article] [PubMed] [Google Scholar]
- 72.Nicholson C. Factors governing diffusing molecular signals in brain extracellular space. J Neural Transm. 2005;112(1):29–44. doi: 10.1007/s00702-004-0204-1. [DOI] [PubMed] [Google Scholar]
- 73.Wolak DJ, Thorne RG. Diffusion of macromolecules in the brain: implications for drug delivery. Mol Pharm. 2013;10(5):1492–1504. doi: 10.1021/mp300495e. [DOI] [PMC free article] [PubMed] [Google Scholar]
- 74.Cserr HF, Ostrach LH. Bulk flow of interstitial fluid after intracranial injection of blue dextran 2000. Exp Neurol. 1974;45(1):50–60. doi: 10.1016/0014-4886(74)90099-5. [DOI] [PubMed] [Google Scholar]
- 75.de Lange ECM, Danhof M. Considerations in the use of cerebrospinal fluid pharmacokinetics to predict brain target concentrations in the clinical setting. Clin Pharm. 2002;41(10):691–703. doi: 10.2165/00003088-200241100-00001. [DOI] [PubMed] [Google Scholar]
- 76.Nicholson C, Tao L. Hindered diffusion of high molecular weight compounds in brain extracellular microenvironment measured with integrative optical imaging. Biophys J. 1993;65(6):2277–2290. doi: 10.1016/S0006-3495(93)81324-9. [DOI] [PMC free article] [PubMed] [Google Scholar]
- 77.Saltzman W. Drug delivery: engineering principles for drug therapy. Oxford: Oxford University Press; 2001. p. 384. 10.1039/c4nr00915k. arXiv:1011.1669v3.
- 78.Proescholdt MG, Hutto B, Brady LS, Herkenham M. Studies of cerebrospinal fluid flow and penetration into brain following lateral ventricle and cisterna magna injections of the tracer [14C] inulin in rat. Neuroscience. 2000;95(2):577–592. doi: 10.1016/s0306-4522(99)00417-0. [DOI] [PubMed] [Google Scholar]
- 79.Kalvass JC, Maurer TS. Influence of non-specific brain and plasma binding on cns exposure: implications for rational drug discovery. Biopharm Drug Dispos. 2002;23(8):327–338. doi: 10.1002/bdd.325. [DOI] [PubMed] [Google Scholar]
- 80.Lee G, Dallas S, Hong M, Bendayan R. Drug transporters in the central nervous system: brain barriers and brain parenchyma considerations. Pharmacol Rev. 2001;53(4):569–596. [PubMed] [Google Scholar]
- 81.Marroni M, Marchi N, Cuccolo L, Abbott N, Signorelli K, Janigro D. Vascular and parenchymal mechanisms in multiple drug resistance: a lesson from human epilepsy. Curr Drug Targets. 2003;4(4):297–304. doi: 10.2174/1389450033491109. [DOI] [PubMed] [Google Scholar]
- 82.De Duve C, De Barsy T, Poole B, Tulkens P. Lysosomotropic agents. Biochem Pharmacol. 1974;23(18):2495–2531. doi: 10.1016/0006-2952(74)90174-9. [DOI] [PubMed] [Google Scholar]
- 83.Kazmi F, Hensley T, Pope C, Funk RS, Loewen GJ, Buckley DB. Lysosomal sequestration (trapping) of lipophilic amine (cationic amphiphilic) drugs in immortalized human hepatocytes (Fa2N-4 cells) Drug Metab Dispos. 2013 doi: 10.1124/dmd.112.050054. [DOI] [PMC free article] [PubMed] [Google Scholar]
- 84.Alvàn G, Paintaud G, Wakelkamp M. The efficiency concept in pharmacodynamics. Clin Pharmacokinet. 1999;36(5):375–389. doi: 10.2165/00003088-199936050-00005. [DOI] [PubMed] [Google Scholar]
- 85.Copeland RA, Pompliano DL, Meek TD. Drug-target residence time and its implications for lead optimization. Nat Rev Drug Discov. 2006;5(9):730. doi: 10.1038/nrd2082. [DOI] [PubMed] [Google Scholar]
- 86.Swinney DC. Biochemical mechanisms of drug action: what does it take for success? Nat Rev Drug Discov. 2004;3(9):801. doi: 10.1038/nrd1500. [DOI] [PubMed] [Google Scholar]
- 87.Pan AC, Borhani DW, Dror RO, Shaw DE. Molecular determinants of drug-receptor binding kinetics. Drug Discov Today. 2013;18(13–14):667–673. doi: 10.1016/j.drudis.2013.02.007. [DOI] [PubMed] [Google Scholar]
- 88.de Witte WHeEA, Danhof M, van der Graaf PH, de Lange ECM. In vivo target residence time and kinetic selectivity: the association rate constant as determinant. Trends Pharmacol Sci. 2016;37(10):831–842. doi: 10.1016/j.tips.2016.06.008. [DOI] [PubMed] [Google Scholar]
- 89.Minn A, Ghersi-Egea J-F, Perrin R, Leininger B, Siest G. Drug metabolizing enzymes in the brain and cerebral microvessels. Brain Res Rev. 1991;16(1):65–82. doi: 10.1016/0165-0173(91)90020-9. [DOI] [PubMed] [Google Scholar]
- 90.Ghersi-Egea J-F, Perrin R, Leninger-Muller B, Grassiot M, Jeandel C, Floquet J, Cuny G, Siest G, Minn A. Subcellular localization of cytochrome p450, and activities of several enzymes responsible for drug metabolism in the human brain. Biochem Pharmacol. 1993;45(3):647–658. doi: 10.1016/0006-2952(93)90139-n. [DOI] [PubMed] [Google Scholar]
- 91.Shawahna R, Uchida Y, Declèves X, Ohtsuki S, Yousif S, Dauchy S, Jacob A, Chassoux F, Daumas-Duport C, Couraud P-O, Terasaki T, Scherrmann JM. Transcriptomic and quantitative proteomic analysis of transporters and drug metabolizing enzymes in freshly isolated human brain microvessels. Mol Pharm. 2011;8(4):1332–1341. doi: 10.1021/mp200129p. [DOI] [PubMed] [Google Scholar]
- 92.Khokhar JY, Tyndale RF. Drug metabolism within the brain changes drug response: selective manipulation of brain CYP2B alters propofol effects. Neuropsychopharmacology. 2011;36(3):692. doi: 10.1038/npp.2010.202. [DOI] [PMC free article] [PubMed] [Google Scholar]
- 93.McMillan DM, Tyndale RF. CYP-mediated drug metabolism in the brain impacts drug response. Pharmacol Ther. 2017 doi: 10.1016/j.pharmthera.2017.10.008. [DOI] [PubMed] [Google Scholar]
- 94.Klein B, Kuschinsky H, Schrock H, Vetterlein F. Interdependency of local capillary density, blood flow, and metabolism in rat brains. Am J Physiol Heart Circ Physiol. 1986;251(6):1333–1340. doi: 10.1152/ajpheart.1986.251.6.H1333. [DOI] [PubMed] [Google Scholar]
- 95.Borowsky IW, Collins RC. Metabolic anatomy of brain: a comparison of regional capillary density, glucose metabolism, and enzyme activities. J Comp Neurol. 1989;288(3):401–413. doi: 10.1002/cne.902880304. [DOI] [PubMed] [Google Scholar]
- 96.Cipolla M. The cerebral circulation. Integr Syst Physiol From Mol Funct. 2009;1(1):1–59. [Google Scholar]
- 97.Chen BR, Kozberg MG, Bouchard MB, Shaik MA, Hillman EM. A critical role for the vascular endothelium in functional neurovascular coupling in the brain. J Am Heart Assoc. 2014;3(3):000787. doi: 10.1161/JAHA.114.000787. [DOI] [PMC free article] [PubMed] [Google Scholar]
- 98.Longden TA, Dabertrand F, Koide M, Gonzalez AL, Tykocki NR, Brayden JE, Hill-Eubanks D, Nelson MT. Capillary K+-sensing initiates retrograde hyperpolarization to increase local cerebral blood flow. Nat Neurosci. 2017;20(5):717. doi: 10.1038/nn.4533. [DOI] [PMC free article] [PubMed] [Google Scholar]
- 99.Jang SH, Wientjes MG, Lu D, Au JL. Drug delivery and transport to solid tumors. Pharm Res. 2003;20(9):1337–1350. doi: 10.1023/a:1025785505977. [DOI] [PubMed] [Google Scholar]
- 100.Shipley RJ, Chapman SJ. Multiscale modelling of fluid and drug transport in vascular tumours. Bull Math Biol. 2010;72(6):1464–1491. doi: 10.1007/s11538-010-9504-9. [DOI] [PubMed] [Google Scholar]
- 101.Carmeliet P, Jain RK. Angiogenesis in cancer and other diseases. Nature. 2000;407:249–257. doi: 10.1038/35025220. [DOI] [PubMed] [Google Scholar]
- 102.Boero JA, Ascher J, Arregui A, Rovainen C, Woolsey TA, Jaime A, Ascher J, Arregui A, Rovainen C, Woolsey TA. Increased brain capillaries in chronic hypoxia. J Appl Physiol. 1999;86(4):1211. doi: 10.1152/jappl.1999.86.4.1211. [DOI] [PubMed] [Google Scholar]
- 103.Ito H, Kanno I, Ibaraki M, Hatazawa J, Miura S. Changes in human cerebral blood flow and cerebral blood volume during hypercapnia and hypocapnia measured by positron emission tomography. J Cereb Blood FLow Metab. 2003;23:665–670. doi: 10.1097/01.WCB.0000067721.64998.F5. [DOI] [PubMed] [Google Scholar]
- 104.Hauck EF, Apostel S, Hoffmann JF, Heimann A, Kempski O. Capillary flow and diameter changes during reperfusion after global cerebral ischemia studied by intravital video microscopy. J Cereb Blood Flow Metab. 2004;24(4):383–391. doi: 10.1097/00004647-200404000-00003. [DOI] [PubMed] [Google Scholar]
- 105.Sokolova IA, Manukhina EB, Blinkov SM, Koshelev VB, Pinelis VG, Rodionov IM. Rarefication of the arterioles and capillary network in the brain of rats with different forms of hypertension. Microvasc Res. 1985;30(1):1–9. doi: 10.1016/0026-2862(85)90032-9. [DOI] [PubMed] [Google Scholar]
- 106.Ehlers W, Wagner A. Multi-component modelling of human brain tissue: a contribution to the constitutive and computational description of deformation, flow and diffusion processes with application to the invasive drug-delivery problem. Comput Methods Biomech Biomed Eng. 2015;18(8):861–879. doi: 10.1080/10255842.2013.853754. [DOI] [PubMed] [Google Scholar]
- 107.Tan WHK, Lee T, Wang CH. Simulation of intratumoral release of etanidazole: effects of the size of surgical opening. J Pharm Sci. 2003;92(4):773–789. doi: 10.1002/jps.10351. [DOI] [PubMed] [Google Scholar]
- 108.Shimono M. Non-uniformity of cell density and networks in the monkey brain. Sci Rep. 2013;3:2541. doi: 10.1038/srep02541. [DOI] [PMC free article] [PubMed] [Google Scholar]
- 109.Shah AK, Kreibich AD, Amdam GV, Münch D. Metabolic enzymes in glial cells of the honeybee brain and their associations with aging, starvation and food response. PLoS ONE. 2018;13(6):0198322. doi: 10.1371/journal.pone.0198322. [DOI] [PMC free article] [PubMed] [Google Scholar]
- 110.Krogh A. The rate of diffusion of gases through animal tissues, with some remarks on the coefficient of invasion. J Physiol. 1919;52(6):391–408. doi: 10.1113/jphysiol.1919.sp001838. [DOI] [PMC free article] [PubMed] [Google Scholar]
- 111.Calvetti D, Cheng Y, Somersalo E. A spatially distributed computational model of brain cellular metabolism. J Theor Biol. 2015;376:48–65. doi: 10.1016/j.jtbi.2015.03.037. [DOI] [PubMed] [Google Scholar]
- 112.Renkin EM. Transport of potassium-42 from blood to tissue in isolated mammalian skeletal muscles. Am J Physiol Leg Content. 1959;197(6):1205–1210. doi: 10.1152/ajplegacy.1959.197.6.1205. [DOI] [PubMed] [Google Scholar]
- 113.Crone C. The permeability of capillaries in various organs as determined by use of the ‘indicator diffusion’ method. Acta Physiol. 1963;58(4):292–305. doi: 10.1111/j.1748-1716.1963.tb02652.x. [DOI] [PubMed] [Google Scholar]
- 114.Lorthois S, Duru P, Billanou I, Quintard M, Celsis P. Kinetic modeling in the context of cerebral blood flow quantification by H215O positron emission tomography: the meaning of the permeability coefficient in Renkin–Crone’s model revisited at capillary scale. J Theor Biol. 2014;353:157–169. doi: 10.1016/j.jtbi.2014.03.004. [DOI] [PubMed] [Google Scholar]
- 115.Fang Q, Sakadzic S, Ruvinskaya L, Devor A, Dale AM, Boas DA. Oxygen advection and diffusion in a three-dimensional vascular anatomical network. Opt Express. 2008;16(22):17530–17541. doi: 10.1364/oe.16.17530. [DOI] [PMC free article] [PubMed] [Google Scholar]
- 116.Boujelben A, Watson M, McDougall S, Yen Y-F, Gerstner ER, Catana C, Deisboeck T, Batchelor TT, Boas D, Rosen B, Kalpathy-Cramer J, Chaplain MAJ. Multimodality imaging and mathematical modelling of drug delivery to glioblastomas. Interface Focus. 2016;6(5):20160039. doi: 10.1098/rsfs.2016.0039. [DOI] [PMC free article] [PubMed] [Google Scholar]
- 117.Gould IG, Tsai P, Kleinfeld D, Linninger A. The capillary bed offers the largest hemodynamic resistance to the cortical blood supply. J Cereb Blood Flow Metab. 2017;37(1):52–68. doi: 10.1177/0271678X16671146. [DOI] [PMC free article] [PubMed] [Google Scholar]
- 118.Sweeney PW, Walker-Samuel S, Shipley RJ. Insights into cerebral haemodynamics and oxygenation utilising in vivo mural cell imaging and mathematical modelling. Sci Rep. 2018;8(1):1373. doi: 10.1038/s41598-017-19086-z. [DOI] [PMC free article] [PubMed] [Google Scholar]
- 119.Di Giovanna AP, Tibo A, Silvestri L, Müllenbroich MC, Constantini I, Mascaro ALA, Sacconi L, Frasconi P, Pavone FS. Whole-brain vasculature reconstruction at the single capillary level. Sci Rep. 2018;8(12573):1–11. doi: 10.1038/s41598-018-30533-3. [DOI] [PMC free article] [PubMed] [Google Scholar]
- 120.Su S-W, Catherall M, Payne S. The influence of network structure on the transport of blood in the human cerebral microvasculature. Microcirculation. 2012;19(2):175–187. doi: 10.1111/j.1549-8719.2011.00148.x. [DOI] [PubMed] [Google Scholar]
- 121.Linninger AA, Gould IG, Marinnan T, Hsu C-Y, Chojecki M, Alaraj A. Cerebral microcirculation and oxygen tension in the human secondary cortex. Ann Biomed Eng. 2013;41(11):2264–2284. doi: 10.1007/s10439-013-0828-0. [DOI] [PMC free article] [PubMed] [Google Scholar]
- 122.Park CS, Payne SJ. Modelling the effects of cerebral microvasculature morphology on oxygen transport. Med Eng Phys. 2016;38:41–47. doi: 10.1016/j.medengphy.2015.09.004. [DOI] [PMC free article] [PubMed] [Google Scholar]
- 123.Merrem A, Bartzsch S, Laissue J, Oelfke U. Computational modelling of the cerebral cortical microvasculature: effect of X-ray microbeams versus broad beam irradiation. Phys Med Biol. 2017;62(10):3902–3922. doi: 10.1088/1361-6560/aa68d5. [DOI] [PMC free article] [PubMed] [Google Scholar]
- 124.Smith AF, Doyeux V, Berg M, Peyrounette M, Haft-Javaherian M, Larue A-E, Slater JH, Lauwers F, Blinder P, Tsai P, Kleinfeld D, Schaffer CB, Nishimura N, Davit Y, Lorthois S. Brain capillary networks across species: a few simple organizational requirements are sufficient to reproduce both structure and function. Front Physiol. 2019;10:233. doi: 10.3389/fphys.2019.00233. [DOI] [PMC free article] [PubMed] [Google Scholar]
- 125.Langhoff W, Riggs A, Hinow P. Scaling behavior of drug transport and absorption in in silico cerebral capillary networks. PLoS ONE. 2018;13(7):0200266. doi: 10.1371/journal.pone.0200266. [DOI] [PMC free article] [PubMed] [Google Scholar]
- 126.Nhan T, Burgess A, Lilge L, Hynynen K. Modeling localized delivery of doxorubicin to the brain following focused ultrasound enhanced blood–brain barrier permeability. Phys Med Biol. 2014;59:5987–6004. doi: 10.1088/0031-9155/59/20/5987. [DOI] [PubMed] [Google Scholar]
- 127.Nicholson C. Interaction between diffusion and Michaelis–Menten uptake of dopamine after lontophoresis in striatum. Biophys J. 1995;68(5):1699–1715. doi: 10.1016/S0006-3495(95)80348-6. [DOI] [PMC free article] [PubMed] [Google Scholar]
- 128.de Lange E, Bouw MR, Mandema JW, Danhof M, de Boer AG, Breimer DD. Application of intracerebral microdialysis to study regional distribution kinetics of drugs in rat brain. Br J Pharmacol. 1995;116(5):2538–2544. doi: 10.1111/j.1476-5381.1995.tb15107.x. [DOI] [PMC free article] [PubMed] [Google Scholar]
- 129.Nicholson C. Diffusion and related transport mechanisms in brain tissue. Rep Prog Phys. 2001;64(7):815. [Google Scholar]
- 130.Linninger AA, Somayaji MR, Xenos M, Kondapalli S. Drug delivery into the human brain. In: Proceedings: foundations of systems biology and engineering (FOSBE); 2005. p. 163–8.
- 131.Linninger AA, Somayaji MR, Erickson T, Guo X, Penn RD. Computational methods for predicting drug transport in anisotropic and heterogeneous brain tissue. J Biomech. 2008;41:2176–2187. doi: 10.1016/j.jbiomech.2008.04.025. [DOI] [PubMed] [Google Scholar]
- 132.Zhan W, Arifin DY, Lee TKY, Wang C-h. Mathematical modelling of convection enhanced delivery of Carmustine and paclitaxel for brain tumour therapy. Pharm Res. 2017;34:860–873. doi: 10.1007/s11095-017-2114-6. [DOI] [PubMed] [Google Scholar]
- 133.Patlak CS, Fenstermacher JD. Measurements of dog blood–brain transfer constants by ventriculocisternal perfusion. Am J Physiol. 1975;229(4):877–84. doi: 10.1152/ajplegacy.1975.229.4.877. [DOI] [PubMed] [Google Scholar]
- 134.Robinson P, Rapoport S. Model for drug uptake by brain tumors: effects of osmotic treatment and of diffusion in brain. J Cereb Blood Flow Metab. 1990;10(2):153–161. doi: 10.1038/jcbfm.1990.30. [DOI] [PubMed] [Google Scholar]
- 135.Dykstra KH, Hsiao JK, Morrison PF, Bungay PM, Mefford IN, Scully MM, Dedrick RL. Quantitative examination of tissue concentration profiles associated with microdialysis. J Neurochem. 1992;58(3):931–940. doi: 10.1111/j.1471-4159.1992.tb09346.x. [DOI] [PubMed] [Google Scholar]
- 136.Stevens J, Ploeger BA, Van Der Graaf PH, Danhof M, De Lange ECM. Systemic and direct nose-to-brain transport pharmacokinetic model for remoxipride after intravenous and intranasal administration. Drug Metab Dispos. 2011;39(12):2275–2282. doi: 10.1124/dmd.111.040782. [DOI] [PubMed] [Google Scholar]
- 137.Westerhout J, Ploeger B, Smeets J, Danhof M, Lange ECM. Physiologically based pharmacokinetic modeling to investigate regional brain distribution kinetics in rats. AAPS J. 2012;14(3):543–553. doi: 10.1208/s12248-012-9366-1. [DOI] [PMC free article] [PubMed] [Google Scholar]
- 138.Westerhout J, Smeets J, Danhof M, De Lange ECM. The impact of P-gp functionality on non-steady state relationships between CSF and brain extracellular fluid. J Pharmacokinet Pharmacodyn. 2013;40(3):327–342. doi: 10.1007/s10928-013-9314-4. [DOI] [PMC free article] [PubMed] [Google Scholar]
- 139.Westerhout J, Van Den Berg DJ, Hartman R, Danhof M, De Lange ECM. Prediction of methotrexate CNS distribution in different species—influence of disease conditions. Eur J Pharm Sci. 2014;57(1):11–24. doi: 10.1016/j.ejps.2013.12.020. [DOI] [PubMed] [Google Scholar]
- 140.Kielbasa W, Kalvass JC, Stratford R. Microdialysis evaluation of atomoxetine brain penetration and central nervous system pharmacokinetics in rats. Drug Metab Dispos. 2009;37(1):137–142. doi: 10.1124/dmd.108.023119. [DOI] [PubMed] [Google Scholar]
- 141.Yamamoto Y, Välitalo PA, van den Berg D-J, Hartman R, van den Brink W, Wong YC, Huntjens DR, Proost JH, Vermeulen A, Krauwinkel W, et al. A generic multi-compartmental cns distribution model structure for 9 drugs allows prediction of human brain target site concentrations. Pharm Res. 2016 doi: 10.1007/s11095-016-2065-3. [DOI] [PMC free article] [PubMed] [Google Scholar]
- 142.Ball K. A physiologically based modeling strategy during preclinical CNS drug development. Mol Pharm. 2014;11:836–848. doi: 10.1021/mp400533q. [DOI] [PubMed] [Google Scholar]
- 143.Yamamoto Y, Välitalo PA, Huntjens DR, Proost JH, Vermeulen A, Krauwinkel W, Beukers MW, van den Berg D-J, Hartman R, Wong YC, et al. Predicting drug concentration-time profiles in multiple CNS compartments using a comprehensive physiologically-based pharmacokinetic model. CPT Pharmacometrics Syst Pharmacol. 2017;6(11):765–777. doi: 10.1002/psp4.12250. [DOI] [PMC free article] [PubMed] [Google Scholar]
- 144.Weiss N, Miller F, Cazaubon S, Couraud P-O. The blood–brain barrier in brain homeostasis and neurological diseases. Biochim Biophys Acta. 2009;1788(4):842–857. doi: 10.1016/j.bbamem.2008.10.022. [DOI] [PubMed] [Google Scholar]
- 145.Gaohua L, Neuhoff S, Johnson TN, Rostami-hodjegan A. Development of a permeability-limited model of the human brain and cerebrospinal fl uid (CSF) to integrate known physiological and biological knowledge: estimating time varying CSF drug concentrations and their variability using in vitro data. Drug Metab Pharmacokinet. 2016;31(3):224–233. doi: 10.1016/j.dmpk.2016.03.005. [DOI] [PubMed] [Google Scholar]
- 146.Bickel U. How to measure drug transport across the blood–brain barrier. NeuroRx. 2005;2(1):15–26. doi: 10.1602/neurorx.2.1.15. [DOI] [PMC free article] [PubMed] [Google Scholar]
- 147.Syvänen S, Xie R, Sahin S, Hammarlund-Udenaes M. Pharmacokinetic consequences of active drug efflux at the blood–brain barrier. Pharm Res. 2006;23(4):705–717. doi: 10.1007/s11095-006-9780-0. [DOI] [PubMed] [Google Scholar]
- 148.Einstein A. Investigations on the theory of the Brownian movement. New York: Dover Publications; 1956. [Google Scholar]
- 149.Nicholson C, Phillips JM. Diffusion, from an iontophoretic point source in the brain: role of tortuosity and volume fraction. Brain Res. 1979;169:580–584. doi: 10.1016/0006-8993(79)90408-6. [DOI] [PubMed] [Google Scholar]
- 150.Hrabe J, Hrabĕtová S, Segeth K. A model of effective diffusion and tortuosity in the extracellular space of the brain. Biophys J. 2004;87(3):1606–1617. doi: 10.1529/biophysj.103.039495. [DOI] [PMC free article] [PubMed] [Google Scholar]
- 151.Nicholson C. Brain extracellular space: the final frontier of neuroscience. Biophys J. 2017 doi: 10.1016/j.bpj.2017.06.052. [DOI] [PMC free article] [PubMed] [Google Scholar]
- 152.Chen KC, Hoistad M, Kehr J, Fuxe K, Nicholson C. Quantitative dual-probe microdialysis: mathematical model and analysis. J Neurochem. 2002;81(1):94–107. doi: 10.1046/j.1471-4159.2002.00792.x. [DOI] [PubMed] [Google Scholar]
- 153.Saltzman WM, Radomsky ML. Drugs released from polymers: diffusion and elimination in brain tissue. Chem Eng Sci. 1991;46(10):2429–2444. [Google Scholar]
- 154.Levin VA, Patlak CS, Laudahl HD. Heuristic modeling of drug delivery to malignant brain tumors. J Pharm Biopharm. 1980 doi: 10.1007/BF01059646. [DOI] [PubMed] [Google Scholar]
- 155.Hammarlund-Udenaes M, Fridén M, Syvänen S, Gupta A. On the rate and extent of drug delivery to the brain. Pharm Res. 2008;25(8):1737–1750. doi: 10.1007/s11095-007-9502-2. [DOI] [PMC free article] [PubMed] [Google Scholar]
- 156.Xiao F, Hrabe J, Hrabetova S. Anomalous extracellular diffusion in rat cerebellum. Biophys J. 2015;108(9):2384–2395. doi: 10.1016/j.bpj.2015.02.034. [DOI] [PMC free article] [PubMed] [Google Scholar]
- 157.Kinney JP, Spacek J, Bartol TM, Bajaj CL, Harris KM, Sejnowski TJ. Extracellular sheets and tunnels modulate glutamate diffusion in hippocampal neuropil. J Comp Neurol. 2013;521(2):448–464. doi: 10.1002/cne.23181. [DOI] [PMC free article] [PubMed] [Google Scholar]
- 158.Somayaji MR, Xenos M, Zhang L, Mekarski M, Linninger AA. Systematic design of drug delivery therapies. Comput Chem Eng. 2008;32:89–98. [Google Scholar]
- 159.Tao L, Nicholson C. Maximum geometrical hindrance to diffusion in brain extracellular space surrounding uniformly spaced convex cells. J Theor Biol. 2004;229(1):59–68. doi: 10.1016/j.jtbi.2004.03.003. [DOI] [PubMed] [Google Scholar]
- 160.Tao A, Tao L, Nicholson C. Cell cavities increase tortuosity in brain extracellular space. J Theor Biol. 2005;234(4):525–536. doi: 10.1016/j.jtbi.2004.12.009. [DOI] [PubMed] [Google Scholar]
- 161.El-Kareh AW, Braunstein SL, Secomb TW. Effect of cell arrangement and interstitial volume fraction on the diffusivity of monoclonal antibodies in tissue. Biophys J. 1993;64:1638–1646. doi: 10.1016/S0006-3495(93)81532-7. [DOI] [PMC free article] [PubMed] [Google Scholar]
- 162.Rusakov DA, Kullmann DM. Geometric and viscous components of the tortuosity of the extracellular space in the brain. Proc Natl Acad Sci USA. 1998;95:8975–8980. doi: 10.1073/pnas.95.15.8975. [DOI] [PMC free article] [PubMed] [Google Scholar]
- 163.Chen KC, Nicholson C. Changes in brain cell shape create residual extracellular space volume and explain tortuosity behavior during osmotic challenge. Proc Natl Acad Sci. 2000;97(15):8306–8311. doi: 10.1073/pnas.150338197. [DOI] [PMC free article] [PubMed] [Google Scholar]
- 164.García JJ, Smith JH. A biphasic hyperelastic model for the analysis of fluid and mass transport in brain tissue. Ann Biomed Eng. 2009;37(2):375–386. doi: 10.1007/s10439-008-9610-0. [DOI] [PubMed] [Google Scholar]
- 165.Hossain SS, Hossainy SF, Bazilevs Y, Calo VM, Hughes TJ. Mathematical modeling of coupled drug and drug-encapsulated nanoparticle transport in patient-specific coronary artery walls. Comput Mech. 2012;49(2):213–242. [Google Scholar]
- 166.Støverud KH, Darcis M, Helmig R, Hassanizadeh SM. Modeling concentration distribution and deformation during convection-enhanced drug delivery into brain tissue. Transp Porous Medium. 2012;92:119–143. [Google Scholar]
- 167.Linninger A, Hartung GA, Liu BP, Mirkov S, Tangen K, Lukas RV, Unruh D, James CD, Sarkaria JN, Horbinksi C. Modeling the diffusion of D-2-hydroxyglutarate from IDH1 mutant gliomas in the central nervous system. Neuro-oncology. 2018;20(9):1197–1206. doi: 10.1093/neuonc/noy051. [DOI] [PMC free article] [PubMed] [Google Scholar]
- 168.Nicholson C, Kamali-Zare P, Tao L. Brain extracellular space as a diffusion barrier. Comput Vis Sci. 2011;14(7):309–325. doi: 10.1007/s00791-012-0185-9. [DOI] [PMC free article] [PubMed] [Google Scholar]
- 169.Tao L. Effects of osmotic stress on dextran diffusion in rat neocortex studied with integrative optical imaging. J Neurophysiol. 1999;81(5):2501–2507. doi: 10.1152/jn.1999.81.5.2501. [DOI] [PubMed] [Google Scholar]
- 170.Hrabětová S. Extracellular diffusion is fast and Isotropic in the stratum radiatum of hippocampal CA1 region in rat brain slices. Hippocampus. 2005;450:441–450. doi: 10.1002/hipo.20068. [DOI] [PubMed] [Google Scholar]
- 171.Thorne RG, Hrabe S, Nicholson C, Robert G. Diffusion of epidermal growth factor in rat brain extracellular space measured by integrative optical imaging. J Neurophysiol. 2004;92(6):3471–3481. doi: 10.1152/jn.00352.2004. [DOI] [PubMed] [Google Scholar]
- 172.Thorne RG, Nicholson C. In vivo diffusion analysis with quantum dots and dextrans predicts the width of brain extracellular space. Proc Natl Acad Sci. 2006;103(14):5567–5572. doi: 10.1073/pnas.0509425103. [DOI] [PMC free article] [PubMed] [Google Scholar]
- 173.Prokopovà-Kubinovà Š, Vargova L, Tao L, Ulbrich K, Šubr V, Sykova E, Nicholson C. Poly[N-(2-hydroxypropyl)methacrylamide] polymers diffuse in brain extracellular space with same tortuosity as small molecules. Biophysic Chem. 2001;80:542–548. doi: 10.1016/S0006-3495(01)76036-5. [DOI] [PMC free article] [PubMed] [Google Scholar]
- 174.Wolak DJ, Pizzo ME, Thorne RG. Probing the extracellular diffusion of antibodies in brain using in vivo integrative optical imaging and ex vivo fluorescence imaging. J Control Release. 2015;197:78–86. doi: 10.1016/j.jconrel.2014.10.034. [DOI] [PMC free article] [PubMed] [Google Scholar]
- 175.Nicholson C, Phillips J. Ion diffusion modified by tortuosity and volume fraction in the extracellular microenvironment of the rat cerebellum. J Physiol. 1981;321:225. doi: 10.1113/jphysiol.1981.sp013981. [DOI] [PMC free article] [PubMed] [Google Scholar]
- 176.Han H, Shee C, Fu Y, Zuo L, Lee K, He Q, Han H. A novel MRI tracer-based method for measuring water diffusion in the extracellular space of the rat brain. IEEE J Biomed Health Inform. 2014;18(3):978–983. doi: 10.1109/JBHI.2014.2308279. [DOI] [PubMed] [Google Scholar]
- 177.Le Bihan D. Looking Into the functional architecture of the brain with diffusion MRI. Nat Rev Neurosci. 2003;4:469–480. doi: 10.1038/nrn1119. [DOI] [PubMed] [Google Scholar]
- 178.Pappenheimer JR, Renkin EM, Borrero LM. Filtration, diffusion and molecular sieving through peripheral capillary membranes. Am J Physiol. 1951;167(1):13–46. doi: 10.1152/ajplegacy.1951.167.1.13. [DOI] [PubMed] [Google Scholar]
- 179.Deen WM. Hindered transport of large molecules in liquid-filled pores. AIChE J. 1987;33(9):1409–1425. [Google Scholar]
- 180.Morrison PF, Dedrick RL. Transport of cisplatin in ratbrain following microinfusion: an analysis. J Pharm Sci. 1986;75(2):120–128. doi: 10.1002/jps.2600750204. [DOI] [PubMed] [Google Scholar]
- 181.Bungay PM, Morrison PF, Dedrick RL. Steady-state theory for quantitative microdialysis of solutes and water in vivo and in vitro. Life Sci. 1990;46:105–119. doi: 10.1016/0024-3205(90)90043-q. [DOI] [PubMed] [Google Scholar]
- 182.Zhan W, Jiang L, Loew MH, Yang Y. Mapping spatiotemporal diffusion inside the human brain using a numerical solution of the diffusion equation. Magn Reson Imaging. 2008;26(5):694–702. doi: 10.1016/j.mri.2008.01.025. [DOI] [PMC free article] [PubMed] [Google Scholar]
- 183.Amberg G, Linderfors N. lntracerebral microdialysis: diffusion kinetics II. Mathematical studies of diffusion kinetics. J Pharmacol Methods. 1989;183:157–183. doi: 10.1016/0160-5402(89)90012-0. [DOI] [PubMed] [Google Scholar]
- 184.Benveniste H, Hansen AJ, Ottosen S. Determination of brain interstitial concentrations by microdialysis. J Neurochem. 1989;52(6):1741–1750. doi: 10.1111/j.1471-4159.1989.tb07252.x. [DOI] [PubMed] [Google Scholar]
- 185.Morrison PF, Laske DW, Bobo H, Oldfield EH, Dedrick RL. High-flow microinfusion: tissue penetration and pharmacodynamics. Am J Physiol. 1994;266(1 Pt 2):292–305. doi: 10.1152/ajpregu.1994.266.1.R292. [DOI] [PubMed] [Google Scholar]
- 186.Hoistad M, Chen KC, Nicholson C, Fuxe K, Kehr J. Quantitative dual-probe microdialysis: evaluation of [3H] mannitol diffusion in agar and rat striatum. Circ Res. 2002;81(1):80–93. doi: 10.1046/j.1471-4159.2002.00791.x. [DOI] [PubMed] [Google Scholar]
- 187.Tong S, Yuan F. An equivalent length model of microdialysis sampling. J Pharm Biomed Anal. 2002;28:269–278. doi: 10.1016/s0731-7085(01)00565-9. [DOI] [PubMed] [Google Scholar]
- 188.Bungay PM, Sumbria RK, Bickel U. Unifying the mathematical modeling of in vivo and in vitro microdialysis. Biophys Chem. 2011;257(5):2432–2437. doi: 10.1016/j.jpba.2011.01.005. [DOI] [PMC free article] [PubMed] [Google Scholar]
- 189.Fung LLK, Shin M, Tyler B, Brem H, Saltzman WM. Chemotherapeutic drugs released from polymers: distribution of 1,3-bis(2-chloroethyl)-l-nitrosourea in the rat brain. Pharm Res. 1996;13(5):671–682. doi: 10.1023/a:1016083113123. [DOI] [PubMed] [Google Scholar]
- 190.Sarntinoranont M, Chen X, Zhao J, Mareci TH. Computational model of interstitial transport in the spinal cord using diffusion tensor imaging. Ann Biomed Eng. 2006;34(8):1304–1321. doi: 10.1007/s10439-006-9135-3. [DOI] [PubMed] [Google Scholar]
- 191.Kim JH, Mareci TH, Sarntinoranont M. A voxelized model of direct infusion into the corpus callosum and hippocampus of the rat brain: model development and parameter analysis. Med Biol Eng Comput. 2010;48:203–214. doi: 10.1007/s11517-009-0564-7. [DOI] [PMC free article] [PubMed] [Google Scholar]
- 192.Raghavan R, Brady M. Predictive models for pressure-driven fluid infusions into brain parenchyma. Phys Med Biol. 2011;56(19):6179–204. doi: 10.1088/0031-9155/56/19/003. [DOI] [PMC free article] [PubMed] [Google Scholar]
- 193.Sampson JH, Raghavan R, Brady ML, Provenzale JM, Ii EH, Croteau D, Friedman AH, Reardon DA, Edward R, Wong T, Bigner DD, Pastan I, Rodríguez- MI, Tanner P, Puri R, Pedain C. Clinical utility of a patient-specific algorithm for simulating intracerebral drug infusions. Neuro-oncology. 2007 doi: 10.1215/15228517-2007-007. [DOI] [PMC free article] [PubMed] [Google Scholar]
- 194.Tangen KM, Hsu Y, Zhu DC, Linninger A. CNS wide simulation of flow resistance and drug transport due to spinal microanatomy. J Biomech. 2015;48:2144–2154. doi: 10.1016/j.jbiomech.2015.02.018. [DOI] [PubMed] [Google Scholar]
- 195.Lawrence JJ, Coenen W, Sánchez AL, Pawlak G, Martínez-Bazán C, Haughton V, Lasheras JC. On the dispersion of a drug delivered intrathecally in the spinal canal. J Fluid Mech. 2019;861:679–720. [Google Scholar]
- 196.Tangen KM, Leval R, Mehta AI, Linninger A. Computational and in vitro experimental investigation of intrathecal drug distribution: parametric study of the effect of injection volume, cerebrospinal fluid pulsatility, and drug uptake. Anesth Analg. 2017;124(5):1686–1696. doi: 10.1213/ANE.0000000000002011. [DOI] [PubMed] [Google Scholar]
- 197.Sánchez AL, Martínez-Bazán C, Gutiérrez-Montes C, Criado-Hidalgo E, Pawlak G, Bradley W, Haughton V, Lasheras JC. On the bulk motion of the cerebrospinal fluid in the spinal canal. J Fluid Mech. 2018;841:203–227. [Google Scholar]
- 198.Linge S, Haughton V, Løvgren A, Mardal K, Langtangen H. Csf flow dynamics at the craniovertebral junction studied with an idealized model of the subarachnoid space and computational flow analysis. Am J Neuroradiol. 2010;31(1):185–192. doi: 10.3174/ajnr.A1766. [DOI] [PMC free article] [PubMed] [Google Scholar]
- 199.Sweetman B, Xenos M, Zitella L, Linninger AA. Three-dimensional computational prediction of cerebrospinal fluid flow in the human brain. Comput Biol Med. 2011;41(2):67–75. doi: 10.1016/j.compbiomed.2010.12.001. [DOI] [PMC free article] [PubMed] [Google Scholar]
- 200.Sass LR, Khani M, Natividad GC, Tubbs RS, Baledent O, Martin BA. A 3D subject-specific model of the spinal subarachnoid space with anatomically realistic ventral and dorsal spinal cord nerve rootlets. Fluids Barriers CNS. 2017;14(1):36. doi: 10.1186/s12987-017-0085-y. [DOI] [PMC free article] [PubMed] [Google Scholar]
- 201.Bloch R, Talalla A. A mathematical model of cerebrospinal fluid dynamics. J Neurol Sci. 1976;27(4):485–498. doi: 10.1016/0022-510x(76)90215-x. [DOI] [PubMed] [Google Scholar]
- 202.Kuttler A, Dimke T, Kern S, Helmlinger G, Stanski D, Finelli LA. Understanding pharmacokinetics using realistic computational models of fluid dynamics: biosimulation of drug distribution within the CSF space for intrathecal drugs. J Pharmacokinet Pharmacodyn. 2010;37(6):629–644. doi: 10.1007/s10928-010-9184-y. [DOI] [PMC free article] [PubMed] [Google Scholar]
- 203.Nicholson C, Chen KC, Hrabětová S, Tao L. Diffusion of molecules in brain extracellular space: theory and experiment. Prog Brain Res. 2000;125:129–154. doi: 10.1016/S0079-6123(00)25007-3. [DOI] [PubMed] [Google Scholar]
- 204.Zhan W, Xu XY. A mathematical model for thermosensitive liposomal delivery of doxorubicin to solid tumour. J Drug Deliv. 2013 doi: 10.1155/2013/172529. [DOI] [PMC free article] [PubMed] [Google Scholar]
- 205.Horn AS. Characteristics of dopamine uptake. In: Horn AS, Korf J, Westerink BHC, editors. The Neurobiology of Dopamine. London: Academic; 1979. pp. 217–235. [Google Scholar]
- 206.Tzafriri AR, Groothuis A, Price GS, Edelman ER. Stent elution rate determines drug deposition and receptor-mediated effects. J Control Release. 2012;161(3):918–926. doi: 10.1016/j.jconrel.2012.05.039. [DOI] [PMC free article] [PubMed] [Google Scholar]
- 207.McGinty S, Pontrelli G. A general model of coupled drug release and tissue absorption for drug delivery devices. J Control Release. 2015;217:327–336. doi: 10.1016/j.jconrel.2015.09.025. [DOI] [PubMed] [Google Scholar]
- 208.McGinty S, Pontrelli G. On the role of specific drug binding in modelling arterial eluting stents. J Math Chem. 2016;54(4):967–976. [Google Scholar]
- 209.Rowland M, Peck C, Tucker G. Physiologically-based pharmacokinetics in drug development and regulatory science. Annu Rev Pharmacol Toxicol. 2011;51:45–73. doi: 10.1146/annurev-pharmtox-010510-100540. [DOI] [PubMed] [Google Scholar]
- 210.Jung A, Faltermeier R, Rothoerl R, Brawanski A. A mathematical model of cerebral circulation and oxygen supply. J Math Biol. 2005;51:491–507. doi: 10.1007/s00285-005-0343-5. [DOI] [PubMed] [Google Scholar]
- 211.Linninger AA, Xenos M, Sweetman B, Ponkshe S, Guo X, Penn R. A mathematical model of blood, cerebrospinal fluid and brain dynamics. J Math Biol. 2009;218:729–759. doi: 10.1007/s00285-009-0250-2. [DOI] [PubMed] [Google Scholar]
- 212.Collins JM, Dedrick RL. Distributed model for drug delivery to CSF and brain tissue. Am J Physiol Regul Integr Comp Physiol. 1983;245(3):303–310. doi: 10.1152/ajpregu.1983.245.3.R303. [DOI] [PubMed] [Google Scholar]
- 213.Karbowski J. Scaling of brain metabolism and blood flow in relation to capillary and neural scaling. PLoS ONE. 2011;6(10):e26709. 10.1371/journal.pone.0026709. arXiv:1111.3610. [DOI] [PMC free article] [PubMed]
- 214.Meier-Ruge W, Hunziker O, Schulz U, Tobler HJ, Schweizer A. Stereological changes in the capillary network and nerve cells of the aging human brain. Mech Ageing Dev. 1980;14(1–2):233–243. doi: 10.1016/0047-6374(80)90123-2. [DOI] [PubMed] [Google Scholar]
- 215.Farkas E, Luiten PG. Cerebral microvascular pathology in aging and Alzheimer’s disease. Prog Neurobiol. 2001;64(6):575–611. doi: 10.1016/s0301-0082(00)00068-x. [DOI] [PubMed] [Google Scholar]
- 216.Metzger H, Heuber-Metzger S, Steinacker A, Strüber J. Staining PO2 measurement sites in the rat brain cortex and quantitative morphometry of the surrounding capillaries. Pflugers Arch. 1980;388(1):21–7. doi: 10.1007/BF00582624. [DOI] [PubMed] [Google Scholar]
- 217.Gross PM, Sposito NM, Pettersen SE, Fenstermacher JD. Foundation differences in function and structure of the capillary endothelium in gray matter, white matter and a circumventricular organ of rat brain. J Vasc Res. 1986;3(6):261–270. doi: 10.1159/000158652. [DOI] [PubMed] [Google Scholar]
- 218.Duvernoy H, Delon S, Vannson JL. The vascularization of the human cerebellar cortex. Brain Res Bull. 1983;11:419–480. doi: 10.1016/0361-9230(83)90116-8. [DOI] [PubMed] [Google Scholar]
- 219.Holliger C, Lemley KV, Schmitt SL, Thomas FC, Robertson CR, Jamison RL. Direct determination of vasa recta blood flow in the rat renal papilla. Circ Res. 1981;53(3):401–413. doi: 10.1161/01.res.53.3.401. [DOI] [PubMed] [Google Scholar]
- 220.Cserr H, Cooper D, Suri P, Patlak C. Efflux of radiolabeled polyethylene glycols and albumin from rat brain. Am J Physiol Renal Physiol. 1981;240(4):319–328. doi: 10.1152/ajprenal.1981.240.4.F319. [DOI] [PubMed] [Google Scholar]
- 221.Ivanov KP, Kalinina YI, Levkovich MK. Blood flow velocity in capillaries of brain and muscles and its physiological significance. Microvasc Res. 1981;22(2):143–55. doi: 10.1016/0026-2862(81)90084-4. [DOI] [PubMed] [Google Scholar]
- 222.Villringer A, Them A, Lindauer U, Einhäupl K, Dirnagl U. Capillary perfusion of the rat brain cortex. an in vivo confocal microscopy study. Circ Res. 1994;75(1):55–62. doi: 10.1161/01.res.75.1.55. [DOI] [PubMed] [Google Scholar]
- 223.Hudetz AG, Biswal BB, Fehér G, Kampine JP. Effects of hypoxia and hypercapnia on capillary flow velocity in the rat cerebral cortex. Microvasc Res. 1997;54(1):35–42. doi: 10.1006/mvre.1997.2023. [DOI] [PubMed] [Google Scholar]
- 224.Seylaz J, Charbonné R, Nanri K, Von Euw D, Borredon J, Kacem K, Méric P, Pinard E. Dynamic in vivo measurement of erythrocyte velocity and flow in capillaries and of microvessel diameter in the rat brain by confocal laser microscopy. J Cereb Blood Flow Metab. 1999;19(8):863–870. doi: 10.1097/00004647-199908000-00005. [DOI] [PubMed] [Google Scholar]
- 225.Hutchinson EB, Stefanovic B, Koretsky AP, Silva AC. Spatial flow-volume dissociation of the cerebral microcirculatory response to mild hypercapnia. Neuroimage. 2006;32(2):520–530. doi: 10.1016/j.neuroimage.2006.03.033. [DOI] [PubMed] [Google Scholar]
- 226.Itoh Y, Suzuki N. Control of brain capillary blood flow. J Cereb Blood Flow Metab. 2012;32(7):1167–1176. doi: 10.1038/jcbfm.2012.5. [DOI] [PMC free article] [PubMed] [Google Scholar]
- 227.Yamamoto Y, Välitalo PA, Wong YC, Huntjens DR, Proost JH, Vermeulen A, Krauwinkel W, Beukers MW, Kokki H, Kokki M, Danhof M, van Hasselt JGC, de Lange ECM. Prediction of human CNS pharmacokinetics using a physiologically-based pharmacokinetic modeling approach. Eur J Pharm Sci. 2018;112:168–179. doi: 10.1016/j.ejps.2017.11.011. [DOI] [PubMed] [Google Scholar]
- 228.Cornford EM, Hyman S. Localization of brain endothelial luminal and abluminal transporters with immunogold electron microscopy. NeuroRx. 2005;2(1):27–43. doi: 10.1602/neurorx.2.1.27. [DOI] [PMC free article] [PubMed] [Google Scholar]
- 229.Lentz KA, Polli JW, Wring SA, Humphreys JE, Polli JE. Influence of passive permeability on apparent p-glycoprotein kinetics. Pharm Res. 2000;17(12):1456–1460. doi: 10.1023/a:1007692622216. [DOI] [PubMed] [Google Scholar]
- 230.Hoffmann J, Fichtner I, Lemm M, Lienau P, Hess-Stumpp H, Rotgeri A, Hofmann B, Klar U. Sagopilone crosses the blood–brain barrier in vivo to inhibit brain tumor growth and metastases. Neuro-oncology. 2009;11(2):158–166. doi: 10.1215/15228517-2008-072). [DOI] [PMC free article] [PubMed] [Google Scholar]
- 231.Kumar G, Smith QR, Hokari M, Parepally J, Duncan MW. Brain uptake, pharmacokinetics, and tissue distribution in the rat of neurotoxic n-butylbenzenesulfonamide. Toxicol Sci. 2007;97(2):253–264. doi: 10.1093/toxsci/kfm057. [DOI] [PubMed] [Google Scholar]
- 232.Skipor J, Thiery J-C. The choroid plexus-cerebrospinal fluid system: undervaluated pathway of neuroendocrine signaling into the brain. Acta Neurobiol Exp (Wars) 2008;68(3):414–428. doi: 10.55782/ane-2008-1708. [DOI] [PubMed] [Google Scholar]
- 233.Westerhout J, Danhof M, Lange ECM. Preclinical prediction of human brain target site concentrations. J Pharm Sci. 2011;100(9):3577–3593. doi: 10.1002/jps.22604. [DOI] [PubMed] [Google Scholar]
- 234.Strazielle N, Ghersi-Egea J-F. Choroid plexus in the central nervous system: biology and physiopathology. J Neuropathol Exp Neurol. 2000;59(7):561–574. doi: 10.1093/jnen/59.7.561. [DOI] [PubMed] [Google Scholar]
- 235.Fung LK, Ewend MG, Sills A, Sipos EP, Thompson R, Watts M, Colvin OM, Brem H, Saltzman WM. Pharmacokinetics of interstitial delivery of carmustine, 4-hydroperoxycyclophosphamide, and paclitaxel from a biodegradable polymer implant in the monkey brain. Cancer Res. 1998;58(4):672–684. [PubMed] [Google Scholar]
- 236.Saltzman W. Interstitial transport in the brain: principles for local drug delivery. The biomedical engineering handbook. 2. Boca Raton: CRC; 2000. [Google Scholar]
- 237.Kimelberg H. Water homeostasis in the brain: basic concepts. Neuroscience. 2004;129(4):851–860. doi: 10.1016/j.neuroscience.2004.07.033. [DOI] [PubMed] [Google Scholar]
- 238.de Witte WE, Rottschäfer V, Danhof M, van der Graaf PH, Peletier LA, de Lange EC. Modelling the delay between pharmacokinetics and eeg effects of morphine in rats: binding kinetic versus effect compartment models. J Pharmacokinet Pharmacodyn. 2018;45(4):621–635. doi: 10.1007/s10928-018-9593-x. [DOI] [PMC free article] [PubMed] [Google Scholar]
- 239.Dahl G, Akerud T. Pharmacokinetics and the drug-target residence time concept. Drug Discov Today. 2013;18(15–16):697–707. doi: 10.1016/j.drudis.2013.02.010. [DOI] [PubMed] [Google Scholar]
- 240.Selvaggio G, Pearlstein RA. Biodynamics: a novel quasi-first principles theory on the fundamental mechanisms of cellular function/dysfunction and the pharmacological modulation thereof. PLoS ONE. 2018;13(11):0202376. doi: 10.1371/journal.pone.0202376. [DOI] [PMC free article] [PubMed] [Google Scholar]
- 241.Fang J. Metabolism of clozapine by rat brain: the role of flavin-containing monooxygenase (fmo) and cytochrome p450 enzymes. Eur J Drug Metab Pharmacokinet. 2000;25(2):109–114. doi: 10.1007/BF03190076. [DOI] [PubMed] [Google Scholar]
- 242.Openstax college, anatomy & physiology, openstax cnx. 2016. http://cnx.org/contents/FPtK1zmh@8.25:DcB5rjNc@3/Circulation-and-the-Central-Nervous-System. Accessed 9 Oct 2018.
- 243.Thrane AS, Thrane VR, Nedergaard M. Drowning stars: reassessing the role of astrocytes in brain edema. Trends Neurosci. 2014;37(11):620–628. doi: 10.1016/j.tins.2014.08.010. [DOI] [PMC free article] [PubMed] [Google Scholar]
- 244.National Library of Medicine (US). Genetics home reference. Bethesda (MD): The library: alveolar capillary dysplasia with misalignment of pulmonary veins; 2018. https://ghr.nlm.nih.gov/condition/alveolar-capillary-dysplasia-with-misalignment-of-pulmonary-veins. Accessed 28 Nov 2018.
- 245.911Stroke.info: A educational web site on stroke with full text journal link. http://911stroke.info/brainVesselsCorosionCast.jpg. Accessed 24 Apr 2019.
Associated Data
This section collects any data citations, data availability statements, or supplementary materials included in this article.
Data Availability Statement
Not applicable.