Abstract
Background
The tumor stroma plays pivotal roles in influencing tumor growth, invasion, and metastasis. Transcriptional signatures of colon tumor stroma (CTS) are significantly associated with prognosis of colon cancer. Thus, identification of the CTS transcriptional features could be useful for colon cancer diagnosis and therapy.
Methods
By a meta-analysis of three CTS gene expression profiles datasets, we identified differentially expressed genes (DEGs) between CTS and colon normal stroma. Furthermore, we identified the pathways, upstream regulators, and protein-protein interaction (PPI) network that were significantly associated with the DEGs. Moreover, we analyzed the enrichment levels of immune signatures in CTS. Finally, we identified CTS-associated gene signatures whose expression was significantly associated with prognosis in colon cancer.
Results
We identified numerous significantly upregulated genes (such as CTHRC1, NFE2L3, SULF1, SOX9, ENC1, and CCND1) and significantly downregulated genes (such as MYOT, ASPA, KIAA2022, ARHGEF37, BCL-2, and PPARGC1A) in CTS versus colon normal stroma. Furthermore, we identified significantly upregulated pathways in CTS that were mainly involved in cellular development, immune regulation, and metabolism, as well as significantly downregulated pathways in CTS that were mostly metabolism-related. Moreover, we identified upstream TFs (such as SUZ12, NFE2L2, RUNX1, STAT3, and SOX2), kinases (such as MAPK14, CSNK2A1, CDK1, CDK2, and CDK4), and master metabolic transcriptional regulators (MMTRs) (such as HNF1A, NFKB1, ZBTB7A, GATA2, and GATA5) regulating the DEGs. We found that CD8+ T cells were more enriched in CTS than in colon normal stroma. Interestingly, we found that many of the DEGs and their regulators were prognostic markers for colon cancer, including CEBPB, PPARGC1, STAT3, MTOR, BCL2, JAK2, and CDK1.
Conclusions
The identification of CTS-specific transcriptional signatures may provide insights into the tumor microenvironment that mediates the development of colon cancer and has potential clinical implications for colon cancer diagnosis and treatment.
1. Background
The tumor stroma is an important component of the tumor microenvironment (TME) and plays key roles in the tumor development [1]. Stromal cells are composed of many different types of cells, including vascular endothelial cells, pericytes, adipocytes, fibroblasts, osteoblasts, chondrocytes, extracellular matrix (ECM), and bone-marrow mesenchymal stromal cells [2]. The tumor stroma can promote ECM remodeling, cellular migration, neoangiogenesis, invasion, immunosurveillance evasion, and drug resistance of tumors [3]. Colorectal cancer (CRC) is the fourth most common cancer and a leading cause of cancer mortality worldwide [4]. Transcriptional signatures of CRC stromal cells have been associated with poor prognosis in CRC [5]. Isella et al. demonstrated that the gene signatures of CRC stromal cells (cancer-associated fibroblasts, leukocytes, and endothelial cells) were significantly upregulated in the stem/serrated/mesenchymal transcriptional subtype of CRC which had a poor prognosis [6]. Calon et al. showed that the CRC stromal transcriptional signatures correlated with disease relapse [5]. These prior studies exhibited the significant roles of tumor stroma in CRC growth, invasion, and metastasis.
In this study, we performed a meta-analysis of three colon tumor stromal transcriptome datasets using the bioinformatics approach. We identified differentially expressed genes (DEGs) between colon tumor stroma (CTS) and normal stroma. On the basis of these DEGs, we identified their associated pathways, upstream regulators, and protein-protein interaction (PPI) network and certain prognostic markers that were associated with survival of colon cancer patients. We also analyzed the enrichment levels of immune signatures in CTS. This study provides insights into CTS molecular features that could have clinical implications for colon cancer diagnosis and treatment.
2. Methods
2.1. Datasets
We searched the NCBI Gene Expression Omnibus (GEO) database (https://www.ncbi.nlm.nih.gov/geo/) using the keywords “colon cancer,” “stroma,” and “tumor stroma” and identified three CTS gene expression profiles datasets (GSE31279, GSE35602, and GSE46824) [7–9]. In survival analyses, we used the TCGA colon cancer dataset (https://portal.gdc.cancer.gov/) and a SurvExpress (http://bioinformatica.mty.itesm.mx/SurvExpress) built-in dataset (colon metabase) [10]. A summary of these datasets is shown in Supplementary Table S1.
2.2. Identification of DEGs between CTS and Normal Stroma
We used the web tool Network Analyst [11] to identify the DEGs between CTS and normal stroma. The ComBat method [12] in the tool was utilized to remove batch effects from the three CTS datasets (Supplementary Figure S1). Each individual dataset was normalized by base-2 log transformation and quantile normalization, and the R package “limma” was utilized to identify the DEGs between CTS and normal stroma. A meta-analysis of the three datasets was performed using Cochran's combination test [13]. The false discovery rate (FDR), calculated by the Benjamini–Hochberg method [14], was used to adjust for multiple tests. We determined the DEGs with a threshold of absolute combined effect size (ES) >0.82 and FDR<0.05.
2.3. Gene-Set Enrichment Analysis
We performed gene-set enrichment analysis of the DEGs by GSEA [15]. The KEGG pathways significantly associated with the upregulated and the downregulated DEGs were identified (FDR < 0.05), respectively.
2.4. Identification of Transcription Factors (TFs), Kinases, and Master Metabolic Transcriptional Regulators (MMTRs) That Are Significantly Associated with the DEGs
To link gene expression signatures to upstream cell signaling networks, we used eXpression2Kinases [16] to identify the upstream TFs and kinases that regulate the DEGs and utilized iRegulon [17] to identify the MMTRs of the DEGs.
2.5. Identification of PPI Network of the DEGs
We employed Network Analyst [11] to construct a PPI network of the DEGs [11]. Two types of modules (function-first modules and connection-first modules) of the PPI network were extracted. The function-first modules (FFMs) were constructed by pathway enrichment analysis and the connection-first modules (CFMs) were identified by the random walk-based algorithm [18].
2.6. Comparison of the Enrichment Levels of CD8+ T Cells between Two Classes of Samples
The enrichment level of CD8+ T cells in a sample was evaluated by the expression level of CD8A. We compared the enrichment levels of CD8+ T cells between two groups of samples using Student's t-test.
2.7. Identification of DEGs between High-Stroma-Content and Low-Stroma-Content TCGA Colon Cancer Samples
We used ESTIMATE [19] to quantify the intratumoral stromal content (stroma score) of TCGA colon cancer samples. We identified the DEGs between high-stroma-content (stroma score > median) and low-stroma-content (stroma score < median) tumors using Student's t-test.
2.8. Survival Analyses
We compared the overall survival (OS) and the disease-free survival (DFS) of colon cancer patients classified based on gene expression levels (expression levels > median versus expression levels < median). Kaplan-Meier survival curves were used to show the survival differences, and the log-rank test was utilized to evaluate the significance of survival differences. The individual prognostic genes were identified and were fitted in a multivariate Cox regression model. SurvExpress [10] was used for the multivariate survival analysis.
3. Results
3.1. Identification of DEGs between CTS and Normal Stroma
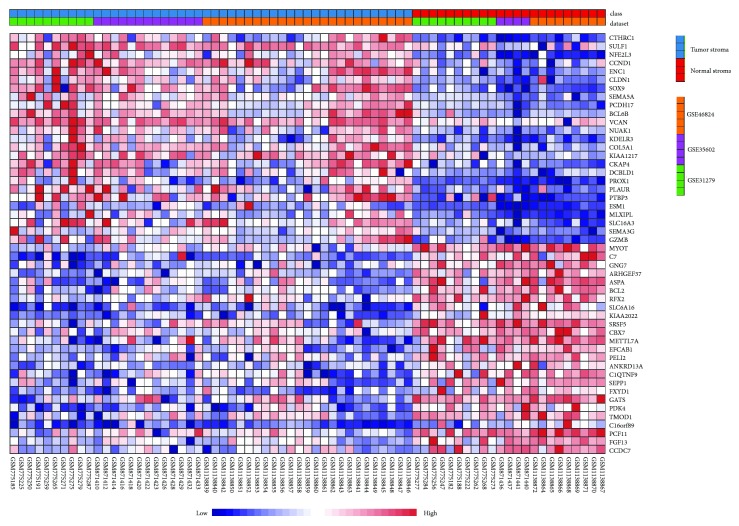
We identified 694 DEGs between CTS and normal stroma by the meta-analysis. These DEGs included 295 downregulated and 399 upregulated genes in CTS (Supplementary Tables S2 and S3). Figure 1 shows the top 25 upregulated and top 25 downregulated genes in CTS ranked on the basis of the combined ES (the detailed results of statistical analysis for the top 10 upregulated and top 10 downregulated genes in CTS are shown in Supplementary Tables S4). CTHRC1, a gene involved in vascular remodeling, bone formation, and developmental morphogenesis, was upregulated in CTS with the highest ES. It has been shown that CTHRC1 could promote human CRC cell proliferation and invasion by activating Wnt/PCP signaling [20]. This gene also plays an important role in promoting ovarian cancer cell adhesion, migration, and metastasis through the activation of integrin β3/FAK signaling [21]. NFE2L3, a gene regulating the cell cycle progression in colon cancer [22], was upregulated in CTS with the second highest ES. Interestingly, both CTHRC1 and NFE2L3 have been indicated as useful biomarker candidates for CRC diagnosis because of their overexpression in adenomas and CRC relative to normal tissue [23]. SULF1, whose expression in tumor stroma is a prognostic marker in advanced pancreatic cancer [24], was upregulated in CTS with the third highest ES. The overexpression of this gene has been associated with a poor prognosis in urothelial carcinoma [25]. SOX9, the gene upregulated in CTS with the fourth highest ES, has been shown to be overexpressed in CRC and its overexpression was an independent adverse prognosticator in CRC [26]. Some other genes upregulated in CTS have been demonstrated to be overexpressed in CRC and their expression was negatively associated with CRC prognosis, such as ENC1, CCND1, VCAN, SEMA5A, and NOS3 [27–31]. Interestingly, both PCDH17 and BCL6B were upregulated in CTS, while they had reduced expression in CRC [32, 33]. It indicates that PCDH17 and BCL6B could be specifically expressed in CTS cells but not in colon cancer cells.
Figure 1.
Gene expression pattern of the top 25 upregulated and top 25 downregulated genes in colon tumor stroma (CTS) relative to colon normal stroma ranked on the basis of the combined effect size (ES) identified by Network Analyst [11].
Many of the significantly downregulated genes in CTS have been associated with CRC [34–37]. For example, MYOT, ASPA, and KIAA2022 were downregulated in CRC [34], the downregulation of ARHGEF37 was associated with a poor prognosis in CRC [35], higher expression levels of BCL-2 were correlated with a better survival prognosis in CRC [36], and PPARGC1A was a negative predictor for CRC prognosis [37].
Altogether, a number of the abnormally expressed genes in CTS compared to colon normal stroma identified by the meta-analysis have been associated with CRC pathology and prognosis.
3.2. Identification of Pathways Significantly Associated with the DEGs
GSEA [15] identified 44 KEGG pathways that were significantly associated with the upregulated genes in CTS. These pathways were mainly involved in cellular development (p53 signaling, Wnt signaling, apoptosis, Notch signaling, focal adhesion, endocytosis, ECM-receptor interaction, cell adhesion molecules, adherens junction, tight junction, gap junction, and regulation of actin cytoskeleton), immune regulation (leukocyte transendothelial migration, complement and coagulation cascades, natural killer cell mediated cytotoxicity, Toll-like receptor, chemokine signaling, and cytokine-cytokine receptor interaction), and metabolism (purine metabolism and pyrimidine metabolism) (Figure 2, Supplementary Table S5). Previous studies have shown that some of these pathways were significantly associated with colon cancer [38–41]. For example, the Wnt and Notch pathways were associated with colon cancer development [38, 39]. The cytokine-cytokine receptor interaction pathway was significantly enriched in CRC [34]. The ECM and ECM-associated proteins [39], the glycosaminoglycan metabolism, and chondroitin sulfate/dermatan sulfate metabolism pathways played key roles in mediating tumor microenvironment [40, 41].
Figure 2.
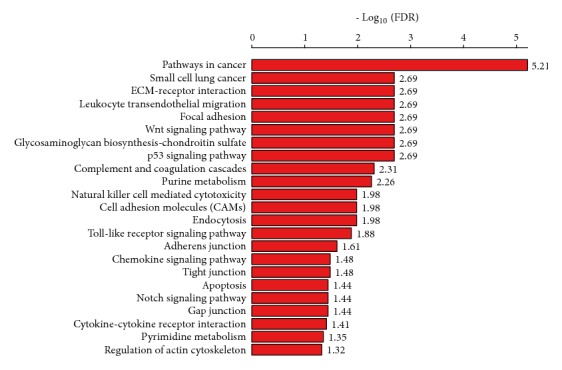
Significantly upregulated KEGG pathways in CTS relative to colon normal stroma identified by GSEA [15]. FDR: false discovery rate.
In addition, GSEA identified six KEGG pathways that were significantly associated with the downregulated genes in CTS (Supplementary Figure S2). Most of these pathways were metabolism-related, including purine metabolism, histidine metabolism, glycine, serine, and threonine metabolism, and drug metabolism-cytochrome p450. These pathways have been associated with colon and other cancers [42–44]. For example, impaired purine metabolism was associated with the progression of cancer [42]. Histidine metabolism could boost cancer therapy [43]. Cytochrome P450 enzymes were associated with the metabolism of anticancer drugs and their expression was associated with a poor prognosis in CRC patents [44].
3.3. Identification of Upstream TFs, Kinases, and MMTRs Significantly Associated with the DEGs
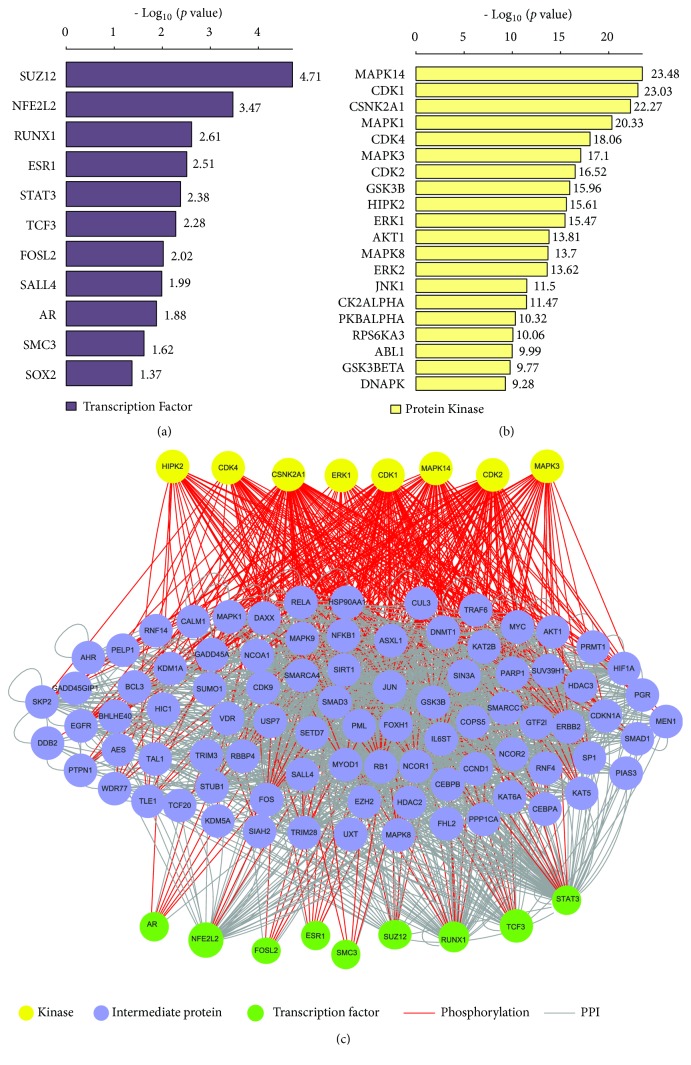
We identified 11 significant upstream TFs regulating the DEGs, including SUZ12, NFE2L2, RUNX1, ESR1, STAT3, TCF3, FOSL2, SALL4, AR, SMC3, and SOX2, of which the genes encoding RUNX1 and SALL4 were upregulated in CTS (Figure 3(a)). Most of these TFs have been associated with colon cancer [45–49]. For example, SUZ12 was the most significant upstream TF which could contribute to the CRC development [45]. RUNX1 mutations were associated with the CRC risk [46]. TCF3 and FOSL2 were associated with the tumorigenesis of CRC [47, 48]. The overexpression of SOX2 was associated with the progression and a poor prognosis in colon cancer [49].
Figure 3.
The significant upstream transcriptional factors (TFs) and kinases that regulate the differentially expressed genes (DEGs) between CTS and colon normal stroma identified by eXpression2Kinases [16]. (a) Significant upstream TFs regulating the DEGs. (b) Significant upstream kinases regulating the DEGs. (c) A TF-kinase interaction network of the significant upstream TFs and kinases regulating the DEGs.
Moreover, we identified 124 significant protein kinases that regulate the DEGs (Figure 3(b), Supplementary Table S6). These kinases mainly included cell cycle regulation kinases (CDKs), signaling MAP kinases (MAPKs, MAP2Ks, and MAP3Ks), and ribosomal kinases (RPS6KA1, RPS6KA3, and RPS6KA5). MAPK14 was the most significant upstream kinase negatively regulating the formation of colitis-associated colon tumors [50]. Furthermore, we constructed a TF-kinase interaction network of these TFs and kinases (Figure 3(c)). In the network, the most connected TFs included SUZ12, NFE2L2, RUNX1, STAT3, FOSL2, AR, SMC3, ESR1, and TCF3, and the most connected kinases included MAPK14, CDK1, CSNK2A1, CDK2, MAPK3, HIPK2, ERK1, and CDK4. It indicates that the cell cycle regulation may play a pivotal role in CTS.
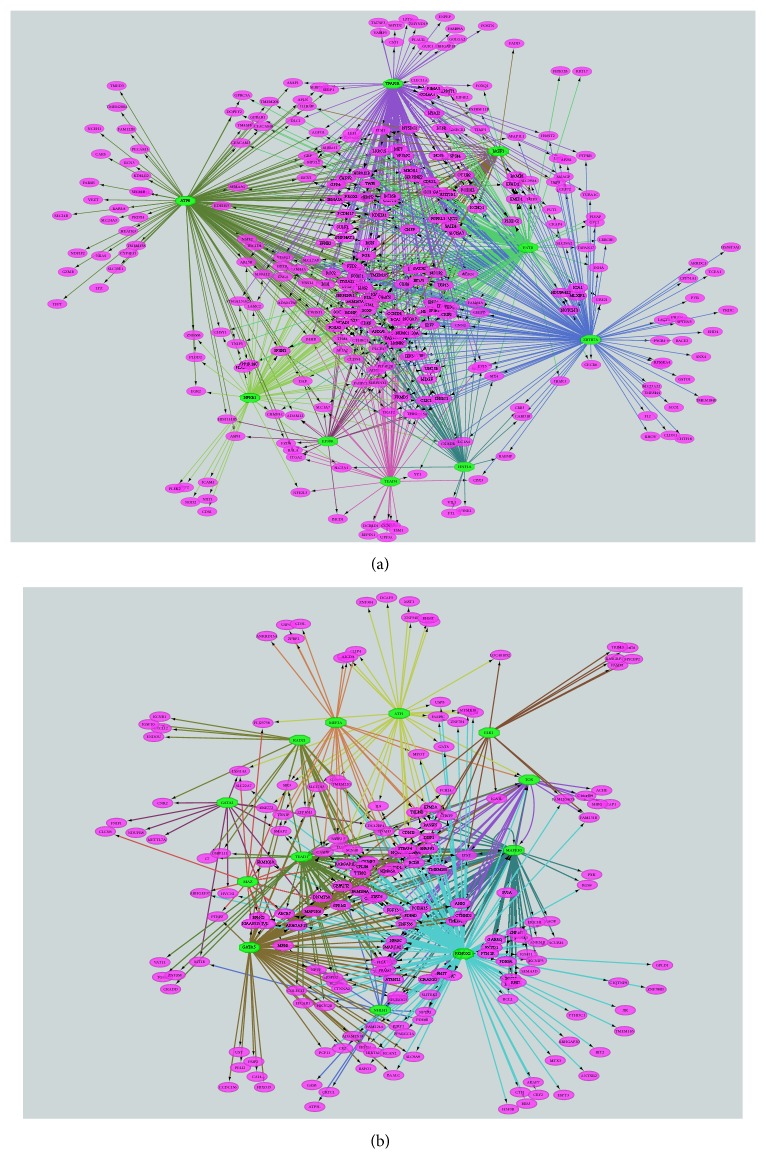
MMTRs are interesting biomarkers and targets for metabolism-targeted cancer therapy [51]. We identified 9 (HNF1A, NFKB1, ZBTB7A, ATF6, TEAD4, TFAP2B, JAZF1, FNTB, and EP300) and 12 (PKNOX2, GATA2, MAPK10, TEAD1, TOX, MEF2A, GATA5, ELK1, MAZ, NHLH1, ATF1, and RAD21) MMTRs for the upregulated and the downregulated genes in CTS, respectively (Supplementary Table S7), and built the regulatory networks associated with these MMTRs (Figure 4). In the networks, ATF6 (activating transcription factor 6), a TF regulating unfolded protein response during endoplasmic reticulum (ER) stress, targeted 163 upregulated genes, and PKNOX2 (PBX/knotted 1 homeobox 2), which plays key roles in regulating cell proliferation, differentiation, and death, targeted 131 downregulated genes. Interestingly, two members of the GATA family of TFs (GATA2 and GATA5) were the MMTRs that regulated the downregulated genes in CTS (Figure 4(b)).
Figure 4.
Regulatory networks of the master metabolic transcriptional regulators (MMTRs) and their targeted differentially expressed genes (DEGs) between CTS and normal stroma identified by iRegulon [17]. (a) Regulatory network of the MMTRs and their targeted upregulated genes in CTS. (b) Regulatory network of the MMTRs and their targeted downregulated genes in CTS. The green color octagon indicates MMTRs and purple color oval indicates DEGs.
Altogether, the identification of upstream TFs, kinases, and MMTRs significantly associated with the DEGs may provide insights into the TME that mediates the development of colon cancer.
3.4. CD8+ T Cells Are More Enriched in CTS than in Normal Stroma
We compared the enrichment levels of CD8+ T cells between CTS and normal stroma and found that CD8+ T cells showed significantly higher enrichment levels in CTS than in normal stroma (Student's t-test, p=0.016) (Figure 5). This suggests an antitumor immune response activity in the TME of colon cancer.
Figure 5.
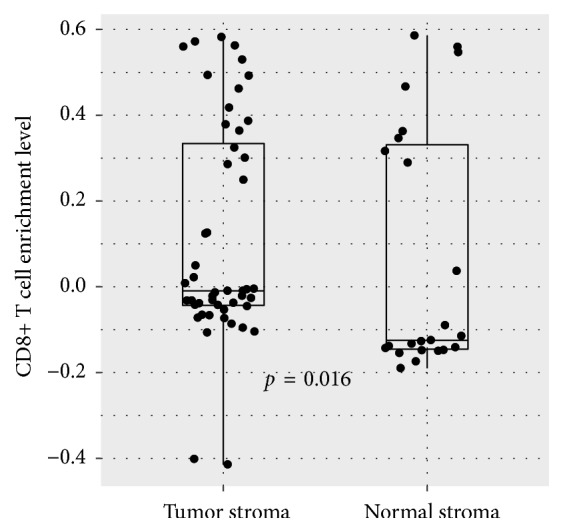
CD8+ T cells have significantly higher enrichment levels in CTS than in colon normal stroma. Student's t-test p value is shown.
3.5. Identification of Prognostic Factors in Colon Cancer Based on the DEGs and Their Upstream Regulators
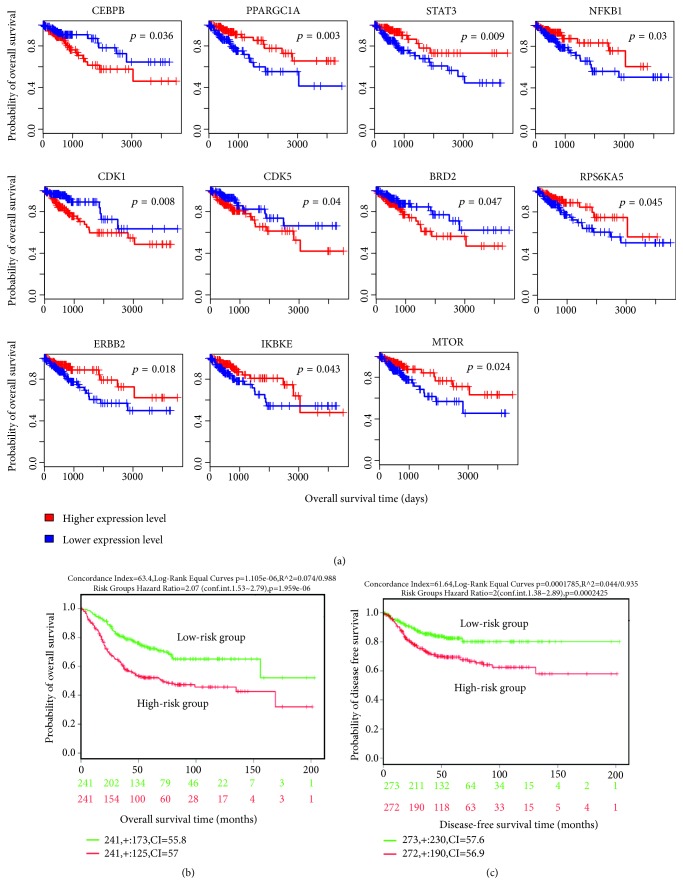
We investigated the association between the transcriptional signatures of CTS and survival prognosis (overall survival (OS) and disease-free survival (DFS)) in the TCGA colon cancer dataset. The transcriptional signatures included the top 10 upregulated and top 10 downregulated genes in CTS on the basis of ES, 45 hub genes (≥3 degrees) from the zero-order PPI network of the DEGs (Supplementary Table S8), and the genes encoding 11 TFs, 124 kinases, and 21 MMTRs regulating the DEGs. We found that the expression of many of these transcriptional signatures was significantly associated with the survival of colon cancer patients. For example, the expression of CEBPB, a gene significantly upregulated in CTS and a hub node in the PPI network, had a significant negative correlation with OS in colon cancer (Figure 6(a)). The negative correlation between CEBPB expression and survival has also been demonstrated in other cancer types, such as high-grade serous ovarian cancer [52]. PPARGC1 was significantly downregulated in CTS and was a hub node in the PPI network, while its expression had a significant positive correlation with OS in colon cancer (Figure 6(a)). PPARGC1A was indicated as a tumor suppressor in colon cancer [53] and ovarian cancer [54], as well as a negative prognostic biomarker for CRC [37]. Our data indicate that the deregulation of these genes in CTS is prognostic for colon cancer patients.
Figure 6.
The CTS gene signatures whose expression is associated with prognosis in colon cancer. (a) Kaplan-Meier survival curves show the gene signatures whose expression is significantly associated with overall survival (OS) in colon cancer in the TCGA colon cancer dataset (log-rank test, p<0.05). (b) Multivariate Cox regression analysis shows that the OS-associated CTS gene signatures are prognostic for OS in colon cancer in a SurvExpress built-in dataset (colon metabase) [10]. (c) Multivariate Cox regression analysis shows that the DFS-associated CTS gene signatures are prognostic for DFS in colon cancer in a SurvExpress built-in dataset (colon metabase) [10]. DFS: disease-free survival.
Among the upstream regulators (TFs, kinases, and MMTRs) of the DEGs, the expression of STAT3, RPS6KA5, IKBKE, ERBB2, MTOR, and NFKB1 had a positive correlation with OS in colon cancer, while the expression of CDK1, CDK5, and BRD2 had a negative correlation with OS in colon cancer (Figure 6(a)). The deregulation of these genes has been associated with tumor progression in a wide variety of cancer types [55–60].
In addition, we identified 18 transcriptional signatures of CTS whose expression was significantly associated with DFS in colon cancer individually (Supplementary Figure S3). These genes included CEBPB, BCL2, PAN2, NOS3, FTL, ARHGEF37, SMC3, EP300, JAK2, RPS6KA3, RPS6KA1, PRKACA, HIPK1, HIPK2, MAPK8, GSK3A, CLK2, and CDK3. It indicates that these CTS transcriptional signatures could be biomarkers for colon cancer relapse.
Furthermore, we used the multivariate analysis to validate the association between the prognostic CTS transcriptional signatures and survival using the colon metabase data [10]. For OS analysis, a total of 482 patients were split into two groups: high-risk group (N=241) versus low-risk group (N=241) based on the prognostic index (Supplementary Figure S4A). As expected, the high-risk group had worse OS than the low-risk group (Figure 6(b)). Similarly, for DFS analysis, we divided patients into the high-risk group (N=272) and the low-risk group (N=273) based on the prognostic index (Supplementary Figure S4B) and found that the high-risk group had worse DFS compared to the low-risk group (Figure 6(c)). These results proved the prognostic value of these CTS transcriptional signatures in colon cancer.
4. Discussion
The tumor stroma constitutes an important component of the TME that mediates tumor growth, immune evasion, and metastasis [1]. Thus, it is important to identify molecular features in the tumor stroma. To this end, we performed a meta-analysis of three CTS transcriptome datasets for identifying CTS-associated transcriptional signatures. We identified a number of upregulated and downregulated genes in CTS compared to colon normal stroma. Furthermore, we identified upregulated and downregulated pathways significantly associated with these deregulated genes in CTS. The upregulated pathways were mainly involved in cellular development, immune regulation, and metabolism, and the downregulated pathways were mostly metabolism-related. These results revealed the abnormal alterations of cellular development, immune regulation, and metabolism pathways in CTS. We found that CD8+ T cells were more enriched in CTS than in colon normal stroma, suggesting an immune infiltration microenvironment in CTS. Furthermore, we identified numerous CTS transcriptional signatures whose expression was significantly associated with prognosis in colon cancer, such as CEBPB, PPARGC1, STAT3, MTOR, BCL2, JAK2, and CDK1. These transcriptional signatures are mainly involved in immune regulation (CEBPB, STAT3, and JAK2), metabolism (PPARGC1 and MTOR), cell cycle (CDK1), and apoptosis (BCL2), suggesting that the deregulation of these pathways in CTS may contribute to the altered prognosis in colon cancer.
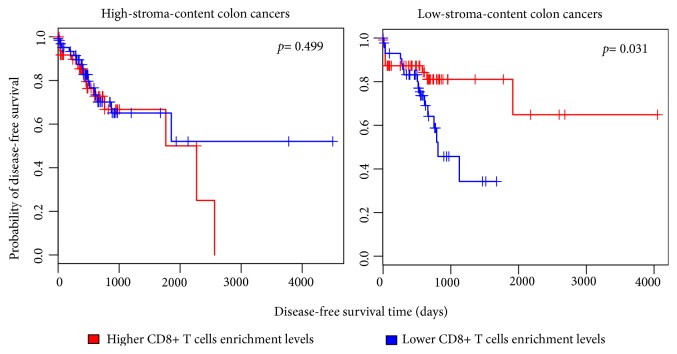
To verify the association of the identified transcriptional signatures with CTS, we analyzed the TCGA colon cancer dataset. We divided these cancers into high-stroma-content and low-stroma-content groups on the basis of their intratumoral stromal content evaluated by ESTIMATE [19] and found that 153 upregulated genes in CTS had significantly higher expression levels in the high-stroma-content group than in the low-stroma-content group. These genes included 18 hub genes in the PPI network of DEGs and 6 TFs, 40 kinases, and 12 MMTRs encoding genes that regulated the DEGs (Supplementary Figure S5, Table S9). We also found 27 downregulated genes in CTS which had significantly lower expression levels in the high-stroma-content group, including 14 hub genes, and genes encoding 2 TFs, 18 kinases, and 3 MMTRs (Supplementary Figure S5, Table S9). Interestingly, most of the downregulated hub genes in CTS were also downregulated in the high-stroma-content colon cancers (Supplementary Figure S5). These results indicate that many transcriptional signatures of CTS identified by the meta-analysis are tumor stroma-specific. In addition, we found that CD8+ T cells had significantly higher enrichment levels in CTS versus colon normal stroma (Student's t-test, p=0.016), as well as in the high-stroma-content colon cancers versus the low-stroma-content colon cancers (Student's t-test, p=3.3∗10−8). It indicates that CD8+ T cells tend to have elevated infiltration in the TME of colon cancer. Interestingly, we found that the higher enrichment levels of CD8+ T cells were associated with better DFS in the low-stroma-content colon cancers, but not in the high-stroma-content colon cancers (Figure 7). It suggests that the immune cells exert an antitumor effect only when they have infiltrated into tumor cells and that the immune cells in the tumor stroma may not have such a direct antitumor effect.
Figure 7.
The higher enrichment levels of CD8+ T cells were associated with better disease-free survival in the low-stroma-content colon cancers, but not in the high-stroma-content colon cancers. ESTIMATE [19] was used to quantify the intratumoral stromal content (stroma score) of TCGA colon cancer samples. High-stroma-content: stroma score > median; low-stroma-content: stroma score < median.
This study has identified a number of CTS-associated transcriptional signatures that could be biomarkers for colon cancer diagnosis and prognosis and may provide therapeutic targets for colon cancer. However, to translate these findings into clinical application, further experimental and clinical validation would be necessary.
5. Conclusions
The identification of CTS-specific transcriptional features may provide insights into the mechanism that mediates the development of colon cancer and thus has potential clinical implications for colon cancer diagnosis and treatment.
Acknowledgments
This work was supported by China Pharmaceutical University (grant numbers 3150120001 and 2632018YX01 to Xiaosheng Wang).
Abbreviations
- CTS:
Colon tumor stroma
- DEGs:
Differentially expressed genes
- PPI:
Protein-protein interaction
- ES:
Effect size
- TME:
Tumor microenvironment
- ECM:
Extracellular matrix
- TFs:
Transcription factors
- MMTRs:
Master metabolic transcription factors
- OS:
Overall survival
- DFS:
Disease-free survival
- CRC:
Colorectal cancer
- GEO:
Gene Expression Omnibus
- TCGA:
The Cancer Genome Atlas
- FDR:
False discovery rate
- GSEA:
Gene-set enrichment analysis
- FFM:
Function-first module
- CFM:
Connection-first module.
Data Availability
The datasets (GSE31279, GSE35602, and GSE46824) were downloaded from the NCBI GEO database (https://www.ncbi.nlm.nih.gov/geo/), the TCGA colon cancer dataset was downloaded from the website https://portal.gdc.cancer.gov/, and the colon metabase dataset was from SurvExpress (http://bioinformatica.mty.itesm.mx/SurvExpress).
Conflicts of Interest
The authors declare that they have no conflicts of interest regarding the publication of this paper.
Authors' Contributions
Md. Nazim Uddin performed data analyses and helped write and prepare the manuscript. Mengyuan Li performed data analyses and helped prepare the manuscript. Xiaosheng Wang conceived the research, designed analysis strategies, and wrote the manuscript. All the authors read and approved the final manuscript.
Supplementary Materials
Supplementary Figure S1: illustration of PCA and density plots as validation tools for batch effect removal. Plot of principal components: (A) before batch effect removal and (B) after batch effect removal. Plot of density: (C) before batch effect removal and (D) after batch effect removal. The multidimensional scaling of the datasets demonstrates that, before the batch effect adjustment, each dataset obviously separated from all the others, whereas, after batch effect adjustment, samples from all the datasets are incorporated clearly. Supplementary Figure S2: six KEEG pathways that are significantly associated with the downregulated genes in colon tumor stroma relative to normal stroma. Supplementary Figure S3: the genes (DEGs and their upstream regulators) whose expression is significantly associated with disease-free survival in colon cancer (log-rank test, p<0.05). Supplementary Figure S4: patients divided into the high-risk group and the low-risk group based on the prognostic gene signatures identified. A. Overall survival. B. Disease-free survival. Supplementary Figure S5: numbers of overlapping genes between the DEGs between colon tumor stroma and normal stroma and their upstream regulators and the DEGs between high-stroma-content and low-stroma-content colon cancers. UP TCGA: upregulated differentially expressed genes between high-stroma-content and low-stroma-content TCGA colon cancer samples and DOWN TCGA: downregulated differentially expressed genes between high-stroma-content and low-stroma-content TCGA colon cancer samples. Supplementary Table S1: a summary of the datasets used in this study. Supplementary Table S2: upregulated genes in colon tumor stroma versus colon normal stroma. Supplementary Table S3: downregulated genes in colon tumor stroma versus colon normal stroma. Supplementary Table S4: the top 10 upregulated and top 10 downregulated genes in colon tumor stroma. Supplementary Table S5: 44 KEGG pathways that were significantly associated with the upregulated genes in colon tumor stroma (CTS). Supplementary Table S6: upstream transcription factors and kinases regulating the differentially expressed genes between colon tumor stroma and normal stroma. Supplementary Table S7: master metabolic transcriptional regulators (MMTRs) (iRegulon normalized enrichment score NES > 3.0) regulating the differentially expressed genes between colon tumor stroma and normal stroma. Supplementary Table S8: hub genes in the protein-protein interaction network of the differentially expressed genes between colon tumor stroma and normal stroma. Supplementary Table S9: overlapping genes between the DEGs between colon tumor stroma and normal stroma and their upstream regulators and the DEGs between high-stroma-content and low-stroma-content colon cancers.
References
- 1.Valkenburg K. C., de Groot A. E., Pienta K. J. Targeting the tumour stroma to improve cancer therapy. Nature Reviews Clinical Oncology. 2018;15(6):366–381. doi: 10.1038/s41571-018-0007-1. [DOI] [PMC free article] [PubMed] [Google Scholar]
- 2.Bussard K. M., Mutkus L., Stumpf K., Gomez-Manzano C., Marini F. C. Tumor-associated stromal cells as key contributors to the tumor microenvironment. Breast Cancer Research. 2016;18(1):p. 84. doi: 10.1186/s13058-016-0740-2. [DOI] [PMC free article] [PubMed] [Google Scholar]
- 3.Hanahan D., Coussens L. M. Accessories to the crime: functions of cells recruited to the tumor microenvironment. Cancer Cell. 2012;21(3):309–322. doi: 10.1016/j.ccr.2012.02.022. [DOI] [PubMed] [Google Scholar]
- 4.Bray F., Ferlay J., Soerjomataram I., Siegel R. L., Torre L. A., Jemal A. Global cancer statistics 2018: GLOBOCAN estimates of incidence and mortality worldwide for 36 cancers in 185 countries. CA: A Cancer Journal for Clinicians. 2018;68(6):394–424. doi: 10.3322/caac.21492. [DOI] [PubMed] [Google Scholar]
- 5.Calon A., Lonardo E., Berenguer-Llergo A. Stromal gene expression defines poor-prognosis subtypes in colorectal cancer. Nature Genetics. 2015;47:320–329. doi: 10.1038/ng.3225. [DOI] [PubMed] [Google Scholar]
- 6.Isella C., Terrasi A., Bellomo S. E., et al. Stromal contribution to the colorectal cancer transcriptome. Nature Genetics. 2015;47(4):312–319. doi: 10.1038/ng.3224. [DOI] [PubMed] [Google Scholar]
- 7.Abba M., Laufs S., Aghajany M., Korn B., Benner A., Allgayer H. Look who's talking: Deregulated signaling in colorectal cancer. Cancer Genomics & Proteomics. 2012;9(1):15–25. [PubMed] [Google Scholar]
- 8.Nishida N., Nagahara M., Sato T., et al. Microarray analysis of colorectal cancer stromal tissue reveals upregulation of two oncogenic miRNA clusters. Clinical Cancer Research. 2012;18(11):3054–3070. doi: 10.1158/1078-0432.CCR-11-1078. [DOI] [PubMed] [Google Scholar]
- 9.GEO Accession viewer. https://www.ncbi.nlm.nih.gov/geo/query/acc.cgi?acc=GSE46824.
- 10.Aguirre-Gamboa R., Gomez-Rueda H., Martínez-Ledesma E., et al. SurvExpress: an online biomarker validation tool and database for cancer gene expression data using survival analysis. PLoS ONE. 2013;8(9):p. e74250. doi: 10.1371/journal.pone.0074250. [DOI] [PMC free article] [PubMed] [Google Scholar]
- 11.Xia J., Gill E. E., Hancock R. E. W. NetworkAnalyst for statistical, visual and network-based meta-analysis of gene expression data. Nature Protocols. 2015;10(6):823–844. doi: 10.1038/nprot.2015.052. [DOI] [PubMed] [Google Scholar]
- 12.Johnson W. E., Li C., Rabinovic A. Adjusting batch effects in microarray expression data using empirical Bayes methods. Biostatistics. 2007;8(1):118–127. doi: 10.1093/biostatistics/kxj037. [DOI] [PubMed] [Google Scholar]
- 13.Cochran W. G. The combination of estimates from different experiments. Biometrics. 1954;10(1):101–129. [Google Scholar]
- 14.Benjamini Y., Hochberg Y. Controlling the false discovery rate: a practical and powerful approach to multiple testing. Journal of the Royal Statistical Society B: Methodological. 1995;57(1):289–300. [Google Scholar]
- 15.Subramanian A., Tamayo P., Mootha V. K., et al. Gene set enrichment analysis: a knowledge-based approach for interpreting genome-wide expression profiles. Proceedings of the National Acadamy of Sciences of the United States of America. 2005;102(43):15545–15550. doi: 10.1073/pnas.0506580102. [DOI] [PMC free article] [PubMed] [Google Scholar]
- 16.Clarke D. J. B., Kuleshov M. V., Schilder B. M., et al. EXpression2Kinases (X2K) Web: Linking expression signatures to upstream cell signaling networks. Nucleic Acids Research. 2018;46(W1):W171–W179. doi: 10.1093/nar/gky458. [DOI] [PMC free article] [PubMed] [Google Scholar]
- 17.Janky R., Verfaillie A., Imrichová H., et al. iRegulon: from a gene list to a gene regulatory network using large motif and track collections. PLoS Computational Biology. 2014;10(7) doi: 10.1371/journal.pcbi.1003731.e1003731 [DOI] [PMC free article] [PubMed] [Google Scholar]
- 18.Petrochilos D., Shojaie A., Gennari J., Abernethy N. Using random walks to identify cancer-associated modules in expression data. BioData Mining. 2013;6:p. 17. doi: 10.1186/1756-0381-6-17. [DOI] [PMC free article] [PubMed] [Google Scholar]
- 19.Yoshihara K., Shahmoradgoli M., Martínez E., et al. Inferring tumour purity and stromal and immune cell admixture from expression data. Nature Communications. 2013;4:p. 2612. doi: 10.1038/ncomms3612. [DOI] [PMC free article] [PubMed] [Google Scholar]
- 20.Yang X.-M., You H.-Y., Li Q., et al. CTHRC1 promotes human colorectal cancer cell proliferation and invasiveness by activating Wnt/PCP signaling. International Journal of Clinical and Experimental Pathology. 2015;8(10):12793–12801. [PMC free article] [PubMed] [Google Scholar]
- 21.Guo B., Yan H., Li L., Yin K., Ji F., Zhang S. Collagen triple helix repeat containing 1 (CTHRC1) activates Integrin β3/FAK signaling and promotes metastasis in ovarian cancer. Journal of Ovarian Research. 2017;10(1):p. 69. doi: 10.1186/s13048-017-0358-8. [DOI] [PMC free article] [PubMed] [Google Scholar]
- 22.Chowdhury A. M., Katoh H., Hatanaka A., et al. Multiple regulatory mechanisms of the biological function of NRF3 (NFE2L3) control cancer cell proliferation. Scientific Reports. 2017;7(1):p. 12494. doi: 10.1038/s41598-017-12675-y. [DOI] [PMC free article] [PubMed] [Google Scholar]
- 23.Palma M., Lopez L., García M., et al. Detection of collagen triple helix repeat containing-1 and nuclear factor (erythroid-derived 2)-like 3 in colorectal cancer. BMC Clinical Pathology. 2012;12:p. 2. doi: 10.1186/1472-6890-12-2. [DOI] [PMC free article] [PubMed] [Google Scholar]
- 24.Gill R. M. S., Michael A., Westley L., Kocher H. M., Murphy J. I., Dhoot G. K. SULF1/SULF2 splice variants differentially regulate pancreatic tumour growth progression. Experimental Cell Research. 2014;324(2):157–171. doi: 10.1016/j.yexcr.2014.04.001. [DOI] [PubMed] [Google Scholar]
- 25.Lee H., Yeh B., Chan T., et al. Sulfatase-1 overexpression indicates poor prognosis in urothelial carcinoma of the urinary bladder and upper tract. Oncotarget. 2017;8(29):47216–47229. doi: 10.18632/oncotarget.17590. [DOI] [PMC free article] [PubMed] [Google Scholar]
- 26.Lü B., Fang Y., Xu J., et al. Analysis of SOX9 expression in colorectal cancer. American Journal of Clinical Pathology. 2008;130(6):897–904. doi: 10.1309/AJCPW1W8GJBQGCNI. [DOI] [PubMed] [Google Scholar]
- 27.Arikan S., Cacina C., Guler E., Çulcu S., Tuna G., Yaylim-Eraltan I. The effects of NOS3 Glu298Asp variant on colorectal cancer risk and progression in Turkish population. Molecular Biology Reports. 2012;39(3):3245–3249. doi: 10.10.1007/s11033-011-1092-8. doi: 10.10.1007/s11033-011-1092-8. [DOI] [PubMed] [Google Scholar]
- 28.Chida S., Okayama H., Noda M., et al. Stromal VCAN expression as a potential prognostic biomarker for disease recurrence in stage II-III colon cancer. Carcinogenesis. 2016;37(9):878–887. doi: 10.1093/carcin/bgw069. [DOI] [PubMed] [Google Scholar]
- 29.Demirkol S., Gomceli I., Isbilen M., et al. A combined ULBP2 and SEMA5A expression signature as a prognostic and predictive biomarker for colon cancer. Journal of Cancer. 2017;8(7):1113–1122. doi: 10.7150/jca.17872. [DOI] [PMC free article] [PubMed] [Google Scholar]
- 30.Fujita M., Furukawa Y., Tsunoda T., Tanaka T., Ogawa M., Nakamura Y. Up-regulation of the ectodermal-neural cortex 1 (ENC1) gene, a downstream target of the β-catenin/T-cell factor complex, in colorectal carcinomas. Cancer Research. 2001;61(21):7722–7726. [PubMed] [Google Scholar]
- 31.Li Y., Wei J., Xu C., Zhao Z., You T. Prognostic significance of cyclin D1 expression in colorectal cancer: a meta-analysis of observational studies. PLoS ONE. 2014;9(4) doi: 10.1371/journal.pone.0094508.e94508 [DOI] [PMC free article] [PubMed] [Google Scholar]
- 32.Hu X., Sui X., Li L., et al. Protocadherin 17 acts as a tumour suppressor inducing tumour cell apoptosis and autophagy, and is frequently methylated in gastric and colorectal cancers. The Journal of Pathology. 2013;229(1):62–73. doi: 10.1002/path.4093. [DOI] [PubMed] [Google Scholar]
- 33.Gu Y., Li A., Sun H., et al. BCL6B suppresses proliferation and migration of colorectal carcinoma cells through inhibition of the PI3K/AKT signaling pathway. International Journal of Molecular Medicine. 2018;41(5):2660–2668. doi: 10.3892/ijmm.2018.3451. [DOI] [PMC free article] [PubMed] [Google Scholar]
- 34.Guo Y., Bao Y., Ma M., Yang W. Identification of key candidate genes and pathways in colorectal cancer by integrated bioinformatical analysis. International Journal of Molecular Sciences. 2017;18(4) doi: 10.3390/ijms18040722. [DOI] [PMC free article] [PubMed] [Google Scholar]
- 35.Sun Q., Li M., Wang X. The Cancer Omics Atlas: An integrative resource for cancer omics annotations. BMC Medical Genomics. 2018;11(1):p. 63. doi: 10.1186/s12920-018-0381-7. [DOI] [PMC free article] [PubMed] [Google Scholar]
- 36.Huang Q., Li S., Cheng P., et al. High expression of anti-apoptotic protein Bcl-2 is a good prognostic factor in colorectal cancer: result of a meta-analysis. World Journal of Gastroenterology. 2017;23(27):5018–5033. doi: 10.3748/wjg.v23.i27.5018. [DOI] [PMC free article] [PubMed] [Google Scholar]
- 37.Yun S.-H., Roh M.-S., Jeong J.-S., Park J.-I. Peroxisome proliferator-activated receptor γ coactivator-1α is a predictor of lymph node metastasis and poor prognosis in human colorectal cancer. Annals of Diagnostic Pathology. 2018;33:11–16. doi: 10.1016/j.anndiagpath.2017.11.007. [DOI] [PubMed] [Google Scholar]
- 38.Bertrand F. E., Angus C. W., Partis W. J., Sigounas G. Developmental pathways in colon cancer. Cell Cycle. 2012;11(23):4344–4351. doi: 10.4161/cc.22134. [DOI] [PMC free article] [PubMed] [Google Scholar]
- 39.Socovich A. M., Naba A. The cancer matrisome: From comprehensive characterization to biomarker discovery. Seminars in Cell & Developmental Biology. 2018 doi: 10.1016/j.semcdb.2018.06.005. [DOI] [PubMed] [Google Scholar]
- 40.Afratis N., Gialeli C., Nikitovic D., et al. Glycosaminoglycans: key players in cancer cell biology and treatment. FEBS Journal. 2012;279:1177–1197. doi: 10.1111/j.1742-4658.2012.08529.x. [DOI] [PubMed] [Google Scholar]
- 41.Basappa, Rangappa K. S., Sugahara K. Roles of glycosaminoglycans and glycanmimetics in tumor progression and metastasis. Glycoconjugate Journal. 2014;31(6-7):461–467. doi: 10.1007/s10719-014-9551-9. [DOI] [PubMed] [Google Scholar]
- 42.Yin J., Ren W., Huang X., Deng J., Li T., Yin Y. Potential mechanisms connecting purine metabolism and cancer therapy. Frontiers in Immunology. 2018;9 doi: 10.3389/fimmu.2018.01697. [DOI] [PMC free article] [PubMed] [Google Scholar]
- 43.Frezza C. Histidine metabolism boosts cancer therapy. Nature. 2018;559(7715):484–485. doi: 10.1038/d41586-018-05573-4. [DOI] [PMC free article] [PubMed] [Google Scholar]
- 44.Kumarakulasingham M., Rooney P. H., Dundas S. R., et al. Cytochrome P450 profile of colorectal cancer: Identification of markers of prognosis. Clinical Cancer Research. 2005;11(10):3758–3765. doi: 10.1158/1078-0432.CCR-04-1848. [DOI] [PubMed] [Google Scholar]
- 45.Liu Y.-L., Gao X., Jiang Y., et al. Expression and clinicopathological significance of EED, SUZ12 and EZH2 mRNA in colorectal cancer. Journal of Cancer Research and Clinical Oncology. 2015;141(4):661–669. doi: 10.1007/s00432-014-1854-5. [DOI] [PubMed] [Google Scholar]
- 46.Slattery M. L., Lundgreen A., Herrick J. S., Caan B. J., Potter J. D., Wolff R. K. Associations between genetic variation in RUNX1, RUNX2, RUNX3, MAPK1 and eIF4E and risk of colon and rectal cancer: additional support for a TGF-β-signaling pathway. Carcinogenesis. 2011;32(3):318–326. doi: 10.1093/carcin/bgq245. [DOI] [PMC free article] [PubMed] [Google Scholar]
- 47.Taniue K., Kurimoto A., Takeda Y., et al. ASBEL –TCF3 complex is required for the tumorigenicity of colorectal cancer cells. Proceedings of the National Acadamy of Sciences of the United States of America. 2016;113(45):12739–12744. doi: 10.1073/pnas.1605938113. [DOI] [PMC free article] [PubMed] [Google Scholar]
- 48.Bae T., Rho K., Choi J. W., Horimoto K., Kim W., Kim S. Identification of upstream regulators for prognostic expression signature genes in colorectal cancer. BMC Systems Biology. 2013;7(1):p. 86. doi: 10.1186/1752-0509-7-86. [DOI] [PMC free article] [PubMed] [Google Scholar]
- 49.Miller T. J., McCoy M. J., Hemmings C., Bulsara M. K., Iacopetta B., Platell C. F. The prognostic value of cancer stem-like cell markers SOX2 and CD133 in stage III colon cancer is modified by expression of the immune-related markers FoxP3, PD-L1 and CD3. Pathology. 2017;49(7):721–730. doi: 10.1016/j.pathol.2017.08.007. [DOI] [PubMed] [Google Scholar]
- 50.Gupta J., delBarcoBarrantes I., Igea A., et al. Dual function of p38α MAPK in colon cancer: suppression of colitis-associated tumor initiation but requirement for cancer cell survival. Cancer Cell. 2014;25(4):484–500. doi: 10.1016/j.ccr.2014.02.019. [DOI] [PubMed] [Google Scholar]
- 51.Rosario S. R., Long M. D., Affronti H. C., Rowsam A. M., Eng K. H., Smiraglia D. J. Pan-cancer analysis of transcriptional metabolic dysregulation using the cancer genome atlas. Nature Communications. 2018;9 doi: 10.1038/s41467-018-07232-8. [DOI] [PMC free article] [PubMed] [Google Scholar]
- 52.Liu D., Zhang X.-X., Li M.-C., et al. C/EBPβ enhances platinum resistance of ovarian cancer cells by reprogramming H3K79 methylation. Nature Communications. 2018;9(1):p. 1739. doi: 10.1038/s41467-018-03590-5. [DOI] [PMC free article] [PubMed] [Google Scholar]
- 53.Feilchenfeldt J., Bründler M.-A., Soravia C., Tötsch M., Meier C. A. Peroxisome proliferator-activated receptors (PPARs) and associated transcription factors in colon cancer: reduced expression of PPARgamma-coactivator 1 (PGC-1) Cancer Letters. 2014;203(1):25–33. doi: 10.1016/j.canlet.2003.08.024. [DOI] [PubMed] [Google Scholar]
- 54.Zhang Y., Ba Y., Liu C., et al. PGC-1alpha induces apoptosis in human epithelial ovarian cancer cells through a PPARgamma-dependent pathway. Cell Research. 2007;17(4):363–373. doi: 10.1038/cr.2007.11. [DOI] [PubMed] [Google Scholar]
- 55.Concetti J., Wilson C. L. NFKB1 and cancer: friend or foe? Cells. 2018;7(9) doi: 10.3390/cells7090133. [DOI] [PMC free article] [PubMed] [Google Scholar]
- 56.Saini U., Naidu S., Elnaggar A. C., et al. Elevated STAT3 expression in ovarian cancer ascites promotes invasion and metastasis: A potential therapeutic target. Oncogene. 2017;36(2):168–181. doi: 10.1038/onc.2016.197. [DOI] [PMC free article] [PubMed] [Google Scholar]
- 57.Yang W. J., Qu Y., Tan B. X., et al. Prognostic significance of preoperative IKBKE expression in esophageal squamous cell carcinoma. OncoTargets and Therapy. 2018;11:1305–1314. doi: 10.2147/OTT.S156818. [DOI] [PMC free article] [PubMed] [Google Scholar]
- 58.Sung W., Lin Y., Wu P., et al. High nuclear/cytoplasmic ratio of Cdk1 expression predicts poor prognosis in colorectal cancer patients. BMC Cancer. 2014;14:p. 951. doi: 10.1186/1471-2407-14-951. [DOI] [PMC free article] [PubMed] [Google Scholar]
- 59.Zhuang K., Zhang J., Xiong M., et al. CDK5 functions as a tumor promoter in human colorectal cancer via modulating the ERK5–AP-1 axis. Cell Death & Disease. 2016;7(10):p. e2415. doi: 10.1038/cddis.2016.333. [DOI] [PMC free article] [PubMed] [Google Scholar]
- 60.Hu Y., Zhou J., Ye F., et al. BRD4 inhibitor inhibits colorectal cancer growth and metastasis. International Journal of Molecular Sciences. 2015;16(1):1928–1948. doi: 10.3390/ijms16011928. [DOI] [PMC free article] [PubMed] [Google Scholar]
Associated Data
This section collects any data citations, data availability statements, or supplementary materials included in this article.
Supplementary Materials
Supplementary Figure S1: illustration of PCA and density plots as validation tools for batch effect removal. Plot of principal components: (A) before batch effect removal and (B) after batch effect removal. Plot of density: (C) before batch effect removal and (D) after batch effect removal. The multidimensional scaling of the datasets demonstrates that, before the batch effect adjustment, each dataset obviously separated from all the others, whereas, after batch effect adjustment, samples from all the datasets are incorporated clearly. Supplementary Figure S2: six KEEG pathways that are significantly associated with the downregulated genes in colon tumor stroma relative to normal stroma. Supplementary Figure S3: the genes (DEGs and their upstream regulators) whose expression is significantly associated with disease-free survival in colon cancer (log-rank test, p<0.05). Supplementary Figure S4: patients divided into the high-risk group and the low-risk group based on the prognostic gene signatures identified. A. Overall survival. B. Disease-free survival. Supplementary Figure S5: numbers of overlapping genes between the DEGs between colon tumor stroma and normal stroma and their upstream regulators and the DEGs between high-stroma-content and low-stroma-content colon cancers. UP TCGA: upregulated differentially expressed genes between high-stroma-content and low-stroma-content TCGA colon cancer samples and DOWN TCGA: downregulated differentially expressed genes between high-stroma-content and low-stroma-content TCGA colon cancer samples. Supplementary Table S1: a summary of the datasets used in this study. Supplementary Table S2: upregulated genes in colon tumor stroma versus colon normal stroma. Supplementary Table S3: downregulated genes in colon tumor stroma versus colon normal stroma. Supplementary Table S4: the top 10 upregulated and top 10 downregulated genes in colon tumor stroma. Supplementary Table S5: 44 KEGG pathways that were significantly associated with the upregulated genes in colon tumor stroma (CTS). Supplementary Table S6: upstream transcription factors and kinases regulating the differentially expressed genes between colon tumor stroma and normal stroma. Supplementary Table S7: master metabolic transcriptional regulators (MMTRs) (iRegulon normalized enrichment score NES > 3.0) regulating the differentially expressed genes between colon tumor stroma and normal stroma. Supplementary Table S8: hub genes in the protein-protein interaction network of the differentially expressed genes between colon tumor stroma and normal stroma. Supplementary Table S9: overlapping genes between the DEGs between colon tumor stroma and normal stroma and their upstream regulators and the DEGs between high-stroma-content and low-stroma-content colon cancers.
Data Availability Statement
The datasets (GSE31279, GSE35602, and GSE46824) were downloaded from the NCBI GEO database (https://www.ncbi.nlm.nih.gov/geo/), the TCGA colon cancer dataset was downloaded from the website https://portal.gdc.cancer.gov/, and the colon metabase dataset was from SurvExpress (http://bioinformatica.mty.itesm.mx/SurvExpress).


