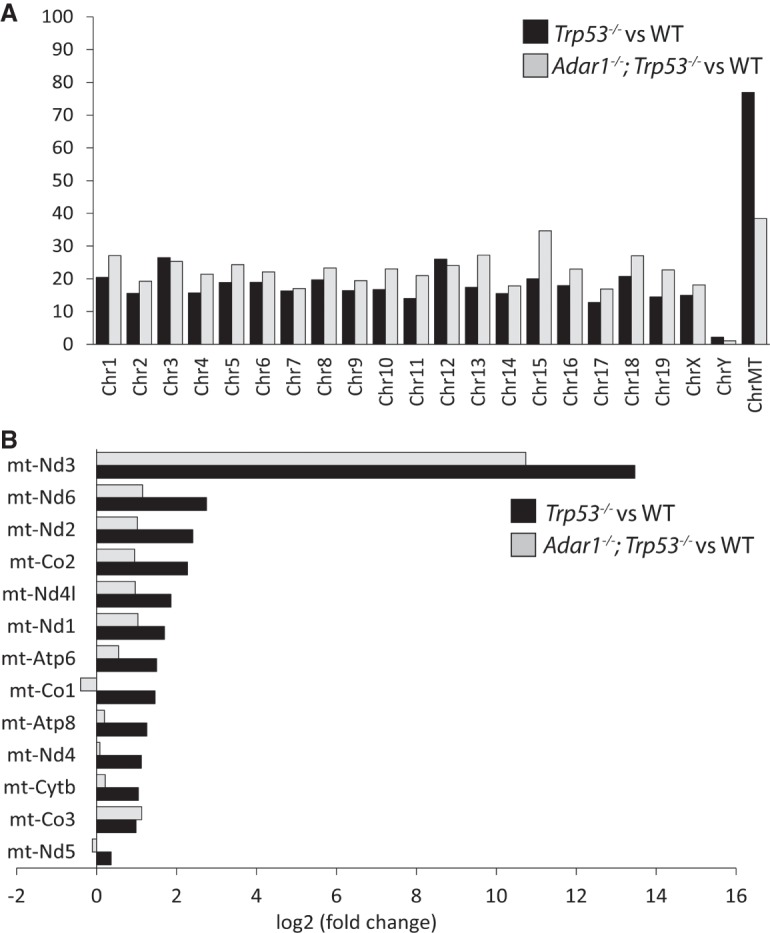
FIGURE 4.

Sequences enriched in immunogenic dsRNA purified from untreated Trp53 versus wild-type and Adar1;Trp53 versus wild-type MEFs. (A) Chromosome-wise coverage showing the number of differentially expressed protein-coding genes, normalized to the total number of protein-coding genes on each chromosome. (B) Differential expression levels of differentially expressed genes mapped to the mitochondrial chromosome. All genes with an adjusted P-value <0.05 were considered as differentially expressed. Data are average of three independent experiments.
