Abstract
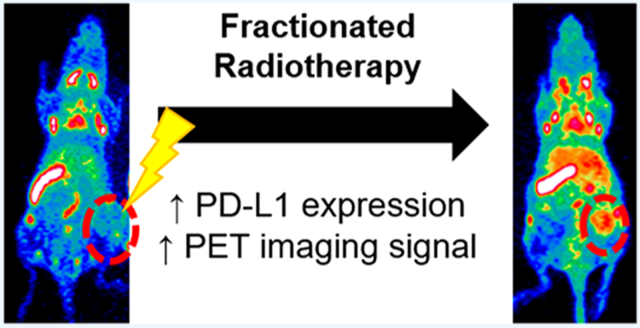
Immune checkpoint expression is highly dynamic, and combination treatments including radiotherapy can particularly modulate this expression. PET imaging using 89Zr–Df–atezolizumab can provide insight into the levels of PD-L1 variation following radiotherapy treatments. In vitro screening was used to monitor PD-L1 expression by lung cancer cells following radiotherapy. Mice bearing PD-L1+ (H460) or PD-L1− (A549) tumors were subjected to various external beam radiotherapy regimens and then imaged using 89Zr–Df–atezolizumab PET. ROI analysis and ex vivo biodistribution studies were employed to quantify tracer accumulations. H460 cells were found to have PD-L1 expression at baseline, and this expression increased following daily radiotherapy of 5 fractions of 2 Gy. PD-L1 expression could not be induced on A549 cells, regardless of radiotherapy regimen. The increase in PD-L1 expression in H460 tumors following fractionated radiotherapy could be imaged in vivo using 89Zr–Df–atezolizumab, with statistically significant higher tracer accumulation noted in fractionated H460 tumors over that in all other H460 or A549 groups after 72 h postinjection of the tracer. Significant accumulation of the tracer was also noted in other PD-L1+ organs, including the spleen and lymph nodes. Ex vivo staining of tumor tissues verified that tumor cells as well as tumor-infiltrating immune cells were responsible for increased PD-L1 expression after radiotherapy in tumor tissues. Overall, PD-L1 expression can be modulated with radiotherapy interventions, and 89Zr–Df–atezolizumab is able to noninvasively monitor these changes in preclinical models.
Graphical Abstract
INTRODUCTION
Although immune checkpoint treatments have shown promising efficacy, the problems of resistance and relapse often require their combination with other treatment options.1 In particular, combinations of immunotherapy and radiotherapy have enabled systematic treatment of many cancers.2,3 Although synergistic effects have been noted with this combination, the mechanisms and dynamic processes involved are still largely a mystery.
The programmed death protein 1 (PD-1) pathway, in particular, has been implicated as important in the synergy of radiotherapy and immunotherapy.4,5 Consistent with the inflammation that results from radiotherapy, programmed death protein ligand 1 (PD-L1) is upregulated on irradiated tumor tissues and, if left unchecked, has been shown to contribute to radiotherapy resistance. Blockade of the PD-1/PD-L1 pathway in combination with radiotherapy can reduce the presence of tumor-infiltrating myeloid-derived suppressor cells in order to maintain T-cell activity,4,6 and such trends have been demonstrated in a wide variety of cancer types.7,8 Because the majority of cancer patients receive some form of radiotherapy, a greater understanding of synergistic therapies is greatly warranted, in order to increase the proportion of patients receiving curative treatments.
Currently, PD-L1 status is determined through biopsy and immunohistochemistry analysis; however, it is becoming increasingly clear that immune checkpoint targets are highly dynamic, and single time-point biopsies cannot provide adequate information on their expression throughout a treatment regimen. Therefore, techniques such as molecular imaging are increasingly being applied to provide real-time, longitudinal information about the expression of these targets,9 complementing existing immunohistochemical techniques. Recent clinical studies have verified the potential of PD-L1 PET imaging in cancer patients, finding correlations with patient outcomes and tracer accumulation levels.10,11 Enabling visualization of these molecules’ expression and their changes with different therapies will therefore certainly provide scientific insight into the mechanisms of synergy but also may help guide more rational treatment decisions for cancer patients. We herein therefore developed a PD-L1-targeting positron emission tomography (PET) tracer, reactive to both human and murine PD-L1, and demonstrated that we can image clinically relevant changes in tumor PD-L1 expression following radiotherapy, even in the presence of high uptake in lymphatic organs.
RESULTS
In Vitro PD-L1 Expression Analysis.
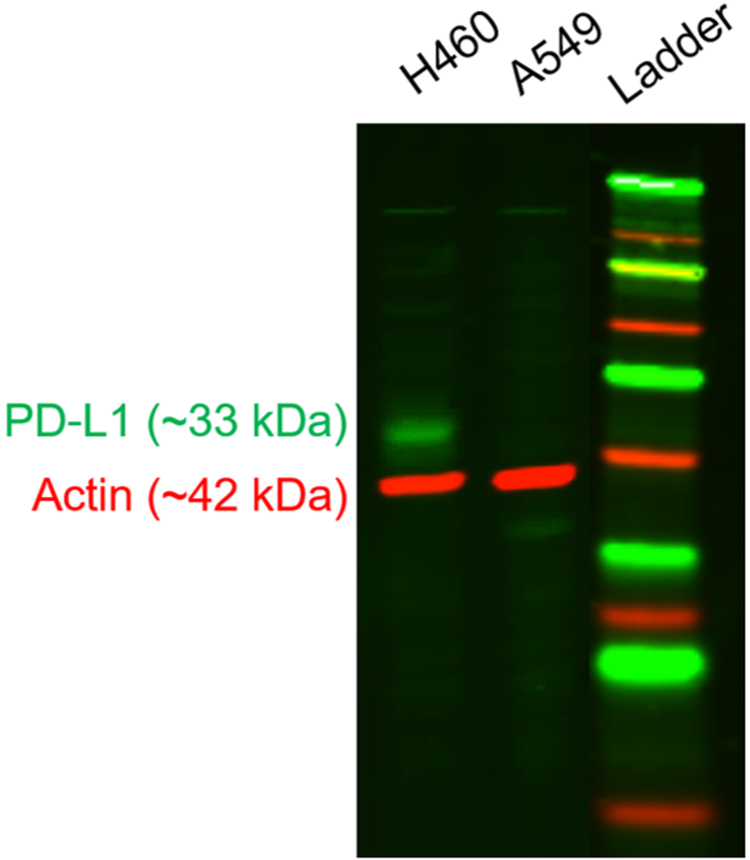
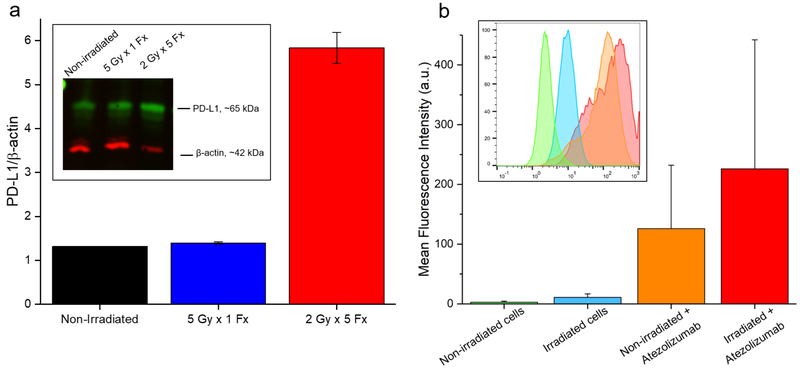
Screening of H460 and A549 lung cancer cells revealed notable expression of PD-L1 at baseline by H460 cells that was absent in the other line (Figure 1). Therefore, H460 cells formed the basis for the majority of these studies, and A549 cells served as a negative control. Following irradiation of H460 cells in vitro, Western blot analysis revealed upregulated PD-L1 expression in the 2 Gy × 5 Fx group (Figure 2). An over 4-fold increase in the PD-L1/β-actin ratio was observed at 24 h after completion of this fractionated regimen. Similar levels of PD-L1 were measured in the 5 Gy × 1 Fx group and the control, indicating that fractionated radiotherapy was more effective at inducing PD-L1. These findings were mimicked in flow cytometry analyses as well, with a shift toward higher PD-L1 staining noted after fractionated radiotherapy.
Figure 1.
PD-L1 screen. A representative Western blot analysis of PD-L1 expression by naïve lung cancer cells.
Figure 2.
In vitro PD-L1 studies. (A) Analysis of Western blot data shows a trend toward higher expression of PD-L1 in H460 cells receiving 5 Fx of 2 Gy; n = 3 replicates. (B) Flow cytometry of H460 cells similarly shows a slight shift (p > 0.05) toward higher PD-L1 expression following fractionated irradiation.
PET Imaging Visualizes PD-L1 Expression Changes.
Following completion of the respective radiotherapy regimens, 24 h later, mice were administered 89Zr–Df–atezolizumab through tail vein injection. Serial PET scans were then conducted to visualize the distribution of PD-L1 expressing tissues.
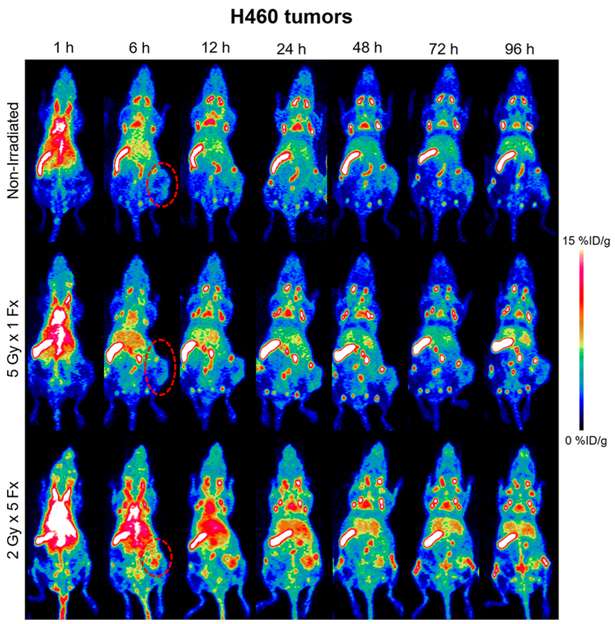
Several trends were evident following analysis of H460-bearing mouse images. Most notably, the PD-L1 tracer accumulated to a very high level in the spleen (18–19%ID/g at 96 h) and lymph nodes (8–12%ID/g at 96 h) of all tumor-bearing mice, to a similar extent regardless of the radiotherapy treatment arm (Figures 3 and S2, n = 4–5). This enabled clear visualization of the entire lymph node network with high contrast, especially at later time points. The uptake of the tracer in all other normal organs was similar across all groups and below 10%ID/g at 96 h.
Figure 3.
H460 PD-L1 PET. Longitudinal PET imaging of mice with H460 tumors following injection of 89Zr–Df–atezolizumab shows the highest tumor uptake in the 2 Gy × 5 Fx group. Tumors are indicated by red dashed circles in the MIPs.
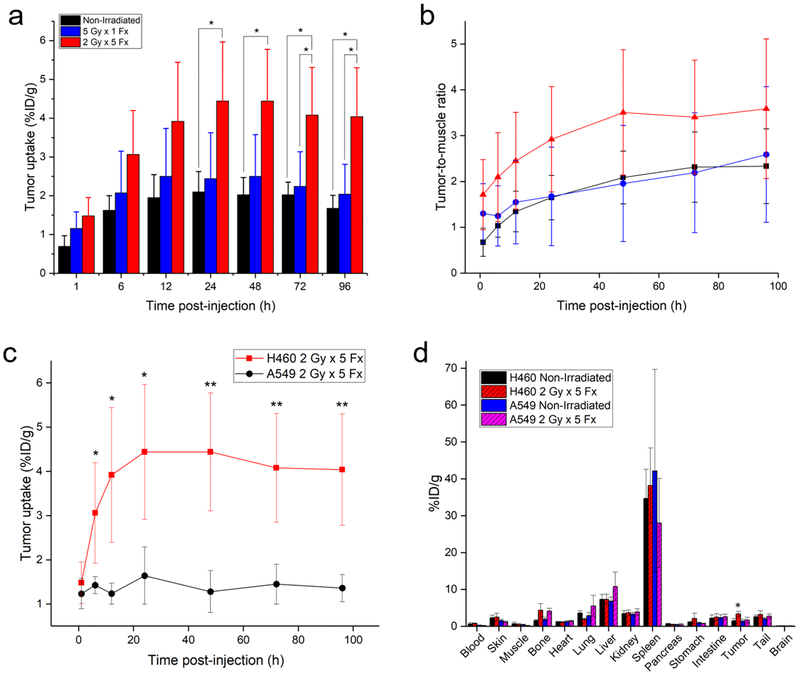
Given the high, specific uptake of the tracer in the lymphatic organs, the absolute amount of tracer binding in H460 tumor tissues was low. However, significant differences in the tumor accumulation were seen following the different treatment schedules. In nonirradiated mice, tumor uptake peaked at 24 h postinjection, at 2.10 ± 0.52%ID/g. In contrast, in the 5 Gy × 1 Fx group, the accumulation was 2.44 ± 1.18%ID/g at the same time point, and tumor uptake of 4.44 ± 1.52%ID/g was measured for the 2 Gy × 5 Fx mice. At the 24 h scan, this corresponded to a statistically significant higher tracer accumulation in 2 Gy × 5 Fx mice as compared to the nonirradiated group (p < 0.05, n = 4–5). Although the highest absolute uptake in the tumors was observed at the 24 h scan, peak tumor-to-muscle ratios (TMRs) were calculated at the final imaging time point, 96 h. Mice receiving the 2 Gy × 5 Fx regimen had the highest TMRs at 3.59 ± 1.53, compared to the 5 Gy × 1 Fx group at 2.59 ± 1.48 and nonirradiated mice at 2.33 ± 0.81.
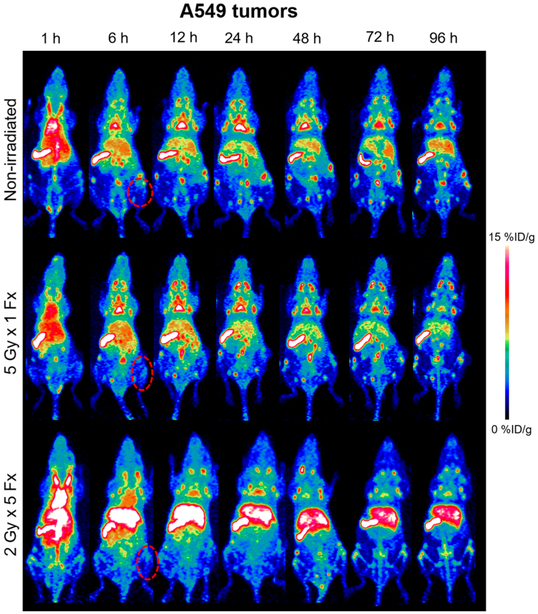
As a negative control, mice bearing A549 tumors were also employed to determine the accumulation level of atezolizumab in tumor tissues not resulting from tumor cell expression of PD-L1 (Figures 4 and 5). This control was determined to be most appropriate, because many traditional control experiments (blocking, nonspecific IgG) were not applicable to this model (see Discussion section). From PET ROI analysis, nonirradiated A549 xenografts displayed the highest uptake of 89Zr–Df–atezolizumab at 12 h postinjection, at 2.38 ± 0.67% ID/g. When irradiated with 5 Gy in a single fraction, the peak A549 tumor accumulation was noted at 24 h, peaking at 2.10 ± 0.97%ID/g. In mice receiving fractionated radiotherapy, a peak tumor uptake of 1.64 ± 0.65%ID/g was calculated at 24 h postinjection as well. This provides support to a PD-L1-mediated mechanism for the increase in uptake of 89Zr–Df–atezolizumab in H460 tumors, because the accumulation at the same time point (24 h) in these tumors after fractionated radiotherapy was 4.44 ± 1.53%ID/g, a statistically significant difference (p < 0.02, n = 4–5). In fact, the A549 tumor uptake in both irradiated and nonirradiated mice was nearly identical to that of nonirradiated H460 xenografts at all time points, indicating that this ~2%ID/g can be attributed to nonspecific accumulation in tumor regions, likely because of the enhanced permeability and retention effect. No notable difference was noted for other organs and tissues between the two groups of tumor-bearing mice, as seen in the gamma counting biodistribution studies.
Figure 4.
A549 PD-L1 PET. PET imaging of mice with PD-L1(−) A549 xenografts with 89Zr–Df–atezolizumab. Tumors are indicated by red dashed circles in the representative MIPs.
Figure 5.
Quantification of tracer biodistribution. (A) Uptake of 89Zr–Df–atezolizumab in H460 tumors as determined through region-of-interest analysis of PET images. (B) Tumor-to-muscle ratios for all studied H460 groups over time. Both analyses indicate the highest accumulation of 89Zr–Df–atezolizumab in the fractionated radiotherapy group. (C) Tumor uptake over time in H460 and A549 tumor xenografts receiving 2 Gy × 5 Fx. (D) Ex vivo biodistribution study results in the two tumor models at 96 h postinjection of tracers. *p < 0.05; **p < 0.01; n = 3–5.
Ex Vivo Verification of in Vivo Trends.
Ex vivo biodistribution studies verified the trends found through analysis of PET images of 89Zr–Df–atezolizumab (Figure 5d). The highest uptake of the tracer was noted in the spleen (33–38%ID/g) in all groups, followed by the lymph nodes (13–25%ID/g). Notably, the uptake in these tissues measured by gamma counting was higher than that measured through PET ROI analysis, likely because of partial volume effects in the ROI measurements. Low levels of accumulation were also noted in the liver (7–8%ID/g), as this is the clearance organ for antibody-based tracers. H460 tumor uptake was significantly higher in the group receiving 2 Gy × 5 Fx, at 3.38 ± 0.66%ID/g, compared to 2.18 ± 0.80 and 1.51 ± 0.61%ID/g for the 5 Gy × 1 Fx and nonirradiated groups, respectively (p < 0.05, n = 4–5). Similar tumor accumulations were noted for all of the A549 groups: 1.42 ± 0.53%ID/g for nonirradiated, 2.10 ± 0.79%ID/g for 5 Gy × 1 Fx, and 1.69 ± 0.76%ID/g for 2 Gy × 5 Fx.
Radioactivity in irradiated H460 tumors was statistically higher, as expected; however, consistently higher accumulation of the tracer was also noted in the bones of mice receiving the fractionated radiotherapy treatment, regardless of tumor type, as measured by both PET ROI analysis and ex vivo biodistribution (Figure S5). The largest differences were noted in those bones and joints that were within the radiotherapy field (i.e., the hips and coccyx regions), indicating a possible PD-L1-mediated mechanism, rather than instability of the tracer. The bone uptake values calculated from gamma counting and PET ROI analysis were well-matched, signaling minimal impact of the partial volume effect on these measurements. No other clear trends were noted in the normal tissue distribution of 89Zr–Df–atezolizumab with regard to radiotherapy regimen.
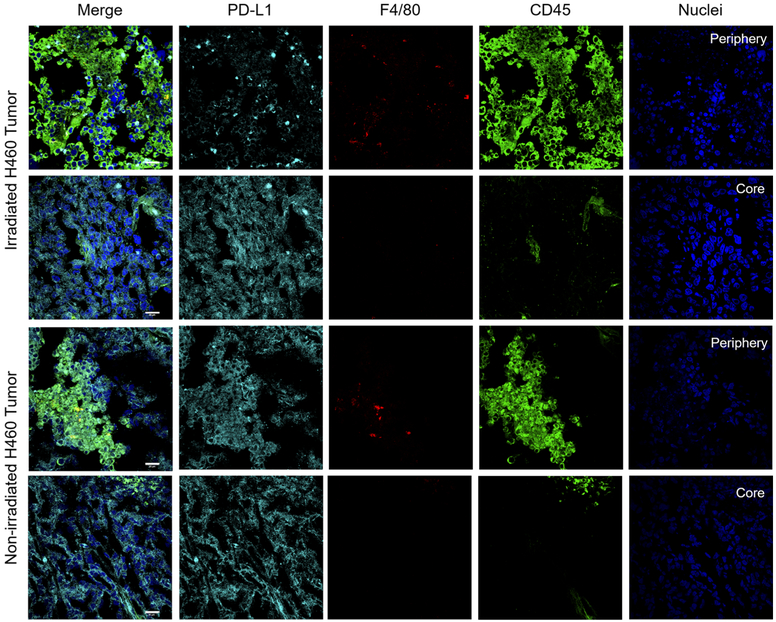
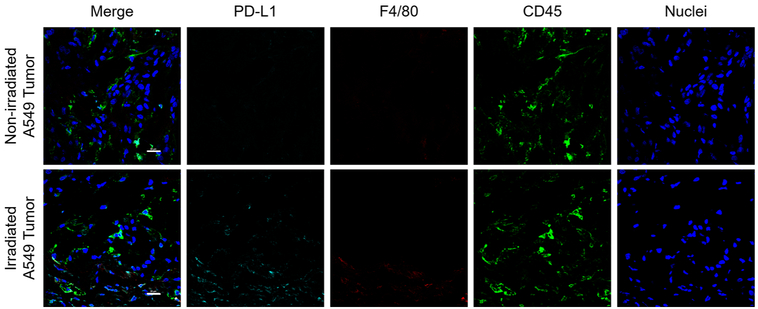
Tissues of significant tracer uptake were also excised at the time of necropsy, including the spleen and tumors (Figures 6, 7, S3, and S4). Immunofluorescent staining of these tissues verified the expression of PD-L1 and therefore specific binding of 89Zr–Df–atezolizumab. Notably, the intensity of PD-L1 staining was higher in the lymphoid organs compared to H460 tumors but also more heterogeneous. PD-L1 appeared to be expressed by a subpopulation of the cells in the spleen, with much colocalization with CD45 expression correlating with immune cell expression of PD-L1. In nonirradiated tumor tissues, some infiltrating myeloid cells were visualized and correlated with selected PD-L1 expression. Following irradiation, an increase in CD45+ cells was observed, especially around the periphery of the tumor tissues (Figures S4 and 6). However, PD-L1 staining was observed in tumor tissues that also did not overlay with CD45 or F4/80, indicating tumor cell expression. Additionally, the morphology of CD45+ cells was clearly different than that of tumor cells themselves, with most CD45+ cells presenting as circular, whereas tumor cells were more elongated and abnormal shapes. The PD-L1 staining in irradiated tumors was more uniform than that observed in nonirradiated tissues. A549 tumors did not reveal any notable PD-L1 staining, regardless of radiotherapy treatment.
Figure 6.
H460 tumor staining. After 5 Fx of 2 Gy radiotherapy, an increase in CD45+ cell infiltration was noted around the periphery of the tumors. PD-L1 expression on tumor cells was also slightly increased in uniformity. Scale bar = 20 μm.
Figure 7.
A549 tumor staining. Minimal PD-L1 staining was observed in all groups of A549 tumor-bearing mice. Scale bar = 20 μm.
DISCUSSION
Although the value of PD-L1 as a prognostic or predictive marker is still under debate,12,13 the importance of monitoring changing biomarker expressions throughout treatment is well-recognized.14,15 Imaging of T-cell-related targets, such as PD-1, has been widely explored preclinically, and initial clinical studies are underway.9 Recent clinical studies have additionally indicated that PD-L1 imaging may be an excellent predictor of patient response to immune checkpoint blockade, even more so than the clinical standard of biopsy analysis.10 Additionally, PD-L1 is widely known to be upregulated in tumor tissues following radiotherapy interventions, likely resulting from the inflammation caused by radiotherapy.16 Treatment with radiotherapy alone, as a result, often does not lead to complete tumor regression because of these immunosuppressive effects. However, combination of blockade of the PD-1/PD-L1 axis with local radiotherapy has led to impressive primary and secondary tumor responses.4,6,17 Not all tumors exhibit this enhancement of PD-L1 expression following radiotherapy, however, and the accompanying window of opportunity for immunotherapy intervention. Identifying patients with PD-L1+ biomarker status in both primary and metastatic tumor sites may help allot them to the proper combination treatment of radiotherapy and immune checkpoint blockade.
We have therefore demonstrated that noninvasive PET imaging can monitor the dynamic expression of PD-L1 in naïve preclinical subjects as well as following radiation treatment. Monitoring changes in PD-L1 expression in real-time has important implications clinically, especially for the optimization of synergistic therapy regimens.1,4,5 PD-L1 PET therefore not only has value as a diagnostic agent for simple tumor detection but also as a means of monitoring tumor response and allocating patients to proper therapies.
A number of studies have investigated tumor detection through molecular imaging based upon PD-L1 expression, often using murine models.18–25 The present study varies from these previous ones, particularly those noninvasively monitoring PD-L1 dynamics, on a few key points. First, we utilized an anti-human PD-L1 antibody that also cross-reacts with murine PD-L1. This means that these results should be more easily clinically translated than certain other studies that use entirely murine systems, and we also have representative off-target binding of the tracer to lymphatic organs. This off-target binding will certainly be seen in patients and thus needs to be considered in preclinical studies, which in some cases use human-specific antibodies (which therefore do not bind to the analogous murine molecules). Second, our positive cell line herein (H460) only expresses native levels of PD-L1, rather than being engineered to express high, unnatural levels of the protein—a strategy that has been employed in some past studies. Although this expression level is low compared to lymphatic organs’ PD-L1 levels (spleen and lymph nodes), we are still able to visualize the tumor burden by PET after therapeutic intervention. Finally, many other studies, both preclinical and clinical, employ a predosing strategy to minimize this off-target lymphatic uptake by administering excess cold anti-PD-L1 antibody either before the tracer injection or as a coinjection.26 Even within the present study, PD-L1-specific uptake of the tracer was found to be highly dependent on the administered protein doses. Although this technique does provide higher tumor uptake and contrast, such predosing has the possibility of inducing a pharmacologic response, which is not desired for an imaging tracer. We only administered the radiolabeled protein, at a low per-mouse level, in order to avoid the chance of a pharmacologic response, even if it is not altogether common. Indeed, administering the lowest amount of protein to a patient, while achieving sufficient imaging signal, is ideal.
As aforementioned, PD-L1 imaging is more complicated than imaging other traditional tumor markers. Because PD-L1 is so widely expressed, not only is the imaging signal in the tumor reduced but also the traditionally used control experiments cannot be applied. For instance, because administration of a blocking dose would saturate the PD-L1 found in the spleen and lymph nodes, this technique would be expected to actually result in a higher tracer accumulation in the tumor and would not prove specificity for the cancer cells as in traditional studies. Additionally, another control technique is the use of a nonspecific, isotype-matched antibody. However, a nonspecific antibody would not bind to the PD-L1 that is ubiquitous throughout the body and may actually accumulate once again to a higher level in the tumor tissue. We have tested a control 89Zr–Df–IgG in nude mice bearing A549 tumors in other studies, for example, and achieved 5.05 ± 1.70%ID/g tumor uptake at 120 h postinjection.27 This is higher than any tumor uptake observed in these studies; therefore, these controls would not be helpful. For this reason, we employed the A549 xenografts as a control, because PD-L1 expression cannot be induced on them with the radiotherapy regimens employed here. This would provide a measure of the accumulation of atezolizumab in tumor tissues that do not express PD-L1 while maintaining the same background uptake in lymphoid organs. Additionally, this provides a verification that, for instance, disruption of blood vessel architecture by radiotherapy is not to blame for increased tumor accumulation of 89Zr–Df–atezolizumab.
The absolute uptake of 89Zr–Df–atezolizumab in the H460 tumor tissues was low (1–5%ID/g), even in the 2 Gy × 5 Fx group, when compared to that of cancer PET tracers targeted to markers other than PD-L1. As partially mentioned before, this is likely due to a few factors. Most importantly, the expression of PD-L1 is not limited to the tumor tissue, and several other tissues (including the spleen, lymph nodes, and brown fat) represent sinks for the tracer. Additionally, the number of cells expressing PD-L1, or even the number of copies of PD-L1 per cell, is lower than that of other commonly used imaging targets. Notably, the cutoff for PD-L1 positivity in a tumor is often that 1–5% of the total cells express the target,28 compared to, for example, the definitions of Her-2 positivity (>10% of cells).29 Even though the absolute uptake is low and there is notable off-target binding, high tumor-to-muscle ratios allowed clear visualization of irradiated tumors, especially at later time points. This is a well-recognized benefit of 89Zr-labeled antibodies—the long radioactive half-life allows for high-contrast imaging after the antibody has cleared from nonspecific binding.
The results obtained herein may not be generally applicable to all cancer types, models, and treatments, however. The expression of PD-L1 is expected to change in different cell lines and with different treatment regimens; therefore, future studies should fully explore these options. The potential of PD-L1 PET to monitor changes in normal tissue PD-L1 expression and the implications of these changes for the system-wide immune state would be an additional interesting future avenue for exploration. The present study, in particular, showed interesting changes in the bone uptake of 89Zr–Df–atezolizumab after the various radiotherapy interventions, which merits further mechanistic investigation.
The dynamic nature of immune checkpoint molecules is beginning to be realized. There is therefore a great need to longitudinally monitor this expression in cancer patients receiving any number of treatments. We have herein demonstrated that PET of tumor PD-L1 expression using 89Zr–Df–atezolizumab is able to monitor changes in PD-L1 expression following various radiotherapy regimens. Such techniques may find application clinically for monitoring patient responses and determining proper therapies, giving clinicians another tool in their personalized medicine arsenal.
MATERIALS AND METHODS
Cell Culture.
H460 and A549 cells were purchased from the American Type Culture Collection and maintained in Roswell Park Memorial Institute-1640 or Dulbecco’s Modified Eagle’s medium supplemented with 10% fetal bovine serum and 1% penicillin–streptomycin in a 37 °C humidified incubator with 5% CO2. For all studies, cells were utilized at 60–70% confluence.
In Vitro PD-L1 Expression Studies.
To monitor changes in PD-L1 protein levels and expression, several in vitro studies were performed. To measure protein concentrations, Western blot analysis was employed. Cells were plated into T25 flasks and supplemented with 10 mL of media each (corresponding to approximately 2–3 mm of media above the cell layer). For the first study, protein was simply extracted from H460 and A549 cells at 60% confluence to explore baseline PD-L1 levels.
The cells were then subjected to one of three radiotherapy regimens: 5 Fx of 2 Gy each; 1 Fx of 5 Gy; or no radiation (but still the sham procedure of being removed from the incubator, etc.). These treatments were administered using an XRAD320 biological irradiator (Precision X-ray), and fractionated treatments were administered 24 ± 1 h apart. Protein was then extracted from the cells at the completion of their respective schedules at 24 h after completion. Cells were lysed using radioimmunoprecipitation assay buffer (Boston Bio-Products) supplemented with 1:100 Halt Inhibitor and EDTA (ThermoFisher Scientific). Supernatant protein concentration was measured using the NanoDrop One (ThermoFisher Scientific). Western blotting was performed using standard procedures,30 with the following reagents: Chameleon Duo ladder protein marker (LI-COR Biosciences), anti-hB7-H1 antibody (R&D Systems), anti-β-actin antibody (Novus Biologicals), donkey anti-goat IRDye 800CW, and donkey anti-mouse IRDye 680RD (LI-COR Biosciences). The final prepared membrane was scanned using a LI-COR Odyssey infrared imaging system (LI-COR Biosciences).
Verification of tracer binding was performed using flow cytometry. The binding properties of both atezolizumab and Df–atezolizumab to irradiated H460 cells were analyzed at 48 h after the fractionated irradiation. Preparation of cells for flow cytometry and analysis were conducted using standard procedures.30 Samples were run on a MacsQuant cytometer (Miltenyi Biotec) and analyzed with FlowJo V10 (FlowJo LLC).
Animal Models.
All animal studies were conducted under an approved protocol by the Institutional Animal Care and Use Committee. Lung cancer xenograft models were generated by inoculating 4–6 week-old female athymic nude mice (Envigo) with a 1:1 mixture of H460 or A549 cells in Matrigel Matrix Basement Membrane (Corning) subcutaneously in the lower flank. When tumors reached 5–8 mm in diameter, mice were used for subsequent studies.
Radiation Treatments.
Similar to cell studies, three radiotherapy regimens were administered to H460- or A549-bearing mice (n = 4–5 per group) using the XRAD320 irradiator: 5 daily fractions of 2 Gy (2 Gy × 5 Fx), one fraction of 5 Gy (5 Gy tme 1 Fx), or no radiation. Prior to irradiation, mice were placed and taped in the prone position in lead body shields (Figure S1) to minimize radiation exposure to organs other than the tumor. Mice were irradiated one at a time, and the X-ray field was collimated to leave ~0.5 cm margins on each side of the unshielded area of the mouse.
PET Tracer Preparation.
Atezolizumab (Genentech Oncology) was obtained in its clinically available IV-injectable form and run through a PD-10 column (GE Healthcare) with phosphate-buffered saline mobile phase to remove any stabilizers. The antibody was then conjugated with desferrioxamine (Df, Macrocyclics) using previously reported methods in preparation for radiolabeling with 89Zr.31,32 89Zr (t1/2: 78.4 h) was produced through proton irradiation of yttrium foils.33 For development of the radiolabeled tracer, Df–atezolizumab was mixed with 89Zr–oxalate at a ratio of 50 μg of protein to 37 MBq of radionuclide and incubated for 1 h at 37 °C. PD-10 columns were then used to purify the reactants and products and formulate the final tracer into phosphate-buffered saline for injection.
PET Imaging and Biodistribution Studies.
One day after completion of the respective radiotherapy regimens, mice were intravenously injected with 4–9 megabecquerels (5–12 μg) of 89Zr–Df–atezolizumab. PET scans were acquired using an Inveon microPET/CT scanner (Siemens) at 1, 6, 12, 24, 48, 72, and 96 h postinjection, with 20 000 000 counts per mouse obtained at each time point. OSEM/3DMAP reconstructions were employed. After the 96 h scan, mice were euthanized through CO2 asphyxiation, and major organs were removed, wet-weighed, and counted using an automated gamma counter (PerkinElmer). Quantitative data from these studies are presented as percent of injected dose per gram of tissue (%ID/g), mean ± standard deviation.
Ex Vivo Verification.
Organs of significant tracer uptake, including the spleen, lymph nodes, and tumors, were excised from mice, embedded in TissueTek Optimal Cutting Temperature Compound (Sakura), sliced, and mounted for immunofluorescent analysis. Using the human anti-PD-L1 antibody atezolizumab (because mouse and human PD-L1 share structural similarities), rat anti-mouse F4/80 (for macrophages), and mouse anti-mouse CD45 (hematopoietic cells) primary antibodies, the tissues were stained to determine which cells express PD-L1. Secondary antibodies were used to complete the staining using standard procedures:34 donkey anti-rat Cy3, donkey anti-human DyLight650, and goat anti-mouse AlexaFluor488. Slides were then mounted with DAPI-containing hard mount (Vector Laboratories) and cover-slipped. Confocal imaging was performed using a Nikon A1RS microscope (Nikon Corporation).
Statistical Analysis.
For the statistical analysis in this study (PET imaging and biodistribution), with five mice per group, a Student’s t test, which can detect a difference of 1.68 standard deviations with 80% power at 5% significance level was utilized (p < 0.05, two-sided).
Supplementary Material
ACKNOWLEDGMENTS
The authors gratefully thank Dr. Kwang Nickel and the Small Animal Imaging and Radiotherapy Facility at the UW-Madison for their expertise on the irradiation experiments. This work was supported, in part, by the University of Wisconsin—Madison and the National Institutes of Health (P30CA014520, T32GM008505, T32CA009206). The authors declare no other conflicts of interest. All applicable international, national, and/or institutional guidelines for the care and use of animals were followed, and all procedures performed in studies involving animals were in accordance with the ethical standards of the University of Wisconsin—Madison.
Footnotes
Supporting Information
The Supporting Information is available free of charge on the ACS Publications website at DOI: 10.1021/acs.bioconjchem.9b00178.
Irradiation setup information, lymph node mapping, additional immunofluorescent staining images, and bone PET signal analysis (PDF)
The authors declare no competing financial interest.
REFERENCES
- (1).Zamarin D, and Postow MA (2015) Immune checkpoint modulation: Rational design of combination strategies. Pharmacol. Ther. 150, 23–32. [DOI] [PubMed] [Google Scholar]
- (2).Teng F, Kong L, Meng X, Yang J, and Yu J (2015) Radiotherapy combined with immune checkpoint blockade immunotherapy: Achievements and challenges. Cancer Lett. 365 (1), 23–29. [DOI] [PubMed] [Google Scholar]
- (3).Formenti SC, and Demaria S (2013) Combining Radiotherapy and Cancer Immunotherapy: A Paradigm Shift. JNCI, J. Natl. Cancer Inst. 105 (4), 256–265. [DOI] [PMC free article] [PubMed] [Google Scholar]
- (4).Deng L, Liang H, Burnette B, Beckett M, Darga T, Weichselbaum RR, and Fu Y-X (2014) Irradiation and anti–PD-L1 treatment synergistically promote antitumor immunity in mice. J. Clin. Invest. 124 (2), 687–695. [DOI] [PMC free article] [PubMed] [Google Scholar]
- (5).Dovedi SJ, and Illidge TM (2015) The antitumor immune response generated by fractionated radiation therapy may be limited by tumor cell adaptive resistance and can be circumvented by PD-L1 blockade. Oncoimmunology 4 (7), No. e1016709. [DOI] [PMC free article] [PubMed] [Google Scholar]
- (6).Deng L, Liang H, Burnette B, Weicheslbaum RR, and Fu Y-X (2014) Radiation and anti-PD-L1 antibody combinatorial therapy induces T cell-mediated depletion of myeloid-derived suppressor cells and tumor regression. Oncoimmunology 3, No. e28499. [DOI] [PMC free article] [PubMed] [Google Scholar]
- (7).Wu C-T, Chen W-C, Chang Y-H, Lin W-Y, and Chen M-F (2016) The role of PD-L1 in the radiation response and clinical outcome for bladder cancer. Sci. Rep. 6, 19740. [DOI] [PMC free article] [PubMed] [Google Scholar]
- (8).Chen M-F, Chen P-T, Chen W-C, Lu M-S, Lin P-Y, and Lee K-D (2016) The role of PD-L1 in the radiation response and prognosis for esophageal squamous cell carcinoma related to IL-6 and T-cell immunosuppression. Oncotarget 7 (7), 7913–7924. [DOI] [PMC free article] [PubMed] [Google Scholar]
- (9).Ehlerding EB, England CG, McNeel DG, and Cai W (2016) Molecular Imaging of Immunotherapy Targets in Cancer. J. Nucl. Med. 57 (10), 1487–1492. [DOI] [PMC free article] [PubMed] [Google Scholar]
- (10).Bensch F, van der Veen EL, Lub-De Hooge MN, Jorritsma-Smit A, Boellaard R, Kok IC, Oosting SF, Schröder CP, Hiltermann TJN, van der Wekken AJ, et al. (2018) 89Zr-atezolizumab imaging as a non-invasive approach to assess clinical response to PD-L1 blockade in cancer. Nat. Med. 24 (12), 1852–1858. [DOI] [PubMed] [Google Scholar]
- (11).Niemeijer AN, Leung D, Huisman MC, Bahce I, Hoekstra OS, van Dongen GAMS, Boellaard R, Du S, Hayes W, Smith R, et al. (2018) Whole body PD-1 and PD-L1 positron emission tomography in patients with non-small-cell lung cancer. Nat. Commun. 9 (1), 4664. [DOI] [PMC free article] [PubMed] [Google Scholar]
- (12).Wang A, Wang HY, Liu Y, Zhao MC, Zhang HJ, Lu ZY, Fang YC, Chen XF, and Liu GT (2015) The prognostic value of PD-L1 expression for non-small cell lung cancer patients: A meta-analysis. Eur. J. Surg. Oncol. 41 (4), 450–456. [DOI] [PubMed] [Google Scholar]
- (13).Pan Z-K, Ye F, Wu X, An H-X, and Wu J-X (2015) Clinicopathological and prognostic significance of programmed cell death ligand1 (PD-L1) expression in patients with non-small cell lung cancer: a meta-analysis. J. Thorac. Dis. 7 (3), 462–470. [DOI] [PMC free article] [PubMed] [Google Scholar]
- (14).Kalia M (2015) Biomarkers for personalized oncology: recent advances and future challenges. Metab., Clin. Exp. 64 (3), S16–S21. [DOI] [PubMed] [Google Scholar]
- (15).Meng X, Huang Z, Teng F, Xing L, and Yu J (2015) Predictive biomarkers in PD-1/PD-L1 checkpoint blockade immunotherapy. Cancer Treat. Rev. 41 (10), 868–876. [DOI] [PubMed] [Google Scholar]
- (16).Liang H, Deng L, Chmura S, Burnette B, Liadis N, Darga T, Beckett MA, Lingen MW, Witt M, Weichselbaum RR, et al. (2013) Radiation-Induced Equilibrium Is a Balance between Tumor Cell Proliferation and T Cell–Mediated Killing. J. Immunol. 190 (11), 5874–5881. [DOI] [PMC free article] [PubMed] [Google Scholar]
- (17).Park SS, Dong H, Liu X, Harrington SM, Krco CJ, Grams MP, Mansfield AS, Furutani KM, Olivier KR, and Kwon ED (2015) PD-1 Restrains Radiotherapy-Induced Abscopal Effect. Cancer Immunol. Res. 3 (6), 610–619. [DOI] [PMC free article] [PubMed] [Google Scholar]
- (18).Lesniak WG, Chatterjee S, Gabrielson M, Lisok A, Wharram B, Pomper MG, and Nimmagadda S (2016) PD-L1 Detection in Tumors Using [(64)Cu]Atezolizumab with PET. Bioconjugate Chem. 27 (9), 2103–2110. [DOI] [PMC free article] [PubMed] [Google Scholar]
- (19).Truillet C, Oh HLJ, Yeo SP, Lee C-Y, Huynh LT, Wei J, Parker MFL, Blakely C, Sevillano N, Wang Y-H, et al. (2018) Imaging PD-L1 Expression with ImmunoPET. Bioconjugate Chem. 29 (1), 96–103. [DOI] [PMC free article] [PubMed] [Google Scholar]
- (20).Kikuchi M, Clump DA, Srivastava RM, Sun L, Zeng D, Diaz-Perez JA, Anderson CJ, Edwards WB, and Ferris RL (2017) Preclinical immunoPET/CT imaging using Zr-89-labeled anti-PD-L1 monoclonal antibody for assessing radiation-induced PD-L1 upregulation in head and neck cancer and melanoma. OncoImmunology 6 (7), No. e1329071. [DOI] [PMC free article] [PubMed] [Google Scholar]
- (21).Donnelly DJ, Smith RA, Morin P, Lipovšek D, Gokemeijer J, Cohen D, Lafont V, Tran T, Cole EL, Wright M, et al. (2018) Synthesis and Biologic Evaluation of a Novel 18F-Labeled Adnectin as a PET Radioligand for Imaging PD-L1 Expression. J. Nucl. Med. 59 (3), 529–535. [DOI] [PubMed] [Google Scholar]
- (22).Hettich M, Braun F, Bartholomä MD, Schirmbeck R, and Niedermann G (2016) High-Resolution PET Imaging with Therapeutic Antibody-based PD-1/PD-L1 Checkpoint Tracers. Theranostics 6 (10), 1629–1640. [DOI] [PMC free article] [PubMed] [Google Scholar]
- (23).Li D, Cheng S, Zou S, Zhu D, Zhu T, Wang P, and Zhu X (2018) Immuno-PET Imaging of (89)Zr Labeled Anti-PD-L1 Domain Antibody. Mol. Pharmaceutics 15 (4), 1674–1681. [DOI] [PubMed] [Google Scholar]
- (24).Chatterjee S, Lesniak WG, Miller MS, Lisok A, Sikorska E, Wharram B, Kumar D, Gabrielson M, Pomper MG, Gabelli SB, et al. (2017) Rapid PD-L1 detection in tumors with PET using a highly specific peptide. Biochem. Biophys. Res. Commun. 483 (1), 258–263. [DOI] [PMC free article] [PubMed] [Google Scholar]
- (25).González Trotter DE, Meng X, McQuade P, Rubins D, Klimas M, Zeng Z, Connolly BM, Miller PJ, O’Malley SS, Lin S-A, et al. (2017) In Vivo Imaging of the Programmed Death Ligand 1 by 18F PET. J. Nucl. Med. 58 (11), 1852–1857. [DOI] [PubMed] [Google Scholar]
- (26).Moroz A, Lee C-Y, Wang Y.-h., Hsiao JC, Sevillano N, Truillet C, Craik CS, Fong L, Wang C-I, and Evans MJ (2018) A Preclinical Assessment of 89Zr-atezolizumab Identifies a Requirement for Carrier Added Formulations Not Observed with 89Zr-C4. Bioconjugate Chem. 29 (10), 3476–3482. [DOI] [PMC free article] [PubMed] [Google Scholar]
- (27).Ehlerding EB, England CG, Jiang D, Graves SA, Kang L, Lacognata S, Barnhart TE, and Cai W (2017) CD38 as a PET Imaging Target in Lung Cancer. Mol. Pharmaceutics 14 (7), 2400–2406. [DOI] [PMC free article] [PubMed] [Google Scholar]
- (28).Velcheti V, Schalper KA, Carvajal DE, Anagnostou VK, Syrigos KN, Sznol M, Herbst RS, Gettinger SN, Chen L, and Rimm DL (2014) Programmed death ligand-1 expression in non-small cell lung cancer. Lab. Invest. 94, 107. [DOI] [PMC free article] [PubMed] [Google Scholar]
- (29).Ahmed S, Sami A, and Xiang J (2015) HER2-directed therapy: current treatment options for HER2-positive breast cancer. Breast Cancer 22 (2), 101–116. [DOI] [PubMed] [Google Scholar]
- (30).Hernandez R, Sun H, England CG, Valdovinos HF, Ehlerding EB, Barnhart TE, Yang Y, and Cai W (2016) CD146-targeted immunoPET and NIRF Imaging of Hepatocellular Carcinoma with a Dual-Labeled Monoclonal Antibody. Theranostics 6 (11), 1918–1933. [DOI] [PMC free article] [PubMed] [Google Scholar]
- (31).Vosjan MJWD, Perk LR, Visser GWM, Budde M, Jurek P, Kiefer GE, and van Dongen GAMS (2010) Conjugation and radiolabeling of monoclonal antibodies with zirconium-89 for PET imaging using the bifunctional chelate pisothiocyanatobenzyl-desferrioxamine. Nat. Protoc. 5, 739. [DOI] [PubMed] [Google Scholar]
- (32).Hong H, Severin GW, Yang Y, Engle JW, Zhang Y, Barnhart TE, Liu G, Leigh BR, Nickles RJ, and Cai W (2012) Positron emission tomography imaging of CD105 expression with(89) Zr-Df-TRC105. Eur. J. Nucl. Med. Mol. Imaging 39 (1), 138–148. [DOI] [PMC free article] [PubMed] [Google Scholar]
- (33).Ellison PA, Valdovinos HF, Graves SA, Barnhart TE, and Nickles RJ (2016) Spot-welding solid targets for high current cyclotron irradiation. Appl. Radiat. Isot. 118, 350–353. [DOI] [PMC free article] [PubMed] [Google Scholar]
- (34).Luo H, England CG, Goel S, Graves SA, Ai F, Liu B, Theuer CP, Wong HC, Nickles RJ, and Cai W (2017) ImmunoPET and Near-Infrared Fluorescence Imaging of Pancreatic Cancer with a Dual-Labeled Bispecific Antibody Fragment. Mol. Pharmaceutics 14 (5), 1646–1655. [DOI] [PMC free article] [PubMed] [Google Scholar]
Associated Data
This section collects any data citations, data availability statements, or supplementary materials included in this article.


