

To the Editor:
Extracting knowledge from the many types of big data produced by high-throughput methods remains a challenge, even when data are from Escherichia coli, the best characterized bacterial species. Here, we present iML1515, the most complete genome-scale reconstruction of the metabolic network in E. coli K-12 MG1655 to date, and we demonstrate how it can be used to address this challenge. Enabling analysis of several data types, including transcriptomes, proteomes, and metabolomes, iML1515 accounts for 1,515 open reading frames and 2,719 metabolic reactions involving 1,192 unique metabolites. The iML1515 knowledgebase is linked to 1,515 protein structures to provide an integrated modeling framework bridging systems and structural biology. We apply iML1515 to build metabolic models of E. coli human gut microbiome strains from metagenomic sequencing data. We then use iML1515 to build metabolic models for E. coli clinical isolates and predict their metabolic capabilities. Finally, we use iML1515 to carry out a comparative structural proteome analysis of 1,122 E. coli strains and identify multi-strain sequence variations.
Genome-scale network reconstructions of metabolism (reviewed in ref. 1) are structured biochemical, genetic, and genomic (BiGG) knowledgebases for an organism1. Metabolic reconstructions aim to cover all metabolic reactions possible in a cell2 to be useful for data interpretation and physiological predictions. Inclusion of different data types can improve the explanatory and predictive capability of a reconstruction. (Fig. 1a). Although E. coli K-12 MG1655 is well-characterized, new functions and capabilities continue to be reported3–5. iML1515 includes the most up-to-date set of characterized genes and metabolic reactions for E. coli K-12 MG1655 (Supplementary Data set 1; http://bigg.ucsd.edu), most of which have been discovered since the last model iJO1366 was published in 2011: structural information for all proteins in the model with links to known protein domains, metabolism of reactive oxygen species (ROS), metabolite repair pathways, and updated growth maintenance coefficients. iML1515 has been validated and customized for use in different growth conditions and is the most comprehensive E. coli reconstruction to date (Supplementary Figs. 1 and 2).
Figure 1.

iML1515 genome-scale reconstruction. (a) The iML1515 model contains 1,515 open reading frames that encode enzymes that catalyze 2,719 reactions involving 1,192 unique metabolites. It also includes 1,515 protein structures. All reconstruction content is linked to external databases, including KEGG, PDB, and CHEBI. iML1515 is capable of performing flux-balance analysis to integrate and interpret a variety of emerging data types including linking mutations identified from resequencing and/or transcriptomics data to fluxomics. (b) All reactions are linked to encoding gene(s) and protein. Connection to PDB structures and homology models form a domain-gene-protein-reaction relationship (dGPR) (Supplementary Data set 7). (c) Clustering of domain architecture and metabolite usage provides tools to explore enzyme promiscuity and metabolism25,28. The domain-connectivity network can be visualized using Cytoscape and is supplied as a network file (Supplementary Data set 8). The acetyltransferase domain in c highlights a specific example of domain connectivity. The acyltransferase domain (d1iuqa_) is present in three genes (b3018, b1054, and b2378). The encoded proteins catalyze different but related reactions in glycerophospholipid metabolism and endotoxin synthesis. All reactions are ACP-dependent acyltransferases. (d) A database consisting of 333 normalized transcriptomics data sets15 was contextualized using the GPRs of iML1515. Relative expression for all three genes catalyzing the ASPK reaction are plotted across all experimental conditions, revealing condition-specific preferences for gene usage. The experimental conditions that favor a particular isozyme are listed. At the top of the panel two reactions (ASPK, HSDy) are shown with two isozymes that can catalyze these reactions (ThrA, MetL). The third isozyme (LysC) can only catalyze APSK. ASPK and HSDy activity must be present to synthesize L-threonine (thr-L), L-methionine (met-L), L-isoleucine (ile-L), biotin (btn), and S-adenosyl-L-methionine (amet). Only ASPK activity is needed to synthesize murein derivatives and L-lysine (lys-L) (further discussion can be found in Supplementary Fig. 8 and Supplementary Note 6).
The first step toward producing iML1515 was to analyze all previous E. coli metabolic reconstructions6–8 using quality metrics that ranged from enzymatic assays (highest confidence) to genetic perturbations to computational inferences (lowest confidence) (Supplementary Data set 2 and Supplementary Fig. 3). Evaluation of every reaction resulted in 54 updates to iML1515 compared with iJO1366, the most complete of prior models. Model driven ‘gap-filling’9 was used to assign missing gene functions10 and, following a literature review, we added recently reported metabolic functions in E. coli, including those for sulfoglycolysis3, phosphonate metabolism4, and the degradation of curcumin5. Eight new metabolite damage and repair reactions were added. We also updated reactive oxygen species (ROS)-generating reactions11 and increased the number of ROS-generating reactions from 16 to 166 (Supplementary Data set 3) to produce iML1515-ROS (Supplementary Data set 1 and Supplementary Fig. 4). Reported links between a gene and transcriptional regulator(s)12 were added using a promoter ‘barcode’ for each gene (Supplementary Fig. 5 and Supplementary Data set 4). Each barcode indicates whether a metabolic gene is regulated by a given transcription factor, and the type of regulation (activator, repressor, or unknown).
In total, iML1515 contains 184 new genes and 196 new reactions compared with 2,583 reactions in iJO1366 (ref. 7), and we report updated confidence scores for all 2,719 reactions in Supplementary Data set 2. Growth-and non-growth-associated ATP maintenance values for iML1515 were calculated using measurements from strains of E. coli that have evolved to grow on different substrates and conditions (Supplementary Figs. 6 and7 and Supplementary Data set 5). New model content is summarized in Supplementary Tables 1 and 2, Supplementary Notes 1 and 2 and Supplementary Figures 1 and 2.
Protein structures have been incorporated into reconstructions of E. coli13 but in order to improve the range of functions of our model, we added 177 new structures using a defined protocol14 (Supplementary Data set 6). 716 of the 1,515 proteins included in iML1515 are crystal structures; the remaining 799 proteins were constructed for iML1515 using homology models (Supplementary Methods). Proteins were characterized by their representative domains, as annotated by Protein Data Bank (PDB). This means that every gene in iML1515 is connected to a protein product, catalyzing domain, and enzymatic transformation (Fig. 1b).
Unlike with all previous E. coli reconstructions, it is possible to further characterize the classic gene-protein-reaction (GPR) relationships8 in iML1515 to catalytic domain resolution. A GPR provides an explicit, formal connection between genotype and phenotype in a genome-scale reconstruction; it links the gene (G) to the protein (P) that catalyzes a reaction (R) in the network. Because we include individual domains, we can obtain detailed insight into catalytic processes by identifying the specific protein domains that are relevant to each gene. GPR data types enable us to analyze how structural motifs are linked to phenotypes and allow us to identify ‘dGPR, or domain-gene-protein reactions (Fig. 1b).
We used the linkage of proteins in iML1515 connected to three-dimensional (3D) crystal structures to assess how many genes encode conserved protein domains. We identified 1,888 unique domains in the structural proteome of iML1515. At the domain level, the maximum redundancy was 17 (that is, the same domain is found in 17 different genes), but on average, the same domain was shared by 2 genes. Most proteins contain more than one domain (Supplementary Data set 6; https://github.com/SBRG/iML1515_GP). We assessed the domain-connectivity of the network to find domains that were linked to each other (Fig. 1c and Supplementary Data sets 7 and 8). The iML1515 knowledgebase therefore enables the mapping of sequence variation to structure and other properties, including enzyme promiscuity and underground metabolism.
Furthermore, we applied iML1515 to analyze a database of normalized transcriptomics data from 333 experiments15 including different phases of growth, different nutrient sources, various perturbations (e.g., nutrient shifts, pH shock, oxygenation). We used iML1515 to identify promiscuous enzymes and found no evidence for differential expression of genes that encode promiscuous enzymes in different conditions (Supplementary Fig. 8). We then mapped normalized values from the gene expression database to dGPRs to analyze transcriptional variation for each gene across all conditions (Fig. 1d, Supplementary Fig. 8 and Supplementary Data set 9). For isozymes, we found that expression of genes in iML1515 varied owing to growth phase, carbon source, medium, or experimental perturbation. For example, the three isozymes of aspartate kinase (APSK catalyzed by LysC, MetL, and ThrA) are variably expressed depending on culture conditions (Fig. 1d). The isozyme lysC is preferentially expressed in nutrient-rich conditions or during stationary phase; metL is preferentially expressed when glucose is not the primary carbon source; and thrA is preferentially expressed in anaerobic and aerobic glucose M9 minimal media conditions.
The iML1515 knowledgebase is an updated and re-curated metabolic reconstruction with additional content and capabilities. It can be converted into a computational format (Supplementary Data set 1), allowing it to be characterized, such as through the use of constraint-based, protein structure, or genetic variation methods.
Genome-scale models (GEMs) can be used to computationally predict the effect of genetic perturbations on a genome scale1. For example, they have been used to predict the condition-dependent growth effect of gene knockouts. To validate iML1515 we carried out experimental genome-wide gene-knockout screens for the entire KEIO collection (3,892 gene knockouts)16 grown on 16 different carbon sources that represent different substrate entry points into central carbon metabolism (Supplementary Methods and Fig. 2b). We determined growth profiles, including lag-time, maximum growth rate, and growth saturation point (OD)17 (Fig. 2a, Supplementary Fig. 9 and Supplementary Data sets 10 and 11). Using these data we identified 345 genes that were essential in at least 1 of 16 conditions. 188 genes were essential in all conditions, and 157 were essential in specific conditions. The iML1515 knowledgebase predicted gene essentiality in 16 conditions with an accuracy of 93.4% (Fig. 2c, Supplementary Notes 3 and 4, Supplementary Table 3 and Supplementary Data set 11) compared with an accuracy of 89.8% using iJO1366, thus representing a 3.7% increase in predictive accuracy.
Figure 2.

Model validation. (a) The Colony-live platform17 was used to measure growth capabilities of 3,869 single-knockout mutant E. coli strains on minimal media with 16 different carbon sources, forming a total of 62,272 measured phenotypes. Colony-live provides specific values for lag-time (LTG), maximum growth rate (MGR), and growth saturation point (GSP) for each gene knockout and condition (presented in Supplementary Data set 11). (b) Subset of knockout data highlighting growth rates for gene knockouts in the tricarboxylic acid (citric acid) cycle. (c) The iML1515 reconstruction is 93.4% accurate in predicting the effect of gene knockouts, an increase in accuracy of 3.7% over the 89.8% accuracy of the iJO1366 E. coli metabolic reconstruction7.
Increasing the numbers of genes, reactions, proteins, or structures in a genome-scale network reconstruction is accompanied by an increase in the number of false-positive predictions made, because the computational method assumes that all reactions are used in any condition, which is not true in vivo. Condition-specific models can overcome this problem and are made by using transcriptomics or proteomics data to manually remove reactions catalyzed by gene products that are not active in a particular condition. We used proteomics data for E. coli K-12 MG1655 grown on seven carbon sources18 to remove reactions and alter GPRs associated with non-expressed genes (Supplementary Data set 1). Models tailored using this approach have an average 12.7% decrease in false-positive predictions and a 2.1% increase in essentiality predictions (MCC score, Supplementary Table 4, Supplementary Data set 12, Supplementary Note 5 and Supplementary Fig. 4).
The iML1515 metabolic network reconstruction is specific for the E. coli strain K-12 MG1655, the first E. coli strain whose genome was sequenced. Most of the many sequenced E. coli strains have 15–20% larger genomes than the MG1655 strain19. To establish the core metabolic network for the species, we used bi-directional BLAST and genome context to search for metabolic genes present in iML1515 at greater than 80% identity in 1,122 sequenced strains of E. coli and Shigella (Supplementary Data set 13). All genes not present in more than 1,111 strains (99% of strains selected as a soft cutoff to remove the effect of sequencing errors on defining the core genome) were stripped from iML1515 to form a model of ‘conserved’ or ‘core’ E. coli metabolic capabilities, which we named iML976 (Supplementary Data set 1). This new reconstruction iML976 contains 976 genes, 1,866 reactions, and 1,169 unique metabolites, making it similar in size to a previous conserved metabolic reconstruction formed from 55 strains of E. coli20, which contained 965 genes, 1,773 reactions, and 1,665 metabolites.
Comparison between iML976 and iML1515 using constraint-based modeling revealed phenotypic differences. For example, iML976 is auxotrophic for L-phenylalanine, L-tryptophan, L-arginine, L-tyrosine, L-glutamine, biotin, thiamine, and tetrahydrofolate. Either the ability to synthesize these molecules is not conserved in E. coli or alternative routes for their synthesis exist. Supplementation of the in silico minimal media with these nutrients enabled growth of iML976 to be computed on 110/187 C sources, 58/94 N sources, 6/11 S sources, and 41/50 P sources (Supplementary Note 3, comparison with iML1515 shown in Supplementary Table 2). The iML976 reconstruction can be used as a starting point for developing a metabolic reconstruction from a freshly sequenced E. coli strain (Fig. 3a and Supplementary Data set 1).
Figure 3.
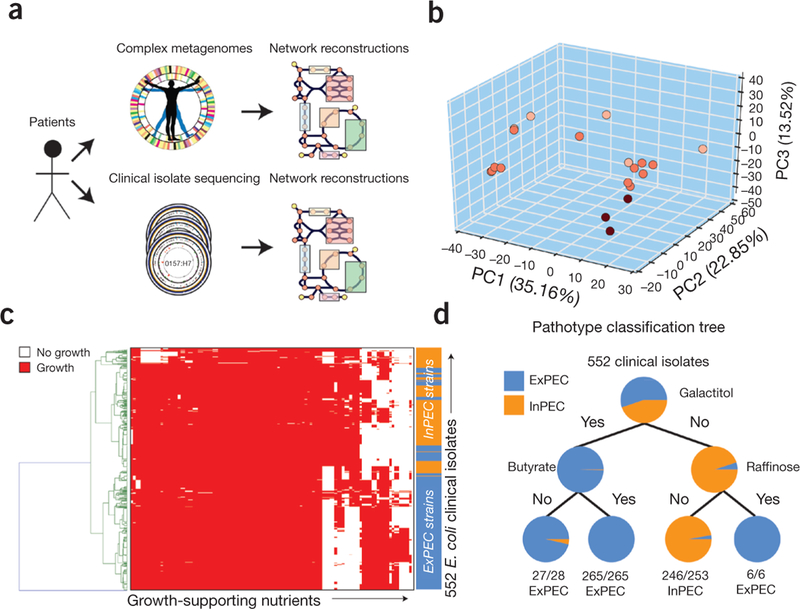
Application of iML1515 for clinical isolates and metagenomes. (a) iML1515 can be used to rapidly construct strain-specific models of metabolism from sequenced clinical isolates and complex metagenomes. Genes that are part of the iML1515 model are identified and extracted for comparison across each of the metagenomics samples. (b) Sample-specific models of E. coli metabolism were constructed for 22 metagenomic samples by evaluating shared content from iML1515. Metabolite synthesis capabilities and yields were calculated for each model and evaluated using PCA to illustrate a separation in sample-specific metabolite synthesis capabilities. Points are colored based on model-predicted max autoinducer-2 yield. (c) Strain-specific models were constructed for 552 E. coli clinical isolates from two recent studies29,30. Models were used to predict the ability to grow on over 300 different carbon, nitrogen, phosphorous, and sulfur sources. A heatmap of model-predicted catabolic capabilities for clinical isolates is shown. (d) Machine learning methods, such as a decision tree, can be applied to model predictions. For example, model-predicted catabolic capabilities can be used to classify clinical isolates between extra-intestinal pathotypes (ExPEC: isolated from blood or urine) and from intestinal pathotypes (isolated from feces) based solely on the model-predicted ability to catabolize three substrates (galactitol, butyrate, and raffinose).
It is important to remember that E. coli is a pathogen. To assess the utility of iML1515 for studying clinical strains, we built GEMs of 552 sequenced isolates from refs. 29 and 30 using iML1515 (Fig. 3 and Supplementary Methods). We used the core model, iML976, to evaluate the assembly quality of each genome (any strains missing a core gene were excluded from the following analyses). These GEMs contained 1,404 ± 30 genes (Fig. 3c). We predicted growth capabilities for each of the 552 clinical isolate models (Fig. 3c). These were sufficient to distinguish strains of extra-intestinal E. coli (ExPEC) from those of intestinal strains (InPEC) (Fig. 3d). We also compared conservation of 176 new metabolic reactions in iML1515 across the 552 clinical isolates. The new reactions that were not conserved across all strains included the curcumin catabolism pathway (NADPH-dependent curcumin reductase, present in 232/552 GEMs) as well as the pathway for degradation of sulfoquinovose (6-deoxy-6-sulfofructose-1-phosphate aldolase, present in 501/552 GEMs), showing that not all clinical isolates of E. coli may be capable of using these nutrients. The iML976 reconstruction enables identification of important metabolic differences in clinical isolates that could be used to identify treatments or clinical outcomes; diagnosis may one day be possible from sequence alone.
We also used iML1515 to analyze metagenomics data to evaluate whether this would enable species-level metabolic characterization. We built draft GEMs for E. coli strains using metagenomic data (Supplementary Methods) for 22 microbiome samples from two studies21,22. Sequencing data from these samples allowed the identification of 1,311 ± 94 metabolic genes in iML1515. We found that ‘core’ metabolic capabilities in microbiome draft models consisted of 2,326 reactions, whereas 356 reactions were variable across the samples (Supplementary Data set 13). Interestingly, of the 184 new genes in iML1515, 34 ± 17 were variably present, showing the benefit of a more complete GEM. We used our draft models to predict levels of maximum metabolite synthesis (Supplementary Methods). Principal component analysis (PCA) of the results shows that models cluster into discrete groups based on metabolites that can be synthesized (Fig. 3b). For example, the models separate in principal component 1 based, in part, on the maximum capability to produce autoinducer-2, which may have implications on quorum sensing.
Inclusion of protein structures in iML1515 enables comparison of sequence variation among conserved metabolic genes (Fig. 4d–g). We compared all genes in iML1515 to their corresponding gene in each of 1,122 E. coli strains using BLAST and genome context (Supplementary Methods and Fig. 4a). The number of alleles ranged from 20 (e.g., pfkA) to 249 (e.g., hisD, Fig. 4b,c). MG1655 contains the most common allele for only 30% of the 1,122 strains. For example, the K-12 MG1655 allele of rph was present in fewer than 1% of strains (seven close K-12 derivatives, including K-12 W3110 and BW25113). This mutation has been shown to result in reduced expression of pyrE and leads to pyrimidine starvation conditions where strains grow 10–15% slower in pyrimidine-free media than in media supplemented with uracil23. Therefore, iML1515 can be used to probe differences between laboratory and wild-type strains.
Figure 4.

Comparison of iML1515 to sequence variations in 1,122 clinical Isolates of E. coli. (a) Counts for each E. coli K-12 MG1655 gene in 1,122 sequenced strains of E. coli are shown. (b) Histidine pathways showed high levels of amino acid differences among genes involved. The pie chart represents the percentage of strains that contain unique hisDalleles. The hisD116 allele of E. coli K-12 MG1655 is present in only 19 (1.7%) of the sequenced strains. (c) Structural biology methods can reveal the effect of mutations. (d) 976 genes with metabolic functions are conserved across 99% of E. coli strains and this core set also has mutations. The bar chart shows the average number of amino acid mutations in these core genes for 1,122 strains of E. coli. (e) A histogram showing how many genes have a certain number of average mutations. (f) Amino acid mutations are compared for major metabolic pathways (e.g., histidine synthesis) using structural biology methods. (g) Amino acid changes can be compared per protein domain. For example, genes that encode the aldehyde dehydrogenase (ALDH-like) domain present in hisD have, on average, more genetic mutations across all 1,122 strains of E. coli than genes encoding other domains.
In summary, iML1515 is the most complete network model built for E. coli to date. The content of this model is linked to external databases, including KEGG, PDB, and CHEBI. In iML1515’s computational format, constraint-based methods can be used (i.e., the COBRA Toolbox24) to assess network properties. Protein structure tools can be applied to assess similarities and properties of protein structure (Supplementary Fig. 10 and Supplementary Note 7). Genetic variation can be examined using phylogenetic tools. We provide three versions of iML1515 tailored for specific-use cases. iML1515-ROS allows the simulation of ROS production for use in antibiotic design or potentiating activity11; iML976 can be used to probe the core metabolic capabilities of E. coli or as a starting point for building GEMs of clinical strains; context-specific versions of iML1515 can be used when different alternate carbon source minimal media is the preferred growth condition.
For the past decade, E. coli metabolic reconstructions have been used to discover and characterize metabolic genes25, to design antibiotics26, and to engineer production strains for industrially valuable compounds27. We hope that iML1515 will provide researchers with the best possible tools for their experiments.
Supplementary Material
ACKNOWLEDGMENTS
We would like to thank D. Zielinski, J. Lerman, J. Orth, S. Bowen, and J. Reed for helpful discussions. We’d like to thank M. Abrams for copyediting help. The work was funded by the Novo Nordisk Foundation (Grant NNF10CC1016517) and by grant 1R01GM057089 from the NIH/NIGMS and 1-U01-AI124316–01 from NIH/NIAID. B.O.P., C.J.L., and A.M.F. received support from the Novo Nordisk Foundation Center for Biosustainability (NNF10CC1016517).
Footnotes
Editor’s note: This article has been peer-reviewed.
Note: Any Supplementary Information and Source Data files are available in the online_version_of_the_paper.
COMPETING FINANCIAL INTERESTS
The authors declare no competing financial interests.
References
- 1.O’Brien EJ, Monk JM & Palsson BO Cell 161, 971–987 (2015). [DOI] [PMC free article] [PubMed] [Google Scholar]
- 2.Monk J, Nogales J & Palsson BO Nat. Biotechnol. 32, 447–452 (2014). [DOI] [PubMed] [Google Scholar]
- 3.Denger K et al. Nature 507, 114–117 (2014). [DOI] [PubMed] [Google Scholar]
- 4.Kamat SS, Williams HJ & Raushel FM Nature 480, 570–573 (2011). [DOI] [PMC free article] [PubMed] [Google Scholar]
- 5.Hassaninasab A, Hashimoto Y, Tomita-Yokotani K & Kobayashi M Proc. Natl. Acad. Sci. USA 108, 6615–6620 (2011). [DOI] [PMC free article] [PubMed] [Google Scholar]
- 6.Feist AM et al. Mol. Syst. Biol. 3, 121 (2007). [DOI] [PMC free article] [PubMed] [Google Scholar]
- 7.Orth JD et al. Mol. Syst. Biol. 7, 535 (2011). [DOI] [PMC free article] [PubMed] [Google Scholar]
- 8.Reed JL, Vo TD, Schilling CH & Palsson BO Genome Biol. 4, R54 (2003). [DOI] [PMC free article] [PubMed] [Google Scholar]
- 9.Orth JD & Palsson BO Biotechnol. Bioeng. 107, 403–412 (2010). [DOI] [PMC free article] [PubMed] [Google Scholar]
- 10.Kumar VS & Maranas CD PLOS Comput. Biol. 5, e1000308 (2009). [DOI] [PMC free article] [PubMed] [Google Scholar]
- 11.Brynildsen MP, Winkler JA, Spina CS, MacDonald IC & Collins JJ Nat. Biotechnol. 31, 160–165 (2013). [DOI] [PMC free article] [PubMed] [Google Scholar]
- 12.Gama-Castro S et al. Nucleic Acids Res. 36, D120–D124 (2008). [DOI] [PMC free article] [PubMed] [Google Scholar]
- 13.Chang RL et al. Science 340, 1220–1223 (2013). [DOI] [PMC free article] [PubMed] [Google Scholar]
- 14.Brunk E et al. BMC Syst. Biol. 10, 26 (2016). [DOI] [PMC free article] [PubMed] [Google Scholar]
- 15.Kim M, Zorraquino V & Tagkopoulos I PLoS Comput. Biol. 11, e1004127 (2015). [DOI] [PMC free article] [PubMed] [Google Scholar]
- 16.Yamamoto N et al. Mol. Syst. Biol. 5, 335 (2009). [DOI] [PMC free article] [PubMed] [Google Scholar]
- 17.Takeuchi R et al. BMC Microbiol. 14, 171 (2014). [DOI] [PMC free article] [PubMed] [Google Scholar]
- 18.Schmidt A et al. Nat. Biotechnol. 34, 104–110 (2016). [DOI] [PMC free article] [PubMed] [Google Scholar]
- 19.Lukjancenko O, Wassenaar TM & Ussery DW Microb. Ecol. 60, 708–720 (2010). [DOI] [PMC free article] [PubMed] [Google Scholar]
- 20.Monk JM et al. Proc. Natl. Acad. Sci. USA 110, 20338–20343 (2013). [DOI] [PMC free article] [PubMed] [Google Scholar]
- 21.Scholz M et al. Nat. Methods 13, 435–438 (2016). [DOI] [PubMed] [Google Scholar]
- 22.Karlsson FH et al. Nature 498, 99–103 (2013). [DOI] [PubMed] [Google Scholar]
- 23.Jensen KF J. Bacteriol. 175, 3401–3407 (1993). [DOI] [PMC free article] [PubMed] [Google Scholar]
- 24.Schellenberger J et al. Nat. Protoc. 6, 1290–1307 (2011). [DOI] [PMC free article] [PubMed] [Google Scholar]
- 25.Guzman GI et al. Proc. Natl. Acad. Sci. USA 112, 929–934 (2015). [DOI] [PMC free article] [PubMed] [Google Scholar]
- 26.Chang RL, Xie L, Bourne PE & Palsson BO BMC Syst. Biol. 7, 102 (2013). [DOI] [PMC free article] [PubMed] [Google Scholar]
- 27.Chung H et al. Curr. Opin. Biotechnol. 36, 73–84 (2015). [DOI] [PubMed] [Google Scholar]
- 28.Notebaart RA et al. Proc. Natl. Acad. Sci. USA 111, 11762–11767 (2014). [DOI] [PMC free article] [PubMed] [Google Scholar]
- 29.Salipante SJ et al. Genome Res. 25, 119–128 (2015). [DOI] [PMC free article] [PubMed] [Google Scholar]
- 30.von Mentzer A et al. Nat. Genet. 46, 1321–1326 (2014). [DOI] [PubMed] [Google Scholar]
Associated Data
This section collects any data citations, data availability statements, or supplementary materials included in this article.