TECHNICAL ABSTRACT
Background:
Fluid contaminants cause slipping accidents by reducing shoe–floor friction. Fluid pressures in the shoe–floor interface reduce contact between the surfaces and, thus, reduce friction between the surfaces. A technological gap for measuring fluid pressures, however, has impeded improved understanding of what factors influence these pressures.
Purpose:
This study aimed to introduce a technique for measuring fluid pressures under the shoe and to demonstrate the utility of the technique by quantifying the effects of tread depth and fluid viscosity on fluid pressures for two different shoes.
Methods:
A fluid pressure sensor embedded in the floor surface was used to measure fluid pressures, while a robotic slip-tester traversed the shoe over the floor surface. Multiple scans were collected to develop 2D fluid pressure maps across the shoe surface. Two shoe tread types (an athletic shoe and a work shoe), two fluids (high-viscosity diluted glycerol and a low-viscosity detergent solution), and three tread depths (full tread, half tread, and no tread) were tested, while fluid pressures were measured.
Results:
Untreaded shoes combined with a high-viscosity fluid resulted in high fluid pressures, while treaded shoes or low-viscosity fluids resulted in low fluid pressures. The increased fluid pressures that were observed for the untreaded shoes are consistent with tribology theory and evidence from human slipping studies.
Conclusions:
The methods described here successfully measured fluid pressures and yielded results consistent with tribological theory and human slipping experiments. This approach offers significant potential in evaluating the slip-resistance of tread designs and determining wear limits for replacing shoes.
Keywords: Slip and fall accidents, shoe tread, fluid pressures
INTRODUCTION
Falling accidents cause a large number of occupational injuries, which lead to significant costs in worker’s compensation claims and lost time. In 2011, 15% of non-fatal injuries (U.S. Department of Labor– Bureau of Labor Statistics, 2012b) and 14% of fatal injuries were due to same level falling accidents (U.S. Department of Labor––Bureau of Labor Statistics, 2012a). The safety index by Liberty Mutual Research Institute reports that same level falls cost nearly $8 billion in 2009 and are the fastest growing source of injuries during the 11 years preceding 2009 (Liberty Mutual Research Institute, 2012). Slips have been shown to account for between 40% and 50% of falling incidents (Courtney et al., 2001). A reduction in slip and fall injuries could be critical in reducing the number of accidental injuries and the associated costs.
Characteristics of footwear have significant effects on the likelihood of slipping. Inadequate tread has been identified as a risk factor for slips, trips, and falls in mail delivery (Bentley & Haslam, 1998, 2001; Haslam & Bentley, 1999). Coefficient of friction is the prevailing method for quantifying slipperiness of shoe designs. When the coefficient of friction between a shoe and floor is less than the amount of friction required to sustain gait (commonly termed the required coefficient of friction), a slip becomes likely (Hanson et al., 1999; Burnfield & Powers, 2006;). Footwear characteristics that affect friction include outsole material (Grönqvist, 1995; Strobel et al., 2012), roughness (Manning et al., 1999; Strobel et al., 2012), wear progression (Kim, 2000; Kim et al., 2001), tread width (Li & Chen, 2004), and tread depth (Li et al., 2006). Different relationships have been observed between tread channel size and friction coefficient, with some studies showing a positive correlation (Li & Chen, 2004; Li et al., 2006) and other studies showing an inconsistent relationship (Blanchette & Powers, 2012). Because shoe–floor friction is a gross approximation of numerous tribological mechanisms (Chang et al., 2001; Beschorner et al., 2009), additional measurements beyond coefficient of friction may provide critical insight on the tribological mechanisms relevant to slipping accidents and may be used to guide specific interventions.
Hydrodynamic effects from fluid contaminants have been identified as one of the main tribological mechanisms relevant to the shoe–floor–fluid interface. The Reynolds equation (Equation (1a)), which describes fluid dynamics in a thin-film interface, has been frequently used to describe the lubricating behavior of the fluid separating shoe and floor surfaces (Strandberg, 1985; Proctor & Coleman, 1988; Chang et al., 2001; Beschorner et al., 2009). The Reynolds equation has two right-hand terms corresponding to the wedge and squeeze effects. The wedge effect is dependent on sliding velocity and film thickness gradients in the x- and y-direction. The squeeze term is dependent on the temporal change in film thickness (vz). Features of the shoes, such as tread, modify the film thickness profile h, which then causes changes to the pressure profile p. Tread channels, specifically, are meant to move fluid out of the shoe–floor interface and ameliorate hydrodynamic effects (Strandberg, 1985; Tisserand, 1985). According to the Reynolds equation, the two primary contributing factors to hydrodynamic effects are squeeze-film (Equation (1b)), where a film thickness (h) and pressure develops in the fluid as it is squeezed out from the interface during shoe loading (Strandberg, 1985; Chang et al., 2001), and the wedge effect (Equation (1c)), where the motion of the shoe over the floor surface causes fluid film thickness (h) and pressure to develop in the shoe–floor interface (Proctor & Coleman, 1988; Chang et al., 2001; Beschorner et al., 2009). Previous shoe–floor–fluid modeling studies have relied on the assumption that a pressurized fluid film layer, as described by the Reynolds equation, exists between the shoe and the floor (Batterman et al., 2004; Beschorner et al., 2009). Despite this theoretical basis being established over 25 years ago (Strandberg, 1985; Tisserand, 1985; Proctor & Coleman, 1988), a lack of methods for measuring fluid pressures is a major barrier for identifying the cause of low friction and thus guiding interventions that improve the slip-resistance of footwear. This study aimed to address that barrier by describing a novel method for measuring fluid pressures:
| (1a) |
| (1b) |
| (1c) |
The purpose of this study was to introduce a technique for measuring fluid pressures under the shoe and demonstrate the utility of the technique by quantifying the effects of tread depth and fluid viscosity on fluid pressures for two different shoes.
MATERIALS AND METHODS
Apparatus, Experiments, and Materials
The experimental apparatus consisted of a robotic device that reproduced forces and sliding speeds similar to a human slip, a force plate, and a fluid pressure sensor embedded in the floor that measured hydrodynamic pressures. The robotic device was similar to the Portable Slip Simulator, which is a portable adaptation of the Slip Simulator and was developed by researchers at the Finnish Institute of Occupational Health (Aschan et al., 2005). The device consists of three linear motors installed vertically to generate vertical forces and a horizontal motor that moved the shoe anteriorly during the slip (Fig. 1). Vertical forces of approximately 250 N or 500 N were built up over a 30-ms time period, with higher forces being used for lower friction values (Aschan et al., 2005; Fig. 2). The lower vertical forces were used when the coefficient of friction exceeded 0.11 because of a limited force production capacity in the horizontal motor. The selection of the vertical force level has previously been shown to not affect results of this device between 250 N or 500 N (Aschan et al., 2005). The magnitude of the vertical force was selected so that it produces about 40%–85% of the body weight for a 60-kg adult, which is in the approximate range of the peak force typically generated during unexpected slips (Redfern et al., 2001). The sliding velocity was held at approximately 0.7 m/s during the simulated slip similar to sliding velocities that have been previously demonstrated in human slipping studies (Fig. 2; Cham & Redfern, 2002b). Shoe angle was set to 10°, which is similar to shoe angles that are observed during slipping (Leamon & Son, 1989; Cham & Redfern, 2002a). These testing conditions were consistent with a set of testing recommendations that have been set by a group of slip-testing experts (Chang et al., 2001). All data were collected at room temperature (20° C), and the fluid contaminants were given adequate time to reach room temperature before tests were conducted. The robotic device was operated over a force platform to ensure that correct normal forces during the simulated slip were achieved (Fig. 2). A fluid pressure sensor (Setra 209, inlet diameter 10 mm; Setra, Boxborough, MA, USA) was embedded into the floor surface to measure hydrodynamic pressures in the shoe–floor interface. The top of the pressure sensor was slightly recessed below the top of the floor surface to prevent it from interfering with the shoe. This method has been used in other tribological applications, such as chemical mechanical polishing to measure thin-film fluid pressures (Shan et al., 2000). Pressure data were sampled at 1000 Hz.
FIGURE 1.
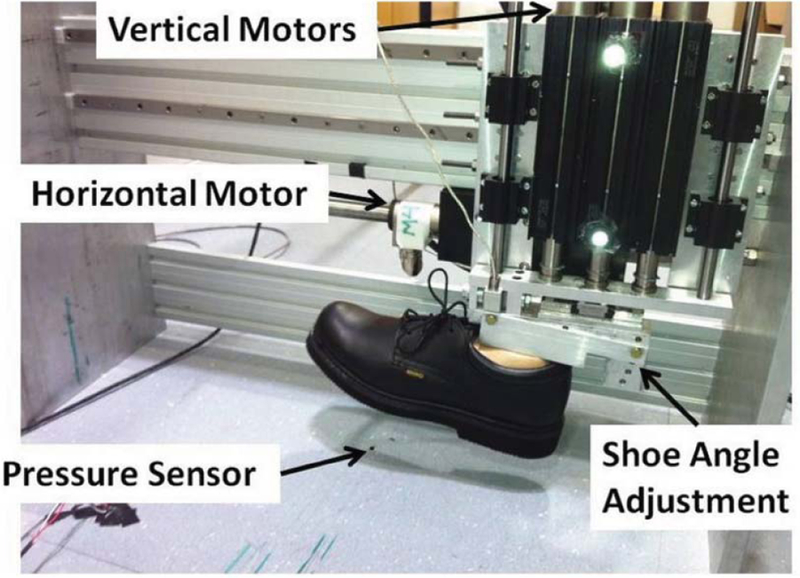
Slip-testing apparatus including the device and pressure sensor.
FIGURE 2.
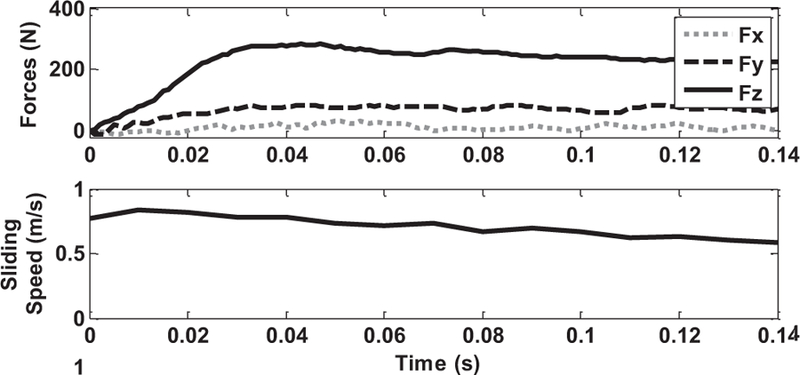
Representative forces and sliding speeds from a slip test. In the top graph, Fz is the normal force, Fy is the shear force in the slipping direction, and Fx is the shear force perpendicular to the slipping direction.
For each shoe–floor–fluid condition, seven trials were collected to characterize the fluid pressures across the shoe surface. The shoe was placed in a different location relative to the pressure sensor for each of the seven fluid pressure trials so that a different part of the shoe was measured with each trial. Between each of the fluid pressure trials, the shoe was moved 10 mm laterally. A reflective marker was attached to the shoe and tracked with motion capture system (Motion Analysis Corporation, Santa Rosa, CA) to determine the position of the shoe relative to the pressure sensor. Floor surfaces were flooded with the fluid contaminant to the point where adding additional liquid did not increase the thickness of the fluid film. The inlet of the pressure sensor was fully filled with the fluid to prevent air, which is compressible, from affecting the measurements. Fluid contaminants were reapplied to the floor surfaces between each trial. The shoe surface was prewetted with the contaminant before the start of data collection, and the shoe surface was thoroughly cleaned before a new fluid was tested to ensure no contamination across fluids.
The testing materials included two shoe types, which were abraded to three different tread depth levels, one floor material, and two fluid contaminants. The shoe designs included an athletic shoe and a work shoe (Fig. 3), the flooring was vinyl tile, and the fluids included a diluted glycerol solution (90% glycerol and 10% water by volume, 219 cP) and a detergent solution (Pledge Commercial Line Multi Surface Floor Cleaner® 1.5% detergent, 98.5% water by volume, 1.89 cP; S. C. Johnson, Inc., Racine, WI, USA). Shoe heels were abraded to systematically remove tread, similarly to methods developed by the International Standards Organization for evaluating the abrasion resistance of shoe materials (International Standards Organization, 2012). The three different tread depth levels included full tread, where the shoes were just lightly abraded to remove the outermost layer; half tread, where tread was removed until the tread depth was approximately half of its original level; and no tread, where most of the tread was removed (Fig. 3). During the abrading process, the material removal process was periodically paused to ensure that heat generation was not causing a chemical change in the shoe material. Because of the complex shape of the athletic shoe’s tread, some minor tread features were not fully removed to prevent exposing the midsole material. Shoe hardness was measured using Shore A hardness scale, tread was measured using calipers, and shoe roughness was measured using a 2D profilometer (see Table 1 for measurements). Hardness, tread, and roughness measurements were taken from the back section of the heel. The floor hardness was measured to be 99 on the Shore A scale. The floor roughness had an average roughness (Ra) of 0.33 μm, an RMS roughness of 0.45 μm, and an average peak to valley height (Rz) of 1.00 μm. Roughness and waviness quantities were measured at four different orientations over an evaluation length of 8 mm with a stylus profilometer (Taylor Hobson Surtronic 25, AMETEK, Inc., Paoli, PA, USA), calculated using a cutoff length of 0.8 mm and averaged.
FIGURE 3.
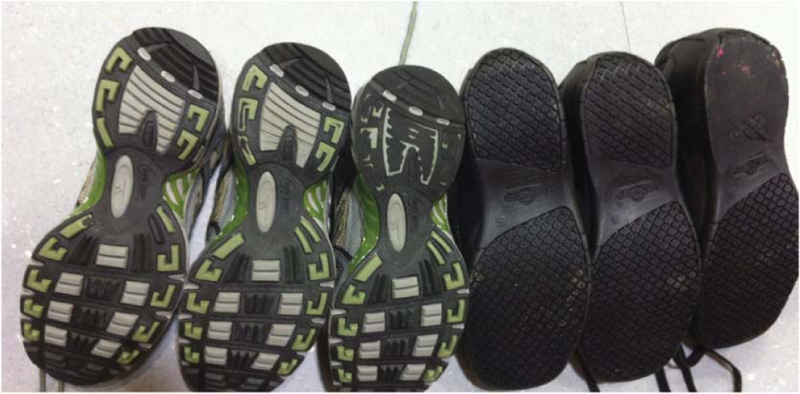
Shoes tested in this study from left to right: full-tread athletic, half-tread athletic, no-tread athletic, full-tread work, half-tread work, and no-tread work. Tread was only removed from the heel of the shoe as that was the contact region during slipping.
TABLE 1.
Tread width, tread depth, shoe hardness, and shoe roughness for all shoes considered in this study
| Work shoe |
Athletic shoe |
|||||
|---|---|---|---|---|---|---|
| Full tread | Half tread | No tread | Full tread | Half tread | No tread | |
| Tread channel width (mm) | 2.5 | 2.4 | N/A | 5.5 | 3.5 | N/A |
| Tread depth (mm) | 3.0 | 1.5 | 0 | 4.0 | 2.0 | 0.0 |
| Shoe hardness (Shore A) | 58 | 71 | 68 | 85 | 83 | 79 |
| Roughness (Ra) (μm) | 7.24 | 5.74 | 4.44 | 5.05 | 5.24 | 4.43 |
Data Analysis
A map of the fluid pressures across the shoe surface was developed by combining multiple fluid pressure scans. The location of the shoe relative to the pressure sensor was calculated for each time point for each of the seven scans to generate a 2D map of hydrodynamic pressures. The total load supported by the fluid was calculated by integrating the fluid pressures over the shoe sole surface. A numerical integration technique was applied to calculate the load supported by the fluid. Specifically, each pressure value was multiplied by the distance between scans, Δx (10 mm), and the displacement between each time series sample, Δy (Equation (2)). The displacement between each time series sample is the product of the sliding velocity (0.7 m/s) and the time between samples (0.001 sec). This analysis relied on the assumption that the fluid pressures were in steady state since the different time points were used to calculate fluid pressures at different locations. High load support by the fluid is indicative that a fluid film is separating the surfaces (Beschorner et al., 2009). The effects of tread depth and fluid viscosity on the fluid pressure support were tested using an ANOVA, where the total load supported by the fluid was the dependent variable. Fluid, tread depth, and their interaction were the independent variables:
| (2) |
RESULTS
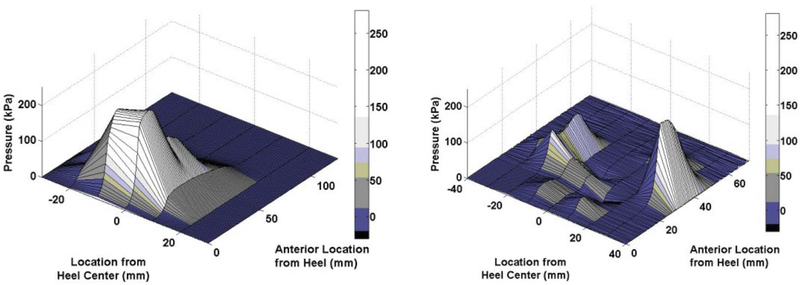
Substantial hydrodynamic pressures were observed in conditions where the high-viscosity fluid was combined with untreaded shoes (Fig. 4). Peak hydrodynamic pressures were located centrally on the posterior portion of the heel for the work shoe and were distributed across the posterior portion of the untreaded athletic shoe. The fluid pressures of the athletic shoe were divided into two regions on either side of a tread channel that ran in an arc across the posterior portion shoe (Fig. 3). The largest fluid pressures were identified on the medial side of the shoe just anterior to this tread channel (Fig. 4). The peak hydrodynamic pressure were 234 kPa and 214 kPa for the work shoe and athletic shoe, respectively. Tread depth (p < 0.01), fluid (p < 0.01), and interaction between fluid and tread depth (p < 0.01) all significantly influenced the load supported by the fluid. The load supported by the fluid was 201 N of the 500-N vertical force for the untreaded work shoe and 83 N of the 500-N vertical force for the untreaded athletic shoe when the glycerol was present (Fig. 5). The load supported by the fluid was negligible (i.e., was less than 5 N or 1% of the total normal load) with medium- or full-tread shoes or with low-viscosity fluids.
FIGURE 4.
Hydrodynamic pressure profile of the work shoe (left) and the athletic shoe (right). Axis on the left represents the position relative to the center of the heel (medial is positive); axis on the right represents the anterior position from the heel.
FIGURE 5.
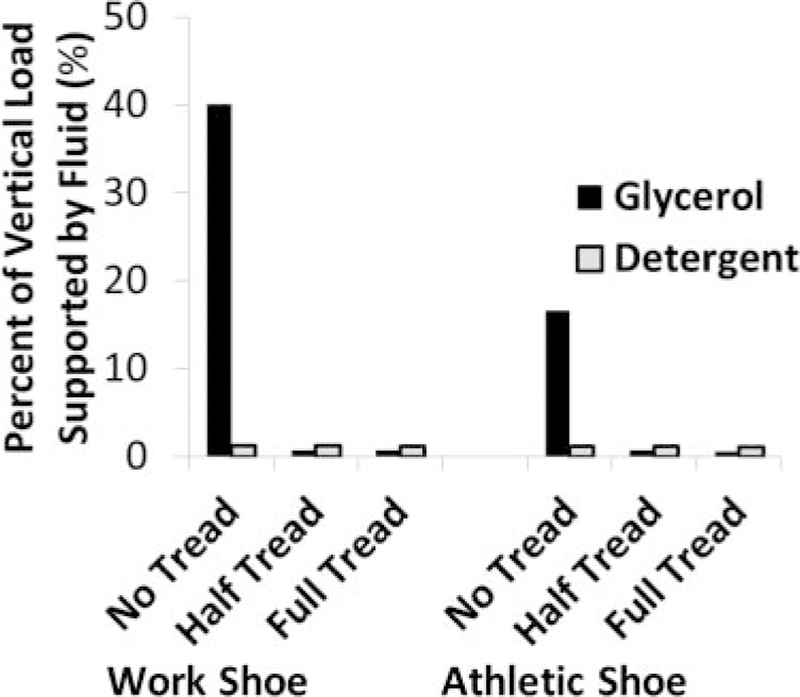
Effects of tread depth on the load supported by the fluid for the work shoe (left) and the athletic shoe (right) in the presence of glycerol (black bars) and detergent (gray bars). ptread depth < 0.01; pfluid < 0.01; ptread depth*fluid < 0.01.
DISCUSSION
This study aimed to introduce an approach for measuring fluid pressures in the shoe–floor interface and demonstrate its utility by evaluating different tread depths and fluids for two different shoes. The methodology successfully measured hydrodynamic pressures, which were mapped across the shoe surface. Hydrodynamic pressures were observed when a high-viscosity fluid was combined with an untreaded shoe. Hydrodynamic pressures were not present for treaded shoes and when a low viscosity fluid was present.
The empirical relationships between fluid pressures, tread depth, and fluid are consistent with tribological theory and human-based slipping studies. The absence of shoe tread led to the development of fluid pressures as has been hypothesized by other researchers (Strandberg, 1985; Tisserand, 1985; Li & Chen, 2004; Li et al., 2006) and confirmed in unexpected slips of human subjects (Beschorner et al., 2014). Since the film thickness (h), a function of the shoe geometry (Beschorner et al., 2009), has an inverse relationship with fluid pressures (p), according to the Reynolds equation (Equation (1a)), the finding that tread channels reduce fluid pressures is consistent with this theory. Also, the absence of hydrodynamic pressures for the low-viscosity fluid is consistent with the Reynolds equation. Since viscosity η is in the denominator of the left-hand terms that include pressure p as a numerator, a positive association between fluid pressure and fluid viscosity is expected.
Measuring hydrodynamic pressures may serve as a tool for designing shoe tread and developing shoe replacement guidelines. For example, the peak pressures were found near the centerline of the shoe approximately 20 mm anterior of the heel, suggesting that tread is most critical in this region of the shoe. Furthermore, tread depths of 1.5 mm and 2.0 mm were sufficient to eliminate fluid pressures in the work and athletic shoes, respectively. Interestingly, the relationship between fluid pressures and tread depth were not linear. Fluid pressures dramatically decreased from no tread to half tread and then did not change between half tread and full tread. This suggests that shoe wear may have little effect on the slip resistance of shoe tread until a threshold is reached. Once the wear threshold is reached, a dramatic reduction in slip resistance can be expected when stepping on high-viscosity fluids. The threshold at which fluid pressures begin to develop may provide a basis for developing shoe replacement guidelines. Finally, the finding that fluid pressures were only observed for the high-viscosity fluid suggests that tread becomes particularly important in environments where high viscosity fluids (i.e., vegetable oils, machining oils, etc.) are common.
Future experimental studies should focus on expanding the number of conditions that were considered including additional tread designs, flooring, and fluids. In addition, the effects of testing parameters, such as shoe angle, slipping speed, and vertical forces, on hydrodynamic effects are not yet known. The method of artificially wearing the shoes using abrasion should be validated by comparing the results of this study with fluid pressures from naturally worn shoes. Since shoe roughness changed as the shoe wore down, additional studies should be conducted to determine if fluid pressures are more dependent on the macroscopic-scale features (tread) or the microscopic-scale features (roughness) of the shoe outsole. Finally, a sensitivity study should be conducted to determine whether the load supported by the fluid is sensitive to the distance between scans and to determine if a gap of 10 mm is accurate for characterizing fluid pressures across the entire shoe surface.
OCCUPATIONAL APPLICATIONS.
This study introduces a method for measuring fluid pressures in the shoe–floor interface. The novel method was then applied to shoes with varying tread depths. The rationale for this approach is that measuring fluid pressures can help to identify the reason for low friction and guide interventions for increasing slip resistance. High fluid pressures were observed in the absence of tread and the presence of high viscosity fluids. Fluid pressures were negligibly small when at least 1.5 mm of tread depth was present or when a low viscosity fluid was present. This study indicates that shoe tread is effective at channeling fluid out from the shoe–floor interface in the presence of highly viscous fluids. The presented methodology may be suitable for testing the performance of tread designs and establishing wear limits for shoe replacement.
Acknowledgments
FUNDING
This research was funded by the National Institute of Occupational Safety and Health (NIOSH R01 OH008986–01), although it had no role in the design or execution of the study.
Footnotes
CONFLICT OF INTEREST
The authors declare no conflict of interest. The corresponding author receives consulting fees for the development of a commercial fluid pressure sensor device and slip tester. The devices being developed by the corresponding author are substantially different than those described in this article.
REFERENCES
- Aschan C, Hirvonen M, Mannelin T, & Rajamaki E (2005). Development and validation of a novel portable slip simulator. Applied Ergonomics, 36, 585–593. [DOI] [PubMed] [Google Scholar]
- Batterman SD, Batterman SC, & Medoff HP (2004). Mechanics of macroslip: A new phenomenological theory. In McCabe PT (Ed.), Contemporary ergonomics (pp. 58–62). Boca Raton, FL: CRC. [Google Scholar]
- Bentley T, & Haslam R (1998). Slip, trip and fall accidents occurring during the delivery of mail. Ergonomics, 41(12), 1859–1872. [DOI] [PubMed] [Google Scholar]
- Bentley T, & Haslam R (2001). Identification of risk factors and counter-measures for slip, trip and fall accidents during the delivery of mail. Applied Ergonomics, 32(2), 127–134. [DOI] [PubMed] [Google Scholar]
- Beschorner KE, Albert DA, Chambers AJ, & Redfern MR (2014). Fluid pressures at the shoe–floor–contaminant interface during slips: Effects of tread & implications on slip severity. Journal of Biomechanics, 47, 458–463. [DOI] [PMC free article] [PubMed] [Google Scholar]
- Beschorner KE, Lovell M, Higgs CF III, & Redfern MS (2009). Modeling mixed-lubrication of a shoe–floor interface applied to a pin-on-disk apparatus. Tribology Transactions, 52(4), 560–568. [Google Scholar]
- Blanchette M, & Powers C (2012). The influence of footwear tread groove parameters on available friction. Human Factors & Ergonomics Society, Boston, MA. [DOI] [PubMed] [Google Scholar]
- Burnfield J, & Powers C (2006). Prediction of slip events during walking: An analysis of utilized coefficient of friction and available slip resistance. Ergonomics, 49(10), 982–985. [DOI] [PubMed] [Google Scholar]
- Cham R, & Redfern MS (2002a). Changes in gait when anticipating slippery floors. Gait & Posture, 15(2), 159–171. [DOI] [PubMed] [Google Scholar]
- Cham R, & Redfern MS (2002b). Heel contact dynamics during slip events on level and inclined surfaces. Safety Science, 40(7–8), 559–576. [Google Scholar]
- Chang WR, Gronqvist R, Leclercq S, Brungraber RJ, Mattke U, Strandberg L, . . . Courtney TK (2001). The role of friction in the measurement of slipperiness, Part 2: Survey of friction measure-ment devices. Ergonomics, 44(13), 1233–1261. [DOI] [PubMed] [Google Scholar]
- Chang WR, Gronqvist R, Leclercq S, Myung R, Makkonen L, Strandberg L, . . . Thorpe SC (2001). The role of friction in the measurement of slipperiness, Part 1: Friction mechanisms and definition of test conditions. Ergonomics, 44(13), 1217–1232. [DOI] [PubMed] [Google Scholar]
- Courtney TK, Sorock GS, Manning DP, Collins JW, & Holbein-Jenny MA (2001). Occupational slip, trip, and fall-related injuries—Can the contribution of slipperiness be isolated? Ergonomics, 44(13), 1118–1137. [DOI] [PubMed] [Google Scholar]
- Grӧnqvist R (1995). Mechanisms of friction and assessment of slip resistance of new and used footwear soles on contaminated floors. Ergonomics, 38(2), 224–241. [DOI] [PubMed] [Google Scholar]
- Hanson JP, Redfern MS, & Mazumdar M (1999). Predicting slips and falls considering required and available friction. Ergonomics, 42(12), 1619–1633. [DOI] [PubMed] [Google Scholar]
- Haslam R, & Bentley T (1999). Follow-up investigations of slip, trip and fall accidents among postal delivery workers. Safety Science, 32(1), 33–47. [Google Scholar]
- International Standards Organization. (2012). Footwear—test methods for outsoles—abrasion resistance (ISO 20871–2001) Switzerland: ISO. [Google Scholar]
- Kim IJ (2000). Wear progression of shoe heels during slip resistance measurements. Proceedings of the Human Factors and Ergonomics Society Annual Meeting, San Diego, CA. [Google Scholar]
- Kim IJ, Smith R, & Nagata H (2001). Microscopic observations of the progressive wear on shoe surfaces that affect the slip resistance characteristics. International Journal of Industrial Ergonomics, 28 (1), 17–29. [Google Scholar]
- Leamon TB, & Son DH (1989). The natural history of microslip. In Mital A (Ed.), Advances in industrial ergonomics and safety I (pp. 633–638). London, United Kingdom: Taylor & Francis. [Google Scholar]
- Li K, & Chen CJ (2004). The effect of shoe soling tread groove width on the coefficient of friction with different sole materials, floors, and contaminants. Applied Ergonomics, 35(6), 499–507. [DOI] [PubMed] [Google Scholar]
- Li K, Wu HH, & Lin YC (2006). The effect of shoe sole tread groove depth on the friction coefficient with different tread groove widths, floors and contaminants. Applied Ergonomics, 37(6), 743–748. [DOI] [PubMed] [Google Scholar]
- Liberty Mutual Research Institute. (2012). Liberty Mutual workplace safety index Hopkinton, MA: Liberty Mutual Research Institute. [Google Scholar]
- Manning DP, Jones C, Rowland FJ, & Roff M (1999). The surface roughness of a rubber soling material determines the coefficient of friction on water-lubricated surfaces. Journal of Safety Research, 29(4), 275–283. [Google Scholar]
- Proctor TD, & Coleman V (1988). Slipping, tripping and falling accidents in Great Britain—Present and Future. Journal of Occupational Accidents, 9(4), 269–285. [Google Scholar]
- Redfern MS, Cham R, Gielo-Perczak K, Gronqvist R, Hirvonen M, Lanshammar H, . . . Pai YC (2001). Biomechanics of slips. Ergonomics, 44, 1138–1166. [DOI] [PubMed] [Google Scholar]
- Shan L, Levert J, Meade L, Tichy J, & Danyluk S (2000). Interfacial fluid mechanics and pressure prediction in chemical mechanical polishing. Journal of Tribology, 122, 539. [Google Scholar]
- Strandberg L (1985). The effect of conditions underfoot on falling and overexertion accidents. Ergonomics, 28(1), 131–147. [DOI] [PubMed] [Google Scholar]
- Strobel CM, Menezes PL, Lovell M, & Beschorner K (2012). Analysis of the contribution of adhesion and hysteresis to shoe–floor lubricated friction in the boundary lubrication regime. Tribology Letters, 46(3), 341–347. [Google Scholar]
- Tisserand M (1985). Progress in the prevention of falls caused by slipping. Ergonomics, 28, 1027–1042. [DOI] [PubMed] [Google Scholar]
- U.S. Department of Labor—Bureau of Labor Statistics. (2012a). Census of fatal occupational injuries summary: Table 2. Fatal occupational injuries by industry and selected event or exposure, 2011 Retrieved October 15, 2013, from http://www.bls.gov/news.release/cfoi.nr0.htm.
- U.S. Department of Labor—Bureau of Labor Statistics. (2012b). Nonfatal Occupational injuries and illnesses requiring days away from work: Table 5. Number, incidence rate, and median days away from work for nonfatal occupational injuries and illnesses involving days away from work by selected injury or illness characteristics and private industry, state government, and local government, 2011 Retrieved October 15, 2013, from http://www.bls.gov/news.release/osh2.t05.htm.


