Abstract
In the past decade, the role of inflammation has been shown in diabetes and its complications. Little is available on high mobility group box 1 (HMGB1) actions on the proteins involved in insulin signal transduction, which may be altered to result in insulin resistance in the retina. REC were grown in normal or high glucose and treated with recombinant human HMGB1, an Epac1 agonist, or both. Additional cells were treated with advanced glycation end-products (RAGE) or toll-like receptor 4 (TLR4) siRNA prior to rhHMGB1. Proteins lysates were processed for Western blotting for TLR4, RAGE, insulin receptor, Akt, and IRS-1 phosphorylation. We found that rhHMGB1 blocked insulin and Akt phosphorylation through either RAGE or TLR4 actions. Epac1 overcame both endogenous and exogenous HMGB1 to maintain normal insulin signaling. Taken together, these data offer upstream targets to maintain proper insulin signal transduction in the retinal vasculature.
Keywords: retinal endothelial cells; HMGB1, insulin receptor; signaling; TLR; RAGE
Introduction.
The role of inflammation is becoming increasingly recognized as a link between a wide variety of diseases, including diabetes, heart disease, cancer, and arthritis. The difficulty lies in understanding how activation of the inflammatory response results in a given disease. Inhibition of signaling pathways upstream to inflammatory mediators can offer new options for therapy development. One such pathway is the danger associated molecular pattern (DAMP) molecules, such as high mobility group box 1 (HMGB1) (1).
HMGB1 is a nuclear protein that is present in most eukaryotic cells, but it can be secreted by specific cell types, such as natural killer cells, macrophages, and mature dendritic cells in response to injury or inflammation (1). Inhibition of HMGB1 has provided options for therapies for rheumatoid arthritis, sepsis, and cancer (2). More recently, HMGB1 has been suggested to be key in the link between diabetes and various diabetic complications (3).
We chose to further investigate a role for HMGB1 in primary human retinal endothelial cells (REC), as inhibition of HMGB1 by glycyrrhizin restored normal insulin signal transduction and was protective against ischemia/reperfusion injury in the retina (4). Work in patients with both proliferative diabetic retinopathy and non-proliferative diabetic retinopathy had increased levels of HMGB1, with a stronger response in patients with proliferative disease (5). These findings agree with literature in 3T3-L1 adipocytes showing deleterious effects of HMGB1 in insulin-induced activation of Akt (6). Others have reported that HMGB1 can activate toll-like receptor 4 (TLR4), leading to increased JNK levels and decreased IRS-1 (3). We also recently reported that TLR4 significantly altered insulin signaling in the retina (7). Work in mice on a high fat diet (HFD) showed that inhibition of HMGB1 reduced weight gain, a feature often linked to insulin resistance (8). Similar to TLR4, work in a SW872 preadipocyte cell line showed that HMGB1 signaled through the receptor for advanced glycation end products (RAGE) to promote inflammation linked to obesity and type 2 diabetes (9), and this signaling did not involve TLR4. Work on mice with a high fat diet showed that inhibition of RAGE partially protected against weight gain and peripheral inflammation (10).
One pathway that lies upstream to HMGB1 in REC is exchange protein for cAMP 1 (Epac1). We have previously shown that Epac1 significantly decreased HMGB1 levels (11). Further, Epac1 decreased key inflammatory markers in REC and in whole retinal lysates from Epac1 endothelial cell specific knockout mice (12). Epac1 was also shown to regulate retinal insulin signaling through this reduction in inflammatory mediators, specifically tumor necrosis factor alpha (TNFα) and interleukin-1-beta (IL-1β) (13). Since we have previously showed that Epac1 decreased HMGB1 and regulated insulin signaling, we sought to determine if these 2 events were linked in REC.
In this study, we used retinal endothelial cells grown in normal and high glucose to determine whether HMGB1 utilizes RAGE or TLR4 to mediates its inhibition of normal insulin signaling. We also treated some cells with an Epac1 agonist, as we have recently shown that Epac1 can maintain normal insulin signaling and block HMGB1 actions (11).
Methods
Retinal endothelial cells (REC).
Primary human retinal endothelial cells (REC) were purchased from Cell Systems Corporation (CSC, Kirkland, Washington) and grown in Cell Systems medium (normal glucose (5mM glucose) or high glucose (25mM glucose)) and microvascular growth factors (MVGS), 10ug/mL gentamycin, and 0.25ug/mL amphotericin B (Invitrogen, Carlsbad, CA) on attachment factor coated dishes. Cells were quiesced by incubating in high or normal glucose medium without MVGS for 24 hours prior to experimental use. All cells were used prior to passage 5. Cells were cultured in high glucose for a minimum of 3 days.
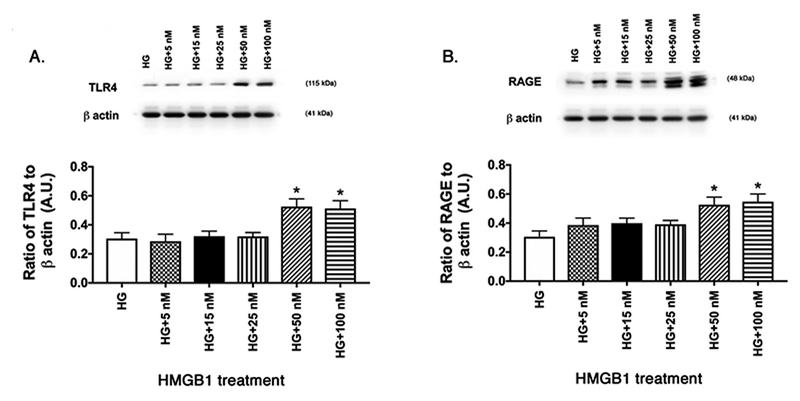
Some cells in all groups were treated with recombinant human HMGB1 to increase TLR4 and RAGE protein levels (50nM for 24 hours, Abcam, Minneapolis, MN (Figure 1). Some cells received rhHMGB1 and an Epac1 agonist (8-CPT=2’-O-Me-cAMP) at 10um for 2 hours. Additional groups were transfected with TLR4 siRNA (5nM, Dharmacon), RAGE siRNA (5nM, Dharmacon,), or scrambled siRNA (Sc) for 24 hours prior to rhHMGB1 treatment. Transfection was done using RNAiMax following the manufacturer’s instructions. A RAGE and TLR4 Western blotting were done to confirm successful knockdown by siRNA. Cells were treated with exogenous rhHMGB1 to increase HMGB1 levels beyond the increase observed in high glucose culturing conditions alone.
Figure 1.
Dose response curve for HMGB1 in activation of TLR4 and RAGE. REC grown in HG were treated with escalating doses of recombinant human HMGB1. Western blotting was done for TLR4 (A) and RAGE (B). *P<0.05 vs. HG. N=4 dishes in each group.
Western blotting.
Cell culture lysates were collected into buffer containing protease and phosphatase inhibitors. Equal amounts of protein were separated onto pre-cast tris-glycine gels (Invitrogen, Carlsbad, CA), and blotted onto nitrocellulose membrane. After blocking in TBST (10mM Tris-HCl buffer, pH 8.0, 150 mM NaCl, 0.1% Tween 20) and 5% (w/v) BSA, the membranes were treated with antibodies for phosphorylated and total insulin receptor (IR), insulin receptor substrate one (IRS-1) phosphorylated on serine 307, total IRS-1, phosphorylated Akt on serine 473 (p-Akt), total Akt (Cell Signaling Technology, Danvers, MA), HMGB1, RAGE, and TLR4, histone 2B (Abcam, Cambridge, MA), and beta actin (Santa Cruz Biotechnology, Santa Cruz, CA) followed by incubation with secondary antibodies labeled with horseradish peroxidase. Antigen-antibody complexes were detected by chemilluminescence reagent kit (Thermo Scientific, Pittsburgh, PA) and data was acquired using an Azure C500 (Azure Biosystems, Dublin, CA). Western blot data were assessed using Image Studio Lite software. A representative blot is shown for each treatment group.
Statistical Analyses.
All the experiments were technical replicates. One vial of cells was used to generate the dishes for each figure using similar reagents. Data are presented as mean ± SEM. Data was analyzed using a non-parametric Kruskal-Wallis 1-way ANOVA, followed by a Dunn’s test with P values < 0.05 considered statistically significant. The ratio of phosphorylated to total protein was used for phosphorylated proteins. In the case of Western blotting, one representative blot is shown.
Results.
Dose response curve for rhHMGB1 activation of TLR4 and RAGE.
Since this was the first time using rhHMGB1 in REC, we performed a dose response curve to determine the concentration of rhHMGB1 to activate TLR4 and RAGE. All cells were grown in high glucose and treated for 24 hours with different doses of rhHMGB1. Figure 1 shows that both 50nM and 100nM significantly increased both TLR4 (A) and RAGE (B) levels in the cells. We used 50nM rhHMGB1 for all remaining experiments.
Recombinant human HMGB1 decreases insulin receptor and Akt phosphorylation, while increasing IRS-1Ser307 phosphorylation.
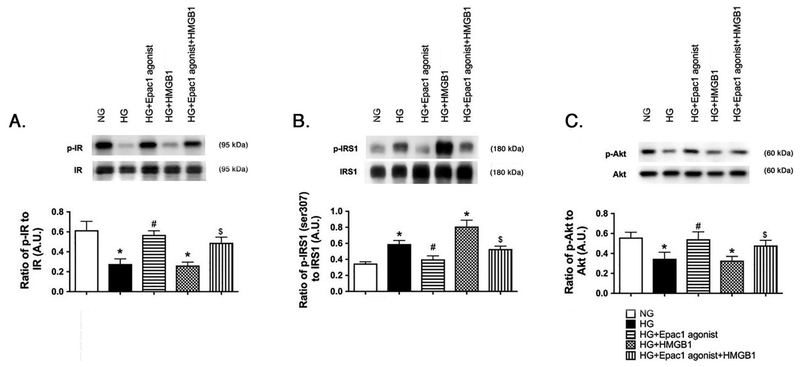
We previously reported that pharmacological inhibition of HMGB1 by Box A or glycyrrhizin restored normal insulin signaling (4). Further, we showed that high glucose culturing conditions alone increased HMGB1 levels in REC (11). The increased HMGB1 in response to high glucose is explained as HMGB1 has increased activation in responses to cellular stressors, such as high glucose, inflammatory mediators, and ischemia (3, 14). To increase both endogenous and exogenous HMGB1, REC were grown in normal glucose (5mM) or high glucose (25mM) and treated with rhHMGB1. We measured insulin receptor, IRS-1, and Akt phosphorylation. We found that rhHMGB1 decreased insulin receptor (Figure 2A) and Akt phosphorylation (Figure 2C), while increased serine 307 phosphorylation in IRS-1 (Figure 2B). These findings agree with our previous work using pharmacological HMGB1 inhibitors.
Figure 2.
rhHMGB1 regulates insulin signaling proteins. REC were grown in normal glucose (NG) or high glucose (HG) and treated with 50nM rhHMGB1. Panel A shows the ratio of phosphorylated insulin receptor (Tyr1150/1151) vs. insulin receptor, Panel B is the ratio of IRS-1Ser307 phosphorylation to total IRS-1, and Panel C is the ratio of phosphorylated Akt (Ser473) to total Akt. N=4–6 dishes for all groups. Data are mean ± SEM. *P<0.05 vs. NG, #P<0.05 vs. HG.
Epac1 can overcome rhHMGB1 actions to restore normal insulin signaling in high glucose-treated REC.
While we had reported that direct inhibition of HMGB1 could restore normal insulin signaling, and Epac1 could regulate insulin signaling, we wanted to combine these studies to determine if Epac1 could overcome both high glucose-induced increases in HMGB1 and treatment with rhHMGB1. Figure 3A and C show that Epac1 could overcome the increase in HMGB1 to restore normal insulin receptor and Akt phosphorylation, despite increased endogenous and exogenous HMGB1 actions. Epac1 also reduced IRS-1Ser307 phosphorylation in the REC treated with rhHMGB1 (Figure 3B).
Figure 3.
Epac1 regulates insulin proteins despite exogenous HMGB1. REC were grown in normal glucose (NG) or high glucose (HG). Cells in HG were treated with an Epac1 agonist, 50nM rhHMGB1, or both treatments. Panel A shows the ratio of phosphorylated insulin receptor (Tyr1150/1151) vs. insulin receptor, Panel B is the ratio of IRS-1Ser307 phosphorylation to total IRS-1, and Panel C is the ratio of phosphorylated Akt (Ser473) to total Akt. N=4–6 dishes for all groups. Data are mean ± SEM. *P<0.05 vs. NG, #P<0.05 vs. HG. $P<0.05 vs. HG+HMGB1.
HMGB1 utilized RAGE to disrupt insulin receptor and Akt phosphorylation and increase IRS-1Ser307 phosphorylation.
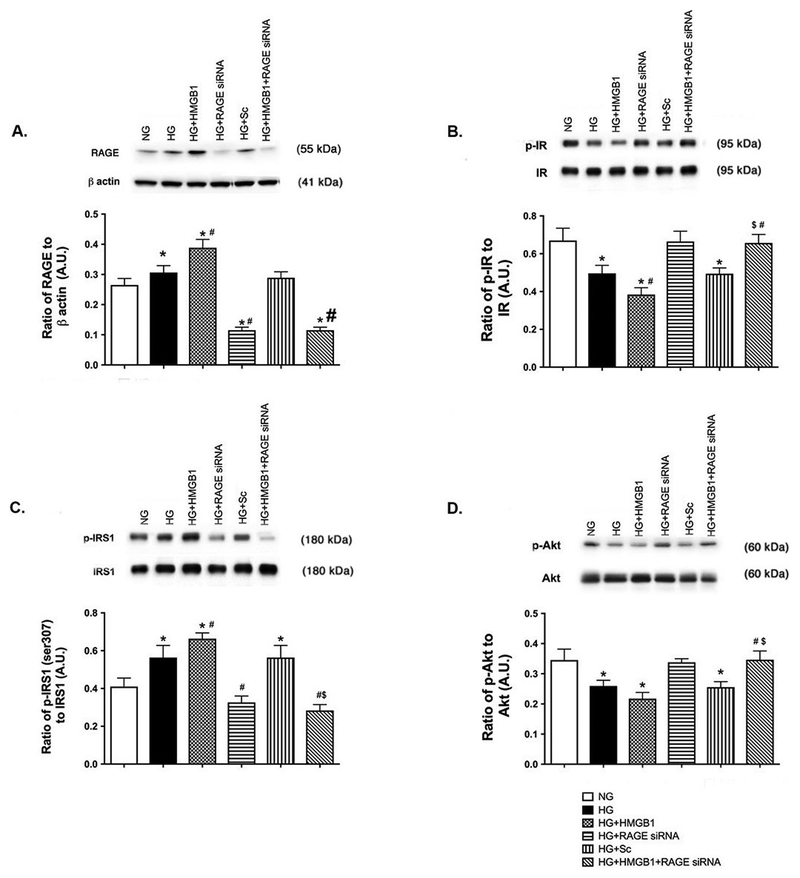
In order to better understand how HMGB1 inhibits insulin signaling, we sought to determine which receptor HMGB1 utilizes for these actions. Figure 4 shows that rhHMGB1 activates RAGE to block normal insulin signal transduction. Figure 4B and D show that HMGB1 could not inhibit insulin receptor and Akt phosphorylation when RAGE was knocked down by siRNA. Figure 4A is a control showing successful knockdown of RAGE by the siRNA. Scrambled siRNA had no effect on RAGE responses.
Figure 4.
HMGB1 utilizes RAGE to regulate insulin proteins. REC were grown in normal glucose (NG) or high glucose (HG). Cells in HG were also treated with 50nM rhHMGB1, RAGE siRNA or scrambed siRNA (HG+Sc). Panel A is RAGE as a control for the siRNA. Panel B shows the ratio of phosphorylated insulin receptor (Tyr1150/1151) vs. insulin receptor, Panel C is the ratio of IRS-1Ser307 phosphorylation to total IRS-1, and Panel D is the ratio of phosphorylated Akt (Ser473) to total Akt. N=4–6 dishes for all groups. Data are mean ± SEM. *P<0.05 vs. NG, #P<0.05 vs. HG, $P<0.05 vs. HG+HMGB1.
Similar to RAGE, TLR4 activation by HMGB1 blocks insulin signal transduction.
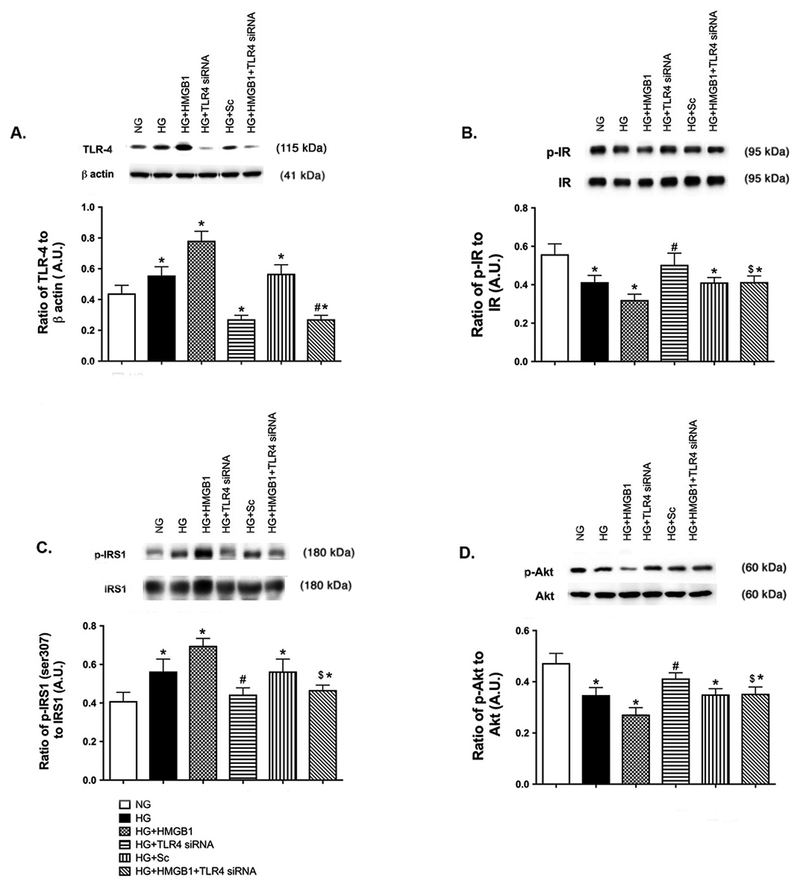
Since HMGB1 can also signal through the TLR4 receptor to mediate its actions, we also used TLR4 siRNA with rhHMGB1 to determine if HMGB1 signals through the TLR4 receptor to inhibit insulin signaling. Figure 5B and D show that rhHMGB1 could not reduce insulin receptor and Akt phosphorylation when TLR4 was blocked. rhHMGB1 also could not increase IRS-1Ser307 phosphorylation when TLR4 siRNA was used (Figure 5C). Data using high glucose and scrambled siRNA show that responses are specific to TLR4 actions. Taken together, these data show that HMGB1 inhibits insulin signal transduction through TLR4 and RAGE receptors. Epac1 can overcome high HMGB1 levels (both endogenous and exogenous) to restore normal insulin signaling.
Figure 5.
HMGB1 regulates insulin signaling proteins through TLR4 actions. REC were grown in normal glucose (NG) or high glucose (HG). Cells in HG were also treated with 50nM rhHMGB1, TLR4 siRNA or scrambed siRNA (HG+Sc). Panel A is TLR4 levels as a control for the siRNA. Panel B shows the ratio of phosphorylated insulin receptor (Tyr1150/1151) vs. insulin receptor, Panel C is the ratio of IRS-1Ser307 phosphorylation to total IRS-1, and Panel D is the ratio of phosphorylated Akt (Ser473) to total Akt. N=4–6 dishes in all groups. Data are mean ± SEM. *P<0.05 vs. NG, #P<0.05 vs. HG, $P<0.05 vs. HG+HMGB1.
Discussion.
A number of chronic diseases are linked to inflammation, including diabetic retinopathy (15, 16). While a number of different cytokines and inflammatory pathways have been investigated, none have led to successful therapy development to date for type 1 diabetes. Unfortunately, less has been done for retinal responses in type 2 diabetes. Altered insulin receptor signaling can greatly affect retinal homeostasis, as activation of the insulin receptor is anti-apoptotic (17). In the normal retina, activation of the insulin receptor by insulin binding leads to phosphorylation of insulin receptor substrate-1 (IRS-1) or IRS-2 and activation of Akt (18). Some work reported a role for IRS-2 in the retina (19). In contrast, we demonstrated that TNFα inhibited insulin signaling via phosphorylation on serine 307 on IRS-1, which was inhibited by the β-adrenergic receptor agonist, Compound 49b, in both Müller cells and REC (20, 21).
Since multiple pathways can increase TNFα actions, we sought to determine if HMGB1 could regulate insulin signaling. We focused on HMGB1, as we have shown that high glucose culturing conditions increase HMGB1 in REC, which was reduced by Epac1 (11). We also showed that Epac1 decreased TNFα levels and restored normal insulin signaling in the retinal vasculature (12, 13). We grew REC in normal and high glucose and found that endogenous and exogenous HMGB1 significantly impaired insulin and Akt phosphorylation, while increasing IRS-1Ser307 phosphorylation. We show that both TLR4 and RAGE can mediate the inhibitory actions of HMGB1 on insulin signal transduction in REC. These actions of HMGB1 on insulin signaling were overcome by Epac1, which agrees with our recent work on Epac1 and insulin signaling (13). There is not a great deal of literature on the mechanisms by which HMGB1 regulates specific proteins along the insulin signaling cascade. However, there is some literature on the general role of HMGB1 and its receptors in diabetes and the retina (3).
Work has shown that diabetes caused HMGB1 translocation to the cytoplasm in diabetic pericytes, which was associated with increased RAGE levels (22). Diabetes or intravitreal injection of HMGB1 increased reactive oxygen species and cleaved caspase 3 levels, which were inhibited by glycyrrhizin, a pharmacological HMGB1 inhibitor (23). Similar treatments of diabetes or HMGB1 increased the inflammatory marker, CXCR4, and VEGF in the retina or in REC (24). The HMGB1/RAGE axis also regulated permeability of REC (25). HMGB1 and RAGE mediated mouse adipocyte hypertrophy and insulin sensitivity, potentially through TLR2 (26).
In contrast to the study in preadipocytes, we found that HMGB1 mediated insulin signaling through both RAGE and TLR4. We focused on TLR4, since we have previously reported a role of TLR4 in insulin signaling in both REC and Müller cells in mouse retina (7, 27). TLR2 and TLR4 are both increased in diabetic patients with recently diagnosed type 2 patients (28). Work in human type 1 patients showed that insulin infusion decreased both TLR4 and HMGB1 levels in mononuclear cells (29). Future work may extend into whether TLR2 is the key difference in HMGB1 signaling through RAGE vs. TLR4; however, we have shown that Epac1 decreases TLR4 in REC (11).
Conclusions.
We found that exogenous HMGB1 significantly inhibited insulin receptor and Akt phosphorylation, while increased IRS-1Ser307 phosphorylation. These actions were mediated through either TLR4 or RAGE. Epac1 overcame both endogenous (from high glucose) and exogenous HMGB1 (from rhHMGB1) to restore normal insulin signal transduction in REC. Future work will extend these findings in vivo and expand the work to determine specific pathways by which RAGE and TLR4 inhibit insulin signal transduction.
Highlights.
HMGB1 inhibits insulin receptor and Akt phosphorylation in REC
HMGB1 increases IRS-1Ser307 phosphorylation in REC
Epac1 can overcome exogenous HMGB1 to maintain insulin signaling in REC
HMGB1 can use TLR4 or RAGE to inhibit insulin signaling in REC
Acknowledgments
Acknowledgement of Support: R01EY028442 (JJS), P30EY04068 (Hazlett), and an Unrestricted Grant to the Department of Ophthalmology from Research to Prevent Blindness (Kresge Eye Institute). The funders did not influence these design or execution of these studies.
Footnotes
Declaration of interests: No author has any conflict of interest with this work.
References.
- 1.Lotze MT and Tracey KJ.2005. High-mobility group box 1 protein (HMGB1): nuclear weapon in the immune arsenal. Nat Rev Immunol. 5:331–42. [DOI] [PubMed] [Google Scholar]
- 2.Ulloa L and Messmer D.2006. High-mobility group box 1 (HMGB1) protein: friend and foe. Cytokine Growth Factor Rev. 17:189–201. [DOI] [PubMed] [Google Scholar]
- 3.Wu H, Chen Z, Xie J, Kang LN, Wang L, and Xu B.2016. High Mobility Group Box-1: A Missing Link between Diabetes and Its Complications. Mediators Inflamm. 2016:3896147. [DOI] [PMC free article] [PubMed] [Google Scholar]
- 4.Liu L, Jiang Y, and Steinle JJ.2017. Inhibition of HMGB1 protects the retina from ischemia-reperfusion, as well as reduces insulin resistance proteins. PLoS One. 12:e0178236. [DOI] [PMC free article] [PubMed] [Google Scholar]
- 5.El-Asrar AM, Nawaz MI, Kangave D, Geboes K, Ola MS, Ahmad S, and Al-Shabrawey M.2011. High-mobility group box-1 and biomarkers of inflammation in the vitreous from patients with proliferative diabetic retinopathy. Mol Vis. 17:1829–38. [PMC free article] [PubMed] [Google Scholar]
- 6.Shimizu T, Yamakuchi M, Biswas KK, Aryal B, Yamada S, Hashiguchi T, and Maruyama I.2016. HMGB1 is secreted by 3T3-L1 adipocytes through JNK signaling and the secretion is partially inhibited by adiponectin. Obesity (Silver Spring). 24:1913–21. [DOI] [PubMed] [Google Scholar]
- 7.Liu L, Jiang Y, Curtiss E, Fukuchi KI, and Steinle JJ.2017. TLR4 regulates insulin-resistant proteins to increase apoptosis in the mouse retina. Inflamm Res. [DOI] [PMC free article] [PubMed] [Google Scholar]
- 8.Montes VN, Subramanian S, Goodspeed L, Wang SA, Omer M, Bobik A, Teshigawara K, Nishibori M, and Chait A.2015. Anti-HMGB1 antibody reduces weight gain in mice fed a high-fat diet. Nutr Diabetes. 5:e161. [DOI] [PMC free article] [PubMed] [Google Scholar]
- 9.Nativel B, Marimoutou M, Thon-Hon VG, Gunasekaran MK, Andries J, Stanislas G, Planesse C, Da Silva CR, Cesari M, Iwema T, Gasque P, and Viranaicken W.2013. Soluble HMGB1 is a novel adipokine stimulating IL-6 secretion through RAGE receptor in SW872 preadipocyte cell line: contribution to chronic inflammation in fat tissue. PLoS One. 8:e76039. [DOI] [PMC free article] [PubMed] [Google Scholar]
- 10.Song F, Hurtado del Pozo C, Rosario R, Zou YS, Ananthakrishnan R, Xu X, Patel PR, Benoit VM, Yan SF, Li H, Friedman RA, Kim JK, Ramasamy R, Ferrante AW Jr., and Schmidt AM.2014. RAGE regulates the metabolic and inflammatory response to high-fat feeding in mice. Diabetes. 63:1948–65. [DOI] [PMC free article] [PubMed] [Google Scholar]
- 11.Jiang Y, Liu L, Curtiss E, and Steinle JJ.2017. Epac1 Blocks NLRP3 Inflammasome to Reduce IL-1beta in Retinal Endothelial Cells and Mouse Retinal Vasculature. Mediators Inflamm. 2017:2860956. [DOI] [PMC free article] [PubMed] [Google Scholar]
- 12.Liu L, Jiang Y, Chahine A, Curtiss E, and Steinle JJ.2017. Epac1 agonist decreased inflammatory proteins in retinal endothelial cells, and loss of Epac1 increased inflammatory proteins in the retinal vasculature of mice. Mol Vis. 23:1–7. [PMC free article] [PubMed] [Google Scholar]
- 13.Curtiss E, Jiang Y, Liu L, Hawthorne C, Zhang J, and Steinle JJ.2018. Epac1 Restores Normal Insulin Signaling through a Reduction in Inflammatory Cytokines. Mediators Inflamm. 2018:3809092. [DOI] [PMC free article] [PubMed] [Google Scholar]
- 14.Tsung A, Tohme S, and Billiar TR.2014. High-mobility group box-1 in sterile inflammation. J Intern Med. 276:425–43. [DOI] [PubMed] [Google Scholar]
- 15.Joussen AM, Poulaki V, Le ML, Koizumi K, Esser C, Janicki H, Schraermeyer U, Kociok N, Fauser S, Kirchhof B, Kern TS, and Adamis AP.2004. A central role for inflammation in the pathogenesis of diabetic retinopathy. Faseb J. 18:1450–2. [DOI] [PubMed] [Google Scholar]
- 16.Tang J and Kern TS.2011. Inflammation in diabetic retinopathy. Prog Retin Eye Res. 30:343–58. [DOI] [PMC free article] [PubMed] [Google Scholar]
- 17.Fort PE, Losiewicz MK, Reiter CE, Singh RS, Nakamura M, Abcouwer SF, Barber AJ, and Gardner TW.2011. Differential roles of hyperglycemia and hypoinsulinemia in diabetes induced retinal cell death: evidence for retinal insulin resistance. PLoS ONE. 6:e26498. [DOI] [PMC free article] [PubMed] [Google Scholar]
- 18.Reiter CEN, Wu X, Sandirasegarane L, Nakamura M, Gilbert KA, Singh RSJ, Fort PE, Antonetti DA, and Gardner TW.2006. Diabetes Reduces Basal Retinal Insulin Receptor Signaling. Diabetes. 55:1148–1156. [DOI] [PubMed] [Google Scholar]
- 19.Reiter CE, Sandirasegarane L, Wolpert EB, Klinger M, Simpson IA, Barber AJ, Antonetti DA, Kester M, and Gardner TW.2003. Characterization of insulin signaling in rat retina in vivo and ex vivo. Am J Physiol Endocrinol Metab. 285:E763–74. [DOI] [PubMed] [Google Scholar]
- 20.Jiang Y, Zhang Q, Soderland C, and Steinle JJ.2012. TNFalpha and SOCS3 regulate IRS-1 to increase retinal endothelial cell apoptosis. Cell Signal. 24:1086–92. [DOI] [PMC free article] [PubMed] [Google Scholar]
- 21.Walker RJ, Anderson NM, Jiang Y, Bahouth S, and Steinle JJ.2011. Role of beta-adrenergic receptors regulation of TNF-alpha and insulin signaling in retinal Muller cells. Invest Ophthalmol Vis Sci. 52:9527–33. [DOI] [PMC free article] [PubMed] [Google Scholar]
- 22.Kim J, Kim CS, Sohn E, and Kim JS.2016. Cytoplasmic translocation of high-mobility group box-1 protein is induced by diabetes and high glucose in retinal pericytes. Mol Med Rep. 14:3655–61. [DOI] [PMC free article] [PubMed] [Google Scholar]
- 23.Mohammad G, Alam K, Nawaz MI, Siddiquei MM, Mousa A, and Abu El-Asrar AM.2015. Mutual enhancement between high-mobility group box-1 and NADPH oxidase-derived reactive oxygen species mediates diabetes-induced upregulation of retinal apoptotic markers. J Physiol Biochem. 71:359–72. [DOI] [PubMed] [Google Scholar]
- 24.Abu El-Asrar AM, Mohammad G, Nawaz MI, and Siddiquei MM.2015. High-Mobility Group Box-1 Modulates the Expression of Inflammatory and Angiogenic Signaling Pathways in Diabetic Retina. Curr Eye Res. 40:1141–52. [DOI] [PubMed] [Google Scholar]
- 25.Mohammad G, Siddiquei MM, Othman A, Al-Shabrawey M, and Abu El-Asrar AM.2013. High-mobility group box-1 protein activates inflammatory signaling pathway components and disrupts retinal vascular-barrier in the diabetic retina. Exp Eye Res. 107:101–9. [DOI] [PubMed] [Google Scholar]
- 26.Monden M, Koyama H, Otsuka Y, Morioka T, Mori K, Shoji T, Mima Y, Motoyama K, Fukumoto S, Shioi A, Emoto M, Yamamoto Y, Yamamoto H, Nishizawa Y, Kurajoh M, Yamamoto T, and Inaba M.2013. Receptor for advanced glycation end products regulates adipocyte hypertrophy and insulin sensitivity in mice: involvement of Toll-like receptor 2. Diabetes. 62:478–89. [DOI] [PMC free article] [PubMed] [Google Scholar]
- 27.Liu L and Steinle JJ.2017. Toll-like receptor 4 regulates insulin signal transduction in retinal Muller cells. Growth Factors. 35:234–238. [DOI] [PMC free article] [PubMed] [Google Scholar]
- 28.Dasu MR, Devaraj S, Park S, and Jialal I.2010. Increased toll-like receptor (TLR) activation and TLR ligands in recently diagnosed type 2 diabetic subjects. Diabetes Care. 33:861–8. [DOI] [PMC free article] [PubMed] [Google Scholar]
- 29.Dandona P, Ghanim H, Green K, Sia CL, Abuaysheh S, Kuhadiya N, Batra M, Dhindsa S, and Chaudhuri A.2013. Insulin infusion suppresses while glucose infusion induces Toll-like receptors and high-mobility group-B1 protein expression in mononuclear cells of type 1 diabetes patients. Am J Physiol Endocrinol Metab. 304:E810–8. [DOI] [PubMed] [Google Scholar]


