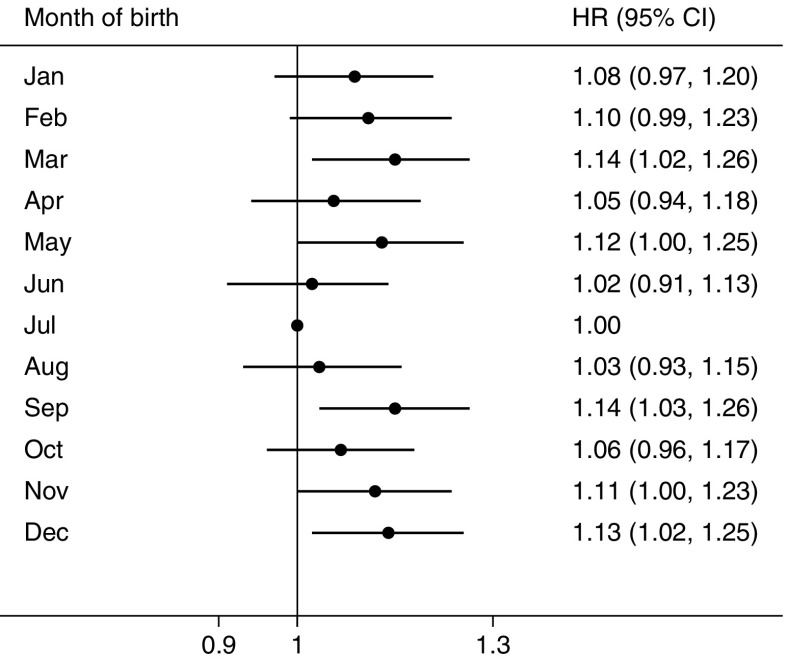
Fig. 1.
HRs and 95% CIs for incident type 2 diabetes in adulthood according to month of birth. Horizontal lines represent 95% CIs. July is the reference month, so CIs are not presented. The multivariable model was adjusted for age, sex, level of education, marital status, alcohol consumption, smoking status, physical activity, intake frequencies of red meat, fresh fruit and vegetables, family history of diabetes and BMI at baseline

