

Abstract
Temperature sensitive liposomes (TSL) are a promising type of nanoparticles for localized drug delivery. TSL typically release the contained drug at mild hyperthermic temperatures (40–42 °C). Combined with localized hyperthermia, this allows for local drug delivery. In vitro characterization of TSL involves measurements of drug release at varying temperatures, but current methods are inadequate due to low temporal resolution of ~8 – 10 seconds. We present a novel method for measuring the drug release with sub-second temporal resolution. In the proposed system, the TSL entrapping the fluorescent drug (Doxorubicin) are pumped through a capillary tube. The tube is rapidly heated to a desired temperature via Peltier element. Since fluorescence increases as drug is released from TSL, drug release kinetics can be measured via fluorescent imaging. By fitting exponential models, we calculated the time constants of drug release at temperatures of 39.5, 40.5 and 41.5°C were about 6.09, 2.06 and 1.03 seconds, respectively. Our initial tests show that the developed system can measure TSL release at subsecond resolution, and thus allow adequate in vitro evaluation of TSL formulations.
I. Introduction
Temperature sensitive liposomes (TSL) are a promising category of nanoparticles (~100–200 nm) for targeted drug delivery. TSL typically release the contained drug above ~40 °C [1–5]. Combined with localized hyperthermia, TSL allow locally targeted drug delivery to tissue regions exposed to elevated temperatures [3, 6, 7]. A specific TSL formulation filled with the chemotherapy agent doxorubicin is currently being evaluated in Phase II/III clinical trials [8].
Recent studies demonstrate that drug release from TSL triggered within the vasculature, with the drug taken up by tissue following release, is the dominant delivery mechanism [6, 9]. Since blood (and thus TSL) only remain within the vasculature of the heated tissue region or tumor for a couple of seconds [10], TSL need to release the contained drug within seconds to be most effective. Unfortunately, currently employed methods for measurement of TSL release cannot measure release at such short time scales, with first release data point typically reported after only 8–10 seconds [4, 5], or even minutes [1, 3]. Thus, current methods are not adequate for in vitro evaluation of TSL formulations.
Here, we present a method for measuring release dynamics from TSL within the first few seconds, with temporal resolution <<100 ms. Such a method will allow adequate evaluation of different TSL formulations to optimize release kinetics, which is not possible with current methods. The presented method is based on a prior method that used a fluorescence microscope [11] and was improved for use with a fluorescence imaging system.
II. Materials and Methods
A. Experimentation Setup
A schematic view of the experimentation setup is shown in Figure 1. For measuring the temporal dynamics of TSL drug release, the TSL-drug (doxorubicin) solution is pumped by a peristaltic pump through a capillary tube made of quartz glass (quartz capillary, outer diameter 500 μm, 10 μm wall thickness, Hampton Research). The capillary tube was glued to a copper plate (to ensure spatially uniform temperature), which was mounted on the hot side of a Peltier element (3×3 cm). Due to the small diameter capillary, liquid will heat rapidly to the target temperature the Peltier element is pre-heated to. Once the TSL-drug solution reaches target temperature, drug is released from TSL. Since drug fluorescence is quenched when drug is inside TSL, the drug release results in an increase in fluorescence as the TSL solution flows within the capillary tube. I.e. fluorescence increases along the capillary as the solution is exposed for longer duration to heat. Based on known flow velocity, drug release versus time can be measured based on fluorescence intensity along the capillary tube.
Figure 1.

The schematic view of the experimentation setup for measuring the dynamics of drug release of the TSL drug delivery system. Solution with TSL entrapping Doxorubicin is pumped through the capillary tube mounted on the heated Peltier element. Since fluorescence of released drug is larger than that of TSL-encapsulated drug, fluorescence imaging allows measurement of drug release as TSL solution flows along the capillary tube.
The peristaltic pump provides a flow rate between 1 and 10 mm/sec. The Peltier element temperature was controlled via LABVIEW software based on a PID controller. The employed Fluorescence imaging system the Maestro 2 in vivo imaging system (Caliper Life Sciences Company) with the software platform Maestro EX 3.0.
1). Temperature Control System
Since TSL release rate varies greatly with temperature, accurate temperature control is necessary (<0.1 °C accuracy). The temperature controller was implemented in LABVIEW environment as shown in Figure 2. The TSL-drug temperature is measured by two thermocouple probes (T-type) placed on the Peltier element, and connected to the Agilent 349707A data acquisition system. A USB link was set up between Agilent 34970A and the computer. The PID controller calculated the desired voltage between 0 and 10V and sent it to a programmable power supply (PSP2010 by GW-instek) through serial bus (RS-232). The constancy of the temperature was here much more important than overshoot or undershoot effects. Therefore, a PID controller (Proportional-Integral-Derivative) was implemented in LABVIEW according to following equation:
| (1) |
where KP, KI, and KD are the proportional, integral and derivative PID control parameters respectively. Also, e(t) and v(t) represent the error signal and control voltage, respectively. To determine the optimal control parameters, the Ziegler-Nichols method was used [12]. In addition to accurate temperature control, uniformity of temperature along the capillary tube is important. Spatially uniform temperature (<0.3 °C variation confirmed by infrared imaging (data not shown)) was achieved by attaching a copper plate (1 mm thick) to the Peltier element.
Figure 2.

The hardware setup for controlling and adjusting the temperature. A PID controller was implemented in LABVIEW, which sends the control voltage to the regulating power supply and receives the temperature from the Peltier element via thermocouple, through an data acquisition card.
2). Imaging Procedure
Fluorescent materials include biological and natural materials which rapidly give off light of a particular wavelength when exposed to light of another wavelength. Fluorescence imaging systems collect and register the emission light after illuminating the region of interest. Here, the Maestro 2 fluorescence imaging system (Caliper Life Sciences Company) was used to image the capillary tube. The excitation light wavelength was 523 nm (green). The emission light was filtered (560 nm longpass), and spectra (560–750 nm) were stored and analyzed. The goal was to acquire an image of the capillary tube, and determine fluorescence along the tube to calculate % drug release. After the Peltier element reached the target temperature (39.5, 40.5, or 41.5 °C), the pump was started to achieve ~3 mm/sec flow velocity within the capillary tube. Once a steady-state condition was reached, an image was obtained (200 ms exposure).
B. Image and Data Analysis
The principal objective of the proposed system is to measure the temperature dependence of drug release rate. Thus, the images were analyzed to estimate the drug release percentage at each point along the capillary tube. The process occurred in two stages: image analysis and drug release estimation. The first part included image processing and analysis techniques for extracting the fluorescent signal along the capillary length from the raw fluorescence images. The image processing steps are shown in Figure 3. The input images are a sequence of 20 images, one for each emission wavelength (16 bit resolution). After selecting the image at the wavelength of maximum emission intensity (here at the wavelength of 610nm), preprocessing steps were applied including contrast enhancement, segmentation of tube, rotation and low pass filtering (orthogonal to flow direction). The image processing steps were carried out in the ImageJ V1.50 software [13]. Finally, the fluorescent signal intensity along the length of the capillary tube was obtained as a function of distance (starting, where the TSL solution enters the heated plate).
Figure 3.

Algorithm of image processing and analysis for extracting the fluorescent signal related to the heated capillary from the entire fluorescent image.
The distance dependent fluorescent signal was mapped to the time domain through a space-time look-up table. This look-up table was created based on calibration measurements with dye, where arrival time was measured along the capillary tube. This was necessary as the capillary tube diameter and flow velocity vary along the tube length. The fluorescent signal was normalized to capture the drug release in percent, and compared between different temperatures. Using nonlinear curve fitting, the fluorescent signals were fitted to the following exponential equation:
| (2) |
where and represent the final and initial signal values, t represents time, and τ indicates the release time constant.
To determine temperature along the tube and quantify time required to obtain target temperature at the tube entrance of the heated section (see Fig. 4), we pumped a temperature sensitive fluorescent dye (Sulforhodamine B Sodium solution, 1.2 mg/ml) through the tube while imaging at same excitation and emission wavelength as noted.
Figure 4.

Fluorescent image at 610 nm emission wavelength. The capillary tube and TSL are heated along the length indicated by the yellow double arrow. TSL solution enters from left side. The initial rapid fluorescence increase (indicated by blue double arrow) corresponds to drug release from TSL. Subsequent slow decrease in fluorescence towards the right is due to decrease in capillary diameter (which we corrected for).
C. Liposome preparation
The thermosensitive liposomes loaded with doxorubicin were prepared according to Needham et al. [1] with slight modifications. The phospholipids 1, 2-DiPalmityol-sn-glycero-3-PhosphoCholine (DPPC), 1,2-DiStearoyl-sn-glycero-3-PhosphoEthanolamine-N-PEG2000 (DSPEPEG2000) and Mono-Stearoyl-PhosphatidylCholine (MSPC) were obtained from Avanti Polar Lipids. Doxorubicin was purchased from EDQM. All other chemicals were purchased from Fisher Scientific unless specified. The lipids DPPC: MSPC: DSPE-PEG2000 were dissolved in the ratio of 85.3:9.7:5 in chloroform. The liposomes were prepared by lipid film hydration and extrusion method at 60°C (Thermobarrel extruder, Northern lipids, Canada). Filters with the pore size of 100 nm were used for extrusion of liposomes, and TSL were passed 5 times through the extruder. Loading of the liposomes was carried out with a citrate based pH-gradient Doxorubicin loading model with Doxorubicin to lipid ratio being 1:20. Briefly, 300 mM citrate pH 4 was inside liposome and Phosphate buffer saline pH 7.4 was outside the liposome. Mixture of TSL and Doxorubicin was incubated at 37°C for 1 hour. Liposomes were diluted 1:100 in Phosphate Buffered Saline (PBS) prior to use.
III. Results
A. PID Control calibration
The temperature control system should be adjusted so that the desired temperature is obtained without any fluctuation or considerable overshoot. The PID parameters were obtained as follows. Firstly, a proportional control was applied to the control system. The larger the proportional coefficient, the more overshoot the output temperature exhibits. The output temperature begins to fluctuate at a critical coefficient (Kp=5.0) with the critical period of 12sec. Using those critical values, the PID parameters at the case of no overshoot according to the Ziegler-Nichols method are shown in Table 1 [12]. This was verified in practice by applying different PID control coefficients and monitoring temperature, as shown in Figure 5. These tests confirmed adequate performance using the proposed PID controller parameters.
Table 1.
PID Controller parameters for the case of minimum overshoot.
| Parameter | Kp | Ki | Kd |
|---|---|---|---|
| Value | 1.0 | 0.167 | 3.96 |
Figure 5.

Controller performance for different PID control parameters. Set temperature was 37 °C (0–100 s), and 30 °C (100–250 s).
B. Fluorescence imaging
Figure 4 shows a sample fluorescence image at 610 nm emission wavelength after preprocessing. This image shows the fluorescence change due to drug release from TSL. Our studies with temperature sensitive dye demonstrated that it takes about 1 s for fluid to reach target temperature after entering the heated tube section (data not shown).
C. Normalization and Interpolation of Fluorescence signal
Following image processing of data in Figure 4 and mapping of tube length to time as described, fluorescence intensity data were normalized to obtain % of drug released. It was assumed there is no drug release at t=0 (as TSL solution enters heated region), and 100% release after 8 s at 41.5 °C based on prior data [4]. The normalized data for each temperature was then fitted to an exponential model (Equation 2). The fluorescence signals for each temperature as well as fitted curves are shown in Figure 6.
Figure 6.
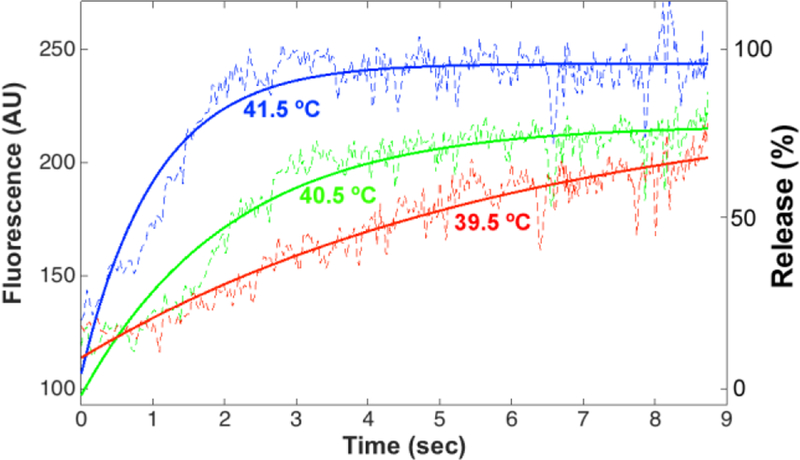
The fluorescence signal time course at 39.5, 40.5 and 41.5 °C. The experimental curves and model fit are shown in dashed and solid lines, respectively. The left vertical axis shows fluorescence intensity (AU), the right vertical axis shows the drug release percentage. Prior release measurement methods measured first release data points after only 8–10 s, which is inadequate as shown in this Figure.
D. Drug Release Time Constant
The drug release time constant was obtained from the exponential model fit (Equation 2) of the normalized data (i.e. drug release in %, right-hand axis of Fig. 6), and is shown for each temperature in Table 2.
Table 2.
The time constants of drug release at different temperatures.
| Temperature | 39.5°C | 40.5°C | 41.5°C |
|---|---|---|---|
| τ (sec) | 1.03 | 2.06 | 6.09 |
IV. Discussion
In most current TSL release measurement methods, a cuvette filled with plasma or buffer (typically ~1–3 ml) is pre-warmed to desired temperature where release is measured (~37–45 °C), subsequently adding a small volume (~50 μl) of TSL solution under stirring [4, 5]. Fluorescence of the sample is then measured and, since drug fluorescence is quenched while inside the TSL, release is observed as increased fluorescence. This approach precludes measurement within the first several seconds, because of the time the mixing after adding of TSL takes.
A recently proposed system addresses this limitation [11], and the described system is based on this prior system with some modifications. Importantly, the prior system used a microscope that required acquisition of multiple images to cover the whole capillary length, while the current system acquires the whole capillary in a single image exposure. This simplifies acquisition, as well as image processing. The new approach was shown to be capable of capturing the dynamics of drug release from the TSL with sub-second resolution (Fig. 6). The tiny diameter of the capillary glass tube ensured rapid heating (within ~1 s) and a homogeneous temperature along the entire capillary (Fig. 4).
The PID temperature controller performed adequately. The results show that TSL release rate increases with temperature (Fig. 6). Based on these measurements, we were able to determine release time constants for different temperatures (Table 2). Release in Fig. 6 is evident starting after ~1 s, which corresponds to the time required for fluid to reach target temperature after entering the heated tube section; we quantified this heat-up time via studies with temperature sensitive fluorescent dye. This time delay likely will result in inaccuracies in the estimated release time constants.
As earlier studies have shown that intra-vascular drug release from TSL is much more effective than release within interstitial space [6, 9], and since TSL pass a heated tumor within a few seconds (=tumor transit time), our results suggest that the evaluated TSL formulation releases sufficiently fast above 41.5 °C for effective drug delivery.
V. Conclusion
We developed a novel setup that allows measurement of release of fluorescent drugs from TSL, and demonstrated ability to measure release at sub-second resolution. The proposed setup allows adequate in vitro evaluation of rapid-release TSL formulations.
VI. Acknowledgments
We would like to thank Dr. Michael Madson, for his assistance in editing the manuscript. This work was supported by NIH grant No. R01CA181664. Part of the work was conducted in a facility constructed with support from the National Institutes of Health, Grant Number C06 RR018823 from the Extramural Research Facilities Program of the National Center for Research Resources.
* Research supported by NIH.
References
- [1].Needham D, Anyarambhatla G, Kong G, and Dewhirst MW, “A new temperature-sensitive liposome for use with mild hyperthermia: characterization and testing in a human tumor xenograft model,” Cancer Res, vol. 60, pp. 1197–201, March 1 2000. [PubMed] [Google Scholar]
- [2].Yatvin MB, Weinstein JN, Dennis WH, and Blumenthal R, “Design of liposomes for enhanced local release of drugs by hyperthermia,” Science, vol. 202, pp. 1290–3, December 22 1978. [DOI] [PubMed] [Google Scholar]
- [3].Li L, Ten Hagen TL, Hossann M, Suss R, van Rhoon GC, Eggermont AM, et al. , “Mild hyperthermia triggered doxorubicin release from optimized stealth thermosensitive liposomes improves intratumoral drug delivery and efficacy,” J Control Release, vol. 168, pp. 142–50, June 10 2013. [DOI] [PubMed] [Google Scholar]
- [4].Negussie AH, Yarmolenko PS, Partanen A, Ranjan A, Jacobs G, Woods D, et al. , “Formulation and characterisation of magnetic resonance imageable thermally sensitive liposomes for use with magnetic resonance-guided high intensity focused ultrasound,” International Journal of Hyperthermia, vol. 27, pp. 140–155, 2011/March/01 2011. [DOI] [PMC free article] [PubMed] [Google Scholar]
- [5].Lindner LH, Hossann M, Vogeser M, Teichert N, Wachholz K, Eibl H, et al. , “Dual role of hexadecylphosphocholine (miltefosine) in thermosensitive liposomes: active ingredient and mediator of drug release,” J Control Release, vol. 125, pp. 112–20, January 22 2008. [DOI] [PubMed] [Google Scholar]
- [6].Manzoor AA, Lindner LH, Landon CD, Park J-Y, Simnick AJ, Dreher MR, et al. , “Overcoming Limitations in Nanoparticle Drug Delivery: Triggered, Intravascular Release to Improve Drug Penetration into Tumors,” Cancer Research, vol. 72, pp. 5566–75, September 4, 2012. 2012. [DOI] [PMC free article] [PubMed] [Google Scholar]
- [7].Gasselhuber A, Dreher MR, Partanen A, Yarmolenko PS, Woods D, Wood BJ, et al. , “Targeted drug delivery by high intensity focused ultrasound mediated hyperthermia combined with temperature-sensitive liposomes: computational modelling and preliminary in vivo validation,” Int J Hyperthermia, vol. 28, pp. 337–48, 2012. [DOI] [PMC free article] [PubMed] [Google Scholar]
- [8].Poon RT and Borys N, “Lyso-thermosensitive liposomal doxorubicin: a novel approach to enhance efficacy of thermal ablation of liver cancer,” Expert Opin Pharmacother, vol. 10, pp. 333–43, February 2009. [DOI] [PubMed] [Google Scholar]
- [9].Gasselhuber A, Dreher MR, Rattay F, Wood BJ, and Haemmerich D, “Comparison of conventional chemotherapy, stealth liposomes and temperature-sensitive liposomes in a mathematical model,” PLoS One, vol. 7, p. e47453, 2012. [DOI] [PMC free article] [PubMed] [Google Scholar]
- [10].Oye KS, Gulati G, Graff BA, Gaustad JV, Brurberg KG, and Rofstad EK, “A novel method for mapping the heterogeneity in blood supply to normal and malignant tissues in the mouse dorsal window chamber,” Microvasc Res, vol. 75, pp. 179–87, March 2008. [DOI] [PubMed] [Google Scholar]
- [11].Burke C, Dreher MR, Negussie AH, Mikhail AS, Yarmolenko P, Patel A, et al. , “Drug release kinetics of temperature sensitive liposomes measured at high-temporal resolution with a millifluidic device,” Int J Hyperthermia, pp. 1–9, December 28 2017. [DOI] [PMC free article] [PubMed]
- [12].Kurfess TR, “Getting in tune with Ziegler-Nichols,” Control Engineering magazine, p. 28, 2007
- [13].NIH, “http://rsb.info.nih.gov/ij/download.html,” ed.