

Abstract
Background
Environmental exposures in early life appear to play an important role in the pathogenesis of childhood asthma, but the potentially modifiable exposures that lead to asthma remain uncertain.
Objective
Identify early-life environmental risk factors for childhood asthma in a birth cohort of high-risk, inner-city children.
Methods
We examined the relationship of prenatal and early-life environmental factors to the occurrence of asthma at 7 years of age among 442 children.
Results
Higher house dust concentrations of cockroach, mouse, and cat allergens in the first three years of life were associated with lower risk of asthma (for cockroach allergen, odds ratio per interquartile range increase in concentration 0.55; 95% CI, 0.36 to 0.86; p < 0.01). House dust microbiome analysis using 16S ribosomal RNA sequencing identified 202 and 171 bacterial taxa that were significantly (FDR < 0.05) more or less abundant, respectively, in the homes of children that developed asthma. A majority of these bacteria were significantly correlated with one of more allergen concentrations. Other factors significantly positively associated with asthma included umbilical cord plasma cotinine concentration (odds ratio per geometric standard deviation increase in concentration 1.76; 95% CI, 1.00, 3.09; p = 0.048) and maternal stress and depression scores.
Conclusion
Among high-risk, inner-city children, higher indoor levels of pet or pest allergens in infancy were associated with lower risk of developing asthma. The abundance of a number of bacterial taxa in house dust was associated with increased or decreased asthma risk. Prenatal tobacco smoke exposure and higher maternal stress and depression scores in early life were associated with increased asthma risk.
Keywords: Asthma, environment, allergy, allergen, microbiome, stress, depression, smoking
INTRODUCTION
Asthma is the most common chronic disease of childhood1 and is responsible for substantial morbidity and health-care costs. Environmental exposures in early life appear to play an important role in the pathogenesis of childhood asthma, but more information is needed to identify specific exposures that could potentially be modified to prevent asthma. Childhood asthma is associated with sensitization to inhalant allergens,2,3 while the impact of early-life exposure to these allergens, or their sources, on asthma risk is unclear3,4 and may differ among allergens.5 Children exposed to farm animals in the early post-natal period have a lower risk of developing allergies and asthma,6 and a similar effect of early exposure to pets has been observed in some but not all studies.7,8 Increased early life exposure to microbial products such as bacterial endotoxin appears to be associated with reduced susceptibility to atopic asthma in childhood.9,10 A recent study demonstrated that the gastrointestinal microbiome of 3-month-old children with wheezing and atopy at age 1 year differed from those of children with neither wheezing nor atopy.11 Homes with pet dogs have a distinct microbiome12, and mice orally supplemented with house dust from homes with dogs are protected against ovalbumin or cockroach allergen-mediated airway pathology.13 Other potentially modifiable factors that may be linked to asthma risk include psychosocial stress, nutritional factors, and exposure to pollutants such as tobacco smoke.
The Urban Environment and Childhood Asthma (URECA) study14 was designed to investigate risk factors for asthma in a birth cohort of US high-risk inner-city children, a population with a high burden of asthma morbidity and a distinct environment.15 In this cohort, exposure to higher levels of cockroach, mouse, and cat allergen in the home in the first few months of life was associated with a lower risk of recurrent wheezing at 3 years of age, and the microbial composition of house dust in early life was related to the later development of wheezing and allergic sensitization.16 In this report, we examine exposures in the prenatal period and first three years of life, including allergens and microbes in house dust, as potential risk factors for asthma at age 7 years.
METHODS
Study design and participants
URECA is a birth cohort study initiated in 2005 in inner-city Baltimore, Boston, New York City and St. Louis.14 Pregnant women age 18 or older were recruited with selection criteria including a history of asthma, allergic rhinitis, or eczema in the mother or father (full entry criteria in Online Repository). Informed consent was obtained from the women enrolled and, after birth, from the parent or legal guardian of the infant.
Data collection
Maternal questionnaires, including those on smoking, stress, and depression, were administered prenatally and annually after the child’s birth., Postnatal child health questionnaires were administered to a parent every three months through age 7 years. Annual visits of child and parent to the study center, starting at one year of age, included questionnaires, anthropomorphic measurements, and phlebotomy. Questionnaires included the Perceived Stress Scale,17 the Edinburgh Postpartum Depression Scale,18 and additional questionnaires to assess stress related to neighborhood factors, violence, and economic hardship.19 Parent-reported colds were ascertained by telephone questionnaire every three months throughout the first three years of life, and the number of colds within each of the first three years was analyzed as a potential predictor of asthma at age 7 years.
Allergen specific IgE (ImmunoCAP, Phadia, Uppsala Sweden) for milk, egg, peanut, and German cockroach was measured yearly until age 3 years, then at 5 years and 7 years. Specific IgE for dust mites, dog, cat, mouse, and Alternaria was measured at 2, 3, 5 and 7 years of age. Prick skin testing was performed at 3 years of age and again at 5 and 7 years of age for 14 common aeroallergens (listed in Online Repository). Aeroallergen sensitization was defined as a wheal ≥ 3mm larger than the saline control on prick skin testing or specific IgE ≥ 0.35 kU/L.
At age 7 years, spirometry was performed in accordance with ATS guidelines20 and repeated after 4 inhalations of albuterol HFA metered-dose inhaler 90 μg per inhalation. At a separate visit, methacholine challenge (details in Online Repository) was performed.
Home visits to collect environmental data and specimens began after birth, with visits three months after birth and in the second and third years of life that included house dust collection (details in Online Repository). Dust samples were assayed for allergenic proteins including Bla g 1 (cockroach), Can f 1 (dog), Fel d 1 (cat), Der f 1 and Der p 1 (house dust mites), and Mus m 1 (mouse) by ELISA (Indoor Biotechnologies, Charlottesville, VA). Dust samples were also assayed for ergosterol, a fungal membrane lipid, using GC-mass spectroscopy, and for endotoxin, a bacterial cell wall constituent, by recombinant factor C assay. When sufficient sample remained after allergen analysis, dust specimens collected at 3 months of age underwent culture-independent microbiome profiling using 16S ribosomal RNA (rRNA) sequencing (details in Online Repository). Airborne nicotine concentration, a surrogate for environmental tobacco smoke concentration, was measured using a passive diffusion filter exposed for 14 days. Indoor NO2 concentation was measured during the same 14 days with a modified diffusion filter sampler (Ogawa Sampler, Ogawa & Company USA, Inc., Pompano Beach, FL).
Primary outcome
The pre-specified primary study outcome was asthma at age 7 years. Children were classified as having asthma at age 7 if at least one of three conditions was met (Table E1 in Online Repository): 1) a parent-reported physician diagnosis of asthma between age 4 and 7 years, combined with asthma symptoms or the use of asthma controller medication for 6 of the past 12 months; 2) methacholine PC20 ≤ 4 mg/ml or albuterol reversibility of FEV1 ≥ 10%, combined with asthma symptoms or use of asthma controller medication for 6 of the past 12 months; or 3) the report in the past 12 months of ≥2 wheezing episodes, ≥2 doctor visits for asthma/wheeze, ≥1 hospitalization for asthma/wheeze, or the use of controller medications for 6 of the past 12 months.
Statistical analysis
We used multiple imputation by chained equations (MICE)21,22 to impute missing data (approximately 10%; details in Online Repository). An “allergen exposure index” was derived for Bla g 1, Mus m 1, Fel d 1, and Can f 1 - the four allergens that were significantly or nearly significantly associated with the development of asthma - by summing the quartiles (0, 1, 2, or 3) of exposure level for each allergen (potential range 0-12; details in Online Repository).
The relationships of demographic, perinatal, and family factors to asthma at age 7 years were assessed using logistic regression. The relationships of environmental exposures in early life to asthma at age 7 were assessed by logistic regression with adjustment for gender, race, maternal asthma, and (except for models of stress and depression as risk factors) maternal Perceived Stress Scale score. Allergen and other environmental measurement data were log-transformed prior to analysis.
Microbiota data were analyzed in QIIME.23 The relative abundance of bacterial operational taxonomic units (OTUs) in house dust at 3 months of age was compared between the homes of children that did and did not later develop asthma using three models (Poisson, negative binomial and zero-inflated negative binomial regression models) and Bayesian Information Criterion (BIC) to determine the most appropriate model for each specific OTU24. Benjamini-Hochberg false discovery correction was employed, and a corrected p-value <0.05 was considered significant.
RESULTS
Participant characteristics
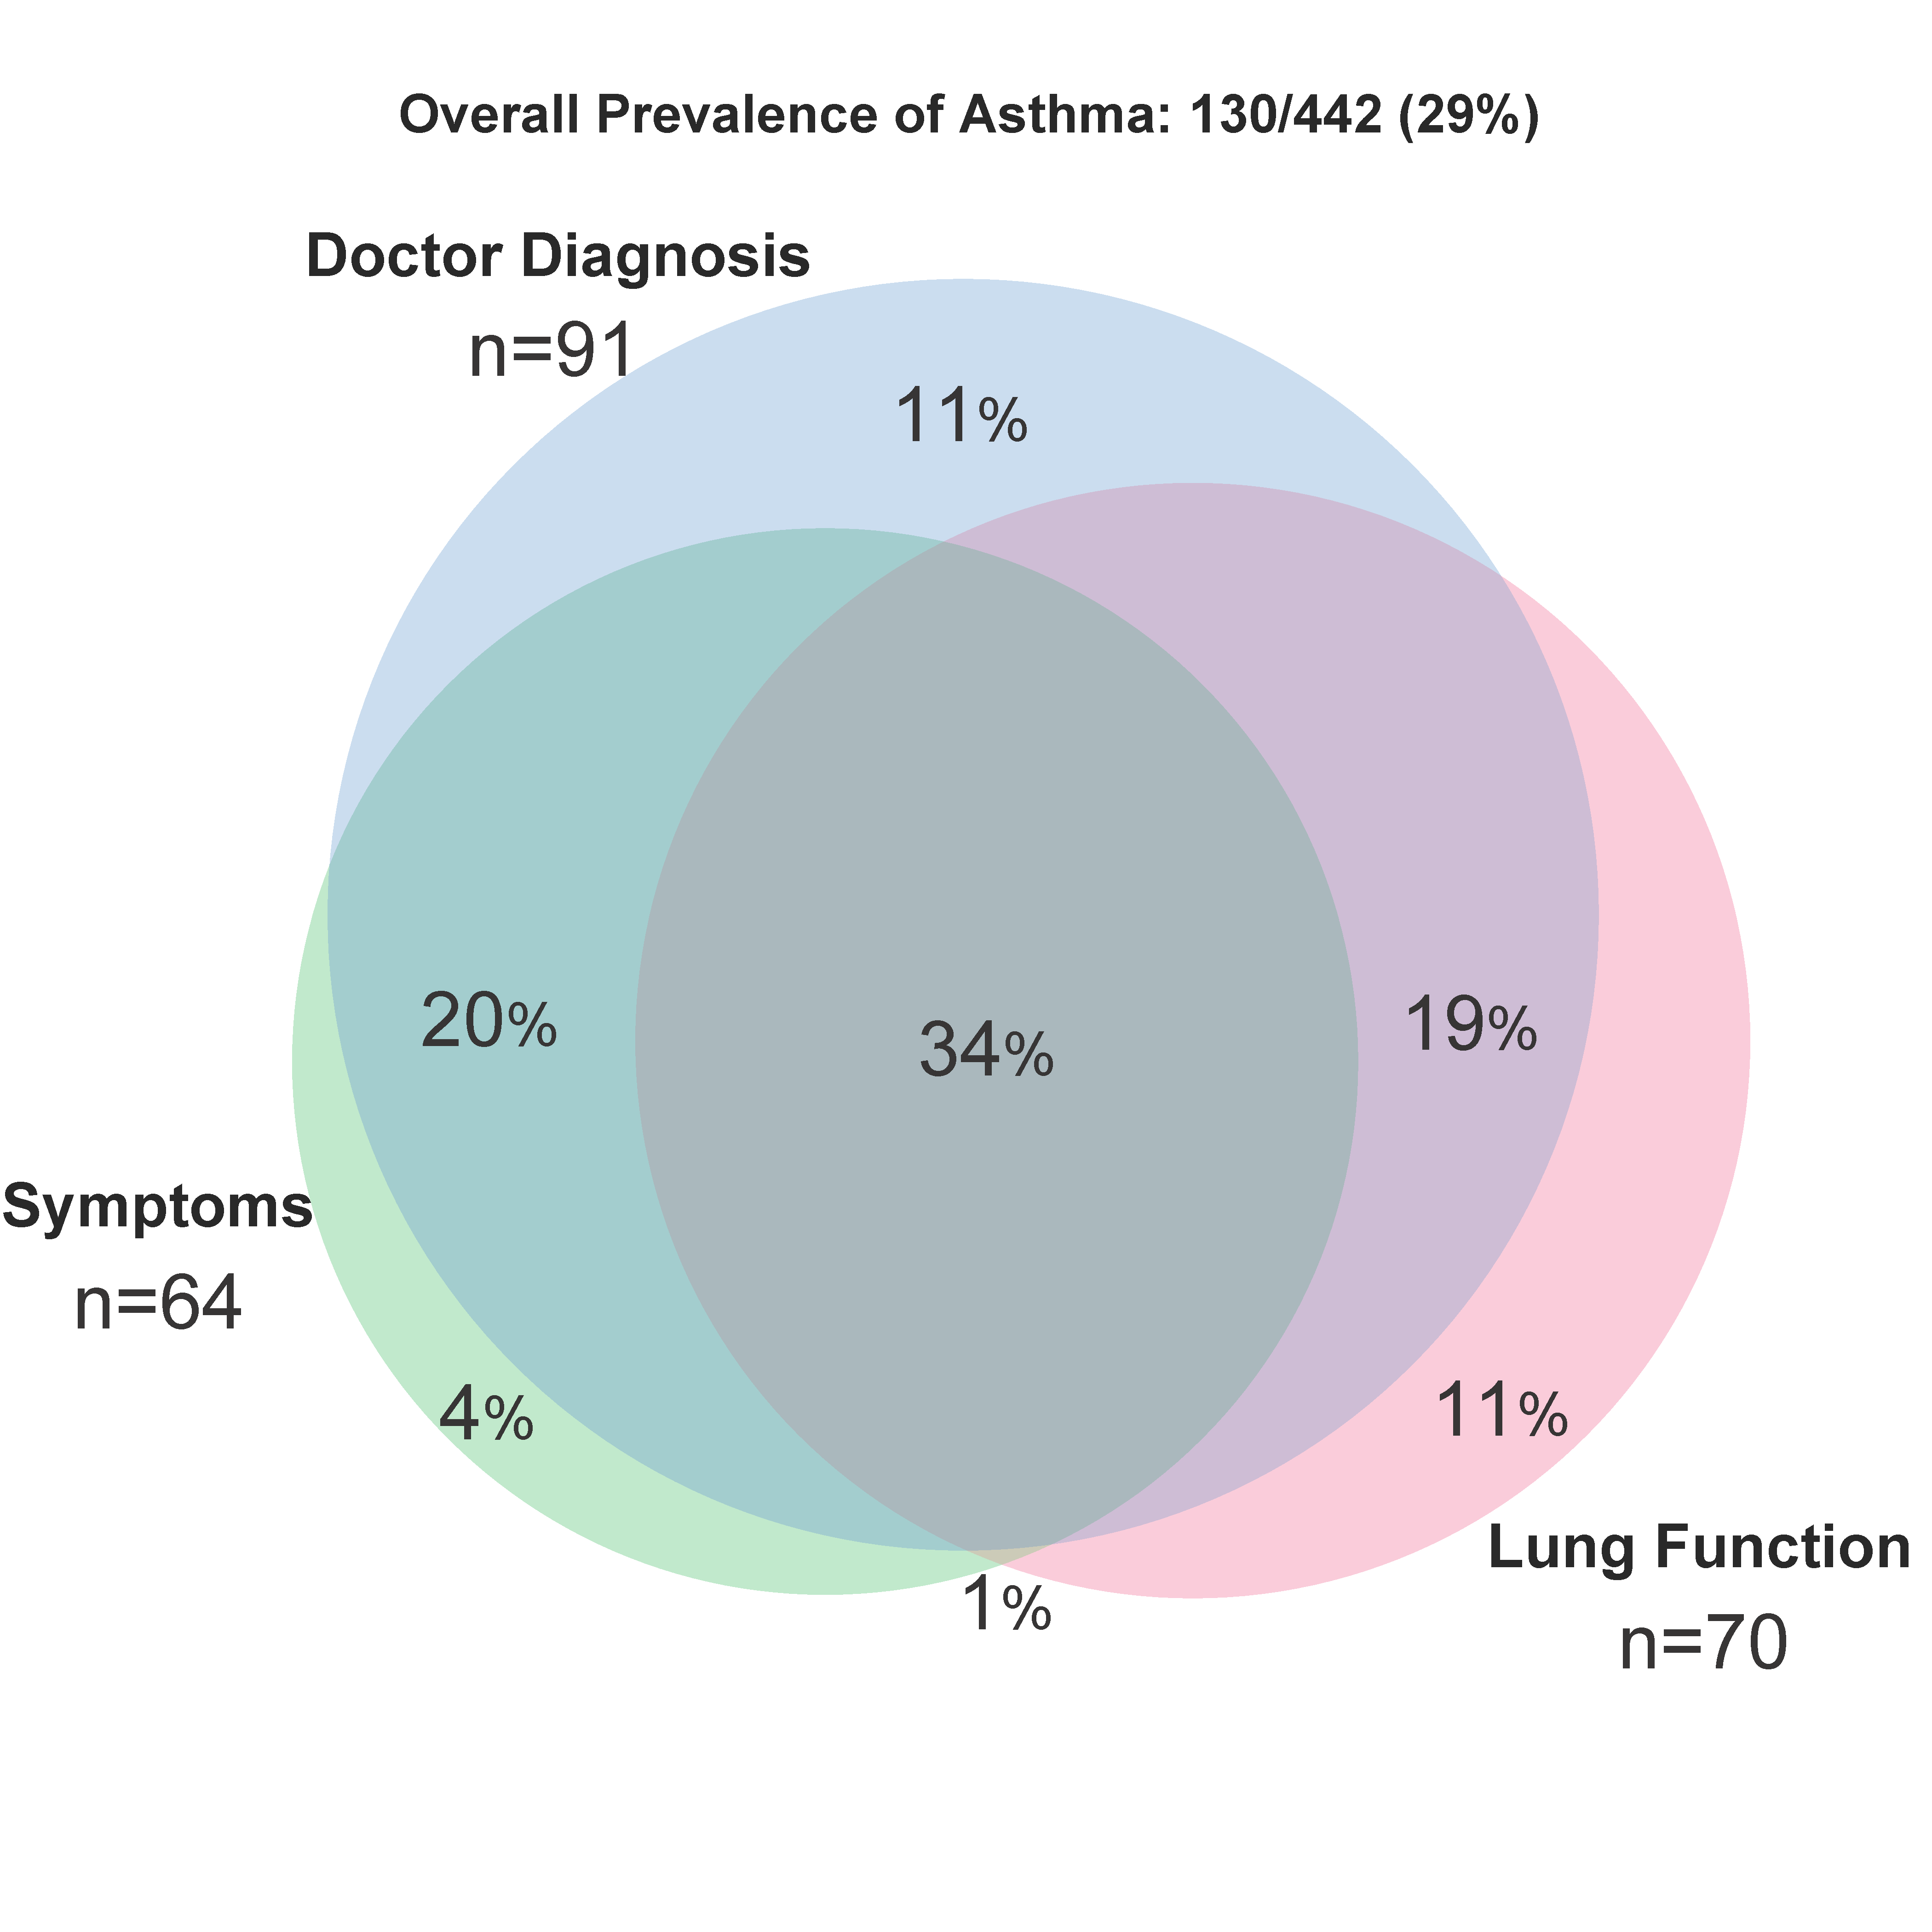
Between February 2005 and March 2007, 1850 families were screened, 776 met eligibility criteria, and 560 newborns were enrolled at birth (Figure E1 in Online Repository). Of those enrolled, 442 (79%) had outcome data to classify asthma status at age 7 years, and 130 (29%) of these children had asthma. Most children classified as having asthma met two or more of the criteria for this diagnosis (Figure E2 in Online Repository). Among children that underwent allergy testing at 6 or 7 years of age, 90 of 129 children with asthma and 179 of 307 children without asthma were sensitized to one or more aeroallergen (70% and 58%, respectively; p = 0.025; Table E2 in Online Repository).
Family history, perinatal factors, early sensitization, and asthma
Children whose mothers reported having asthma were more likely to develop asthma at age 7 years (odds ratio 1.79; 95% CI 1.18 to 2.74; p = 0.01) (Table 1). Other demographic factors and perinatal history were not associated with asthma occurrence (Table 1). As expected, recurrent wheezing at 3 years of age was associated with asthma at age 7, although there was only partial concordance between these phenotypes (Table 1). Sensitization to more than 1 aeroallergen at age 2 and 3 years was significantly associated with the development of asthma (Figure E3 in Online Repository).
Table 1.
Characteristics of study population and unadjusted associations of these characteristics with asthma at age 7 years
| n | Overall* N=442 |
No asthma* N=312 |
Asthma* N=130 |
Unadjusted OR (95% CI) |
p-value | |
|---|---|---|---|---|---|---|
| Mother’s education: Less than high school | 441 | 183 (42%) | 129 (42%) | 54 (41%) | Ref. | |
| High school | 151 (34%) | 107 (34%) | 44 (34%) | 0.98 (0.61 – 1.58) | 0.99 | |
| More than high school | 107 (24%) | 75 (24%) | 32 (25%) | 1.02 (0.60 – 1.72) | ||
| Annual income < $15K | 441 | 304 (69%) | 212 (68%) | 92 (71%) | 1.13 (0.72 – 1.78) | 0.67 |
| Mother is married | 441 | 60 (14%) | 44 (14%) | 16 (12%) | 0.86 (0.45 – 1.56) | 0.72 |
| Child’s race: Black | 442 | 318 (72%) | 221 (71%) | 97 (75%) | Ref. | |
| Hispanic | 87 (20%) | 63 (20%) | 24 (18%) | 0.87 (0.51 – 1.46) | 0.68 | |
| Mixed/other | 37 (8%) | 28 (9%) | 9 (7%) | 0.74 (0.32 – 1.58) | ||
| Child’s gestational age (wks.) | 442 | 38.8 ± 1.50 | 38.9 ± 1.47 | 38.6 ± 1.54 | 0.90 (0.79 – 1.04) | 0.15 |
| Child’s birth weight (g)† | 442 | 3249 ± 483 | 3265 ± 478 | 3212 ± 496 | 0.80 (0.52 – 1.22) | 0.30 |
| C-section delivery | 442 | 135 (31%) | 91 (29%) | 44 (34%) | 1.24 (0.80 – 1.92) | 0.39 |
| Mother breastfed | 427 | 240 (56%) | 169 (56%) | 71 (57%) | 1.06 (0.70 – 1.62) | 0.86 |
| Age of mother at time of birth | 442 | 24.4 ± 5.95 | 24.3 ± 5.73 | 24.6 ± 6.46 | 1.01 (0.98 – 1.05) | 0.57 |
| Child’s gender: male | 442 | 226 (51%) | 158 (51%) | 68 (52%) | 1.07 (0.71 – 1.61) | 0.83 |
| Mother has had asthma | 440 | 221 (50%) | 143 (46%) | 78 (60%) | 1.79 (1.18 – 2.74) | 0.01 |
| Mother is atopic | 426 | 295 (69%) | 199 (67%) | 96 (74%) | 1.43 (0.90 – 2.30) | 0.16 |
| Father has had asthma | 400 | 120 (30%) | 79 (28%) | 41 (35%) | 1.39 (0.87 – 2.20) | 0.20 |
| Number of hours/week of daycare in 1st year** | 423 | 11.8 (18.1) | 12.0 (18.0) | 11.4 (18.3) | 1.00 (0.99 – 1.01) | 0.77 |
| Number of children in home†† | 441 | 2.30 (1.45) | 2.29 (1.43) | 2.32 (1.50) | 1.01 (0.86 – 1.19) | 0.90 |
| Recurrent wheeze at age 3 years | 433 | 151 (34.9%) | 67 (21.8%) | 84 (66.7%) | 7.1 (4.5 – 11.4) | <0.01 |
Values are counts (percentages) or means ± standard deviations.
Odds ratio for child’s birth weight represents the odds for a 1000 gram higher birth weight.
Odds ratio for number of hours of daycare represents the odds for 1 hour per week more daycare.
Odds ratio for number of children in home represents the odds for each additional child in the home.
Allergen exposure and asthma
For the aeroallergens Bla g 1, Mus m 1, and Fel d 1, higher allergen concentration in house dust summed over the specimens collected at 3 months, 2 years, and 3 years of age (defined as the cumulative allergen concentration) was associated with lower risk of asthma at age 7 years, with odds ratios of 0.55 (95% CI, 0.36 to 0.86; p < 0.01), 0.68 (95% CI, 0.49 to 0.94; p = 0.02), and 0.71 (95% CI, 0.51 to 1.00; p = 0.05), respectively, for a cumulative allergen concentration higher by one interquartile range (Table 2). A non-significant association in the same direction was observed for the dust concentration of Can f 1. Higher levels of these four allergens at 3 months of age, as quantified by the allergen exposure index, was associated with significantly lower risk of developing asthma, with the odds ratio per one-interquartile range higher allergen exposure index of 0.59 (95% CI, 0.44 to 0.80; p < 0.001). The association of higher allergen exposure index at age 3 months with lower risk of developing asthma was observed among all participants (p = 0.008) (Figure 1A), and among both children sensitized (p = 0.02) and not sensitized (p = 0.02) to one or more of these allergens at age 3 years (Figure 1B). Similar associations were observed for cumulative allergen exposure during the first 3 years of life (Figure 1C and 1D and Table 2).
Table 2.
Association between home dust allergen concentration in first 3 years of life and asthma at 7 years of age
| Allergen concentration* | ||||
|---|---|---|---|---|
| No asthma (n=312) |
Asthma (N = 130) |
Adjusted OR (95%CI)† |
p-value | |
| Cockroach (bla g 1), U/g | ||||
| Age 3 months | 1.20 [0.20, 7.15] | 0.20 [0.20, 3.70] | 0.69 (0.45 – 1.06) | 0.09 |
| Cumulative@ | 7.00 [0.59, 36.7] | 2.19 [0.59, 15.2] | 0.55 (0.36 – 0.86) | <0.01 |
|
| ||||
| Mouse (mus m 1), ug/g | ||||
| Age 3 months | 0.57 [0.13, 2.80] | 0.22 [0.07, 2.52] | 0.75 (0.55 – 1.01) | 0.06 |
| Cumulative@ | 4.29 [0.71, 19.0] | 3.66 [0.28, 11.5] | 0.68 (0.49 – 0.94) | 0.02 |
|
| ||||
| Dust mite (der f 1), ug/g | ||||
| Age 3 months | 0.28 [0.26, 0.33] | 0.27 [0.26, 0.30] | 0.98 (0.91 – 1.04) | 0.46 |
| Cumulative@ | 0.85 [0.80, 1.15] | 0.83 [0.79, 1.16] | 0.94 (0.82 – 1.09) | 0.42 |
|
| ||||
| Dog (can f 1), ug/g | ||||
| Age 3 months | 0.005 [0.005, 0.050] | 0.005 [0.005, 0.005] | 0.62 (0.37 – 1.03) | 0.06 |
| Cumulative@ | 0.046 [0.015, 0.684] | 0.015 [0.015, 0.265] | 0.78 (0.56 – 1.09) | 0.15 |
|
| ||||
| Cat (fel d 1), ug/g | ||||
| Age 3 months | 0.36 [0.20, 1.33] | 0.28 [0.19, 0.59] | 0.78 (0.62 – 0.98) | 0.03 |
| Cumulative@ | 1.17 [0.64, 9.79] | 0.94 [0.64, 2.86] | 0.71 (0.51 – 1.00) | 0.05 |
|
| ||||
| Sum of exposures index‡ | ||||
| Age 3 months | 3.99 ± 2.29 | 3.16 ± 2.28 | 0.59 (0.44 – 0.80) | <0.001 |
| Cumulative@ | 11.33 ± 5.63 | 8.95 ± 5.05 | 0.52 (0.36 – 0.74) | <0.001 |
Values are median [interquartile range] except for sum of exposures index, which is mean ± standard deviations.
Cumulative exposure is defined as the sum of allergen concentrations at age 3 months, 2 years, and 3 years.
Odds ratios are from a logistic regression model controlling for gender, race, maternal Perceived Stress Scale, and maternal asthma, averaged across 8 imputed datasets, and represent the odds for an interquartile increase in exposure. Can f is an exception; due to a highly skewed distribution, the odds ratio for Can f is for an increase from the 25th to the 85th percentile.
Sum of exposures is calculated by combining cat, mouse, cockroach, and dog into a single index based on quartiles of exposure to individual allergens, resulting in range of 0-12.
Figure 1. Allergen Exposures and Asthma.
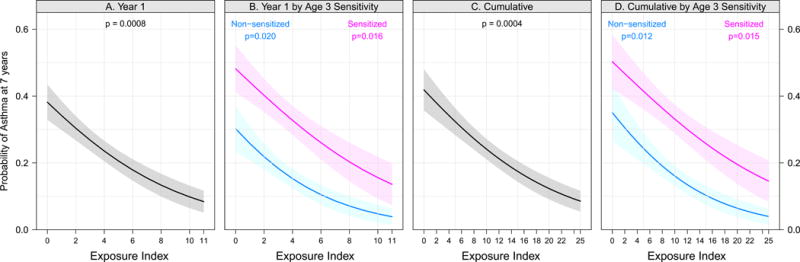
Relationships between exposure to specific allergens and asthma; probability of asthma at age 7 years determined by logistic regression according to the sum of exposure tertiles (cockroach, mouse, cat and dog). Fig 1, A shows sum of the exposures in the first year of life; Fig 1, B shows the same stratified by aeroallergen sensitization at age 3 (pink=sensitive, blue=not sensitive). Fig 1, C shows the cumulative sum of exposures across years 1, 2, and 3; Fig 1, D shows the same stratified by aeroallergen sensitization at age 3. P-values are from a logistic regression model testing a relationship between exposure levels and asthma, stratified by sensitization in panels B and D.
Microbial exposure and asthma
There was sufficient dust sample for microbiome profiling of 248 of the 442 (56%) children’s homes. This sub-sample was similar to the remainder of the cohort except for a slightly higher proportion with black race and a lower proportion with a paternal history of asthma (Table E3 in Online Repository). Bacterial alpha- and beta-diversity did not differ significantly between the homes of children that did or did not develop asthma, nor did these diversity measures differ between the homes of the children that did or did not develop atopy at age 7 (Figure E4A and E4B in Online Repository). Taxon-based comparisons identified 202 and 171 bacterial taxa, representing a breadth of bacterial phyla, that were significantly (FDR < 0.05) more or less abundant, respectively, in the homes of children that developed asthma (Figure 2; Table E4 in Online Repository). When this analysis was adjusted for atopic status at 7 years of age, 57% of these 473 taxa remained significantly (FDR < 0.05) associated with the development of asthma at age 7, and over 90% of the taxa had a regression coefficient relating the abundance of the taxon to asthma outcome within 4% of the coefficient in the unadjusted analysis. Among those taxa most enriched in homes of children that developed asthma were potential pathogens including Staphylococcus, Haemophilus (Pasturellaceae), Corynebacterium and several Sphingomonas members. In contrast, dust from the homes of children that did not develop asthma was enriched in Kocuria (Micrococcaceae), Alloiococcus (Aerobacteriaceae), Bifidobacterium, and Acinetobacter (Moraxellaceae). Many of the bacterial taxa that differed significantly in abundance between the homes of children that did and did not develop asthma also exhibited significant correlations with the concentrations of allergens (indicated by circles above bars in Figure 2). Of the 373 taxa that differed significantly between the two groups of homes, 34.6% had significant positive or negative correlations between bacterial abundance and Bla g 1 concentration, compared to only 14.7% of 373 randomly selected other taxa matched for distribution of abundance value (p < 0.001). Similar relationships were seen for Mus m1, Fel d 1, and Can f 1 (21.4% versus 6.2%, 34.3 versus 12.6%, and 45.0 versus 11.0%, respectively; p < 0.001 for all).
Figure 2. Classified bacterial taxa in house dust at 3 months of age in relation to simultaneous dust allergen concentrations and to asthma status age 7 years.
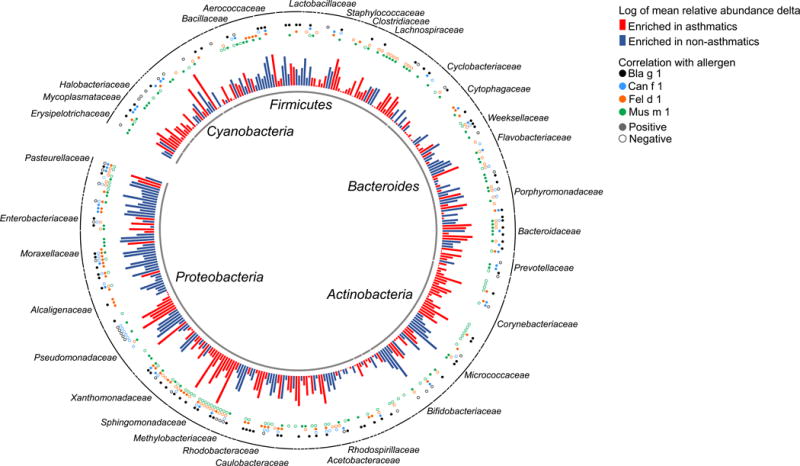
The 356 classified bacterial taxa (taxa classified as “mitochondria” or unclassified at the phylum level were omitted from this figure) that differed (False discovery rate < 0.05) between the homes of asthmatics and nonasthmatics are shown as bars, with color indicating whether the taxon was more abundant in the homes of asthmatics (red) or nonasthmatics (blue) and bar height indicating the magnitude of between-group relative abundance delta. The bacterial taxa with abundance that was correlated with allergen levels are indicated by circles above the bars, with color indicating the allergen and closed or open circles indicating positive or negative correlation, respectively.
We examined whether the association between higher house dust allergen concentration at age 3 months and lower risk of asthma at age 7 might be mediated by the house dust microbiome. Mediation analysis was performed via HIMA R package25, simultaneously assessing potential mediation by all 373 bacterial taxa that were present in differential abundance between the homes of children that did or did not develop asthma. For cat, dog, mouse, and the sum of exposure to these allergens plus cockroach allergen, we observed no evidence of statistically significant mediation. For cockroach allergen, we observed significant partial mediation by two bacterial taxa, Bifidobacteria and Brevundimonas, that explained 13.4% (p =0.05) and 12.1% (p = 0.02), respectively, of the association between higher cockroach allergen concentration and lower asthma risk. For these two bacterial taxa, higher abundance in house dust was associated with lower asthma risk.
Maternal smoking, stress, depression and asthma
Umbilical cord plasma cotinine concentration was a significant predictor of asthma (adjusted odds ratio = 1.76 for a one geometric standard deviation increase in cotinine concentration; 95% CI 1.00, 3.09; p = 0.048), while reported maternal smoking (either pre- or postnatally) and smoking by others in the home (assessed postnatally only) was not (Table 3). Maternal stress and depression in the first three years of life were significantly associated with the development of asthma at age 7 (Table 3). For example, maternal depression score at age 3 was significantly associated with asthma at age 7 (adjusted odds ratio = 1.05 for each 1-unit increase in Edinburgh Postpartum Depression Score with range 0-30; 95% CI 1.02 to 1.09; p < 0.01).
Table 3.
Association between early-life exposures and asthma at age 7 years
| No Asthma* | Asthma* | Adjusted OR (95%CI)† |
p-value | |
|---|---|---|---|---|
| Prenatal | ||||
| Mother smoked | 53 (17%) | 27 (21%) | 1.25 (0.74 – 2.13) | 0.41 |
| Umbilical cord plasma cotinine concentration (ng/mL)& | 3.14 ± 3.03 | 4.17 ± 4.17 | 1.76 (1.00 – 3.09) | 0.048 |
| Number of smokers in the home | 0.8 ± 1.0 | 0.7 ± 0.8 | 0.83 (0.66 – 1.04) | 0.11 |
| Maternal perceived stress# | 5.4 ± 3.5 | 5.9 ± 3.3 | 1.05 (0.99 – 1.12) | 0.11 |
| Maternal composite stress$ | 6.0 ± 1.9 | 6.2 ± 1.9 | 1.05 (0.93 – 1.17) | 0.44 |
| Maternal depression% | 7.6 ± 6.1 | 8.9 ± 6.6 | 1.03 (1.00 – 1.06) | 0.08 |
|
| ||||
| Year 1 | ||||
| Mother smoked | 131 (43%) | 47 (37%) | 0.74 (0.48 – 1.15) | 0.18 |
| Number of smokers in home | 1.3 ± 1.3 | 1.5 ± 2.0 | 1.04 (0.91 – 1.19) | 0.55 |
| NO2 (ppb)‡ | 20.4 [12.0, 31.7] | 20.0 [10.9, 32.4] | 0.97 (0.75 – 1.26) | 0.82 |
| Nicotine (ug/g)‡ | 0.4 [0.2, 1.4] | 0.4 [0.2, 1.3] | 0.98 (0.66 – 1.44) | 0.90 |
| Ergosterol (ng/mg)‡ | 3.7 [2.1, 6.1] | 3.1 [2.1, 6.2] | 0.84 (0.61 – 1.15) | 0.27 |
| Endotoxin (EU/mg)‡ | 38.7 [17.5, 90.2] | 29.5 [14.6, 62.2] | 0.74 (0.51 – 1.07) | 0.11 |
| Maternal perceived stress# | 4.4 ± 2.7 | 5.0 ± 2.8 | 1.07 (0.99 – 1.16) | 0.07 |
| Maternal composite stress$ | 7.7 ± 1.0 | 7.8 ± 0.9 | 1.14 (0.92 – 1.42) | 0.23 |
| Maternal depression% | 5.6 ± 5.3 | 7.0 ± 6.5 | 1.04 (1.00 – 1.08) | 0.04 |
| Number of colds | 4.1 ± 2.9 | 4.8 ± 2.7 | 1.07 (0.99 – 1.15) | 0.09 |
|
| ||||
| Year 2 | ||||
| Mother smoked | 124 (41%) | 47 (37%) | 0.83 (0.53 – 1.30) | 0.42 |
| Number of smokers in home | 1.2 ± 1.2 | 1.3 ± 2.2 | 1.02 (0.89 – 1.17) | 0.77 |
| Maternal perceived stress# | 4.4 ± 2.9 | 5.3 ± 3.1 | 1.10 (1.02 – 1.18) | <0.01 |
| Maternal composite stress$ | 6.0 ± 1.8 | 6.3 ± 1.9 | 1.07 (0.95 – 1.20) | 0.26 |
| Maternal depression% | 5.7 ± 6.0 | 7.5 ± 6.8 | 1.04 (1.00 – 1.07) | 0.03 |
| Number of colds | 3.7 ± 2.7 | 5.2 ± 3.8 | 1.13 (1.06 – 1.22) | <0.01 |
|
| ||||
| Year 3 | ||||
| Mother smoked | 125 (40%) | 48 (38%) | 0.80 (0.52 – 1.24) | 0.31 |
| Number of smokers in home | 1.1 ± 1.1 | 1.1 ± 1.4 | 0.99 (0.83 – 1.18) | 0.91 |
| Endotoxin (EU/mg)‡ | 32.0 [17.6, 61.2] | 32.9 [16.2, 58.8] | 0.86 (0.66 – 1.13) | 0.29 |
| Maternal perceived stress# | 4.5 ± 2.8 | 5.3 ± 2.9 | 1.10 (1.02 – 1.18) | 0.01 |
| Maternal composite stress$ | 6.0 ± 1.8 | 6.6 ± 1.8 | 1.16 (1.02 – 1.31) | 0.02 |
| Maternal depression% | 5.2 ± 5.8 | 7.3 ± 6.9 | 1.05 (1.02 – 1.09) | <0.01 |
| Number of colds | 3.5 ± 2.8 | 4.5 ± 3.0 | 1.11 (1.03 – 1.20) | <0.01 |
Values are counts (percentages), means ± standard deviations, or medians [interquartile range] from raw, non-imputed data. The exception is umbilical cord plasma cotinine concentration, which is expressed as geometric mean ± geometric standard deviation because of a highly skewed distribution with many values below the detection limit.
Odds ratios are from a logistic regression model controlling for gender, race, and maternal asthma, averaged across 8 imputed datasets; n=442 for all. Model for number of colds also controlled for maternal stress within each year.
Prior to inclusion in the model, NO2, nicotine, ergosterol, and endotoxin values have been log (base 10) transformed and their estimates represent the odds for an interquartile increase in exposure.
Odds ratio is per 1 geometric standard deviation increase in cord plasma cotinine concentration.
Odds ratio is per unit increase in the maternal Perceived Stress Scale, which ranges from 0 to 4.
Odds ratio is per unit increase in the composite stress scale, as described in text, which ranges from 0 to 9.
Odds ration per unit increase in the maternal Edinburgh Postpartuem Depression Scale, which ranges from 0 to 30.
Other exposures and asthma
Indoor air nitrogen dioxide concentration, and house dust concentrations of ergosterol and endotoxin were not associated with the development of asthma (Table 3). The number of colds in the second and third years of life was associated with the development of asthma at age 7 years (Table 3).
DISCUSSION
The URECA study evaluated the home environments of high-risk children in four economically disadvantaged urban neighborhoods beginning in the prenatal period to identify potentially modifiable risk factors for childhood asthma. Higher exposure to cockroach, mouse, and cat allergens during infancy was associated with a lower risk of developing asthma at age 7 years. The bacterial microbiota in house dust in the first year of life differed between the homes of children that did and did not develop asthma, and a majority of the bacterial taxa positively or negatively associated with asthma risk were also correlated with the concentrations of the indoor allergens associated with asthma risk. In addition, umbilical cord plasma cotinine concentration and maternal stress and depression scores in early life were risk factors for asthma at age 7. Indoor NO2 concentration and house dust concentrations of the bacterial cell wall constituent endotoxin and fungal membrane lipid ergosterol – which have been associated with asthma is some studies - were not associated with the development of asthma in this cohort.
These findings suggest that the early-life environment of children in the inner city may include exposures that increase asthma risk, such as prenatal tobacco smoke and maternal stress, and exposures that reduce risk, such as specific indoor allergens, bacteria, or bacterial products. Exposure to environments that are rich in allergens and microbes have been associated with low rates of asthma and other allergic diseases.2,26,27 For example, the environment of Amish farms in the US is associated with a lower prevalence of asthma and allergen sensitization than Hutterite farms, and house dust from the former setting has a higher endotoxin concentration and distinct microbiota compared with the latter.28 Compared to other environments, inner cities are extensively paved and may have a paucity of outdoor exposures to animals, plants, and sources of microbes such as soil and green space. In this setting, indoor pests or pets may provide biologic signals that promote normal lung and immunologic development. These findings extend our earlier report that exposure to cockroach, mouse, and cat allergens in infancy is associated with a lower risk of recurrent wheezing through age 3 years,16 although it is important to note that there is incomplete concordance between the phenotypes of recurrent wheezing at age 3 and asthma at 7 years of age, 35 percent of the children with asthma at age 7 not having had recurrent wheezing at age 3. Relationships of allergen exposure to wheezing or asthma could depend on the nature of the allergen exposure and the other environmental factors present in a specific environment; for example, exposure to dust mite in URECA was not associated with asthma risk, while in another US study early-life dust mite exposure was associated with increased asthma risk.29 Also, in contrast to our findings for cat allergen in US inner cities, a pooled analysis of data from 11 European birth cohorts found no association between the presence of cats in the home during infancy and asthma at school age, although those studies did not include measured allergen concentrations.8
One factor that may influence the assocation of higher early-life allergen exposure and lower asthma risk is a home bacterial microbiota altered by the presence of pets and pests. A number of bacterial taxa differed in abundance in the homes of children that did and did not develop asthma, and most of these taxa were also significantly associated with cockroach, mouse or cat allergens. Previous studies have demonstrated that dogs alter the home microbiota,12,30 and that microbes associated with dogs can reduce allergic airway inflammation and bronchial reactivity in mouse models.13 The characteristics of allergen-associated bacterial taxa in URECA may offer clues relevant to primary prevention strategies. Members of the Kocuria genus,, which was more abundant in the homes of children that did not develop asthma, are known to produce kocurin, a potent macrolide with activity against Staphylococcus.31 Also more abundant in the homes of children that did not develop asthma were Alloiococcus, the presence of which in the nasal microbiota is associated with lower frequency of childhood upper respiratory infection32, and Bifidobacterium and Acinetobacter, species of which protect against allergic sensitization in murine models.33,34 Bacterial taxa that were more abundant in the homes of children that did develop asthma included potential pathogens such as Staphylococcus, Haemophilus (Pasturellaceae), Corynebacterium and several Sphingomonas members. In a Danish birth cohort, colonization of the hypopharynx at age 1 month with H. influenzae was associated with increased risk of recurrent wheeze and asthma at age 5 years.35 The observed associations between the abundance of specific bacterial taxa and asthma risk suggested that some of these associations might mediate the observed association of higher dust allergen concentrations with lower asthma risk. Mediation analysis, however, failed to confirm such mediation except in the case of cockroach allergen, for which two bacterial taxa, Bifidobacteria and Brevundimonas, appeared to explain part of the inverse association between higher allergen concentration and lower asthma risk. Further research is needed to confirm and explore the potential mechanism of this observation.
The absence of significant differences in overall bacterial diversity in house dust between the homes of children that did or did not develop asthma or atopy at age 7 may suggest that specific bacterial taxa or communities have a greater effect on risk than overall diversity. Our earlier observation16 that bacterial diversity was related to recurrent wheeze and atopy at age 3 may reflect the difference of that phenotype from later-onset allergic sensitization by age 7; the use of 16S rRNA sequencing in this study as opposed to a higher-resolution phylogenetic microarray in the earlier study; or the smaller number of subjects included in the earlier study.
Our findings confirm and extend previous studies linking prenatal smoke exposure and maternal stress and depression to childhood asthma. A meta-analysis of birth cohorts observed a modest association between questionnaire-reported prenatal smoking and asthma later in childhood.36 Our finding that cord plasma cotinine predicts asthma at age 7 years provides support for the role of prenatal smoking in the pathogenesis of asthma. Furthermore, the combination of maternal prenatal and postnatal stress has been associated with a higher risk of wheezing in early life.37,38 It is unknown whether these associations are due to direct physiologic effects, such as altered hypothalamopituitary function and corticosteroid responsiveness, or to maternal behavioral responses to these conditions in their children.
The strengths of this study include a definition of asthma based on observations of physician diagnosis, symptoms, medication use, and lung physiology. The multicenter design helps to establish findings that are generalizable to high-risk urban children; however, a limitation is that the relationships with environmental factors identified in URECA may be specific to this population and may depend on the personal or environmental context, including specific allergies, lifestyle, or neighborhood factors. Although the associations of bacterial taxa in house dust with the development of asthma were adjusted for multiple comparisons, replication in other study populations will be needed when such data become available. We did not measure the gastrointestinal or airway microbiome in early childhood, so we cannot evaluate the independent effects of the house dust, airway, and gastrointestinal microbiomes. Another important caveat is that the observed associations do not necessarily establish causation, and, despite the prospective and longitudinal design of the study, with environmental assessments beginning at 3 months of age, it is possible that a family’s health and health-related behaviors led to long-term alterations of home allergens, microbiome, and maternal stress, rather than these factors influencing health outcomes.
Our findings suggest that primary prevention strategies for childhood asthma in low-income urban communities should probably not focus on home allergen reduction, and that exposure to a broad variety of proteins in early life may have health benefits with respect to asthma. Interventions to reduce prenatal smoking and to reduce maternal stress and depression during pregnancy and infancy may hold promise for asthma prevention. Finally, our results in poor urban neighborhoods echo those in farming communities suggesting that early-life microbial exposures are associated with the risk of childhood asthma, findings that may provide targets for strategies to prevent asthma.
Supplementary Material
KEY MESSAGES.
Among urban children, higher indoor levels of pet- and pest-related allergens in infancy are associated with reduced risk of asthma at age 7 years.
Maternal stress during infancy and prenatal maternal smoking are associated with increased asthma risk.
The indoor bacterial microbiome in infancy also appears to be associated with asthma risk.
CAPSULE SUMMARY.
Among high-risk, urban children, higher indoor allergens levels in infancy were associated with lower asthma risk at age 7. Other risk factors included prenatal maternal smoking and higher maternal stress and depression scores.
Acknowledgments
This project has been funded with Federal funds from the National Institute of Allergy and Infectious Diseases, National Institutes of Health, under Contract numbers NO1-AI-25496, NO1-AI-25482, HHSN272200900052C, HHSN272201000052I, 1UM1AI114271-01 and UM2AI117870. Additional support was provided by the National Center for Research Resources, National Institutes of Health, under grants RR00052, M01RR00533, 1UL1RR025771, M01RR00071, 1UL1RR024156, and 5UL1RR024992-02, and the National Center for the Advancement of Translational Research, National Institutes of Health, under grants UL1TR001079 and UL1TR000040.
Abbreviations
- URECA
Urban Environment and Childhood Asthma Study
- rRNA
Ribosomal ribonucleic acid
- OTU
Operational taxonomic unit
Footnotes
Publisher's Disclaimer: This is a PDF file of an unedited manuscript that has been accepted for publication. As a service to our customers we are providing this early version of the manuscript. The manuscript will undergo copyediting, typesetting, and review of the resulting proof before it is published in its final citable form. Please note that during the production process errors may be discovered which could affect the content, and all legal disclaimers that apply to the journal pertain.
References
- 1.Van Cleave J, Gortmaker SL, Perrin JM. Dynamics of obesity and chronic health conditions among children and youth. JAMA. 2010;303:623–30. doi: 10.1001/jama.2010.104. [DOI] [PubMed] [Google Scholar]
- 2.Stoltz DJ, Jackson DJ, Evans MD, et al. Specific patterns of allergic sensitization in early childhood and asthma & rhinitis risk. Clin Exp Allergy. 2013;43:233–41. doi: 10.1111/cea.12050. [DOI] [PMC free article] [PubMed] [Google Scholar]
- 3.Nickel R, Lau S, Niggemann B, et al. Messages from the German Multicentre Allergy Study. Pediatr Allergy Immunol. 2002;13(Suppl 15):7–10. doi: 10.1034/j.1399-3038.13.s.15.4.x. [DOI] [PubMed] [Google Scholar]
- 4.Litonjua AA, Carey VJ, Burge HA, Weiss ST, Gold DR. Exposure to cockroach allergen in the home is associated with incident doctor-diagnosed asthma and recurrent wheezing. J Allergy Clin Immunol. 2001;107:41–7. doi: 10.1067/mai.2001.111143. [DOI] [PubMed] [Google Scholar]
- 5.Litonjua AA, Milton DK, Celedon JC, Ryan L, Weiss ST, Gold DR. A longitudinal analysis of wheezing in young children: the independent effects of early life exposure to house dust endotoxin, allergens, and pets. J Allergy Clin Immunol. 2002;110:736–42. doi: 10.1067/mai.2002.128948. [DOI] [PubMed] [Google Scholar]
- 6.von Mutius E, Vercelli D. Farm living: effects on childhood asthma and allergy. Nat Rev Immunol. 2010;10:861–8. doi: 10.1038/nri2871. [DOI] [PubMed] [Google Scholar]
- 7.Ownby DR, Johnson CC, Peterson EL. Exposure to dogs and cats in the first year of life and risk of allergic sensitization at 6 to 7 years of age. JAMA. 2002;288:963–72. doi: 10.1001/jama.288.8.963. [DOI] [PubMed] [Google Scholar]
- 8.Lodrup Carlsen KC, Roll S, Carlsen KH, et al. Does pet ownership in infancy lead to asthma or allergy at school age? Pooled analysis of individual participant data from 11 European birth cohorts. PLoS One. 2012;7:e43214. doi: 10.1371/journal.pone.0043214. [DOI] [PMC free article] [PubMed] [Google Scholar]
- 9.Braun-Fahrlander C, Riedler J, Herz U, et al. Environmental exposure to endotoxin and its relation to asthma in school-age children. N Engl J Med. 2002;347:869–77. doi: 10.1056/NEJMoa020057. [DOI] [PubMed] [Google Scholar]
- 10.Douwes J, van Strien R, Doekes G, et al. Does early indoor microbial exposure reduce the risk of asthma? The Prevention and Incidence of Asthma and Mite Allergy birth cohort study. J Allergy Clin Immunol. 2006;117:1067–73. doi: 10.1016/j.jaci.2006.02.002. [DOI] [PubMed] [Google Scholar]
- 11.Arrieta MC, Stiemsma LT, Dimitriu PA, et al. Early infancy microbial and metabolic alterations affect risk of childhood asthma. Sci Transl Med. 2015;7:307ra152. doi: 10.1126/scitranslmed.aab2271. [DOI] [PubMed] [Google Scholar]
- 12.Fujimura KE, Johnson CC, Ownby DR, et al. Man’s best friend? The effect of pet ownership on house dust microbial communities. J Allergy ClinImmunol. 2010;126:410–2. 2. doi: 10.1016/j.jaci.2010.05.042. [DOI] [PMC free article] [PubMed] [Google Scholar]
- 13.Fujimura KE, Demoor T, Rauch M, et al. House dust exposure mediates gut microbiome Lactobacillus enrichment and airway immune defense against allergens and virus infection. Proc Natl Acad Sci U S A. 2014;111:805–10. doi: 10.1073/pnas.1310750111. [DOI] [PMC free article] [PubMed] [Google Scholar]
- 14.Gern JE, Visness CM, Gergen PJ, et al. The Urban Environment and Childhood Asthma (URECA) birth cohort study: design, methods, and study population. BMC Pulm Med. 2009;9:17. doi: 10.1186/1471-2466-9-17. [DOI] [PMC free article] [PubMed] [Google Scholar]
- 15.Crain EF, Walter M, O’Connor GT, et al. Home and allergic characteristics of children with asthma in seven U.S. urban communities and design of an environmental intervention: the Inner-City Asthma Study. Environ Health Perspect. 2002;110:939–45. doi: 10.1289/ehp.02110939. [DOI] [PMC free article] [PubMed] [Google Scholar]
- 16.Lynch SV, Wood RA, Boushey H, et al. Effects of early-life exposure to allergens and bacteria on recurrent wheeze and atopy in urban children. J Allergy Clin Immunol. 2014;134:593–601 e12. doi: 10.1016/j.jaci.2014.04.018. [DOI] [PMC free article] [PubMed] [Google Scholar]
- 17.Cohen S, Kamarck T, Mermelstein R. A global measure of perceived stress. J Health Soc Behav. 1983;24:385–96. [PubMed] [Google Scholar]
- 18.Cox JL, Holden JM, Sagovsky R. Detection of postnatal depression. Development of the 10-item Edinburgh Postnatal Depression Scale. Br J Psychiatry. 1987;150:782–6. doi: 10.1192/bjp.150.6.782. [DOI] [PubMed] [Google Scholar]
- 19.Wright RJ, Visness CM, Calatroni A, et al. Prenatal maternal stress and cord blood innate and adaptive cytokine responses in an inner-city cohort. American journal of respiratory and critical care medicine. 2010;182:25–33. doi: 10.1164/rccm.200904-0637OC. [DOI] [PMC free article] [PubMed] [Google Scholar]
- 20.Miller MR, Hankinson J, Brusasco V, et al. Standardisation of spirometry. Eur Respir J. 2005;26:319–38. doi: 10.1183/09031936.05.00034805. [DOI] [PubMed] [Google Scholar]
- 21.Little RRD. Statistical Analysis with Missing Data. Second. John Wiley and Sons; 2014. [Google Scholar]
- 22.van Buuren S. Flexible imputation of missing data. CRC Press; 2012. [Google Scholar]
- 23.Caporaso JG, Kuczynski J, Stombaugh J, et al. QIIME allows analysis of high-throughput community sequencing data. Nat Methods. 2010;7:335–6. doi: 10.1038/nmeth.f.303. [DOI] [PMC free article] [PubMed] [Google Scholar]
- 24.Romero R, Hassan SS, Gajer P, et al. The composition and stability of the vaginal microbiota of normal pregnant women is different from that of non-pregnant women. Microbiome. 2014;2 doi: 10.1186/2049-2618-2-4. [DOI] [PMC free article] [PubMed] [Google Scholar]
- 25.Zhang H, Zheng Y, Zhang Z, et al. Estimating and testing high-dimensional mediation effects in epigenetic studies. Bioinformatics. 2016;32:3150–4. doi: 10.1093/bioinformatics/btw351. [DOI] [PMC free article] [PubMed] [Google Scholar]
- 26.Fuchs O, Genuneit J, Latzin P, et al. Farming environments and childhood atopy, wheeze, lung function, and exhaled nitric oxide. J Allergy Clin Immunol. 2012;130:382–8 e6. doi: 10.1016/j.jaci.2012.04.049. [DOI] [PubMed] [Google Scholar]
- 27.Douwes J, Cheng S, Travier N, et al. Farm exposure in utero may protect against asthma, hay fever and eczema. Eur Respir J. 2008;32:603–11. doi: 10.1183/09031936.00033707. [DOI] [PubMed] [Google Scholar]
- 28.Stein MM, Hrusch CL, Gozdz J, et al. Innate Immunity and Asthma Risk in Amish and Hutterite Farm Children. N Engl J Med. 2016;375:411–21. doi: 10.1056/NEJMoa1508749. [DOI] [PMC free article] [PubMed] [Google Scholar]
- 29.Celedon JC, Milton DK, Ramsey CD, et al. Exposure to dust mite allergen and endotoxin in early life and asthma and atopy in childhood. J Allergy Clin Immunol. 2007;120:144–9. doi: 10.1016/j.jaci.2007.03.037. [DOI] [PMC free article] [PubMed] [Google Scholar]
- 30.Dunn RR, Fierer N, Henley JB, Leff JW, Menninger HL. Home life: factors structuring the bacterial diversity found within and between homes. PLoS One. 2013;8:e64133. doi: 10.1371/journal.pone.0064133. [DOI] [PMC free article] [PubMed] [Google Scholar]
- 31.Palomo S, Gonzalez I, de la Cruz M, et al. Sponge-derived Kocuria and Micrococcus spp. as sources of the new thiazolyl peptide antibiotic kocurin. Mar Drugs. 2013;11:1071–86. doi: 10.3390/md11041071. [DOI] [PMC free article] [PubMed] [Google Scholar]
- 32.Teo SM, Mok D, Pham K, et al. The infant nasopharyngeal microbiome impacts severity of lower respiratory infection and risk of asthma development. Cell Host Microbe. 2015;17:704–15. doi: 10.1016/j.chom.2015.03.008. [DOI] [PMC free article] [PubMed] [Google Scholar]
- 33.Feleszko W, Jaworska J, Rha RD, et al. Probiotic-induced suppression of allergic sensitization and airway inflammation is associated with an increase of T regulatory-dependent mechanisms in a murine model of asthma. Clin Exp Allergy. 2007;37:498–505. doi: 10.1111/j.1365-2222.2006.02629.x. [DOI] [PubMed] [Google Scholar]
- 34.Debarry J, Garn H, Hanuszkiewicz A, et al. Acinetobacter lwoffii and Lactococcus lactis strains isolated from farm cowsheds possess strong allergy-protective properties. J Allergy Clin Immunol. 2007;119:1514–21. doi: 10.1016/j.jaci.2007.03.023. [DOI] [PubMed] [Google Scholar]
- 35.Bisgaard H, Hermansen MN, Buchvald F, et al. Childhood asthma after bacterial colonization of the airway in neonates. N Engl J Med. 2007;357:1487–95. doi: 10.1056/NEJMoa052632. [DOI] [PubMed] [Google Scholar]
- 36.Burke H, Leonardi-Bee J, Hashim A, et al. Prenatal and passive smoke exposure and incidence of asthma and wheeze: systematic review and meta-analysis. Pediatrics. 2012;129:735–44. doi: 10.1542/peds.2011-2196. [DOI] [PubMed] [Google Scholar]
- 37.Mathilda Chiu YH, Coull BA, Cohen S, Wooley A, Wright RJ. Prenatal and postnatal maternal stress and wheeze in urban children: effect of maternal sensitization. American journal of respiratory and critical care medicine. 2012;186:147–54. doi: 10.1164/rccm.201201-0162OC. [DOI] [PMC free article] [PubMed] [Google Scholar]
- 38.Rosa MJ, Just AC, Tamayo YOM, et al. Prenatal and postnatal stress and wheeze in Mexican children: Sex-specific differences. Ann Allergy Asthma Immunol. 2016;116:306–12 e1. doi: 10.1016/j.anai.2015.12.025. [DOI] [PMC free article] [PubMed] [Google Scholar]
Associated Data
This section collects any data citations, data availability statements, or supplementary materials included in this article.