

How does personal debt degrade mental health? A reasonable place to begin to answer this question is by contrasting debt to another, more researched, money-related stressor: economic hardship. Economic hardship is more common among disadvantaged populations and is detrimental for mental health in part because it erodes a sense of personal control. Yet, though debt and hardship are both money-related stressors that have at their core financial transactions—e.g., paying for food, paying for college tuition—there are several reasons that debt’s role in social stress processes is distinct from that of economic hardship. For one, debt is more prevalent among those privileged by higher socioeconomic status (Bricker et al. 2012: p. 57). The experience of indebtedness also might depend on many factors, such as the reasons for borrowing and the stage of the life course during which debt is incurred. Taking on debt may be how some cash-strapped individuals mitigate difficulties paying for necessities like food and housing, and a majority of college students now rely on debt to help finance their education. For these reasons, the conceptual status of debt in the “stress process” model is at present unclear.
The major goals of this paper are to contrast debt and economic hardship, and to clarify where debt fits into the stress process model. The stress process model (Pearlin 1989; Thoits 1995; Turner 2013) begins with the premise that stressors are socially patterned, that exposure to events and relationships that influence mental health is strongly shaped by causally prior advantages and disadvantages associated with one’s race, gender, age, income, etc. In turn, exposure to stress, such as the threat of being fired or constantly worrying about money, affects mental health. In addition, the stress may be lessened by one’s levels of social and personal resources (i.e., social support, coping). Finally, social and personal resources can also buffer or protect individuals from the negative consequences of stress exposure.
The stress process model presents several ways debt may be related to mental health (see Figure 1). Debt could act as a stressor that directly leads to mental health outcomes such as symptoms of depression and anxiety (direct effect pathway). The stress of carrying debt and not having money to pay for things outright can be classified as a daily or “quotidian” stressor (Pearlin 1989), one that steadily wears away at one’s mental health. Thus, if the status of owing money is inherently distressing, then debt will be directly associated with mental health outcomes.
Figure 1.
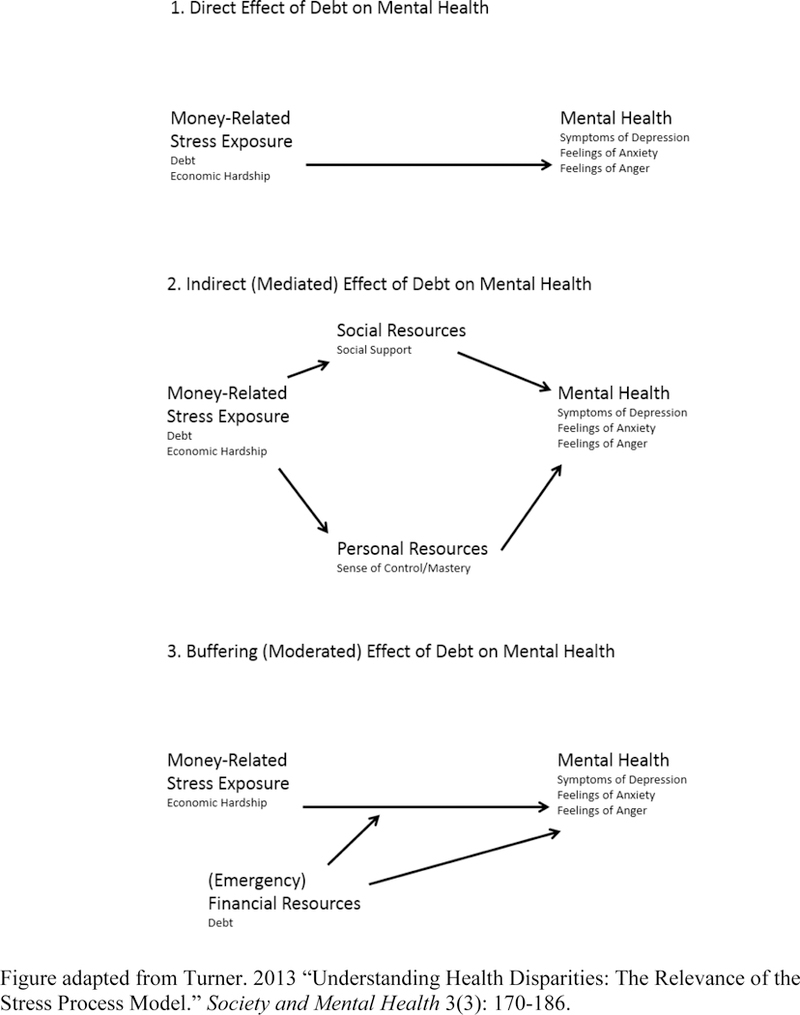
Stress process model and three potential influences of debt.
Or debt may indirectly affect mental health by eroding mastery and coping capacity or straining social relationships (mediated pathway). Having to carry debt may mean that people feel as if they are unable to effectively handle their own financial well-being, thus wearing away at their sense of mastery. Individuals may feel embarrassed by their need to borrow, and may socially isolate themselves when they need money, use pay day loans and the like. Though there is a growing body of work documenting the negative health consequences of indebtedness, it remains unclear whether debt acts directly on mental health or indirectly through personal and social resources.
Finally, another possible role of debt in the stress process model is as a buffer, a coping device to deal with immediate financial needs. For instance, when there is a lot of economic hardship, debt can serve as a safety net to help individuals make it through tough times. If debt is a buffer (moderating pathway), we would expect that debt will alleviate the effect of economic hardship on depression. There is surprisingly little empirical research on this potential role of debt. Thoits made the same general point almost two decades ago when she noted the “puzzling lack of attention to an obvious coping resource: money. We treat financial resources either as an indicator of socioeconomic status or, when resources are scarce, as an indicator of experienced chronic difficulty. We do not consider the possibility that financial resources themselves may serve as stress buffers” (1995; p. 63). We therefore examine a third possible pathway linking debt to mental health, namely that it also reduces the distress associated with economic hardship.
Relevant to our investigation is the theory that socioeconomic status constitutes a fundamental cause of health (Link and Phelan 1995; Phelan, Link, and Tehranifar 2010). This theory posits that socioeconomic status is a fundamental cause because it is related to several aspects of health through multiple risk factors, and SES provides access to flexible protective resources like knowledge, money, power, prestige, and social capital to deal with the risk factors. These resources are adaptive over time as risk factors shift and change. Thus, debt may be another flexible resource that advantaged groups “deploy … to avoid risks and adopt protective strategies” (Phelan et al. 2010: S29). On the other hand, debt may be a severely flawed resource in that it provides short-term financial resources at the cost of increased risk of depression and other mental disorders. Indeed, not all resources work to reinforce fundamental health inequalities (Phelan, Link, and Tehranifar 2010), and debt is not as highly concentrated among elites as is wealth or income. Indebtedness instead may yield distress, but less so for those with adequate material resources or valued social connections that provide protection from debt’s risks (e.g., defaulting) or hasten its repayment.
To extend our understanding of debt as a money-related stressor in the stress process model, we address two broad questions. As a preliminary assessment, we first ask to what extent does debt resemble economic hardship in terms of its association with socioeconomic status on the one hand and mental health on the other? Second, what is the nature of the association with mental health in the stress process? For the second question we consider three possible pathways as depicted in Figure 1: (1) a direct or unmediated influence, (2) an indirect influence mediated by mastery and/or social support, and (3) a buffering effect that moderates or is protective against the distress associated with economic hardship (i.e., a “debt x economic hardship” interaction). We test these questions using a two-wave panel study of Miami adults. The data are well suited to address the role of debt in the stress process model because they allow us to examine the influence of debt and hardship across three mental health outcomes, controlling for prior mental health status. It is rare to have a study of adults that contains so many measures that tie specifically to the stress process model, and also asks questions related to debt.
BACKGROUND
Debt and Mental Health
An increasing number of American families are struggling with debt, and the aggregate level of consumer debt in the U.S. has reached unprecedented levels. Between 2000 and 2008, consumer credit increased by more than one trillion dollars according to Federal Reserve data (Sullivan 2009), and the ratio of debt to income grew among all groups save the top one percent of owners of wealth (Keister and Lee 2014). The Great Recession in late 2007 brought further credit and financial woes to households in the form of underwater mortgages, declining equities, layoffs, and a significant drop in household income (Manturuk, Riley and Ratcliffe 2012; Parker 2012). Many turned to higher education as a means to better protect themselves from financial risks, often by relying on student loans that now collectively exceed one trillion dollars (U.S. Dept. of Education 2014). Thus, debt in its many forms looms larger than ever in the U.S., but less understood are the mental health costs of indebtedness.
A growing body of evidence shows that debt comes with psychological costs. Debt, and the worry associated with debt, is associated with a range of mental health problems such as elevated symptoms of depression and anxiety (Brown, Taylor and Wheatley Price 2005; Drentea 2000; Reading and Reynolds 2001). Debt is also associated with anger (Drentea and Reynolds 2012), suicide ideation (Meltzer et al. 2011), and a variety of physical health problems (Drentea and Lavrakas 2000; Munster et al. 2009; O’Neill et al. 2006). Some of the physical health risks may be due to debt’s association with obesity, smoking and drinking (e.g., Drentea and Lavrakas 2000). The process whereby debt incurs mental health costs has not been thoroughly researched, and this understanding can be advanced by resolving where debt fits in the stress process model in relation to a more often studied money-related stressor, economic hardship.
When considered as a social stressor, the significance of debt will likely depend on the personal meaning debt has for those experiencing it. For some, debt may unequivocally signify an undesirable monetary obligation that adds worry to their lives or erodes self-concept. Others may use debt strategically to shore up immediate financial shortcomings—to pay an unexpected medical bill, for instance—or as an investment that will yield future benefits exceeding the costs. Indeed, Dwyer et al. (2011) report that among some young adults, taking on debt is positively associated with mastery and self-esteem, perhaps reflecting a worldview in which debt is a necessary investment in the pursuit of middle-class status.
Economic Hardship and Mental Health
Sociologists and psychologists have paid significantly more attention to another money-related social stressor: economic hardship. Economic hardship is defined as the experience of not having enough financial resources to cover basic expenses. The concept is usually assessed by asking individuals how much difficulty they have paying for adequate housing, food, clothing, and medical expenses (e.g., Kahn and Pearlin 2006; Mirowsky and Ross 2001; Mimura 2007; Pudrovska et al. 2005). It is also related to the concept of financial strain, which can incorporate trouble paying for necessities, but also can be measured over time by examining if people have money left over at the end of the month (Kahn and Pearlin 2006). Though economic hardship is certainly more common among low-income households (Ross and Huber 1985), it is not synonymous with poverty. Many families below the poverty line manage their limited resources effectively and/or draw on community resources in times of need. Conversely, families in the upper class are not immune to economic hardship, they can experience financial shortfalls due to high levels of spending, sudden losses of income, health crises and the like (McCloud and Dwyer 2011).
Like debt, economic hardship has been linked to multiple mental health outcomes. Those who struggle to pay for basic needs report significantly more symptoms of depression and anxiety and higher rates of common mental disorders (Butterworth et al. 2009; Lahelma et al. 2006; Mirowsky and Ross 2001; Mimura 2007; Ross and Huber 1985; Young and Schieman 2012). Some of the relationship between economic hardship and mental health is due to reduced psychosocial resources, such as a diminished sense of mastery (Pudrovska et al. 2005). The negative consequences of economic hardship also may be buffered by income and diminished among older populations (Mirowsky and Ross 1999, 2001). This provides some rationale for anticipating that the negative consequences of economic hardship may vary by indebtedness. That is, if individuals use credit to secure loans which, in turn, increases their financial efficacy or boosts the perception that their economic situation will improve in the future, then debt can alleviate some of the mental health costs of hardship.
Debt, Economic Hardship and Stress Process Theory
Debt and economic hardship are both money-related statuses that are clearly associated with poorer mental health. This claim is well supported with evidence from multiple studies and various populations, with few exceptions (cf. Dwyer et al. 2011). Beyond this basic association, much less is known about the role that debt plays in the stress process model. The results from this paper reveal that debt is distinct from economic hardship as a money-related social stressor. It is not strongly related to socioeconomic status, its influence is only slightly mediated by mastery and social support, and it does not buffer against the distress of financial hardship.
DATA AND METHODS
Sample
The analyses use data from the Miami Disability Study, a two-wave panel study of Miami-Dade County residents of adults with and without a physical disability. The sampling frame was constructed after randomly selecting 10,000 households in the county and screening them with respect to age, sex, ethnicity, disability status, and language. This sampling frame was then stratified to have even numbers of women and men, even numbers of those people screened as having a physical disability and those without a disability, and even numbers of Cubans, other Hispanics, African-Americans, and non-Hispanic whites. Computer-assisted interviews were completed in English or Spanish based on the respondent’s preference. A total of 1,986 first wave interviews were completed in 2000–2001 for a success rate of 82%. Follow-up interviews were conducted between January 2004 and June 2006 (n = 1,513).1 Most measures are taken from the follow-up interviews; in addition, the regression models include the lagged value of the dependent variable as measured around four years earlier in the first wave.
Our analytic sample is made up of 1,463 respondents who responded to both waves and had valid data on the measures of mental health, debt, and economic hardship. The oversampling of individuals with physical disabilities resulted in a greater proportion of older individuals than in the general population. The median age in the first wave sample was 59, compared to 35.6 years for the Miami-Dade County population as a whole in 2000, thus older Floridians are overrepresented in the sample. The descriptive statistics we report in Tables 1 and 2 are weighted to account for the stratified survey design of the study, using a post-stratification sampling weight that makes weighted proportions for age, sex, and ethnicity match population proportions for Miami-Dade County based on 2000 Census data.
Table 1.
Debt and economic hardship by economic status; Miami Disability Study (n=1,463). Weighted percents and means; unweighted counts.
| Percent in debt | Average economic hardship | n | |
|---|---|---|---|
| Overall | 64% | 0.37 | 1,463 |
| Household income | |||
| Less than $10,000 | 35%a | 0.68b | 197 |
| $10,000–$24,999 | 53% | 0.66 | 513 |
| $25,000–$54,999 | 69% | 0.29 | 387 |
| $55,000–$74,999 | 75% | 0.23 | 120 |
| $75,000 and above | 74% | 0.11 | 246 |
| Assets | |||
| Less than $10,000 | 61%a | 0.55b | 757 |
| $10,000 to $19,999 | 64% | 0.29 | 140 |
| $20,000 to $49,999 | 61% | 0.28 | 134 |
| $50,000 to $99,999 | 65% | 0.33 | 107 |
| $100,000 to $199,999 | 75% | 0.17 | 116 |
| $200,000 to $500,000 | 66% | 0.12 | 119 |
| $500,000 to $1,000,000 | 65% | 0.08 | 58 |
| More than $1,000,000 | 73% | 0.05 | 32 |
| Home value | |||
| Don’t own | 54%a | 0.52b | 544 |
| Less than $20,000 | 39% | 0.34 | 34 |
| $20,000 to $49,999 | 58% | 0.28 | 18 |
| $50,000 to $99,999 | 63% | 0.49 | 123 |
| $100,000 to $199,999 | 73% | 0.32 | 390 |
| $200,000 to $500,000 | 72% | 0.22 | 281 |
| More than $500,000 | 73% | 0.09 | 73 |
– χ2-test of differences in debtor status across income, assets, and home value significant at p<.05.
– F-test of differences in economic hardship across income, assets, and home value significant at p<.05.
Table 2.
Depressive symptoms, anxiety, and anger by debt status and levels of economic hardship. Miami Disability Study (n=1,463). Weighted means; unweighted counts.
| Average levels of: |
||||
|---|---|---|---|---|
| Depressive symptoms | Anxiety | Anger | n | |
| Debtor status | ||||
| No | 10.24 | 2.04a | 3.95a | 615 |
| Yes | 10.03 | 2.78 | 4.71 | 848 |
| Economic hardship | ||||
| 1st quartile | 7.61b | 1.90b | 3.59b | 672 |
| 2nd | 8.99 | 2.69 | 4.59 | 218 |
| 3rd | 11.85 | 2.47 | 4.58 | 248 |
| 4th quartile | 16.44 | 1.04 | 6.48 | 325 |
– F-test of differences in mental health across debtor status significant at p<.05.
– F-test of differences in mental health across economic hardship significant at p<.05.
Item nonresponse was more common, but still relatively low, for items tapping income and assets (nonresponse rates of 6%, 8%, and 9% for personal income, household income, and assets, respectively), but not debt (less than 1% missing). To reduce the potential bias from item nonresponse, we used multiple imputation techniques available in Stata (Royston 2004). Procedures based on imputation through chained equations (ICE) in Stata generated 5 data sets that substituted missing values on income, assets, and other predictors with values imputed from regressing each on all observed variables in the analyses. The regression coefficients in Tables 3–5 are averaged coefficients from these 5 data sets.
Table 3.
GLS regression of depressive symptoms on debt status, economic hardship, socioeconomic status, and controls. Miami Disability Study (n=1,463); slope coefficients and t-statistics.
| (1) | (2) | (3) | |
|---|---|---|---|
| Debtor (0,1) | 0.921* | 0.742 | 0.857 |
| (2.06) | (1.87) | (1.96) | |
| Economic hardship | 4.221*** | 2.608*** | 2.751*** |
| (8.64) | (5.95) | (4.52) | |
| Sense of mastery | −4.423*** | −4.423*** | |
| (−17.48) | (−17.48) | ||
| Social support, family | −0.223 | −0.221 | |
| (−0.65) | (−0.64) | ||
| Social support, friend | −0.075 | −0.076 | |
| (−0.30) | (−0.30) | ||
| Debtor x economic hardship | −0.266 | ||
| (−0.35) | |||
| Household income, ln($) | −0.178 | 0.020 | 0.021 |
| (−0.88) | (0.10) | (0.11) | |
| Assets, ln($) | −0.169 | 0.045 | 0.041 |
| (−1.22) | (0.34) | (0.32) | |
| Owns home (0,1) | 9.809 | 4.124 | 4.099 |
| (1.95) | (1.05) | (1.04) | |
| Value of home, ln($) | −0.780* | −0.338 | −0.336 |
| (−2.20) | (−1.22) | (−1.21) | |
| Education | −0.093 | −0.057 | −0.056 |
| (−1.63) | (−1.14) | (−1.13) | |
| Unemployed (vs. employed) | 1.679 | 0.954 | 0.957 |
| (0.99) | (0.61) | (0.61) | |
| Retired (vs. employed) | 0.431 | 0.270 | 0.277 |
| (0.74) | (0.51) | (0.53) | |
| Out of labor force (vs. employed) | 2.686*** | 2.124** | 2.125** |
| (3.57) | (3.19) | (3.19) | |
| Age | 0.010 | −0.021 | −0.021 |
| (0.57) | (−1.30) | (−1.30) | |
| Female (0,1) | 0.788 | 0.806* | 0.815* |
| (1.88) | (2.10) | (2.12) | |
| African American (vs. white) | −2.111*** | −1.645** | −1.657** |
| (−3.64) | (−3.09) | (−3.12) | |
| Hispanic (vs. white) | 0.191 | −0.114 | −0.124 |
| (0.34) | (−0.23) | (−0.24) | |
| Married (0,1) | −0.291 | −0.574 | −0.569 |
| (−0.63) | (−1.37) | (−1.36) | |
| Children in household (0,1) | 0.322 | 0.209 | 0.210 |
| (0.71) | (0.50) | (0.51) | |
| Physically disabled (0,1) | 1.182* | 0.898 | 0.909 |
| (2.14) | (1.79) | (1.82) | |
| Has health insurance (0,1) | −0.383 | −0.384 | −0.395 |
| (−0.55) | (−0.65) | (−0.67) | |
| Health problems up to age 25 | 0.388 | 0.701 | 0.695 |
| (0.70) | (1.44) | (1.43) | |
| Depressive symptoms, ~4 years prior | 0.210*** | 0.156*** | 0.156*** |
| (7.51) | (6.17) | (6.15) | |
| Intercept | 8.460 | 24.668 | 24.638 |
| R-squared | 0.285 | 0.420 | 0.420 |
p<0.05
p<0.01
p<0.001 (two-tail test).
Table 5.
GLS regression of anger symptoms on debt status, economic hardship, socioeconomic status, and controls. Miami Disability Study (n=1,463); slope coefficients and t-statistics.
| (1) | (2) | (3) | |
|---|---|---|---|
| Debtor (0,1) | 0.703** | 0.653** | 0.911*** |
| (2.88) | (2.72) | (3.36) | |
| Economic hardship | 1.375*** | 0.906*** | 1.228*** |
| (5.33) | (3.45) | (3.57) | |
| Sense of mastery | −1.155*** | −1.156*** | |
| (−7.73) | (−7.74) | ||
| Social support, family | −0.027 | −0.021 | |
| (−0.15) | (−0.11) | ||
| Social support, friend | 0.090 | 0.089 | |
| (0.60) | (0.59) | ||
| Debtor x economic hardship | −0.597 | ||
| (−1.35) | |||
| Household income, ln($) | 0.001 | 0.052 | 0.053 |
| (0.01) | (0.56) | (0.57) | |
| Assets, ln($) | −0.032 | 0.033 | 0.025 |
| (−0.38) | (0.40) | (0.31) | |
| Owns home (0,1) | 1.882 | 0.458 | 0.404 |
| (0.79) | (0.21) | (0.19) | |
| Value of home, ln($) | −0.163 | −0.050 | −0.046 |
| (−0.98) | (−0.33) | (−0.30) | |
| Education | −0.036 | −0.025 | −0.024 |
| (−1.18) | (−0.82) | (−0.79) | |
| Unemployed (vs. employed) | 1.376 | 1.175 | 1.179 |
| (1.19) | (1.06) | (1.07) | |
| Retired (vs. employed) | −0.146 | −0.178 | −0.162 |
| (−0.44) | (−0.56) | (−0.51) | |
| Out of labor force (vs. employed) | 0.769 | 0.586 | 0.589 |
| (1.96) | (1.51) | (1.52) | |
| Age | −0.007 | −0.016 | −0.016 |
| (−0.71) | (−1.62) | (−1.63) | |
| Female (0,1) | 0.015 | 0.017 | 0.037 |
| (0.07) | (0.07) | (0.16) | |
| African American (vs. white) | −1.288*** | −1.137*** | −1.163*** |
| (−4.08) | (−3.61) | (−3.69) | |
| Hispanic (vs. white) | −0.168 | −0.289 | −0.310 |
| (−0.56) | (−0.97) | (−1.04) | |
| Married (0,1) | 0.077 | −0.014 | −0.001 |
| (0.30) | (−0.05) | (−0.01) | |
| Children in household (0,1) | 0.627* | 0.599* | 0.603* |
| (2.45) | (2.38) | (2.39) | |
| Physically disabled (0,1) | −0.216 | −0.313 | −0.290 |
| (−0.76) | (−1.12) | (−1.04) | |
| Has health insurance (0,1) | 0.584 | 0.564 | 0.539 |
| (1.62) | (1.61) | (1.54) | |
| Health problems up to age 25 | 0.188 | 0.234 | 0.220 |
| (0.59) | (0.77) | (0.73) | |
| Depressive symptoms, ~4 years prior | 0.272*** | 0.255*** | 0.254*** |
| (8.51) | (7.87) | (7.80) | |
| Intercept | 2.802 | 6.715 | 6.648 |
| R-squared | 0.165 | 0.203 | 0.204 |
p<0.05
p<0.01
p<0.001 (two-tail test).
Measures
Unweighted descriptive statistics for all study measures are in Appendix A.
Depressive symptoms.
We used a 20-item version of the CES-D (Radloff 1977) to assess recent symptoms of depression. Study subjects were asked how often in the past month they experienced feelings such as loneliness, sadness, and hopelessness. The response options included not at all, occasionally, frequently or almost all the time (coded 0 to 3, respectively). Depressive symptoms is equal to the sum of scores across the 20 items (Cronbach’s α = .88).
Feelings of anxiety.
Anxiety is measured with five items that constitute a subset of the 20-item State Anxiety Inventory (Spielberger et al. 1983). Respondents were asked to what extent in the past month they felt over-excited, tense, anxious, nervous, or worried over possible misfortunes. Responses included none, somewhat, moderately, and very much (coded 0 to 3, respectively). The scale of anxiety equals the sum of scores (α = .87).
Anger.
Six items drawn from Petersen and Kellam’s (1977) “How I Feel” instrument assessed recent feelings and expressions of anger. The respondents were asked to what extent the following statements reflected how they felt over the past month: “When I get angry, I stay angry;” “I yell at people;” “I feel like I am boiling inside;” “I lose my temper;” “I feel angry;” and “I get into fights and arguments.” Responses included very much like me (4), much like me (3), somewhat like me (2), not much like me (1), and not like me at all (0), (α =.88). Responses to the six items were summed.
Economic hardship.
A scale was created from four items that asked, “When you think of your financial situation overall, how difficult is it for you to meet the following needs?” where the needs included housing, food, transportation, and medical expenses. Responses to each type of need included not at all difficult (coded 0), somewhat difficult (1), and very difficult (2). When combined into a scale equal to the average of the four responses, Cronbach’s α is .82.
Debtor status.
Respondents were asked if they had “any debts including credit cards, store credit, a mortgage or home equity loan, a car loan or any other loan?” A dummy variable identifies those with any debt (coded 1) versus those with no debt (coded 0).
To examine whether the influence of debt operates through personal and social coping resources, we include measures of mastery and social support.
Mastery.
The scale of mastery is made up of seven questions asking respondents if they agreed or disagreed with statements such as, “What happens to you in the future mostly depends on you” and “You often feel helpless in dealing with problems of life” (Pearlin and Schooler 1978). Responses range from “strongly agree” to “strongly disagree” and are coded such that higher scores indicate more control. Mastery is equal to the average of the seven items (α = .77).
Support.
Social support is assessed with two scales capturing perceived social support from friends and from family (Turner and Marino 1994). Respondents were asked about these relationships, separately for family members and friends, with eight items such as “No matter what happens you know that your [family/friends] will always be there for you should you need them” and “You feel very close to your [family/friends].” Responses included “very true,” (3) “moderately true,” (2) “somewhat true,” (1) and “not at all true” (0). Family support (α = .90) and friend support (α = .95) are equal to the average response for the respective eight items.
Importantly, we control for multiple aspects of economic status to separate out the influence of debt or hardship from objective levels of income or wealth. Economic status is measured in terms of income, assets, and homeownership/home value.
Income.
Respondents were asked to estimate their total household income before taxes, choosing from among 16 categories ranging from none, to $135,000 and above (in Table 1 we combined the two highest categories for low-N reasons). We assigned the midpoint dollar amount based on the 16 categories. In the regression analyses we used logged income.
Assets.
Respondents were asked “Suppose you needed money quickly, and you cashed in all of your checking and savings accounts, your stocks and bonds and real estate (other than your home). If you added up what you got, about how much would this amount to?” Similar to the measure of household income, we assigned midpoint values and transform these by the natural log in the multivariate analyses.
Homeownership and home value.
We identify homeowners with a dichotomous measure (1=owns home), and include a self-reported estimate of the value of the home (respondents were asked how much money they would get for their home if they sold it). We recoded the ordinal response options to category midpoints and transformed them by the natural log. Those who were not homeowners were given a value of zero on the logged measure of home value.
The regression analyses control for education, age (a quadratic term for age was not significant), racial/ethnic status, gender, employment status, health insurance coverage, marital status, physical disability status, presence of dependent children in the household, and prior mental and physical health problems, all of which are potentially associated with current mental health and with debt or economic hardship. The regression models also control for earlier health problems and the lagged value of the dependent variable as assessed in the first wave of the study, around four years earlier. The measure of early health problems is a count of major health problems that occurred before age 26, including physical disability, retrospective diagnoses of childhood conduct disorder or attention deficit or hyperactivity disorder, or having experienced an onset before the age 26 of major depression, generalized anxiety, social phobia, or panic disorders.
Many of these measures, including the three dependent variables, are skewed and it is unlikely these data meet the assumptions of OLS regression. Indeed, a Breusch-Pagan test confirmed that the error variance was nonconstant in OLS regression models. We therefore estimate generalized least squares (GLS) regressions with robust standard errors in Tables 3–5, such that the t-statistics are based on the Huber/White sandwich estimator of the error variance.
Data Strengths and Limitations
The Miami Disability Study is a good match for the theoretical questions being asked for several key reasons. It includes key measures of the stress process model, multiple mental health outcomes measured over time, as well as debt and economic hardship. In addition, the panel design of the study allows us to mitigate potential “social drift” dynamics in the multivariate models (e.g., poor health leading to debt) and make a better case for causality by controlling for early mental and physical health problems. Finally, the sample is both economically and racially diverse, with the former being especially critical to test hypotheses related to the potential buffering effect of debt.
While these strengths are essential for exploring the role of debt in the stress process model, it is also true that limits that should be noted at the outset. First, these data were from the early 2000s. More recent data would be desirable considering all the economic changes and declines of the beginning of the 21st century. Secondly, the measures of income and assets in these data are not exact dollar figures (which subjects often are less willing to provide), but ordinal measures, and the resulting measurement error compromises the degree to which we have controlled for variations in economic status. Third, it would be better to have more detailed measures of debt, and the ability to separate secured liabilities from unsecured liabilities. Mortgages and student debt are means by which individuals seek to secure middle class status, and these may have different emotional impacts than high interest predatory debt like pay-day loans or excessive credit card debt (e.g., Dwyer, McCloud, and Hodson 2012). Since this sample is more disadvantaged economically, it is plausible that these respondents had less debt on average, and the type of debt they are experiencing may be more predatory in nature, and involve higher interest rates. However, the sample also has high levels of homeownership, which may be protective as well. Finally, the sample is not representative of the U.S. or even of Miami-Dade. Due to the oversampling of adults with physical disabilities, the respondents are slightly lower income and somewhat older than the adult population in Miami or U.S. (Brown and Turner 2012: p. 72). It is therefore possible that different results would be obtained from a nationally representative study. While a nationally representative study with more complete measures of debt and economic status would clearly be desirable, we argue that because so little is known about the topic, even limited data teaches us something about how debt is placed in the stress process model.
RESULTS
The first question we ask is whether two money-related stressors—debt and economic hardship—are comparably associated with economic status and mental health. To address the first part of the question, Table 1 presents weighted percents of debtor status and weighted means of economic hardship across the three major indicators of economic status: household income, assets, and home value. Around two-thirds of adults in Miami are in debt (Table 1), and a closer examination of the data (analyses not shown) revealed that indebtedness was more common among younger adults, married adults with kids and those without physical disabilities; indebtedness did not vary significantly by gender or by race/ethnicity. The results also show that both debt and economic hardship vary by economic status, but in opposite directions. As one moves up the economic ladder, the percent of those with debt generally increases and the average level of hardship decreases. At the same time, debt varies less than economic hardship, or debt is more evenly spread across households than is the experience of having trouble paying bills. This observation is corroborated by simple bivariate correlations of economic status with debt and economic hardship: the correlations of debt with income, assets, and home value are +.15, +.06, and +.17, respectively; the corresponding bivariate correlations with economic hardship are −.23, −.34 and −.30 (all significant at p < .05). Thus, debt and economic strain are not comparable in that they relate differently to economic status. Debt is weakly and positively associated with income, assets, and home value, while economic hardship is negatively and more strongly associated with economic status. Further evidence that debt and economic hardship are distinct lies in the fact that they are not significantly correlated with each other (r = −0.02; p > .05).
Debt and economic strain are more comparable in terms of being associated with poorer mental health. Table 2 reports average levels of depressive symptoms, anxiety and anger by debtor status and four levels of economic strain. Adults who report being in debt and who have greater economic hardship report significantly more anxiety and anger. The results for depressive symptoms are mixed: economic strain is predictive of more symptoms of depression, but being in debt is not. Additional analyses confirmed there is a positive association between debt and depressive symptoms, but it is suppressed by socioeconomic status—SES is positively associated with debt and negatively associated with depressive symptoms.
As before, economic hardship is more strongly associated with mental health. The bivariate correlations between hardship and depressive symptoms, anxiety, and anger are +.40, +.21, and +.28, respectively, while the same correlations with debtor status are only −.02, +.08, and +.07. At the bivariate level, debt and hardship are dissimilar, and debt is a weaker predictor of mental health.
To sum, the results so far indicate that both debt and economic hardship are money-related stressors, though economic hardship appears more consequential for mental health. The multivariate analyses (Tables 3 through 5) assess the net association between debt and mental health in the presence of rigorous statistical controls, and consider three possible pathways for debt in the stress process model. Model 1 measures the association between debt and mental health net of controls and economic hardship, and implies a direct effect of debt. The analyses next test whether the link between debt and mental health is mediated by mastery and social support (Model 2). Finally, the third model adds a “debt x economic hardship” interaction term to ascertain if the negative association between economic hardship and mental health is buffered by debt—in other words, the idea that debt is a financial resource that (temporarily) buffers disadvantaged individuals from the distress of economic hardship. These analyses are reported for depressive symptoms, anxiety, and anger in Tables 3, 4, and 5, respectively.
Table 4.
GLS regression of anxiety symptoms on debt status, economic hardship, socioeconomic status, and controls. Miami Disability Study (n=1,463); slope coefficients and t-statistics.
| (1) | (2) | (3) | |
|---|---|---|---|
| Debtor (0,1) | 0.590*** | 0.552*** | 0.526** |
| (3.69) | (3.56) | (2.98) | |
| Economic hardship | 1.207*** | 0.868*** | 0.835*** |
| (6.46) | (4.58) | (3.35) | |
| Sense of mastery | −0.911*** | −0.911*** | |
| (−9.12) | (−9.11) | ||
| Social support, family | 0.002 | 0.002 | |
| (0.01) | (0.01) | ||
| Social support, friend | −0.063 | −0.063 | |
| (−0.62) | (−0.62) | ||
| Debtor x economic hardship | 0.062 | ||
| (0.19) | |||
| Household income, ln($) | 0.020 | 0.059 | 0.059 |
| (0.26) | (0.82) | (0.82) | |
| Assets, ln($) | −0.045 | 0.003 | 0.004 |
| (−0.82) | (0.06) | (0.07) | |
| Owns home (0,1) | 0.504 | −0.643 | −0.637 |
| (0.31) | (−0.39) | (−0.39) | |
| Value of home, ln($) | −0.041 | 0.049 | 0.048 |
| (−0.36) | (0.41) | (0.41) | |
| Education | −0.037 | −0.030 | −0.030 |
| (−1.82) | (−1.51) | (−1.52) | |
| Unemployed (vs. employed) | −0.114 | −0.233 | −0.234 |
| (−0.19) | (−0.39) | (−0.39) | |
| Retired (vs. employed) | −0.280 | −0.322 | −0.324 |
| (−1.28) | (−1.51) | (−1.51) | |
| Out of labor force (vs. employed) | 0.831** | 0.704** | 0.704** |
| (2.94) | (2.59) | (2.59) | |
| Age | −0.007 | −0.014* | −0.014* |
| (−1.17) | (−2.22) | (−2.22) | |
| Female (0,1) | −0.018 | −0.015 | −0.017 |
| (−0.11) | (−0.09) | (−0.11) | |
| African American (vs. white) | −0.927*** | −0.831*** | −0.828*** |
| (−4.46) | (−4.09) | (−4.09) | |
| Hispanic (vs. white) | 0.298 | 0.243 | 0.245 |
| (1.36) | (1.15) | (1.16) | |
| Married (0,1) | 0.121 | 0.079 | 0.078 |
| (0.66) | (0.45) | (0.45) | |
| Children in household (0,1) | −0.055 | −0.072 | −0.072 |
| (−0.32) | (−0.43) | (−0.43) | |
| Physically disabled (0,1) | 0.284 | 0.221 | 0.218 |
| (1.39) | (1.10) | (1.09) | |
| Has health insurance (0,1) | 0.515* | 0.508* | 0.510* |
| (2.10) | (2.17) | (2.18) | |
| Health problems up to age 25 | 0.122 | 0.173 | 0.175 |
| (0.58) | (0.85) | (0.86) | |
| Depressive symptoms, ~4 years prior | 0.151*** | 0.121*** | 0.121*** |
| (5.10) | (4.15) | (4.15) | |
| Intercept | 1.763 | 5.036 | 5.044 |
| R-squared | 0.173 | 0.222 | 0.222 |
p<0.05
p<0.01
p<0.001 (two-tail test).
The results across these three mental health outcomes consistently show deleterious emotional consequences of debt and economic hardship as manifested in poorer mental health. In Model 1 (direct effect pathway), adults in debt have elevated levels of depressive symptoms, anxiety and anger, with a magnitude of around .9 to .6 (or, .1 to .15 standard deviations) relative to debt-free adults. Economic hardship has an independent association with mental health, and one that is more consequential than debt’s. Standardized regression coefficients from Model 1 confirm that economic hardship is more strongly related to mental health than debt. Further, post-estimation tests using the results from Model 1 indicated that the slope for economic hardship is significantly greater than the slope for debtor status in Table 3 (depressive symptoms, p < .001), Table 4 (anxiety, p = .007), and Table 5 (anger, p = .042). These results confirm that debt, like economic hardship, operates as a stressor in the stress process model and is associated with lower levels of adult emotional well-being. However, debt is less harmful than economic strain.
Though debt and hardship have independent effects with mental health, they are not equally mediated by personal and social resources. According to Model 2 (indirect or mediation pathway), adult mental health is boosted by personal mastery, but does not significantly benefit from a perception of being supported by one’s family and friends (after accounting for a rigorous set of controls). This appears to explain a considerable portion of the association between economic hardship and mental health, as the coefficient for hardship decreases by around one-third once associated differences in mastery are held constant. Based on the results of Sobel-Goodman mediation tests, the effect of economic hardship on depression, anxiety, and anger is significantly mediated by mastery (p < .001 in each case). These tests indicate that mastery accounts for around 38% of economic hardship’s association with depression, 28% of the association with anxiety, and 33% of its association with anger. In contrast, none of the Sobel-Goodman mediation tests was significant for debt. Neither mastery nor social support mediate a significant amount of the association between debt and mental health. Thus, the negative emotional costs of debt are not the same as those of economic strain.
The last potential role of debt to be considered is whether it acts as a buffer against the stress of economic hardship, such as when families place unexpected medical expenses on a credit card/or use “care” credit. The results in Model 3 (buffering or moderation pathway) provide no support for this hypothetical role of debt. Economic hardship diminishes mental health for debtors and non-debtors alike. Another related possibility is that the mental health costs of economic hardship or debt may be smaller for those with greater access to income or wealth, or for those advantaged by greater personal and social resources. For example, Mirowsky and Ross (2001) found that the mental health consequences of economic hardship were smaller for older adults who had a wage income. There is also no evidence of this in the Miami Disability Study—the association between debt and mental health does not vary across levels of household income, home value, or assets, nor does it vary by level of mastery or social support (results available upon request).
In summary, the multivariate results indicate that both economic hardship and debt are independent risk factors for mental health problems among adults, in addition to the broad influences of socioeconomic status, employment status, various socio-demographic factors, and prior mental and physical health problems. Both put adults at higher risk of depression, anxiety, and anger, but economic hardship has a stronger relationship with mental health than does debt (as measured in this study). Debt deviates from economic hardship in that it is more common among economically advantaged adults and is less mediated by a sense of personal mastery. And debt does not buffer the harmful consequences of economic hardship for mental health.
DISCUSSION
Debt in the U.S. has risen to where most adults are debtors, and multiple forms of debt have reached unprecedented levels: more than one trillion in student loans, around eight trillion in home mortgages, and nearly a trillion in credit card debt (Federal Reserve Bank of NY 2014). The mental health implications of this trend are not fully understood, reflecting a more general lack of sociological research examining the implications of debt for social stratification (Keister and Lee 2014: p.18). In the Miami Disability Study, debt was common across all economic groups except perhaps the very poorest, and it was somewhat more common among the most economically-advantaged groups. This is similar to recent evidence showing that even low and middle-income people have access to credit and carry debt (Mann 2009). It also supports prior research that shows one needs to have some level of income base to be eligible for greater debt opportunity (Dwyer, McCloud and Hodson 2011; Mann 2009; Schor 1998). The major goals of this paper were first to contrast debt and economic hardship as two money-related stressors, and second to consider various potential ways vis-à-vis the stress process model that debt might be related to mental health, thereby bring into sharper focus the mental health implications of an increasingly indebted society.
Regarding the first question, debt and economic hardship are conceptually distinct. This supports prior research that shows debt has a significant effect on mental health not attributable to income or wealth (Drentea and Reynolds 2012). In the stress process model, neither debt nor economic hardship is conceptually prior to other aspects of socioeconomic status. Both predict mental health outcomes and are money-related, and thus are important for capturing the broad reach of socioeconomic status (Lahelma et al. 2006) and in considering what it is exactly about finances—e.g., being unable to afford necessities or feeling dependent on impersonal, for-profit banking institutions—that is most consequential in the stress process model (Thoits 1995). Both are daily stressors that are associated with mental health (Pearlin 1989). Debt is more common among those with greater income; economic hardship with those with lower income, and both are associated with distress. Wanting or needing high-priced items such as homes, cars, education, medical care, and luxury goods may add to distress via debt. Wanting and needing to cover basic expenses, (i.e. economic hardship), indicated even more distress, which makes sense as it helps draw a line between objective need versus subjective need—and objective need is worse for mental health.
Regarding the second question, debt’s status in the stress process model is that of a social stressor that is positively associated with socioeconomic status and that reduces mental health (1. Direct effect pathway in figure 1). In contrast, mastery is an important mechanism linking economic hardship to well-being (2. Indirect pathway), which is similar to other work in the area (Pudrovska et al. 2005). Furthermore, debt was not protective against the stress of economic hardship (no support for pathway 3). How do these results relate back to the notion of SES being a fundamental cause of health? Since debt neither buffered the distress associated with economic hardship, nor was debt’s mental health impact lessened by having higher incomes, we conclude that debt is at best a flawed coping resource and one that does not contribute meaningfully to the ability of advantaged populations to maintain their health advantage.
Perhaps with better measures of debt, future research might reveal that some types of debt do influence mental health through mastery or social support. Debt that potentially improves one’s life such as student loans or buying a home may improve a sense of mastery. It also seems plausible that more predatory forms of debt such as payday loans, which are more common among lower SES groups, would be harmful to a sense of mastery. Debt due to a health crisis is always stressful. Such research, in the tradition of stress process theory, could reveal how the social meanings of debt shape its consequences, and extend this line of work further.
We do not find support for the idea that debt may buffer economically disadvantaged groups by providing a stop-gap means to cover costs related to housing, food, transportation, or health care. This “unmoderated” effect of debt is potentially at odds with Dwyer et al.’s (2011) conclusion that “young debtors experience debt as empowering – as increasing their sense of mastery and self-esteem and thus their sense of having prepared themselves to meet the future” (p. 738). We found no evidence of subgroups who benefit emotionally from indebtedness. This is perhaps because we address these questions in a sample of middle-aged and older adults, and Dwyer et al. (2011) found that debt only improved self-esteem and mastery among the youngest adults in their sample (Dwyer, McCloud and Hodson 2011). Future research should thus not only explore whether type of debt matters, but whether stage of the life course matters as well.
A related topic for future study is the phenomenon of intergenerational coping. The economic downturn of the late 2000s and the tightening of credit led some younger adults and their older parents to pool resources, and live in multi-generational households (Parker 2012). Carefully parsing out types of debt would be very helpful in understanding what is stressful. Types of debt vary by socioeconomic status, which can ultimately lead to different mental health outcomes. Car loans and educational loans carry different meaning than charging on a department store card. Medical procedure debt and health care expenditures will likely be more closely tied to mental disorder and disease. Finally, pay-day loans and title loans businesses are exploding in many states in the United States (and are outlawed in other states), and are more frequently used by young, low-SES groups and military personnel. Interest rates are extremely high for these loans, and this is phenomenon we know little about (Drentea 2014). Future debt studies must do a better job in assessing the different types of debt, and how they vary by socioeconomic status, as well as how they may vary in mental health outcomes.
In terms of debt’s place in the stress process model, we conclude that debt is a unique money-related stressor, distinct in that it is associated with socioeconomic advantage rather than disadvantage. An important implication of this finding is that the SES-mental health gradient may be underestimated if debt is not taken into account (Drentea and Reynolds 2012). Indebtedness is also a unique stressor because it does not appear to work through diminishing perceptions of personal control. But what makes debt distinct from other money-related stressors such as economic hardship? One promising theoretical direction is to consider the relational aspect of indebtedness. Being a debtor implies obligation, dependence, an asymmetric relationship, and relational power asymmetry undermines mental health (Mirowsky 1985). It is perhaps for this reason that debt is more directly associated with mental health (less mediated by mastery) than economic hardship. Whether this is equally true for those with smaller, rather than larger, debt balances remains an issue for future research. Stress process researchers should seek to account for the timely issue of debt, so we can better understand modern mental health issues.
Sociologists, economists and government officials, among others, are rightfully alarmed by rising levels of inequality, both in terms of the consequences for mobility and the possibilities for slowing or reversing the trend (Dwyer 2010; Keister and Lee 2014; Schor 1998; Sullivan 2009; Sullivan, Warren and Westbrook 2000). Debt must feature in this research agenda, and we argue debt also should feature more prominently in stress process research.
Supplementary Material
Footnotes
Since those lost to attrition had poorer mental health and lower economic status in the first wave, we reran the models in Tables 3–5 and included a Heckman-type correction for attrition bias (see Mirowsky and Ross 2001). The results did not differ appreciably, and the coefficient for hazard of attrition was never statistically significant.
Contributor Information
Patricia Drentea, Department of Sociology, University of Alabama-Birmingham, HHB 460, 1720 2nd Ave S, Birmingham, AL 35294-1152, Phone: 205-934-2562.
John R. Reynolds, Pepper Institute on Aging and Public Policy, Florida State University, 636 W. Call St, PCB #207, Tallahassee, FL 32306-1121, Phone: 850-644-8825
REFERENCES
- Blank Rebecca M. and Barr Michael S.. 2009. Insufficient Funds: Savings, Assets, Credit and Banking among Low-Income Households NY: Russell Sage Foundation. [Google Scholar]
- Bricker Jesse, Kennickell Arthur B., Moore Kevin B., and Sabelhaus John. 2012. “Changes in U.S. Family Finances from 2007 to 2010: Evidence from the Survey of Consumer Finances.” Federal Reserve Bulletin 98(2). [Google Scholar]
- Brown Sara, Taylor Karl, and Stephan Wheatley Price. 2005. “Debt and distress: Evaluating the psychological cost of credit.” Journal of Economic Psychology 26: 642–663. [Google Scholar]
- Brown Robyn L. and Jay Turner R. 2013. “Physical Limitation and Anger: Stress Exposure and Assessing the Role of Psychosocial Resources.” Society and Mental Health 2(2): 69–84. [Google Scholar]
- Butterworth Peter, Rodgers Bryan and Windsor Tim D.. 2009. “Financial Hardship, Socio-Economic Position and Depression: Results from the PATH through Life Survey.” Social Science & Medicine 69(2): 229–237. [DOI] [PubMed] [Google Scholar]
- Drentea Patricia. 2000. “Age, Debt and Anxiety.” Journal of Health and Social Behavior 41: 437–450. [PubMed] [Google Scholar]
- Drentea Patricia. 2014. “Debt and Health in the South.” Southern Sociological Society meeting Charlotte, NC. [Google Scholar]
- Drentea Patricia and Lavrakas Paul J.. 2000. “Over the Limit: The Association among Health Status, Race and Debt.” Social Science & Medicine 50: 517–529. [DOI] [PubMed] [Google Scholar]
- Drentea Patricia and Reynolds John R.. 2012. “Neither a Borrower nor a Lender Be: The Relative Importance of Debt and SES for Mental Health among Older Adults.” Journal of Aging and Health 24: 673–695. [DOI] [PubMed] [Google Scholar]
- Dwyer Rachel E. 2010. “Poverty, Prosperity, and Place: The Shape of Class Segregation in the Age of Extremes.” Social Problems 57(1): 114–137. [Google Scholar]
- Dwyer Rachel E., McCloud Laura and Hodson Randy. 2011. “Youth Debt, Mastery, and Self-Esteem: Class-Stratified Effects of Indebtedness on Self-Concept. Social Science Research 40: 727–741. [Google Scholar]
- Federal Reserve Bank of NY. 2014. “Quarterly Report on Household Debt and Credit” Retrieved from http://www.ny.frb.org/householdcredit/2013-Q4/HHDC_2013Q4.pdf on April 30, 2014.
- Heflin Colleen, Sandberg John and Rafail Patrick. 2009. “The Structure of Material Hardship in U.S. Households: An Examination of the Coherence behind Common Measures of Well-Being. Social Problems 56(4): 746–764. [Google Scholar]
- Kahn Joan R. and Pearlin Leonard I.. 2006. “Financial Strain over the Life Course and Health among Older Adults” Journal of Health and Social Behavior 47:17–31. [DOI] [PubMed] [Google Scholar]
- Keister Lisa A. and Young Lee Hang. 2014. “The One Percent: Top Incomes and Wealth in Sociological Research.” Social Currents 1(1): 13–24. [Google Scholar]
- Lahelma Eero, Laaksonen Mikko, Martikainen Pekka, Rahkonen Ossi, and Sarlio-Lähteenkorva Sirpa. 2006. “Multiple Measures of Socioeconomic Circumstances and Common Mental Disorders.” Social Science & Medicine 63:1383–1399. [DOI] [PubMed] [Google Scholar]
- Link Bruce G. and Phelan Jo. 1995. “Social Conditions as Fundamental Causes of Disease.” Journal of Health and Social Behavior, Extra Issue:80–94. [PubMed] [Google Scholar]
- Mann Robert J. 2009. “Patterns of Credit Card Use Among Low- and Moderate-Income Households” Pps. 257–284 in Blank, Rebecca M and Barr Michael S.. Insufficient Funds: Savings, Assets, Credit and Banking among Low-Income Households NY: Russell Sage Foundation. [Google Scholar]
- Manturuk Kim, Riley Sarah and Ratcliffe Janneke. 2012. “Perception vs. reality: The relationship between low-income homeownership, perceived financial stress, and financial hardship.” Social Science Research 41:276–286. [DOI] [PubMed] [Google Scholar]
- McCloud Laura and Dwyer Rachel E.. 2011. “The Fragile American: Hardship and Financial Troubles in the 21st Century.” The Sociological Quarterly 52: 13–35. [Google Scholar]
- Meltzer H, Bebbington P, Brugha T, Jenkins R, McManus S, and M.S. Dennis MS 2011. “Personal debt and suicide ideation.” Psychological Medicine 41: 771–778. [DOI] [PubMed] [Google Scholar]
- Mimura Yoko. 2008. “Housing Cost Burden, Poverty Status, and Economic Hardship among Low-Income Families.” Journal of Family and Economic Issues 29(1): 152–165. [Google Scholar]
- Mirowsky John. 1985. “Depression and marital power: An equity model.” American Journal of Sociology 91(3): 557–592. [Google Scholar]
- Mirowsky John and Ross Catherine E., 1999. “Economic Hardship across the Life Course.” American Sociological Review 64(4): 548–569. [Google Scholar]
- Mirowsky John and Ross Catherine E.. 2001. “Age and the Effect of Economic Hardship on Depression.” Journal of Health and Social Behavior 42(2): 132–150. [PubMed] [Google Scholar]
- Munster E, Ruger H, Ochsmann E, Letzel S, & Toschke AM (2009). “Over-Indebtedness as a marker of socioeconomic status and its association with obesity: a cross-sectional study.” BMC Public Health 9: 286–291. [DOI] [PMC free article] [PubMed] [Google Scholar]
- O’Neill Barbara, Prawitz Aimee, Sorhaindo Benoit, Kim Jinhee, and Thomas Garman E. 2006. “Changes in Health, Negative Financial Events, and Financial Distress/Financial Well-Being for Debt Management Program Clients.” Financial Counseling and Planning 17: 46–63. [Google Scholar]
- Parker Kim. 2012. “The Boomerang Generation: Feeling OK about Living with Mom and Dad” Pew Research Center http://www.pewsocialtrends.org retrieved April 22, 2014.
- Pearlin Leonard I. 1989. “The Sociological Study of Stress.” Journal of Health and Social Behavior 30:241–56. [PubMed] [Google Scholar]
- Pearlin Leonard I. and Schooler Carmi. 1978. “The Structure of Coping.” Journal of Health and Social Behavior 19: 2–21. [PubMed] [Google Scholar]
- Petersen Anne C. and Kellam Sheppard G.. 1977. “Measurement of the Psychological Well-Being of Adolescents: The Psychometric Properties and Assessment Procedures of the ‘How I Feel.’” Journal of Youth and Adolescence 6: 229–47. [DOI] [PubMed] [Google Scholar]
- Phelan Jo C., Link Bruce G., and Tehranifar Parisa. 2010. “Social Conditions as Fundamental Causes of Health Inequalities: Theory, Evidence, and Policy Implications.” Journal of Health and Social Behavior 51: S28–S40. [DOI] [PubMed] [Google Scholar]
- Pudrovska Tetyana, Schieman Scott, Pearlin Leonard and Nguyen Kim. 2005. “The Sense of Mastery as a Mediator and Moderator in the Association between Economic Hardship and Health in Late Life.” Journal of Aging and Health 17(5): 634–660. [DOI] [PubMed] [Google Scholar]
- Radloff Lenore. (1977) The CES-D scale: a self report depression scale for research in the general population. Applied Psychological Measurement, 1: 385–340. [Google Scholar]
- Reading Richard and Reynolds Shirley. 2001. “Debt, Social Disadvantage, and Maternal Depression.” Social Science & Medicine 53: 441–453. [DOI] [PubMed] [Google Scholar]
- Reynolds John R. and Jay Turner R. 2008. “Major Life Events, Their Personal Meaning, Resolution, and Mental Health Significance.” Journal of Health and Social Behavior 49: 223–237. [DOI] [PubMed] [Google Scholar]
- Ross Catherine E., and Huber Joan. 1985. “Hardship and Depression.” Journal of Health and Social Behavior 26: 312–327. [PubMed] [Google Scholar]
- Royston Patrick. 2004. “Multiple Imputation of Missing Values.” Stata Journal 4: 227–241. [Google Scholar]
- Schor Juliet B. 1998. The Overspent American: Why We Want What We Don’t Need NY: Harper Perennial. [Google Scholar]
- Spielberger Charles D., Gorsuch Richard L., Lushene Robert E., Vagg Peter R., and Jacobs Gerard A.. 1983. “Manual for the State-Trait Anxiety Inventory” Palo Alto, CA: Consulting Psychologists Press. [Google Scholar]
- Sullivan Teresa A., Warren Elizabeth, and Westbrook Jay L.. 2000. The Fragile Middle Class: Americans in Debt New Haven, CT: Yale University Press. [Google Scholar]
- Sullivan Teresa. 2009. “Consumer Indebtedness and the Withering of the American Dream.” Pathways. Winter Stanford Center for the Study of Poverty and Inequality. [Google Scholar]
- Thoits Peggy. 1995. “Stress, Coping and Social Support Processes: Where Are We? What Next?” Journal of Health and Social Behavior 35(Extra Issue): 53–79. [PubMed] [Google Scholar]
- Turner RJ 2013. “Understanding Health Disparities: The Relevance of the Stress Process Model.” Society and Mental Health 3(3): 170–186. [Google Scholar]
- Turner R. Jay and Marino Ralph. 1994. “Social Support and Social Structure: A Descriptive Epidemiology.” Journal of Health and Social Behavior 35: 193–212. [PubMed] [Google Scholar]
- U.S. Department of Education. 2014. “Federal Student Aid Portfolio Summary” Retrieved April 29, 2014, from http://studentaid.ed.gov/about/data-center/student/portfolio.
- Young Marisa and Schieman Scott. 2012. “When Hard Times Take a Toll: The Distressing Consequences of Economic Hardship and Life Events within the Family-Work Interface.” Journal of Health and Social Behavior 53(1): 84–98. [DOI] [PubMed] [Google Scholar]
Associated Data
This section collects any data citations, data availability statements, or supplementary materials included in this article.