Abstract
Osteosarcoma (OS) is the most commonly diagnosed bone tumor in young people with poor prognosis. At present, the mechanisms underlying tumorigenesis in OS are not well understood. The methionine adnosyltransferase 2B (MAT2B) gene encodes the regulatory subunit of methionine adenosyltransferase (MAT). Recent studies demonstrated that it is highly expressed in a number of human malignancies; however, is undefined in OS. In the present study, MAT2B expression was investigated in tumor samples and cell lines. In vivo and in vitro, lentivirus-mediated small hairpin RNA was constructed to target the MAT2B gene and examine the role of MAT2B in OS proliferation. Microarray analysis was performed to examine the possible downstream molecular target of MAT2B in OS. MAT2B was markedly increased in OS specimens compared with the normal bone tissues, and it was additionally abundantly expressed in OS cell lines. Inhibition of MAT2B expression caused a marked decrease in proliferation and significant increase in apoptosis. In vivo, MAT2B silencing significantly inhibited OS cell growth. Microarray analysis suggested that epidermal growth factor receptor (EGFR) and proliferating cell nuclear antigen (PCNA) may function as downstream targets of MAT2B in OS, as confirmed by reverse transcription-quantitative polymerase chain reaction assays and western blotting. Collectively, these results suggested that MAT2B serves a critical role in the proliferation of OS by regulating EGFR and PCNA and that it may be a potential therapeutic target and prognostic factor of OS.
Keywords: MAT2B, tumorigenesis, proliferation, apoptosis
Introduction
Osteosarcoma (OS) is the primary malignant bone tumor in adolescents and young adults. In recent years, the 5-year survival of patients with localized OS has remained at 60-70% due to multi-agent chemotherapy and surgical techniques (1). Treatment, including neoadjuvant chemotherapy followed by complete surgical resection, aims to decrease the risk of metastasis and relapse, and prolong the course of adjuvant chemotherapy (2). However, over the last three decades, there have been no noticeable improvements in the survival of patients with metastasis or disease relapse (3), and the precise molecular mechanisms involved in the tumorigenesis of OS remain poorly understood. Methionine adenosyltransferase (MAT) is a critical enzyme that serves as a vital biological methyl donor (4). It has important functions, including trans-sulfuration, transmethylation and poly-amine synthesis. MATs are composed of three isoforms (MATI, MATII and MATIII). MATI and MATIII are primarily observed in the liver and are encoded by MAT1A (5). MATII, encoded by MAT2A and MAT2B, is usually expressed in the fetal liver and other tissues (6). In a previous study, Yang et al (7) identified that MAT2B encodes two dominant splicing variants, V1 and V2.
MAT2B encodes a regulatory subunit that is physically associated with the MAT2A dimer, forming a tetramer. Subsequent to MAT2B binding with the MAT2A dimer, it lowers the apparent Km value of MAT2A for methionine and adenosine triphosphate, additionally increasing the enzymatic activity of MAT2A (8). Furthermore, MAT2B is able to prevent degradation of MAT2A by autophagy and proteasome-mediated processes (9).
Previous studies demonstrated that MAT2B has a number of functions, which are associated with the tumorigenesis of cancer, including hepatocellular carcinoma, colon cancer and malignant melanoma (10-12). In liver and colon cancer, MAT2B interacted with GIT ArfGAP1 and formed a scaffold to regulate Ras/Raf/dual specificity mitogen-activated protein kinase kinase 1/2 activity and thus promoted cell growth and tumorigenesis (10). In melanoma, MAT2B knockdown led to growth inhibition by upregulating pro-apoptotic and downregulating anti-apoptotic gene expression in vitro and in vivo (11). MAT2B additionally interacts with ELAV-like protein 1, an mRNA-binding protein that stabilizes the mRNA of a number of cyclins, to affect tumor cell proliferation and apoptosis (12). These previous studies suggested that MAT2B may serve as an oncogene in tumorigenesis via the regulation of numerous key downstream targets. However, the effect of MAT2B in human OS remains unknown.
Materials and methods
Tumor cell lines and culture
U-2OS cells were purchased from Chinese Academy of Sciences (Shanghai, China). MNNG/HOS, MG-63 and Saos-2 cells were obtained from The American Type Culture Collection (Manassas, VA, USA). The genotype and phenotype of each cell line were authenticated by the respective source companies. Saos-2 cells were cultured in McCoy’s 5A medium (Gibco; Thermo Fisher Scientific, Inc., Waltham, MA, USA) supplemented with 10% fetal bovine serum (FBS; cat. no. VS500T; Ausbian; Vian-Saga Company, Shanghai, China). MNNG/HOS cells were cultured in RPMI-1640 (Invitrogen; Thermo Fisher Scientific, Inc.) supplemented with 10% FBS. U-2OS cells were maintained in high-glucose Dulbecco’s modified Eagle’s medium (Invitrogen; Thermo Fisher Scientific, Inc.) supplemented with 10% FBS and 1% penicillin and streptomycin. MG-63 cells were cultured in RPMI-1640 supplemented with 10% FBS (Wisent, Inc.), 100 µg/ml penicillin and 100 µg/ml streptomycin. The cells were maintained at 37°C in 5% CO2 and passaged every 3-5 days.
Immunohistochemistry
A total of 102 formalin-fixed paraffin-embedded samples were collected, including 80 OS samples and 22 normal bone tissue samples. Written informed consent was originally obtained from the patients. The Ethics Committee of Tongxu County People’s Hospital (Kaifeng, China) approved the use of the human tissue samples. The samples were purchased from Xi’an Alena Biotechnology Co., Ltd. (Xian, China) and examined by hematoxylin and eosin staining. Paraffin-embedded tissue sections were used for examination of MAT2B. The paraffin-embedded tissue sections (4 µm in thickness) were deparaffinized with xylene and rehydrated in serially diluted alcohol solutions. Microwave heating at 60°C was performed for antigen retrieval. Endogenous peroxidase was blocked by incubation in 0.3% hydrogen peroxide at room temperature. Subsequently, the slides were incubated with primary antibodies against MAT2B (1:50; Abcam, Cambridge, UK; cat. no. ab109484) overnight at 4°C, followed by incubation with secondary antibodies (1:50; Abcam; cat. no. ab109484) labeled with biotin (1:50; Abcam; cat. no. ab109484) for 10 min at room temperature. Following four washes with Tris-buffered saline, all slides were stained with Vulcan Fast Red and diaminobenzidine for 5 min at room temperature, followed by counterstaining with hematoxylin for 30 sec at room temperature. In total, two pathologists were given a double-blind screening with unknown tumor grade. A total of 10 fields were randomly observed under an inverted fluorescence microscope (magnification, ×100-400; xds-100; Shanghai Cai Kang Optical Instrument Co., Ltd., Shanghai, China). For each case, and the percentage of positive cells under the microscope and the staining intensity were evaluated. This was a two-step protocol (13). Staining intensity was classified as: i) 0 (negative); ii) 1 point (I, low); iii) 2 points (II, medium); and iv) 3 points (III, high). Positive staining rate (staining percentage score) was evaluated on a scale from 0 to 4 as: i) 0 (negative, 0%); ii) 1 point (1-25%); ii) 2 points (26-50%); iii) 3 points (51-75%); and iv) 4 points (76-100%). ‘MAT2B final score’ was calculated as the combination of the ‘staining intensity score’ and the ‘staining percentage score’. The samples were divided into two groups according to these two standards: Lower (total score <6 points) and higher (total score >6 points) expression.
MAT2B short hairpin RNA (shRNA) design and lentivirus construction
Double-stranded MAT2B-targeted shRNA (5×10⁸ TU/ml) sequences (5′-AGTTCATCACATCATTCAT-3′) were synthesized and cloned into the lentivirus-based pGV115 vector with AgeI/EcoRI sites by Shanghai Generay Biotech Co., Ltd. (Shanghai, China). The negative control lentiviral vector (5′-TTCTCCGAACGTGTCACGT-3′), which shared no homology with any known human genes, was generated. For lentivirus transduction, cells were seeded in 6-well plates at 2×10⁵ cells/well. Subsequently, the lentivirus (Shanghai GeneChem Co., Ltd., Shanghai, China; 2×10⁶ TU) was added to achieve a multiplicity of infection of 10. After 72 h, cells were observed under a f luorescence microscope (magnification, ×100) and demonstrated an infective effect >80%. Subsequently, the cells were harvested for the following experiments.
Reverse transcription-quantitative polymerase chain reaction (RT-qPCR)
Total RNA was extracted and purified using TRIzol® reagent (Invitrogen; Thermo Fisher Scientific, Inc.) according to the manufacturer’s protocol. RT was performed using M-MLV reverse transcriptase (Promega Corporation, Madison, WI, USA) and Oligo dT primers (Guangzhou RiboBio Co., Ltd., Guangzhou, China) to obtain cDNA for 10 min at 70°C. The cycling parameters were 95°C for a 30 sec hot start followed by 40 cycles of 95°C for 5 sec and 60°C for 30 sec. MAT2B mRNA expression was measured with RT-qPCR using SYBR master mixture (Takara Biotechnology Co., Ltd., Dalian, China) on a Real-Time PCR machine TP800 (Takara Bio, Inc., Otsu, Japan). Primers used were as follows: GAPDH: forward, 5′-TGACTTCAACAGCGACACCCA-3′, reverse, 5′-CACCCTGTTGCTGTAGCCAAA-3′; MAT2B: forward, 5′-ACAGAGAGGAAGACATACCAG-3′, reverse, 5′-GTTCA TTGCCAGACCAGTG-3′. The relative MAT2B expression was normalized to that of GAPDH, and data analysis was conducted using the comparative Cq method. The cycling parameters included an initiation step at 95°C for 30 sec followed by 40 cycles of 95°C for 5 sec and 60°C for 30 sec. The primer sequences were obtained from Guangzhou RiboBio Co., Ltd. The relative mRNA expression (MAT2B/GAPDH) was determined using the 2−ΔΔCq method, ΔCq = Cq of target gene - Cq of GAPDH and ΔΔCq = average Cq of negative control group - Cq of each sample (14).
Cell proliferation evaluation by an MTT assay
Thymidine incorporation was examined to measure DNA synthesis and cell proliferation, and an MTT assay was used to evaluate cell viability. U-2OS and MNNG/HOS cells were seeded in 96-well plates at a density of 2×10³ cells/well and incubated at 37°C for 5 days. The cells were tested when ~85% confluence was reached on the 5th day. The cells were washed twice with PBS, and MTT solution (5 mg/ml) was added. Dimethly sulfoxide was used to dissolve the purple formazan. The absorption at 490 nm was obtained and the viability of cells treated with LV-shMAT2B was compared with the controls.
Cell count
Additionally, the proliferation of U-2OS cells was evaluated by counting the number of viable cells with Celigo (Nexcelom Bioscience, Lawrence, MA, USA). Cells were seeded at 1,500 cells/well in 96-well plates and incubated at 37°C with 5% CO2. Each group was prepared in triplicate. From the second day, images of cells with green fluorescent protein (GFP) were taken and cells were counted each day using Celigo (Nexcelom Bioscience). Cell growth was observed continuously for 5 days, and cell growth curves were generated.
Caspase-3/7 apoptosis assay
Annexin V-APC apoptosis detection kit (eBioscience™; Thermo Fisher Scientific, Inc.) was used for cell apoptosis analysis, according to the manufacturer’s protocol. MNNG/HOS and U-2OS cells were infected with lentivirus expressing MAT2B or scrambled shRNA. After incubation for 3 days, the cells achieved ~80% confluence and apoptosis was induced. The cells were harvested on the 5th day, washed with D-Hank’s solution, and resuspended using 200 µl binding buffer. Subsequently, 10 µl Annexin V-APC was added to the cell suspension and incubated at room temperature for 10-15 min in the dark. Based on the cell numbers, 400-800 µl binding buffer was added to the cells. Signals were detected by fluorescence-activated cell sorting (FACS) using a FACSCalibur (BD Biosciences, Franklin Lakes, NJ, USA). The result was recorded and analyzed in Excel (version 2013; Microsoft Corporation, Redmond, WA, USA). Intracellular caspase-3/7 activity was detected using a caspase-3/7 assay kit (Promega Corporation), and cell fluorescence intensity at 499 nm was measured by an ELISA table counter for quantitative assessment.
Annexin V-APC apoptosis assay
Apoptosis was assessed by Annexin V-based flow cytometry using standard laboratory methodology. Cells were transfected, as described above, and incubated in 6-well plates for 5 days. When the cells reached ~85% confluence, they were harvested and resuspended in binding buffer at a density of 5×10⁵ cells/ml. Subsequently, 200 µl suspension was added to FACS tubes and stained with Annexin V. The cells were mixed gently in a dark room for 15 min at room temperature and analyzed using a flow cytometer. The result was recorded and analyzed in Excel (version 2013; Microsoft Corporation). Although standard flow cytometry apoptosis assays use co-staining with propidium iodide, only Annexin V was analyzed as the cells were transfected with a GFP-expressing vector and the excitation wavelengths of propidium iodide and GFP overlap.
Tumor growth in nude mice
The OS xenograft model was established in nude mice using MNNG/HOS cells to determine the contribution of MAT2B to OS growth in vivo. The animal xenograft model studies were conducted following institutional guidelines. The Welfare Ethics Committee of Shanghai GeneChem Co., Ltd. approved the animal study, as the animals were raised and supplied by the company. In total, 20 4-week-old female nude mice (weight, 15-20 g) were randomly assigned into two groups; the sh control (Ctrl) group and shMAT2B group (n=10/group). The mice were kept at room temperature ~25°C and 40-70% humidity, with a 12 h/12 h light/dark and purified air, with free access to food and water. MAT2B knockdown decreased the growth of OS xenograft tumors in nude mice and MAT2B inhibition was facilitated by lentivirus shMAT2B. The right armpit region of each mouse (the mice were purchased from Shanghai GeneChem Co., Ltd.) was subcutaneously injected with 2×10⁷ MNNG/HOS cells resuspended in 200 µl PBS. On the 14th day after injection, the tumor diameter was measured three times every week using a vernier caliper. Mice were sacrificed on the 24th day after injection, and the tumors were obtained and weighed following necropsy. The tumor volume was calculated using the following formula: π /6 × length × width × width (mm3).
In vivo bioluminescence imaging
Bioluminescence was measured with the IVIS imaging system (Caliper Life Sciences, Waltham, MA, USA). All images were taken 15 min after intraperitoneal injection of luciferin (Sigma-Aldrich; Merck KGaA, Darmstadt, Germany) at 10 µl/g body weight, with 60 sec of acquisition and 10 sec of binning. During image acquisition, mice were sedated continuously via inhalation of 3% isoflurane. Image analysis and bioluminescent quantification was performed using Living Image system (Lumina LT, PerkinElmer, Inc., Waltham, MA, USA).
Microarray gene expression analysis
RNA quality was assessed using denaturing gel electrophoresis. The Affymetrix GeneChip system was used for hybridization, staining, and imaging of the arrays, according to the standard Affymetrix protocol. Following hybridization, the arrays were washed using a Fluidics Station 450 (Affymetrix; Thermo Fisher Scientific, Inc.) and scanned using a Scanner 3000 (Affymetrix; Thermo Fisher Scientific, Inc.). Quality control analysis was performed using the Thermo Nanodrop 2000 (Affymetrix; Thermo Fisher Scientific, Inc., Wilmington, DE, USA) and Agilent 2100 bioanalyzer (Agilent Technologies, Inc., Santa Clara, CA, USA). For each micro (mi)RNA, multiple probes were spotted on the array, and the mean intensity of these probes was calculated to represent the expression value of the miRNAs. In addition, multiple spots were included as negative controls. For each sample, 1 µl total RNA was hybridized with the miRNA array and further processed, according to the manufacturer’s protocol. Only those miRNAs with significant (P<0.05) differential expression of ≥2.0-fold change were identified. Array scanning and data analysis were performed using Expression Console™ software version 1.4 (Affymetrix; Thermo Fisher Scientific, Inc.), which provides signal estimation and quality control functionality for the Affymetrix GeneChip. Transcriptome Analysis Console software version 1.0 (Affymetrix; Thermo Fisher Scientific, Inc.) was used to perform statistical analysis and provide a list of differentially expressed miRNAs. Gene Ontology (https://www.uniprot.org/help/gene_ontology) analysis was performed to identify significantly enriched biological processes and molecular functions.
Western blotting
Total protein was extracted from cells using radioimmunoprecipitation assay buffer with phenylmethane sulfonyl fluoride (Thermo Fisher Scientific, Inc.), and the protein concentration was determined using a bicinchoninic acid assay (Beyotime Institute of Biotechnology, Haimen, China). Equal amounts of protein (30 µg) were resolved by SDS-PAGE (10%) and subsequently transferred to polyvinylidene difluoride membranes (EMD Millipore, Billerica, MA, USA). The membranes were blocked with 5% non-fat milk at room temperature for 1 h and subsequently incubated with primary antibodies against MAT2B (Abcam; cat. no. ab109484; 1:50), Cbp/p300-interacting transactivator 2 (CITED2; 1:1,000-10,000; Abcam; cat. no. ab108345), epidermal growth factor receptor (EGFR; 1:1,000-10,000; Abcam; cat. no. ab52984), proliferating cell nuclear antigen (PCNA; 1:1000; Cell Signaling Technology, Inc., Danvers, MA, USA; cat. no. 2586), early growth response protein 1 (EGR1; 1-5 µg/ml; Abcam; cat. no. ab54966) or GAPDH (1:2,000; Santa Cruz Biotechnology, Inc.; Dallas, TX, USA; cat. no. sc-32233) overnight at 4°C. Following three washes, the membranes were incubated with horseradish peroxidase-conjugated secondary antibody for 1 h at 37°C [mouse immunoglobulin G (IgG), cat. no. sc-2005; and rabbit IgG; cat. no. sc-2004; both Santa Cruz Biotechnology; 1:5,000]. The bands containing the target proteins were detected using an enhanced chemiluminescence kit (EMD Millipore).
Ingenuity Pathway Analysis (IPA)
IPA is an integrated online integration analysis software (www.ingenuity.com), which aids the understanding of data from gene expression, miRNA and small-scale experiments. It establishes a visual experimental system to understand the properties of various molecules, including genes, proteins, chemicals, drugs and their intermolecular interaction networks.
Statistical analysis
All statistical analyses were performed using Excel software (Microsoft Excel; version 2013; Microsoft Corporation). The experiments were repeated twice. P<0.05 was considered to indicate a statistically significant difference. All data are presented as the mean ± sstandard deviation. Student’s t-test was used to evaluate the significant differences.
Results
MAT2B expression is upregulated in OS tissues and cell lines
The MAT2B expression levels of OS and normal bone tissue were measured by immunohistochemical staining. The results demonstrated that the expression of MAT2B was markedly upregulated in human OS tissues (Fig. 1A). In the four OS cell lines (MNNG/HOS, SaoS-2, MG-63 and U-2OS), the mRNA expression of MAT2B was abundant (Fig. 1B). MAT2B was markedly silenced in OS cells by shRNA lentivirus. Lentivirus-mediated shMAT2B and non-silencing shRNA (shCtrl) were prepared and infected in two OS cell lines (U-2OS and MNNG/HOS). The infection efficiency was >80%, as measured by GFP expression, 7 h after infection (Fig. 2A). RT-qPCR demonstrated that the MAT2B mRNA expression level was significantly suppressed in U-2OS and MNNG/HOS cells by 84.3% (Fig. 2B) and 68.2% (Fig. 2C), respectively. Furthermore, the MAT2B knockdown efficiency was confirmed by western blotting at the protein expression level (Fig. 2D and E).
Figure 1.
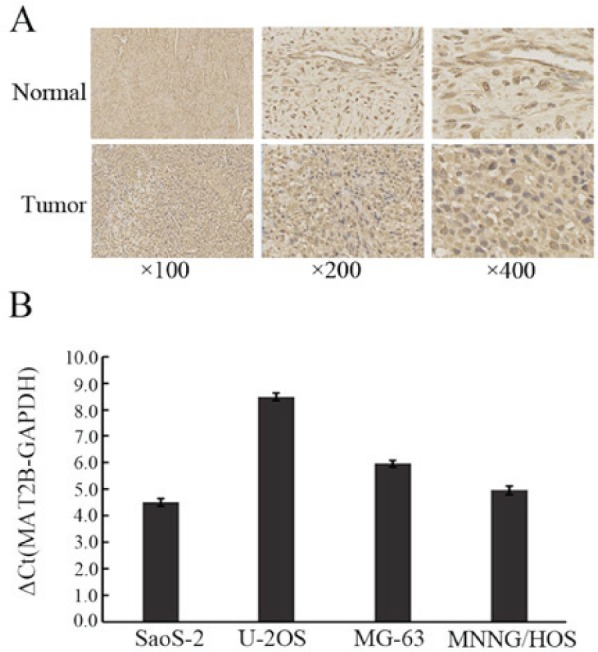
MAT2B was highly expressed in OS tissues and OS cells. (A) MAT2B expression in osteosarcoma tissues and normal bone tissues using immunhisto-chemical staining. (B) MAT2B was highly expressed in four osteosarcoma cell lines (Saos-2, U-2OS, MG-63 and MNNG/HOS). OS, osteosarcoma; MAT2B, methionine adenosyltransferase 2B.
Figure 2.
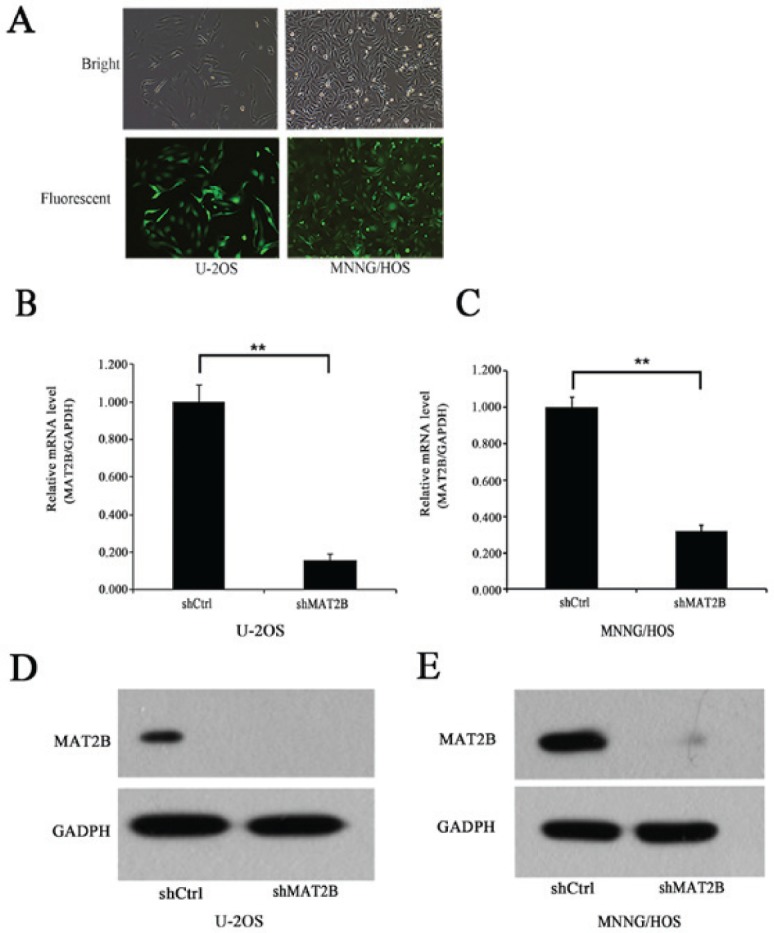
MAT2B is significantly knocked down in human osteosarcoma cells by MAT2B-shRNA lentivirus. (A) Representative images of U-2OS and MNNG/HOS cells under bright and fluorescent microscopes 72 h after lentivirus infection. Magnification, ×200. (B) MAT2B expression was silenced in osteo-sarcoma cells at the mRNA expression level in the U-2OS cell line. (C) MAT2B expression was silenced in osteosarcoma cells at the mRNA expression level in the MNNG/HOS cell line. (D) MAT2B expression was silenced in osteosarcoma cells at the protein expression level in the U-2OS cell line. (E) MAT2B expression was silenced in osteosarcoma cells at the protein expression level in the MNNG/HOS cell line. **P<0.01. MAT2B, methionine adenosyltransferase 2B; shRNA, small hairpin RNA; Ctrl, control.
Knockdown of MAT2B inhibits OS cell proliferation
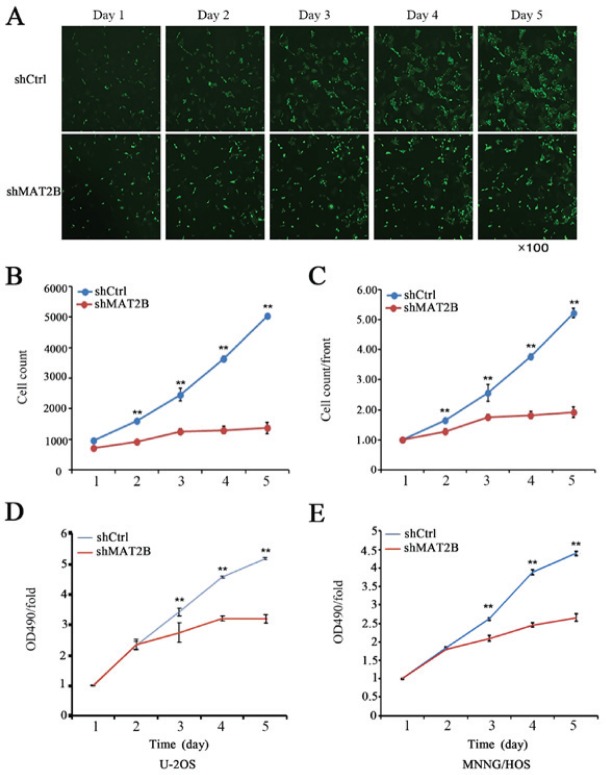
U-2OS cells with green fluorescence were observed and counted using a Nexcelom Celigo Image Cytometer. Fig. 3A demonstrated the continuous growth of cells during 5 days. According to the cell count every day, a growth curve was generated (Fig. 3B and C). The U-2OS cell count demonstrated significant differences between the two groups. Similar results were observed in the MNNG/HOS cell line. It increased by 5.23 times in the shCtrl group and 1.92 in the shMAT2B group, which suggested that the proliferation of U-2OS cells was inhibited subsequent to MAT2B silencing.
Figure 3.
Knockdown of MAT2B inhibits cell proliferation and vitality. (A) Cell proliferation of U-20S cell with MAT2B silencing over 5 continuous days. (B) Cell growth curve in U-20S cells. (C) Ratio between the cell count of the indicated day and the average in MNNG/HOS cells. Magnification, ×100. Downregulation of MAT2B inhibited osteosarcoma cell proliferation analyzed by an MTT assay. The OD 490 nm/fold on day 3-5 demonstrate marked differences between the shCtrl and shMAT2B groups in osteosarcoma cell lines (D) U-2OS and (E) MNNG/HOS, respectively. Data are presented as the mean ± standard deviation from three independent experiments. MAT2B, methionine adenosyltransferase 2B; OD, optical density; sh, small hairpin; Ctrl, control.
The MTT assay demonstrated that knockdown of MAT2B expression in U2OS and MNNG/HOS OS cells markedly inhibited cell proliferation compared with the control group, as indicated by the considerable difference in the optical density at 490 nm between the two groups (Fig. 3D and E).
Knockdown of MAT2B promotes apoptosis in OS cells
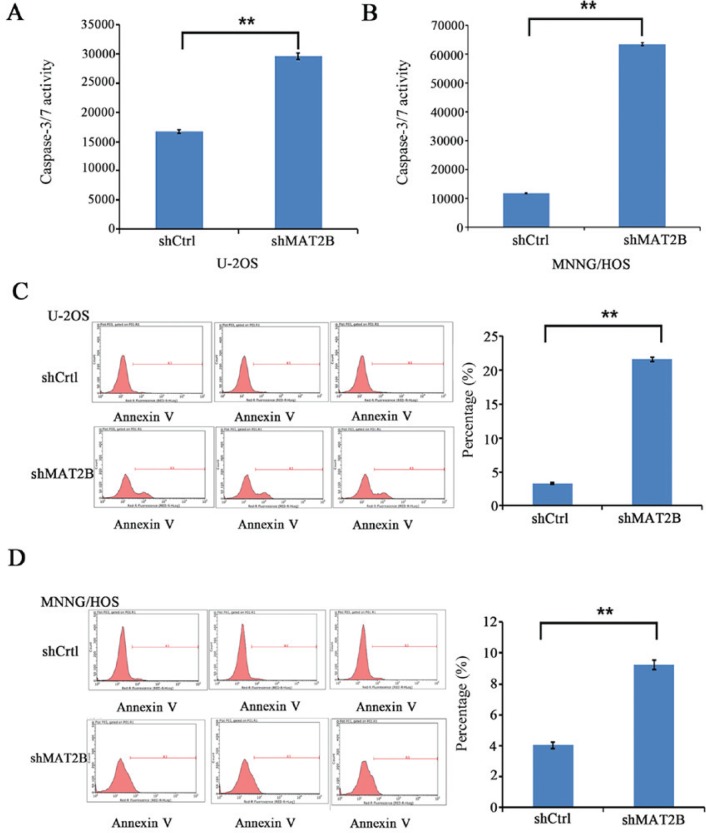
Considering that the decreased cell growth may be attributed to increased cell death, Annexin V-APC apoptosis and caspase-3/7 activity assays were conducted, which identified that knockdown of MAT2B increased cell apoptosis in the two OS cell lines (Fig. 4; P<0.01). The results suggested that MAT2B was able to inhibit apoptosis, which may contribute to the promotion of cell proliferation.
Figure 4.
Knockdown of MAT2B induces apoptosis in human osteosarcoma cell lines (U-2OS and MNNG/HOS). (A) Apoptosis was assessed by measuring caspase-3/7 activity in the U-2OS cell line. (B) Apoptosis was assessed by measuring caspase-3/7 activity in the MNNG/HOS cell line. Apoptosis was assessed using Annexin V-staining and analyzed by flow cytometry in (C) U-2OS and (D) MNNG/HOS cells. Flow cytometric analysis demonstrated that the apoptosis ratios of these two cell lines in the shMAT2B groups were increased compared with the shCtrl groups. Data are presented as the mean ± sstandard deviation from three independent experiments. **P<0.01. MAT2B, methionine adenosyltransferase 2B; sh, small hairpin; Ctrl, control.
Knockdown of MAT2B decreases tumor size in vivo
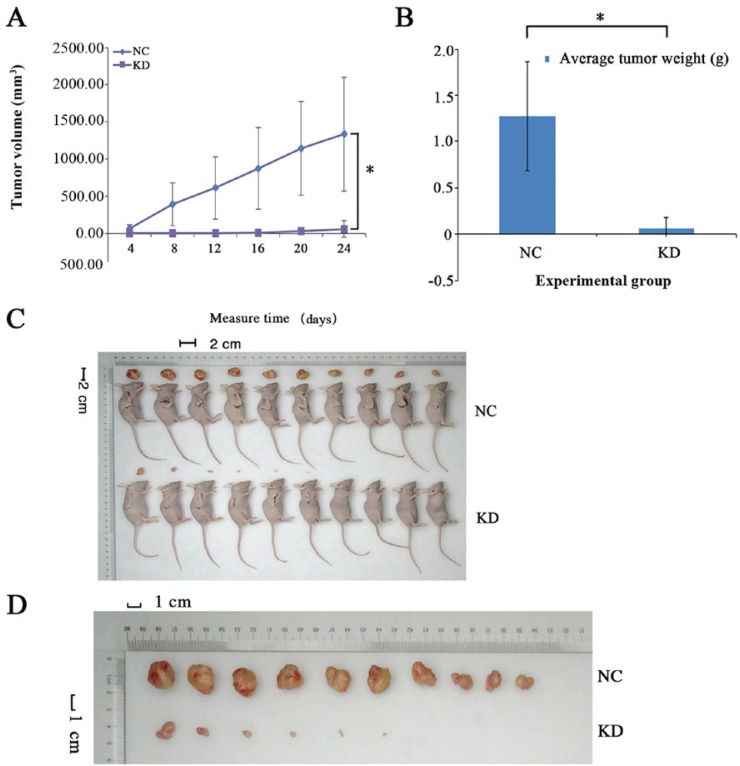
The average tumor size in the knockdown group (58.92±112.08 mm3; P<0.05; Fig. 5A) was significantly decreased compared with the negative control group (1,336.42±767.51 mm3; P<0.05) at the end of the measurement period (Fig. 5A). Furthermore, the average tumor weight was measured (Fig. 5B). Collectively, these data demonstrated that MAT2B knockdown suppressed tumor growth in nude mice (Fig. 5C and D).
Figure 5.
Knockdown of MAT2B in MNNG/HOS cells suppresses tumor growth in vivo. (A) Xenograft models in nude mice were generated with MAT2B NC and MAT2B-shRNA (KD) stably transfected cells. Tumor size was measured every 3 days for 26 days. (B) Tumor weight was measured every three days. The bar graph presents the average weight of the tumors. (C) Image of xenograft models in nude mice were generated with MAT2B NC and MAT2B-shRNA (KD) stably transfected cells. (D) Disserted tumors are presented for the MAT2B NC and MAT2B-shRNA (KD) stably transfected cells. n=10. MAT2B, methionine adenosyltransferase 2B; NC, negative control; KD, knockdown.
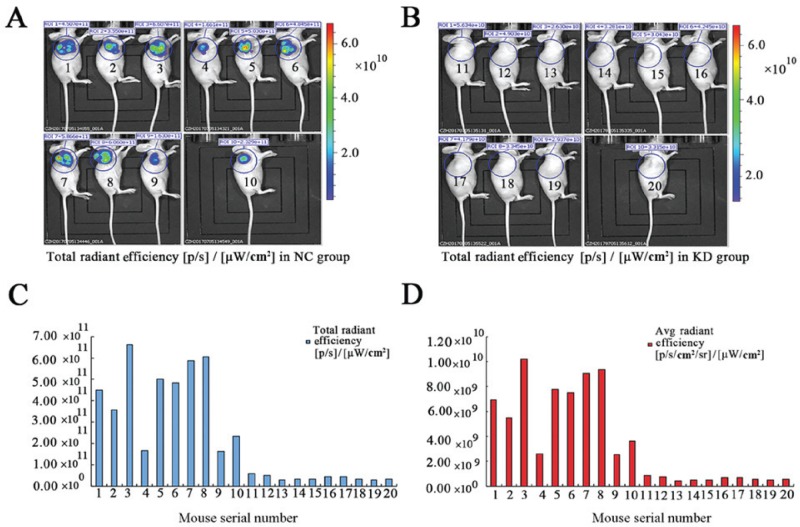
Additionally, local tumor growth was monitored on the last day by bioluminescence. Detectable bioluminescent signals demonstrated a significant difference in the signal intensity between the two groups (Fig. 6A and B). The total and average radiant efficiency, calculated from the region of interest drawn over tumors, were markedly higher in the negative control group compared with the knockdown group (Fig. 6C and D).
Figure 6.
Bioluminescence in vivo imaging. (A) Representative bioluminescent images of mice at 2 weeks post-inoculation of lentivirus-mediated RNA cells. Significant tumor growth was detected in the mice by the detection of intensive bioluminescent signals. (B) Weak bioluminescent signals were visualized in mice inoculated with lentivirus-mediated MAT2B cells. Mice 1-10 were inoculated with lentivirus-mediated RNA cells. Mice 11-20 were inoculated with lentivirus-mediated MAT2B cells. (C) Total radiant efficiency calculated from the ROI of the tumors. (D) Average radiant efficiency calculated from the ROI of the tumors. MAT2B, methionine adenosyltransferase 2B; ROI, region of interest.
mRNA and protein expression of EGFR and PCNA are significantly altered following MAT2B knockdown
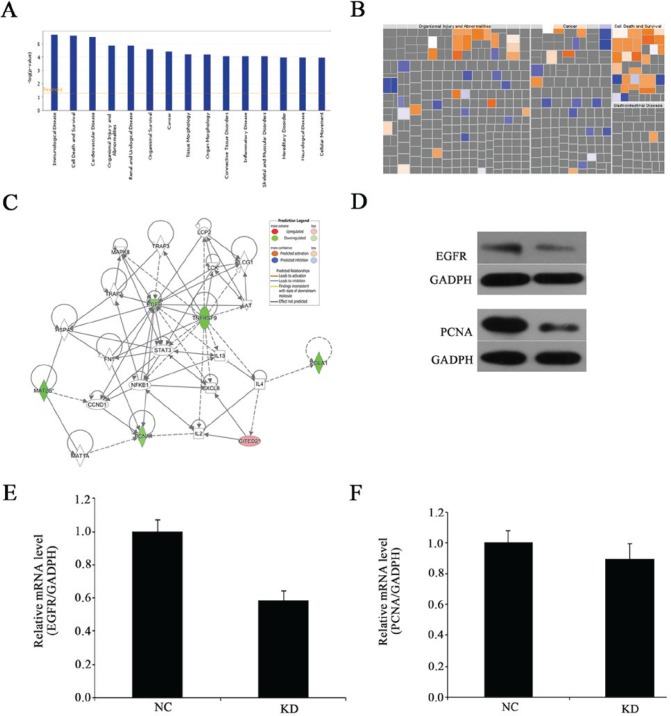
The experiments suggested that MAT2B is crucial for OS development in vitro and in vivo. Therefore, to study the molecular mechanisms by which MAT2B promotes OS proliferation, microarray analysis was performed to compare gene expression in OS cells (MNNG/HOS cells) in the negative control and knockdown groups. In the present study, significantly different expressions were identified in 267 genes through global gene expression profiling (P<0.05 and absolute fold change >1.5), including 179 upregulated genes and 88 downregulated genes. The association of these genes with disease and function were analyzed by Ingenuity Pathway Analysis (IPA) and it was identified that following MAT2B knockdown, the disease and function histogram demonstrates the enrichment of differentially expressed genes in disease and function classification (Fig. 7A). The most strongly activated function was ‘tumor cell death and survival’ (orange), whereas, the most strongly suppressed function was ‘organismal injury and abnormalities’, followed by ‘cancer’ (blue; Fig. 7B). Furthermore, through IPA, EGFR and PCNA were identified as potential downstream targets that had interaction networks with MAT2B (Fig. 7C). However, no differences were detected in the expressions of CITED2 and EGR1 (data not shown). Furthermore, it was demonstrated that MAT2B knockdown downregulated the mRNA and protein expression of EGFR and PCNA (Fig. 7D-F). Collectively, the present results suggested that MAT2B may regulate OS proliferation through EGFR and PCNA signaling.
Figure 7.
Gene expression profiling identified an association between alterations in MAT2B expression. (A) Disease and functional analysis classified gene enrichment following MAT2B silencing. (B) Heat map of the disease and functional analysis identified the genes enriched following MAT2B silencing. Orange ones indicate activated functions and blue ones indicate suppressed functions. (C) Knowledge-based interaction network following MAT2B silencing in MNNG/HOS cells. The network was built based on the interaction of the Ingenuity Pathway Analysis database overlaid with microarray data from MAT2B-KD cells with a 2-fold change cut-off. The intensity of the node color indicates the degree of up-(red) or down-(green) regulation following MAT2B knockdown in MNNG/HOS cells. Solid arrows in the figure indicate confirmed regulatory relationships and dotted lines indicate predicted regulatory relationships. (D) Protein expression levels of EGFR and PCNA were detected by western blotting. (E) EGFR mRNA expression level was detected by RT-qPCR following MAT2B knockdown in MNNG/HOS cells. (F) PCNA mRNA expression level was detected by RT-qPCR following MAT2B knockdown in MNNG/HOS cells. MAT2B, methionine adenosyltransferase 2B; KD, knockdown; EGFR, epidermal growth factor receptor; PCNA, proliferating cell nuclear antigen; RT-qPCR, reverse transcription-quantitative polymerase chain reaction
Discussion
Based on recent research on the role of MAT2B, it was hypothesized that this gene may have important functions, including encoding regulatory subunits. However, the role of MAT2B in OS and its mechanisms remain unknown. In the present study, it was identified that the expression of MAT2B in OS was higher compared with normal bone tissue by immunohistochemical techniques. The high MAT2B expression in four OS cell lines was detected by RT-qPCR and the results suggested that MAT2B may serve a crucial role in the growth of OS. A lentivirus with MAT2B-shRNA was constructed and demonstrated effective knockdown of MAT2B expression. In vitro, MAT2B knockdown suppressed cell growth and induced apoptosis in U-2OS and MNNG/HOS cell lines. In vivo, OS xenografts confirmed that MAT2B silencing resulted in smaller and lighter tumors. These results suggested that MAT2B may serve as an oncogene in human OS.
To characterize and identify the molecular mechanism of MAT2B in OS proliferation, it is essential to identify the potential downstream targets regulated by MAT2B in OS. A microarray analysis along with western blotting and RT-qPCR was conducted to identify possible signal networks affected by MAT2B in OS. Gene expression analysis suggested that MAT2B knockdown enriched the expression of genes involved in ‘immunological disease’, ‘cell death and survival’ and ‘cardiovascular disease’, according to the bar chart of disease and function, which indicated activated function in tumor cell death. Furthermore, IPA was conducted to analyze the core downstream genes that interact with MAT2B to identify PCNA and EGFR as potential downstream targets of MAT2B in OS tumorigenesis. Notably, MAT2B shRNA decreased the mRNA and protein expression levels of PCNA and EGFR in MNNG/HOS cells, similar to the suppressive effect observed in the microarray assay of MNNG/HOS cells.
The protein encoded by EGFR is a transmembrane glycoprotein that is a member of the protein kinase superfamily. Binding of the protein to a ligand induces receptor dimerization and tyrosine autophosphorylation, leading to cell proliferation (15). There are three other types of receptors similar to EGFR (additionally termed HER-1/ErbB-1): HER-2/neu/ErbB-2, HER-3/ErbB-3 and HER-4/ErbB-4. Following ligand binding, downstream homologous or heterodimerized receptors phosphorylate the phosphoinositide 3-kinase (PI3K)/protein kinase B (AKT) and RAS/RAF/mitogen-activated protein kinase signaling pathways (16). These signals are closely associated with cell growth, proliferation and apoptosis, particularly in cancer (17). High EGFR expression implicated poor survival and prognosis in lung cancer and breast cancer (18). Furthermore, the expression level of EGFR was higher in OS, which is identified in metastasis and relapse, compared with that primary in situ (19). However, the high expression of EGFR demonstrated better prognosis in OS (20). The EGFR protein was expressed highly in OS samples (21). Another previous study suggested that the interaction between transforming growth factor-α and EGFR elicited PI3K and AKT activation, which in turn activated nuclear factor-κB, resulting in the expression of intracellular adhesion molecule 1 and contributing to the migration of human OS cells (22). Physakengose G inhibited cell proliferation and induced apoptosis in human osteosarcoma cells through EGFR phosphorylation and epidermal growth factor-induced activation of downstream signaling molecules, including AKT and mammalian target of rapamycin (23). Another previous study demonstrated that Erk may be a downstream signaling molecule of EGFR in OS (24). A previous study demonstrated that phosphorylated AKT was upregulated upon the activation of EGFR and mediated EGFR signaling in cancer cell proliferation (25).
PCNA was demonstrated to be closely associated with clinical functions and has been widely identified in numerous types of tumors (26-28). It has a number of functions, including DNA replication, DNA repair and cell cycle control (29). Systematic review and meta-analysis have been performed to identify this in patients with cervical cancer and glioma (30). Furthermore, the expression level of PCNA in liver carcinoma is increased compared with adjacent liver tissue. The higher the level of PCNA, the poorer the prognosis of overall survival and disease-free survival in OS. In breast cancer, PCNA was recognized as a biomarker of proliferation, as it was highly expressed in the S and G2 phases, whereas it was lower in the stationary phase (31-33). In OS tissues, PCNA expression and nuclear signals predominantly demonstrated nuclear localization, which was correlated with histological grade, histological type and the clinical characteristics of the patients (34).
Matrix metalloproteinase (MMP)-9 is a vital enzyme involved in the degradation of type IV collagen. Regulation of PCNA and MMP-9 expression promotes tumor invasion and metastasis through the AKT and β-arrestin pathways (35). In the present study, it was observed that MAT2B knockdown suppressed the expression of PCNA. However, MMP-9 expression requires investigation in future studies.
In the present study, it was observed that MAT2B was increased in human OS tissues and cell lines. An shRNA silencing approach was used to study the role of MAT2B in OS and it was identified that knockdown of MAT2B suppressed proliferation and induced apoptosis in OS cells (U-2OS and MNNG/HOS) in vitro, in addition to tumor growth in xenografts in vivo. Microarray analysis and IPA demonstrated alterations in the expression of a number of genes in OS cells following MAT2B knockdown, suggesting that MAT2B may be associated with an alteration in gene profile via multiple pathways. EGFR and PCNA may be direct target genes for MAT2B based on the results of the IPA, western blotting and RT-qPCR. The results provided novel insight into MAT2B in the progression of OS.
Collectively, the present results demonstrated that MAT2B functions as a tumor oncogene in OS in vivo and in vitro via regulation of EGFR and PCNA. Accordingly, the specific role of MAT2B and its downstream target in OS requires further clarification in the interest of identifying a potential therapeutic target for OS.
Acknowledgments
Not applicable.
Abbreviations
- EGFR
epidermal growth factor receptor
- FACS
fluorescence-activated cell sorting
- FBS
fetal bovine serum
- GFP
green fluorescent protein
- IPA
Ingenuity Pathway Analysis
- MAT
methionine adenosyltransferase
- MMP
matrix metalloproteinase
- OS
osteosarcoma
- PCNA
proliferating cell nuclear antigen
- RT-qPCR
reverse transcription-quantitative polymerase chain reaction
- shRNA
short hairpin RNA
Funding
The present study was supported by the National and Natural Science Foundation of China (grant nos. 81502325 and 81672658) and the National Key Research Project of Science and Technology Ministry (grant no. 2016YFC0106204)
Availability of data and materials
The datasets used and/or analyzed during the current study are available from the corresponding author on reasonable request.
Authors’ contributions
YYu conducted the experiments, performed the statistical analysis and edited the manuscript. YW collected the background information. ZL and YS acquired the data. WY and ZS were responsible for the design and conception of the study. YYa helped perform the analysis with constructive suggestions. All authors read and approved the final manuscript.
Ethics approval and consent to participate
The Ethics Committee of Tongxu County People’s Hospital (Kaifeng, China) approved the use of the human tissue samples. Written informed consent was originally obtained from the patients. The animal xenograft model studies were conducted following institutional guidelines. The Welfare Ethics Committee of Shanghai GeneChem Co., Ltd. (Shanghai, China) approved the animal study.
Patient consent for publication
Not applicable.
Competing interests
The authors declare that they have no competing interests.
References
- 1.Ferguson JL, Turner SP. Bone cancer: Diagnosis and treatment principles. Am Fam Physician. 2018;98:205–213. [PubMed] [Google Scholar]
- 2.Harrison DJ, Schwartz CL. Osteogenic sarcoma: Systemic chemotherapy options for localized disease. Curr Treat Options Oncol. 2017;18:24. doi: 10.1007/s11864-017-0464-2. [DOI] [PubMed] [Google Scholar]
- 3.Ferrari S, Mercuri M, Bacci G, Bielack SS, Jürgens H. Comment on “Prognostic factors in high-grade osteosarcoma of the extremities or trunk: An analysis of 1,702 patients treated on neoadjuvant Cooperative Osteosarcoma Study Group protocols”. J Clin Oncol. 2002;20:2910–2911. doi: 10.1200/JCO.2002.20.12.2910. author reply 2910–2911. [DOI] [PubMed] [Google Scholar]
- 4.Lu SC, Mato JM. S-adenosylmethionine in liver health, injury, and cancer. Physiol Rev. 2012;92:1515–1542. doi: 10.1152/physrev.00047.2011. [DOI] [PMC free article] [PubMed] [Google Scholar]
- 5.Sun H, Kang J, Su J, Zhang J, Zhang L, Liu X, Zhang J, Wang F, Lu Z, Xing X, et al. Methionine adenosyltransferase 2A regulates mouse zygotic genome activation and morula to blastocyst transition. Biol Reprod. 2018 Sep 27; doi: 10.1093/biolre/ioy194. Epub ahead of print. [DOI] [PubMed] [Google Scholar]
- 6.Inoue-Choi M, Nelson HH, Robien K, Arning E, Bottiglieri T, Koh WP, Yuan JM. One-carbon metabolism nutrient status and plasma S-adenosylmethionine concentrations in middle-aged and older Chinese in Singapore. Int J Mol Epidemiol Genet. 2012;3:160–173. [PMC free article] [PubMed] [Google Scholar]
- 7.Yang H, Ara AI, Magilnick N, Xia M, Ramani K, Chen H, Lee TD, Mato JM, Lu SC. Expression pattern, regulation, and functions of methionine adenosyltransferase 2beta splicing variants in hepatoma cells. Gastroenterology. 2008;134:281–291. doi: 10.1053/j.gastro.2007.10.027. [DOI] [PMC free article] [PubMed] [Google Scholar]
- 8.Ramani K, Lu SC. Methionine adenosyltransferases in liver health and diseases. Liver Res. 2017;1:103–111. doi: 10.1016/j.livres.2017.07.002. [DOI] [PMC free article] [PubMed] [Google Scholar]
- 9.Nordgren KK, Peng Y, Pelleymounter LL, Moon I, Abo R, Feng Q, Eckloff B, Yee VC, Wieben E, Weinshilboum RM. Methionine adenosyltransferase 2A/2B and methylation: Gene sequence variation and functional genomics. Drug Metab Dispos. 2011;39:2135–2147. doi: 10.1124/dmd.111.040857. [DOI] [PMC free article] [PubMed] [Google Scholar]
- 10.Peng H, Dara L, Li TW, Zheng Y, Yang H, Tomasi ML, Tomasi I, Giordano P, Mato JM, Lu SC. MAT2B-GIT1 interplay activates MEK1/ERK 1 and 2 to induce growth in human liver and colon cancer. Hepatology. 2013;57:2299–2313. doi: 10.1002/hep.26258. [DOI] [PMC free article] [PubMed] [Google Scholar]
- 11.Lei Y, Zhang B, Zhang Y, Zhao Y, Sun J, Zhang X, Yang S. Lentivirus-mediated downregulation of MAT2B inhibits cell proliferation and induces apoptosis in melanoma. Int J Oncol. 2016;49:981–990. doi: 10.3892/ijo.2016.3603. [DOI] [PubMed] [Google Scholar]
- 12.Tang Z, He G, Xu J, Zhongfu L. Knockdown of Cbp/P300-interacting transactivator with Glu/Asp-rich carboxy-terminal domain 2 inhibits cell division and increases apoptosis in gastric cancer. J Surg Res. 2017;211:1–7. doi: 10.1016/j.jss.2016.11.049. [DOI] [PubMed] [Google Scholar]
- 13.Wang X, Liu H, Zhao C, Li W, Xu H, Chen Y. The DEAD-box RNA helicase 51 controls non-small cell lung cancer proliferation by regulating cell cycle progression via multiple pathways. Sci Rep. 2016;6:26108. doi: 10.1038/srep26108. [DOI] [PMC free article] [PubMed] [Google Scholar]
- 14.Livak KJ, Schmittgen TD. Analysis of relative gene expression data using real-time quantitative PCR and the 2(-Δ Δ C(T)) Method Methods. 2001;25:402–408. doi: 10.1006/meth.2001.1262. [DOI] [PubMed] [Google Scholar]
- 15.Singh B, Carpenter G, Coffey RJ. EGF receptor ligands: Recent advances. F1000 Res. 2016;5:5. doi: 10.12688/f1000research.9025.1. [DOI] [PMC free article] [PubMed] [Google Scholar]
- 16.Wang W, Zhao HF, Yao TF, Gong H. Advanced development of ErbB family-targeted therapies in osteosarcoma treatment. Invest New Drugs. 2018 Oct 24; doi: 10.1007/s10637-018-0684-8. Epub ahead of print. [DOI] [PubMed] [Google Scholar]
- 17.Prabhu VV, Devaraj N. Epidermal growth factor receptor tyrosine kinase: A potential target in treatment of non-small-cell lung carcinoma. J Environ Pathol Toxicol Oncol. 2017;36:151–158. doi: 10.1615/JEnvironPatholToxicolOncol.2017018341. [DOI] [PubMed] [Google Scholar]
- 18.Gonzalez-Conchas GA, Rodriguez-Romo L, Hernandez-Barajas D, Gonzalez-Guerrero JF, Rodriguez-Fernandez IA, Verdines-Perez A, Templeton AJ, Ocana A, Seruga B, Tannock IF, et al. Epidermal growth factor receptor overexpression and outcomes in early breast cancer: A systematic review and a meta-analysis. Cancer Treat Rev. 2018;62:1–8. doi: 10.1016/j.ctrv.2017.10.008. [DOI] [PubMed] [Google Scholar]
- 19.Wen YH, Koeppen H, Garcia R, Chiriboga L, Tarlow BD, Peters BA, Eigenbrot C, Yee H, Steiner G, Greco MA. Epidermal growth factor receptor in osteosarcoma: Expression and mutational analysis. Hum Pathol. 2007;38:1184–1191. doi: 10.1016/j.humpath.2007.01.002. [DOI] [PubMed] [Google Scholar]
- 20.Kersting C, Gebert C, Agelopoulos K, Schmidt H, van Diest PJ, Juergens H, Winkelmann W, Kevric M, Gosheger G, Brandt B, et al. Epidermal growth factor receptor expression in high-grade osteosarcomas is associated with a good clinical outcome. Clin Cancer Res. 2007;13:2998–3005. doi: 10.1158/1078-0432.CCR-06-2432. [DOI] [PubMed] [Google Scholar]
- 21.Linder M, Glitzner E, Srivatsa S, Bakiri L, Matsuoka K, Shahrouzi P, Dumanic M, Novoszel P, Mohr T, Langer O, et al. EGFR is required for FOS-dependent bone tumor development via RSK2/CREB signaling. EMBO Mol Med. 2018;10:e9408. doi: 10.15252/emmm.201809408. [DOI] [PMC free article] [PubMed] [Google Scholar]
- 22.Hou CH, Lin FL, Tong KB, Hou SM, Liu JF. Transforming growth factor alpha promotes osteosarcoma metastasis by ICAM-1 and PI3K/Akt signaling pathway. Biochem Pharmacol. 2014;89:453–463. doi: 10.1016/j.bcp.2014.03.010. [DOI] [PubMed] [Google Scholar]
- 23.Lin H, Zhang C, Zhang H, Xia YZ, Zhang CY, Luo J, Yang L, Kong LY. Physakengose induces apoptosis via EGFR/mTOR signaling and inhibits autophagic flux in human osteosarcoma cells. Phytomedicine. 2018;42:190–198. doi: 10.1016/j.phymed.2018.03.046. [DOI] [PubMed] [Google Scholar]
- 24.Do SI, Jung WW, Kim HS, Park YK. The expression of epidermal growth factor receptor and its downstream signaling molecules in osteosarcoma. Int J Oncol. 2009;34:797–803. doi: 10.3892/ijo_00000205. [DOI] [PubMed] [Google Scholar]
- 25.Wu H, Muscato NE, Gonzalez A, Shyr Y. An EGFR and AKT signaling pathway was identified with mediation model in osteosarcomas clinical study. Biomark Insights. 2007;2:469–476. doi: 10.1177/117727190700200035. [DOI] [PMC free article] [PubMed] [Google Scholar]
- 26.Agarwal P, Sen AK, Bhardwaj M, Dinand V, Ahuja A, Sood R. Study of proliferating cell nuclear antigen expression and angiogenesis in urothelial neoplasms: Correlation with tumor grade and stage. Urol Ann. 2018;10:209–214. doi: 10.4103/UA.UA_167_17. [DOI] [PMC free article] [PubMed] [Google Scholar]
- 27.Tan Z, Wortman M, Dillehay KL, Seibel WL, Evelyn CR, Smith SJ, Malkas LH, Zheng Y, Lu S, Dong Z. Small-molecule targeting of proliferating cell nuclear antigen chromatin association inhibits tumor cell growth. Mol Pharmacol. 2012;81:811–819. doi: 10.1124/mol.112.077735. [DOI] [PMC free article] [PubMed] [Google Scholar]
- 28.Unal VS, Ayhan A, Tokgozoglu MA. Proliferating cell nuclear antigen index and nm23 expression in osteosarcoma in relation to disease- free survival and tumor grade. Saudi Med J. 2005;26:1475–1477. [PubMed] [Google Scholar]
- 29.Juríková M, Danihel Ľ, Polák Š, Varga I. Ki67, PCNA, and MCM proteins: Markers of proliferation in the diagnosis of breast cancer. Acta Histochem. 2016;118:544–552. doi: 10.1016/j.acthis.2016.05.002. [DOI] [PubMed] [Google Scholar]
- 30.Lv Q, Zhang J, Yi Y, Huang Y, Wang Y, Wang Y, Zhang W. Proliferating cell nuclear antigen has an association with prognosis and risks factors of cancer patients: A systematic review. Mol Neurobiol. 2016;53:6209–6217. doi: 10.1007/s12035-015-9525-3. [DOI] [PubMed] [Google Scholar]
- 31.Dong Y, Liang G, Yuan B, Yang C, Gao R, Zhou X. MALAT1 promotes the proliferation and metastasis of osteosarcoma cells by activating the PI3K/Akt pathway. Tumour Biol. 2015;36:1477–1486. doi: 10.1007/s13277-014-2631-4. [DOI] [PubMed] [Google Scholar]
- 32.Liang G, Xu E, Yang C, Zhang C, Sheng X, Zhou X. Nucleosome-binding protein HMGN2 exhibits antitumor activity in human SaO2 and U2-OS osteosarcoma cell lines. Oncol Rep. 2015;33:1300–1306. doi: 10.3892/or.2014.3689. [DOI] [PubMed] [Google Scholar]
- 33.Tu B, Du L, Fan QM, Tang Z, Tang TT. STAT3 activation by IL-6 from mesenchymal stem cells promotes the proliferation and metastasis of osteosarcoma. Cancer Lett. 2012;325:80–88. doi: 10.1016/j.canlet.2012.06.006. [DOI] [PubMed] [Google Scholar]
- 34.Wang W, Luo H, Wang A. Expression of survivin and correlation with PCNA in osteosarcoma. J Surg Oncol. 2006;93:578–584. doi: 10.1002/jso.20507. [DOI] [PubMed] [Google Scholar]
- 35.Aaltomaa S, Lipponen P, Syrjänen K. Proliferating cell nuclear antigen (PCNA) immunolabeling as a prognostic factor in axillary lymph node negative breast cancer. Anticancer Res. 1993;13:533–538. [PubMed] [Google Scholar]
Associated Data
This section collects any data citations, data availability statements, or supplementary materials included in this article.
Data Availability Statement
The datasets used and/or analyzed during the current study are available from the corresponding author on reasonable request.


