

Abstract
Objectives:
We hypothesized that distinct sets of functional trajectories can be identified in the year before and after major surgery, with unique transition probabilities from pre to postsurgical functional trajectories, and that outcomes would be better among participants undergoing elective versus non-elective surgery.
Background:
Major surgery is common and can be highly morbid in older persons. The relationship between the course of disability (ie, functional trajectory) before and after surgery in older adults has not been well-studied for most operations.
Methods:
Prospective cohort study of 754 community-living persons 70 years or older. The analytic sample included 250 participants who underwent their first major surgery during the study period.
Results:
Before surgery, 4 functional trajectories were identified: no disability (n = 60, 24.0%), and mild (n = 84, 33.6%), moderate (n = 73, 29.2%), and severe (n = 33, 13.2%) disability. After surgery, 4 functional trajectories were identified: rapid (n = 39, 15.6%), gradual (n = 76, 30.4%), partial (n = 70, 28.0%), and little (n = 57, 22.8%) improvement. Rapid improvement was seen for n = 31 (51.7%) participants with no disability before surgery, but was uncommon among those with mild disability (n = 8, 9.5%) and was not observed in the moderate and severe trajectory groups. For participants with mild to moderate disability before surgery, gradual improvement (n = 46, 54.8%) and partial improvement (n = 36, 49.3%) were most common. Most participants with severe disability (n = 27, 81.8%) before surgery exhibited little improvement. Outcomes were better for participants undergoing elective versus nonelective surgery.
Conclusions:
Functional prognosis in the year after major surgery is highly dependent on premorbid function.
Keywords: activities of daily living, aged, cohort study, functional trajectories, geriatrics, surgery
By 2030, one-fifth of the US population will be 65 years or older, and persons 85 years or older are the fastest growing segment of the population.1 Clinically, one of the most common and potentially debilitating events that older persons face is major surgery. More than 4 million major surgical operations are performed annually in the United States on older patients.2 Despite the increasing number of surgical operations, relatively little is known about the outcomes that matter most to older patients, including return to premorbid function.3–6 Older persons consistently indicate that maintaining independent function is their top priority.7 To inform clinical decision-making for older patients, their families, and policy makers, there is a critical need for high-quality data on the course of disability before and after major elective and nonelective surgery.
Prior research has largely focused on functional outcomes for specific types of major surgeries. These studies have examined hip fracture,8–10 cardiac,11 abdominal, thoracic,12,13 colon,14 vascular,15–17 and cancer surgery.18,19 In addition, one recent retrospective study examined multiple types of surgery.20 Outcomes were generally poor, with rates of functional decline 2 years after surgery as high as 61%.21 To our knowledge, no prior prospective study has evaluated functional outcomes for both major nonelective and elective surgeries.
We used data from a unique longitudinal study of older persons who have been followed monthly for over 15 years, providing us with a unique opportunity to rigorously evaluate the course of disability surrounding major surgery. We hypothesized that distinct sets of functional trajectories can be identified in the year before and after major surgery, with unique transition probabilities from pre to postsurgical functional trajectories, and that outcomes would be better among participants undergoing elective versus nonelective surgery.
METHODS
Study Population
Participants were drawn from an ongoing longitudinal study of 754 community-living persons, aged 70 years or older, who were initially nondisabled in their basic activities of daily living.22,23 Potential participants were members of a large health plan and were excluded for significant cognitive impairment with no available proxy,24 life expectancy less than 12 months, plans to move out of the area, or inability to speak English. Physically frail persons were identified based on slow gait speed, which was defined as a timed score greater than 10 seconds on the rapid gait test, that is, walk back and forth over a 10-ft (3-m) course as quickly as possible.25 Frail persons were oversampled based on initial sample size calculations.26 Only 4.6% of persons refused screening, and 75.2% of those eligible agreed to participate and were enrolled from March, 1998 to October, 1999. Persons who refused to participate did not differ significantly from those who were enrolled in terms of age or sex. The study was approved by the Yale Human Investigation Committee, and all participants provided informed consent.
Data Collection
Comprehensive home-based assessments were completed at baseline and subsequently at 18-month intervals for 180 months through December, 2013 (except at 126 months), while telephone interviews were completed monthly through December, 2014. For participants who had significant cognitive impairment or were otherwise unavailable, a proxy was interviewed using a rigorous protocol, with demonstrated reliability and validity.24 Deaths were ascertained from the local obituaries and/or an informant during a subsequent interview. 623 (82.6%) participants died after a median of 100 months, whereas 43 (5.7%) dropped out of the study after a median of 27 months. Data were otherwise available for 99.2% of the 81,844 monthly interviews. During the comprehensive assessments, data were collected on demographic characteristics; 9 self-reported, physician-diagnosed chronic conditions; cognitive status;27 depressive symptoms;28 and physical frailty.
Assessment of Disability
Complete details regarding the assessment of disability are provided elsewhere.29–31 During the monthly interviews, participants were asked, “At the present time, do you need help from another person to (complete the task)?” for each of 4 basic activities (bathing, dressing, walking, and transferring), 5 instrumental activities (shopping, housework, meal preparation, taking medications, and managing finances), and 3 mobility activities (walk 1/4 mile, climb flight of stairs, and lift/carry ten pounds). For these 12 activities, disability was operationalized as the need for personal assistance or inability to do the task. Participants were also asked about a fourth mobility activity, “Have you driven a car during the past month?” Participants who responded “No” were considered to be disabled in driving.31 To address the small amount of missing data on disability, multiple imputation was used with 100 random draws per missing observation.32
Ascertainment of Major Surgeries
Centers for Medicare and Medicaid Services (CMS) records and monthly interview data on self-reported surgeries, verified by chart review, were used to identify participants who had undergone any major operation. Operations were chosen and identified based on International Classification of Diseases, 9th revision (ICD-9) procedure code, by comparing the code found in either the CMS record or chart to a list of codes corresponding to major surgeries that was used in a previously published study in the Lancet by Kwok et al.33 These investigators “examined a prespecified conservative definition of surgery, only including procedures that occurred in the operating room,” which was a consensus definition among experienced surgeons. Dr Kwok graciously provided us with the listing of procedures that fulfilled their “conservative” definition of major surgery for our analysis. A total of 360 cases were identified: 226 (62.8%) via Medicare claims and 134 (37.2%) via self-reported admissions for surgery that were confirmed by hospital chart review. We restricted our analysis to participants’ first major surgeries during the study period, of which 2 were excluded because they did not have a preceding comprehensive assessment, leaving 269 potential cases. During the editorial review, 19 of these cases were deemed not suitable for inclusion as major surgeries, including procedures related to implanted pacemakers and defibrillators, toe amputation, tracheostomy placement, percutaneous vertebroplasty, implant of pulsation balloon, placement of inferior vena cava filter, and ble-pharoptosis repair, leaving 250 in the analytic sample. We categorized each major surgery as neurologic (for brain and spine surgeries), cardiothoracic, abdominal-GI, musculoskeletal, vascular (for endovascular surgeries, noncoronary bypass grafts, and amputations) or other (including thyroidectomies, major breast operations, extensive lymph node excisions, burn debridements, and skin grafts), depending on the ICD-9 procedure code. Major surgeries identified from CMS records were categorized as elective or nonelective by a CMS indicator variable,34 which is set by hospital claims departments according to the acuity of the admission. Those identified by self-report and chart review were categorized as elective or nonelective based on the history in the chart. For example, any admission through the emergency department for major surgery was categorized as nonelective.
Statistical Analysis
To identify functional trajectories before and after major surgery, we used latent class analysis, which is a form of trajectory modeling that fits a semiparametric (discrete) mixture model to longitudinal data using the maximum likelihood method.35,36 This method allowed us to simultaneously estimate each participant’s probabilities for membership in multiple trajectories, with assignment to a specific trajectory based on the highest probability of membership. The Bayesian Information Criterion was used to determine the number of pre and postsurgery trajectories.35,37 We required that the average probability of group membership for each trajectory be greater than 0.9, denoting an excellent fit, and that each trajectory group include a minimum of 10% of the analytic sample.38 For each set of pre and postsurgery trajectories, we modeled the total number of disabilities, ranging from 0 to 13, for 12 consecutive months, as a 0-inflated Poisson distribution. Eight (3.2%) participants died after surgery, but before their first posthospitalization monthly interview, and were counted as a separate postsurgery group. Median survival after surgery across the presurgery trajectories was computed with Kaplan-Meier analysis and compared using the log-rank test.
Next, we jointly modeled the number of disabilities for each month in the year before and after surgery as a zero-inflated Poisson distribution. This allowed us to estimate the probabilities of membership in each postsurgery trajectory, conditional on membership in each presurgery trajectory. The probabilities were calculated with Bayes’ rule, and the corresponding 95% confidence intervals (CIs) were estimated with a first-order Taylor series expansion. The multivariable model was adjusted for age, sex, race, high school education, number of chronic conditions, cognitive impairment, depressive symptoms, and physical frailty,38 and also type of surgery, which was categorized as abdominal, musculoskeletal (the 2 largest subgroups), or other. To account for possible temporal changes in surgical and hospital care during the study period, the year of surgery was also included as a covariate. The corresponding 95% CIs were estimated using a bootstrap with 1000 samples. These analyses were repeated separately for elective and nonelective major surgeries, respectively.
All analyses were performed using SAS V9.4 (SAS Institute, Cary, NC), and P < 0.05 (2-tailed) was used to indicate statistical significance.
RESULTS
Among the 269 participants with a first major surgery, 109 (40.5%) underwent nonelective, whereas 160 (59.5%) underwent elective surgery. A complete listing of these surgeries is provided in Supplemental Table 1 (http://links.lww.com/SLA/B366). The most common type of major surgery was musculoskeletal (n = 99, 39.6%), followed by other (n = 44, 17.6%); abdominal-GI (n = 41, 16.4%); vascular (n = 33, 13.2%); cardiothoracic (n = 17, 6.8%); and neurologic (n = 16, 6.4%). The “other” category included operations on the male (n = 17) and female (n = 16) genital and urinary tracts; breasts, skin grafts, and lymph nodes (n = 8); parathyroidectomy (n = 1); partial thyroidectomy (n = 1); and septoplasty (n = 1).
Table 1 shows the characteristics of participants who underwent major surgery. Among all participants, the mean age was 82.4 years. Two-thirds of participants were female, and most were white and had completed high school. Before surgery, participants had an average of 2 chronic conditions, and slightly less than half-lived alone. There was a relatively low prevalence of cognitive impairment and depressive symptoms. Participants who underwent elective surgery were slightly older and had a higher prevalence of cognitive impairment and physical frailty than those who underwent nonelective surgery, but other demographic characteristics did not differ significantly between the nonelective versus elective groups. The types of surgeries differed between the nonelective and elective groups (P < 0.001), with the largest differences observed for other, vascular, and abdominal.
TABLE 1.
Demographic and Clinical Characteristics of Participants Undergoing Major Surgery
| Characteristic | All Participants (N = 250) |
Nonelective Surgery (n = 96) |
Elective Surgery (n = 154) |
P* |
|---|---|---|---|---|
| At time of hospitalization | ||||
| Age, mean (SD), yrs | 82.4 (5.5) | 84.0 (6.0) | 81.4 (5.0) | <0.001 |
| Female sex, n (%) | 162 (64.8) | 64 (66.7) | 98 (63.6) | 0.626 |
| Non-Hispanic white, n (%) | 224 (89.6) | 90 (93.8) | 134 (87.0) | 0.077 |
| Did not complete high school, n (%) | 78 (29.0) | 31 (28.4) | 47 (29.4) | 0.868 |
| Before start of hospitalization† | ||||
| Lived alone, n (%) | 103 (41.2) | 35 (36.5) | 68 (44.2) | 0.229 |
| No. of chronic conditions, mean (SD) | 2.0 (1.3) | 1.9 (1.3) | 2.1 (1.2) | 0.187 |
| Cognitive impairment,‡ n (%) | 29 (11.6) | 16 (16.7) | 13 (8.4) | 0.048 |
| Depressive symptoms,§ n (%) | 40 (16.0) | 13 (13.5) | 27 (17.5) | 0.403 |
| Physically frail, ¶ n (%) | 107 (42.8) | 52 (54.2) | 55 (35.7) | 0.004 |
| Type of surgery ∥ | ||||
| Musculoskeletal, n (%) | 99 (39.6) | 49 (51.0) | 50 (32.5) | <0.001 |
| Abdominal, n (%) | 41 (16.4) | 25 (26.0) | 16 (10.4) | |
| Vascular, n (%) | 33 (13.2) | 9 (9.4) | 24 (15.6) | |
| Cardiothoracic, n (%) | 17 (6.8) | 6 (6.3) | 11 (7.1) | |
| Neurologic, n (%) | 16 (6.4) | 4 (4.2) | 12 (7.8) | |
| Other, n (%) | 44 (17.6) | 3 (3.1) | 41 (26.6) | |
Computed using chi-square test for dichotomous variables and t test for continuous variables.
Ascertained during comprehensive assessment before hospitalization.
Defined as score less than 24 on Folstein Mini-Mental State Examination.
Defined as score of 20 or greater on Center for Epidemiological Studies-Depression Scale.
Defined on the basis of slow gait speed, as described in the “Methods” section.
Categorized based on ICD-9 code as described in the ““Methods”” section.
SD indicates standard deviation.
As shown in Fig. 1, 4 distinct functional trajectories were identified in the year before surgery: no disability (n = 60, 24.0%), and mild (n = 84, 33.6%), moderate (n = 73, 29.2%), and severe (n = 33,13.2%) disability. The severity of disability did not change over the year except for a small but significant linear increase in the moderate trajectory (from 2.6 at 12 months to 3.9 at 1 month before surgery). In the year after surgery, overall mortality was 13.6% (n = 34), whereas mortality for the no disability, and mild, moderate, and severe trajectories was 13.3%, 7.1%, 19.2%, and 18.2%, respectively (test for trend, P < 0.001).
FIGURE 1.
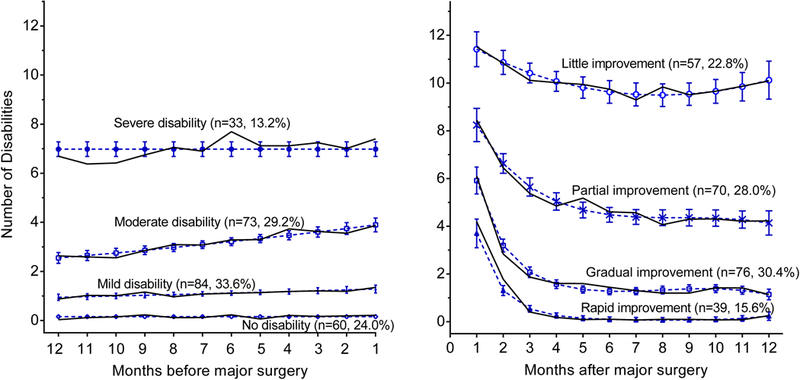
Functional trajectories in the year before and after major surgery (N = 250). The number and percentage of participants for each trajectory are shown within parentheses. The 8 (3.2%) participants who died after surgery, but before their first monthly interview, could not be assigned to a postsurgery trajectory. The percentages may not sum to 100 because of rounding. The number of disabilities ranged from 0 to 13, based on 4 basic activities, 5 instrumental activities, and 4 mobility activities. The solid lines indicate the model trajectories, whereas the open circles show the corresponding observed values at each time point. The dashed lines indicate 95% confidence intervals for the predicted severity of disability. The average posterior probabilities of class membership for the trajectories before and after surgery were all greater than 0.9, with values ranging from 0.94 for no disability to 0.98 for moderate disability, and from 0.96 for gradual improvement to 0.98 for rapid improvement.
In the year after surgery, 4 functional trajectories were identified: rapid (n = 39,15.6%), gradual (n = 76,30.4%), partial (n = 70,28.0%), and little (n = 57, 22.8%) improvement. Eight participants (3.2%) died after surgery, but before the first posthospital interview, and so could not be assigned to a postsurgery trajectory. The severity of disability immediately after surgery was highest for participants having little improvement, lowest for those having rapid improvement, and intermediate for those having gradual or partial improvement. At 12 months postoperatively, over 50% of participants had more than 4 functional deficits, compared with only 13% of participants preoperatively.
The unadjusted probabilities of transitioning from the pre to postsurgery functional trajectories, including early death, are provided in Table 2, stratified by elective versus nonelective surgery. Only participants with no or mild disability presurgery experienced rapid improvement after surgery; and about half of the participants with no disability before surgery had rapid improvement. Gradual improvement was observed for participants in the no, mild, or moderate presurgery trajectories, but not for those in the severe presurgery trajectory. Most participants in the severe disability presurgery trajectory had little improvement, particularly among those who underwent nonelective surgery. In general, outcomes for participants undergoing nonelective surgery were worse, with smaller percentages of participants in the more favorable postsurgery trajectories compared with those who underwent elective surgeries.
TABLE 2.
Unadjusted Probabilities for Postsurgery Functional Trajectory Conditional on Presurgery Trajectory
| Presurgery Trajectory* |
Type of Surgery† | Rapid Improvement‡ (95% CI) |
Gradual Improvement (95% CI) |
Partial Improvement (95% CI) |
Little Improvement (95% CI) |
Early Death§
(95% CI) |
|---|---|---|---|---|---|---|
| No disability | All (N = 60) | 51.7 (37.7–67.9) | 26.7 (12.7–40.0) | 11.7 (3.5–20.5) | 5.0 (0.0–11.5) | 5.0 (0.0–10.3) |
| Nonelective (n =17) | 47.1 (19.6–73.3) | 11.8 (0.0–35.1) | 29.4 (6.1–50.0) | 5.9 (0.0–25.5) | 5.9 (0.0–20.0) | |
| Elective (n = 43) | 53.5 (37.4–73.7) | 32.6 (14.9–48.5) | 4.7 (0.0–12.5) | 4.7 (0.0–11.6) | 4.7 (0.0–11.4) | |
| Mild disability | All (N = 84) | 9.5 (2.7–18.7) | 54.8 (42.0–67.7) | 27.4 (15.6–37.1) | 8.3 (2.4–18.1) | 0.0 (0.0–2.6) |
| Nonelective (n =33) | 3.0 (0.0–13.2) | 42.4 (24.2–63.6) | 36.4 (16.7–51.7) | 18.2 (4.4–34.5) | 0.0 (0.0–0.0) | |
| Elective (n = 51) | 13.7 (3.9–25.5) | 62.7 (46.5–77.9) | 21.6 (9.3–33.3) | 2.0 (0.0–11.0) | 0.0 (0.0–4.3) | |
| Moderate disability | All (N = 73) | 0.0 (0.0–5.2) | 19.2 (4.8–37.4) | 49.3 (31.1–60.5) | 27.4 (16.9–46.8) | 4.1 (0.0–9.6) |
| Nonelective (n =27) | 0.0 (0.0–0.0) | 11.1 (0.0–26.8) | 40.7 (16.9–59.7) | 44.4 (26.1 –73.6) | 3.7 (0.0–12.0) | |
| Elective (n = 46) | 0.0 (0.0–8.5) | 23.9 (5.3–49.0) | 54.3 (30.0–71.6) | 17.4 (6.5–34.2) | 4.3 (0.0–11.9) | |
| Severe disability | All (N = 33) | 0.0 (0.0–0.0) | 0.0 (0.0–0.0) | 12.1 (0.0–40.0) | 81.8 (52.8–93.9) | 6.1 (0.0–17.2) |
| Nonelective (n =19) | 0.0 (0.0–0.0) | 0.0 (0.0–0.0) | 5.3 (0.0–38.1) | 94.7 (61.9–100.0) | 0.0 (0.0–0.0) | |
| Elective (n = 14) | 0.0 (0.0–0.0) | 0.0 (0.0–0.0) | 21.4 (0.0–56.3) | 64.3 (29.4–90.0 | 14.3 (0.0–37.5) | |
Assignment to a specific trajectory was based on the highest probability of membership, computed as described in the “Methods” section.
Determined from CMS data or chart review as described in the “Methods” section.
Conditional probabilities computed with Bayes’ rule. CIs estimated using a bootstrap with 1000 samples as described in the “Methods” section.
Participants who died after surgery and before their first postsurgery follow-up interview.
CI indicates confidence interval.
As shown in Table 3, the characteristics of participants who underwent major surgery differed significantly by presurgery functional trajectory. Participants in the less favorable trajectories were older, had more chronic conditions, were more likely to be female, less likely to have completed high school, and more likely to be cognitively impaired, have depressive symptoms, and be physically frail. The transition probabilities adjusted for these characteristics, and also type of surgery and year of surgery, are shown in Fig. 2. Overall, the adjusted values suggest slightly less favorable outcomes after surgery, with point estimates shifted slightly towards worse improvement in the moderate and severe presurgery trajectories. All the adjusted results, however, were within the 95% CIs of the corresponding unadjusted transition probabilities. For nonelective major surgeries, there was a small shift in probability from partial to little improvement in the moderate disability trajectory. For elective surgeries, there were small shifts toward better improvement in the no and mild disability functional trajectories, and toward worse improvement in the moderate trajectory.
TABLE 3.
Demographic and Clinical Characteristics of Participants Stratified by Presurgery Functional Trajectory
| No Disability* | Mild Disability | Moderate Disability | Severe Disability | P† | |
|---|---|---|---|---|---|
| Total, N (%) | 60 (24.7) | 84 (33.6) | 73 (29.2) | 33 (13.2) | |
| At time of hospitalization | |||||
| Age, mean (SD), yrs | 80.6 (5.3) | 82.0 (5.6) | 82.4 (4.8) | 85.5 (5.8) | <0.001 |
| Female sex, n (%) | 28 (46.7) | 57 (67.9) | 51 (69.9) | 26 (78.8) | 0.001 |
| Non-Hispanic white, n (%) | 57 (95.0) | 74 (88.1) | 66 (90.4) | 27 (81.8) | 0.100 |
| Did not complete high school, n (%) | 8 (13.3) | 21 (25.0) | 25 (34.3) | 19 (57.6) | <0.001 |
| Before the start of hospitalization‡ | |||||
| Lived alone, n (%) | 25 (41.7) | 38 (45.2) | 30 (41.1) | 10 (30.3) | 0.323 |
| Number of chronic conditions, mean (SD) | 1.7 (1.3) | 1.7 (1.1) | 2.5 (1.1) | 2.3 (1.6) | <0.001 |
| Cognitive impairment,§ n (%) | 1 (1.7) | 6 (7.1) | 9 (12.3) | 13 (39.4) | <0.001 |
| Depressive symptoms,¶ n (%) | 3 (5.0) | 11 (13.1) | 19 (26.0) | 7 (21.2) | 0.002 |
| Physically frail,∥ n (%) | 6 (10.0) | 26 (31.0) | 46 (63.0) | 29 (87.9) | <0.001 |
| Type of surgery** | |||||
| Musculoskeletal, n (%) | 18 (30.0) | 28 (33.3) | 34 (46.6) | 19 (57.6) | 0.046 |
| Abdominal, n (%) | 10 (16.7) | 16 (19.1) | 7 (9.6) | 8 (24.2) | |
| Vascular, n (%) | 9 (15.0) | 10 (11.9) | 12 (16.4) | 2 (6.1) | |
| Cardiothoracic, n (%) | 3 (5.0) | 9 (10.7) | 4 (5.5) | 1 (3.0) | |
| Neurologic, n (%) | 3 (5.0) | 9 (10.7) | 4 (5.5) | 0 (0.0) | |
| Other, n (%) | 17 (28.3) | 12 (14.3) | 12 (16.4) | 3 (9.1) | |
Assignment to a specific trajectory was based on the highest probability of membership described in the “Methods” section.
Computed using Cochrane-Armitage test for dichotomous variables and ANOVA for linear trend for continuous variables.
Ascertained during comprehensive assessment before hospitalization.
Defined as score less than 24 on Folstein Mini-Mental State Examination.
Defined as score of 20 or greater on Center for Epidemiological Studies-Depression Scale.
Defined based on slow gait speed, as described in the “Methods” section.
Categorized based on ICD-9 code as described in the “Methods” section.
FIGURE 2.
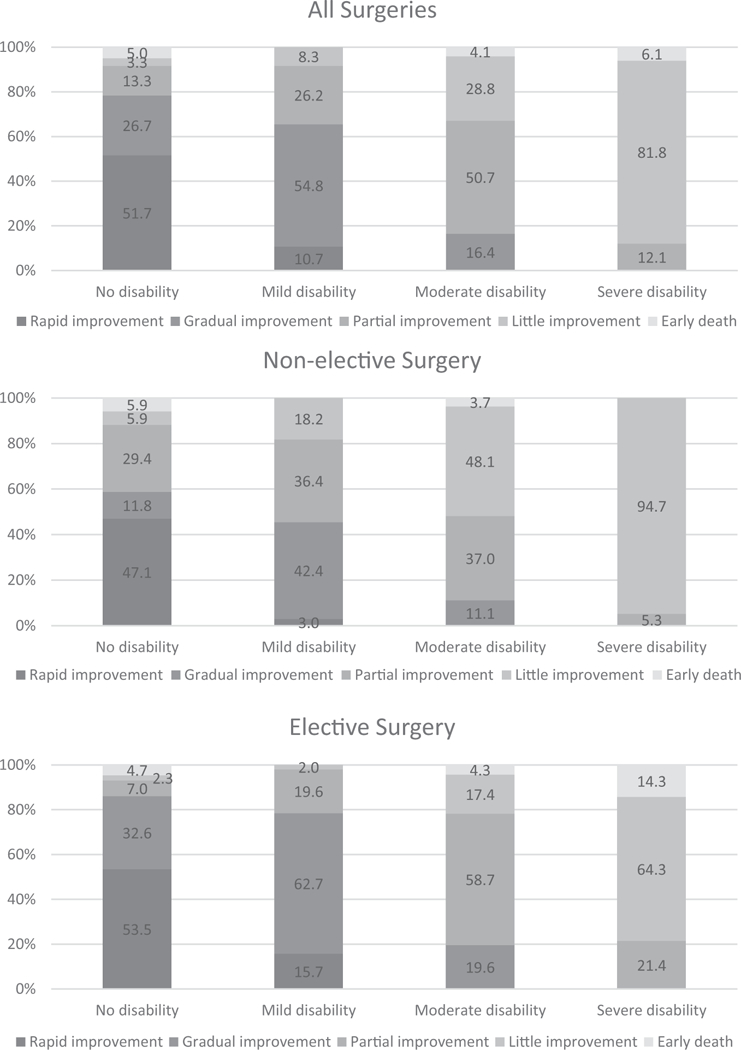
Adjusted probabilities of postsurgery functional trajectories conditional on presurgery functional trajectories stratified by elective versus nonelective surgery. Covariates included age, sex, race, less than high school education, number of chronic conditions, cognitive impairment, depressive symptoms, physical frailty, and type of surgery (abdominal, musculoskeletal, or other). To account for possible temporal changes in surgical and hospital care during the study period, the year of surgery was also included as a covariate. The probabilities may not sum to 1.0 because of rounding.
DISCUSSION
In this prospective longitudinal study, we identified functional trajectories before and after major surgery in a large cohort of older persons. After adjustment for several covariates, including physical frailty, we found that functional trajectories before and after surgery were tightly linked. Older persons with no disability before surgery transitioned to a trajectory of rapid improvement about half of the time. For those with moderate or severe disability before surgery, however, transition to a favorable postsurgery trajectory was uncommon. Nonelective surgery was associated with worse functional outcomes than elective surgery. These results provide new information about the course of disability before and after major surgery in older persons.
Major surgery is a common and often highly morbid event in older persons; it is a leading cause of disability and loss of independence, which is strongly associated with subsequent mortality.39,40 Recent work by Berian et al20 showed that loss of independence after surgery was strongly associated with readmission and postoperative complication across a wide spectrum of surgeries. Functional dependence is also associated with other adverse outcomes, such as nursing home placement and greater use of formal and informal home services,41–44 all of which place a substantial burden on older persons, informal caregivers, and health care resources. Few prior studies have evaluated functional outcomes among older persons after major surgery. In a recent systematic review,21 Oresanya et al identified 28 studies that examined preoperative clinical features associated with mortality and 27 that examined factors associated with nonmortality outcomes. Of the latter, 19 focused on hospital complications, 5 evaluated discharge location, and only 3 evaluated postoperative functional decline.8,12,14
Our results can be used to inform complex perioperative management decisions in older persons and to set expectations during patient and family discussions. Although additional research is needed, one possibility might be to use visual aids to help older patients identify which of the 4 preoperative functional trajectories best depicts their course during the prior year. This information could be used to counsel patients about functional prognosis after surgery. For both nonelective and elective surgery, our results can help align patient, family, and provider goals and expectations, and inform clinical decision-making. Our results should be broadly applicable because older persons were included with all levels of presurgery disability, ranging from none to severe, and because they were robust to adjustment for multiple covariates including frailty and type of major surgery.
A recent “Perspective” in the NEJM suggested that surgical decision-making for high-risk patients, including vulnerable older persons, needs to be redesigned.45 For elective surgeries, this might entail discussion of an overall management plan by a multidisciplinary team, including assessments of functional status and comorbidities. If the decision was made to proceed with surgery, it could be beneficial to coordinate preoperative “optimization” through “prehabilitation.”46 This might include preoperative exercise training, respiratory-muscle training, balance exercises, and even walking programs. Nonelective surgeries carried a higher risk of poor functional outcomes in our study, a finding that should encourage honest discussions with patients and families about the short and long-term functional prognosis with and without surgery, together with the patient’s goals and preferences. In the setting of urgent or emergent surgery, detailed functional assessments are often not possible, so discussions might focus instead on the likelihood of “surrogate” functional outcomes such as returning home. Furthermore, when the goal is to relieve pain or another symptom, surgery might be considered successful even in the absence of functional recovery.
Building on the results from the current study, future research should identify the factors, especially those that are modifiable, that are associated with disability burden and poor functional recovery among older persons who undergo a major surgical procedure. These factors could then serve as the basis for evidenced-based, prehabilitation interventions designed to improve functional outcomes after major elective surgery. For nonelective surgeries, additional research is needed to facilitate goals-of-care discussions, especially when the likelihood of functional recovery is poor.
Our study included monthly assessments of functional status over an extended period, with few missing data and few losses to follow-up for reasons other than death. To the best of our knowledge, comparable data are available in no other study. Additional strengths of the study include the high participation rate, use of Medicare claims data and medical records to ascertain and/or confirm all hospitalizations for operations, focus on major surgeries, and ability to distinguish elective versus nonelective surgeries.
Nonetheless, our results should be interpreted in the context of several potential limitations. First, the functional trajectories were based on self-reported information rather than objective measures of physical capabilities, such as the 6-minute walk. The frequency of our assessments necessitated the use of self-reported function, which included a comprehensive array of basic, instrumental, and mobility activities with demonstrated reliability.29–31 Second, information was not available on receipt of restorative interventions that could have altered the postoperative course. Third, because the number of cases was relatively modest, the major surgeries were grouped into broad categories, and specific operations within these categories were not analyzed separately. Our definition of major surgery was less inclusive than that used by Kwok et al,33 and information was not available on the relative invasiveness of the different surgical procedures. Fourth, information on the administration of general anesthesia was not available. Finally, because our study participants were members of a single health plan in a small urban area and were oversampled for physical frailty, our results may not be generalizable to older persons in other settings. Our study population reflects the demographic characteristics of persons aged 65 years or older in New Haven County, CT, which are comparable with the whole United States, except for race/ethnicity47 (New Haven County has a larger proportion of non-Hispanic whites in this age group than the United States, 91% vs 84%). Moreover, because major surgeries were identified within the context of an ongoing longitudinal study, with few exclusion criteria, our results may be more generalizable than those of prior studies that have enrolled an inception cohort of older patients who underwent a major surgery, met the relevant inclusion and exclusion criteria, and agreed to participate.
CONCLUSIONS
In summary, our study indicates that long-term function after major surgery among older persons is highly dependent on function before surgery. Older persons undergoing surgery rarely improved their function and frequently experienced functional decline. Outcomes were worse for nonelective surgery. When evaluating older persons for operative intervention, in either elective or urgent settings, an assessment of functional status is paramount. In persons deemed operative candidates, preoperative counseling and expectations should be informed by anticipated functional prognosis.
Supplementary Material
ACKNOWLEDGMENTS
We thank Terrence E. Murphy, PhD, and Ling Han, MD, PhD, for assistance with the trajectory analysis; Denise Shepard, BSN, MBA, Andrea Benjamin, BSN, Barbara Foster, and Amy Shelton, MPH, for assistance with data collection; Wanda Carr and Geraldine Hawthorne, BS, for assistance with data entry and management; Peter Charpentier, MPH, for design and development of the study database and participant tracking system; and Joanne McGloin, MDiv, MBA, for leadership and advice as the Project Director.
Funding: The work for this report was funded by a grant from the National Institute on Aging (R01AG17560). The study was conducted at the Yale Claude D. Pepper Older Americans Independence Center (P30AG21342).
Footnotes
Conflicts of interest: Dr Gill is the recipient of an Academic Leadership Award (K07AG043587) from the National Institute on Aging. The organizations funding this study had no role in the design or conduct of the study; in the collection, management, analysis, or interpretation of the data; or in the preparation, review, or approval of the manuscript. The other authors report no conflicts of interest.
Supplemental digital content is available for this article. Direct URL citations appear in the printed text and are provided in the HTML and PDF versions of this article on the journal’s Web site (www.annalsofsurgery.com).
REFERENCES
- 1.Older Americans 2016: Key Indicators of Well-Being. In Statistics FIFoA-R, ed. Washington, DC: U.S. Government Printing Office; 2016. [Google Scholar]
- 2.Elixhauser A, Andrews RM. Profile of inpatient operating room procedures in US hospitals in 2007. Arch Surg. 2010;145:1201–1208. [DOI] [PubMed] [Google Scholar]
- 3.Rosenthal RA, Zenilman ME, Katlic MR. Principles and Practice of Geriatric Surgery. New York: Springer; 2011. [Google Scholar]
- 4.McKinlay JB, Crawford SL, Tennstedt SL. The everyday impacts of providing informal care to dependent elders and their consequences for the care recipients. J Aging Health. 1995;7:497–528. [DOI] [PubMed] [Google Scholar]
- 5.Schulz R, Beach SR. Caregiving as a risk factor for mortality: the Caregiver Health Effects Study. JAMA. 1999;282:2215–2219. [DOI] [PubMed] [Google Scholar]
- 6.Levine C The loneliness of the long-term care giver. N Engl J Med. 1999;340:1587–1590. [DOI] [PubMed] [Google Scholar]
- 7.Fried TR, Tinetti M, Agostini J, et al. Health outcome prioritization to elicit preferences of older persons with multiple health conditions. Patient Educ Couns. 2011;83:278–282. [DOI] [PMC free article] [PubMed] [Google Scholar]
- 8.Kim SM, Moon YW, Lim SJ, et al. Prediction of survival, second fracture, and functional recovery following the first hip fracture surgery in elderly patients. Bone. 2012;50:1343–1350. [DOI] [PubMed] [Google Scholar]
- 9.Curry LC, Hogstel MO, Davis GC. Functional status in older women following hip fracture. J Adv Nurs. 2003;42:347–354. [DOI] [PubMed] [Google Scholar]
- 10.Magaziner J, Hawkes W, Hebel JR, et al. Recovery from hip fracture in eight areas of function. J Gerontol A Biol Sci Med Sci. 2000;55:M498–M507. [DOI] [PubMed] [Google Scholar]
- 11.Min L, Mazzurco L, Gure TR, et al. Longitudinal functional recovery after geriatric cardiac surgery. J Surg Res. 2015;194:25–33. [DOI] [PMC free article] [PubMed] [Google Scholar]
- 12.Kwon S, Symons R, Yukawa M, et al. Evaluating the association of preoperative functional status and postoperative functional decline in older patients undergoing major surgery. Am Surg. 2012;78:1336–1344. [PMC free article] [PubMed] [Google Scholar]
- 13.Lawrence VA, Hazuda HP, Cornell JE, et al. Functional independence after major abdominal surgery in the elderly. J Am Coll Surg. 2004;199:762–772. [DOI] [PubMed] [Google Scholar]
- 14.Finlayson E, Zhao S, Boscardin WJ, et al. Functional status after colon cancer surgery in elderly nursing home residents. J Am Geriatr Soc. 2012;60:967–973. [DOI] [PMC free article] [PubMed] [Google Scholar]
- 15.Lejay A, Thaveau F, Georg Y, et al. Autonomy following revascularisation in 80-year-old patients with critical limb ischaemia. Eur J Vasc Endovasc Surg. 2012;44:562–567 [discussion 568]. [DOI] [PubMed] [Google Scholar]
- 16.Frans FA, Met R, Koelemay MJ, et al. Changes in functional status after treatment of critical limb ischemia. J Vasc Surg. 2013;58:957–965. e1. [DOI] [PubMed] [Google Scholar]
- 17.Oresanya L, Zhao S, Gan S, et al. Functional outcomes after lower extremity revascularization in nursing home residents: a national cohort study. JAMA Intern Med. 2015;175:951–957. [DOI] [PMC free article] [PubMed] [Google Scholar]
- 18.Devoogdt N, Van Kampen M, Geraerts I, et al. Physical activity levels after treatment for breast cancer: one-year follow-up. Breast Cancer Res Treat. 2010;123:417–425. [DOI] [PubMed] [Google Scholar]
- 19.Van Cleave JH, Egleston BL, McCorkle R. Factors affecting recovery of functional status in older adults after cancer surgery. J Am Geriatr Soc. 2011;59:34–43. [DOI] [PMC free article] [PubMed] [Google Scholar]
- 20.Berian JR, Mohanty S, Ko CY, et al. Association of loss of independence with readmission and death after discharge in older patients after surgical procedures. JAMA Surg. 2016;151:e161689. [DOI] [PubMed] [Google Scholar]
- 21.Oresanya LB, Lyons WL, Finlayson E. Preoperative assessment of the older patient: a narrative review. JAMA. 2014;311:2110–2120. [DOI] [PubMed] [Google Scholar]
- 22.Gill TM, Desai MM, Gahbauer EA, et al. Restricted activity among community-living older persons: incidence, precipitants, and health care utilization. Ann Intern Med. 2001;135:313–321. [DOI] [PubMed] [Google Scholar]
- 23.Gill TM, Allore H, Guo Z. Restricted activity and functional decline among community-living older persons. Arch Intern Med. 2003;163:1317–1322. [DOI] [PubMed] [Google Scholar]
- 24.Guralnik JM, Simonsick EM. Physical disability in older Americans. J Gerontol. 1993;48:3–10. [DOI] [PubMed] [Google Scholar]
- 25.Gill TM, Williams CS, Tinetti ME. Assessing risk for the onset of functional dependence among older adults: the role of physical performance. J Am Geriatr Soc. 1995;43:603–609. [DOI] [PubMed] [Google Scholar]
- 26.Gill TM. Disentangling the disabling process: insights from the precipitating events project. Gerontologist. 2014;54:533–555. [DOI] [PMC free article] [PubMed] [Google Scholar]
- 27.Jette AM, Branch LG. The Framingham Disability Study: II. Physical disability among the aging. Am J Public Health. 1981;71:1211–1216. [DOI] [PMC free article] [PubMed] [Google Scholar]
- 28.Guralnik JM, Ferrucci L. Assessing the building blocks of function: utilizing measures of functional limitation. Am J Prev Med. 2003;25 (3 Suppl 2):112–121. [DOI] [PubMed] [Google Scholar]
- 29.Gill TM, Hardy SE, Williams CS. Underestimation of disability in community-living older persons. J Am Geriatr Soc. 2002;50:1492–1497. [DOI] [PubMed] [Google Scholar]
- 30.Hardy SE, Gill TM. Recovery from disability among community-dwelling older persons. JAMA. 2004;291:1596–1602. [DOI] [PubMed] [Google Scholar]
- 31.Gill TM, Gahbauer EA, Murphy TE, et al. Risk factors and precipitants of long-term disability in community mobility: a cohort study of older persons. Ann Intern Med. 2012;156:131–140. [DOI] [PMC free article] [PubMed] [Google Scholar]
- 32.Gill TM, Guo Z, Allore HG. Subtypes of disability in older persons over the course of nearly 8 years. J Am Geriatr Soc. 2008;56:436–443. [DOI] [PMC free article] [PubMed] [Google Scholar]
- 33.Kwok AC, Semel ME, Lipsitz SR, et al. The intensity and variation of surgical care at the end of life: a retrospective cohort study. Lancet. 2011;378:1408–1413. [DOI] [PubMed] [Google Scholar]
- 34.Centers for Medicare and Medicaid Services, Medicare Claims Processing Manual. CMS Manual System. 2009. Pub 100–04 (Transmittal 1775):11–12. [PubMed] [Google Scholar]
- 35.Jones BLND, Roeder KA SAS procedure based on mixed models for estimating developmental trajectories. Sociol Methods Res. 2001;29:374–393. [Google Scholar]
- 36.Jones BLND . Advances in group-based trajectory modeling and an SAS procedure for estimating them. Sociol Methods Res. 2007;35:542–571. [Google Scholar]
- 37.Kaplan D, Sage Publications i. The SAGE Handbook of Quantitative Methodology for the Social Sciences. SAGE Publications; 2004. [Google Scholar]
- 38.Nagin DS. Group-Based Modeling of Development. Cambridge, MA: Harvard University Press; 2005. [Google Scholar]
- 39.Manton KG. A longitudinal study of functional change and mortality in the United States. J Gerontol. 1988;43:S153–S161. [DOI] [PubMed] [Google Scholar]
- 40.Gill TM, Robison JT, Tinetti ME. Difficulty and dependence: two components of the disability continuum among community-living older persons. Ann Intern Med. 1998;128:96–101. [DOI] [PubMed] [Google Scholar]
- 41.Katz S, Branch LG, Branson MH, et al. Active life expectancy. N Engl J Med. 1983;309:1218–1224. [DOI] [PubMed] [Google Scholar]
- 42.Spector WD, Katz S, Murphy JB, et al. The hierarchical relationship between activities of daily living and instrumental activities of daily living. J Chronic Dis. 1987;40:481–489. [DOI] [PubMed] [Google Scholar]
- 43.Kemper P The use of formal and informal home care by the disabled elderly. Health Serv Res. 1992;27:421–451. [PMC free article] [PubMed] [Google Scholar]
- 44.Coughlin TA, McBride TD, Perozek M, et al. Home care for the disabled elderly: predictors and expected costs. Health Serv Res. 1992;27: 453–479. [PMC free article] [PubMed] [Google Scholar]
- 45.Glance LG, Osler TM, Neuman MD. Redesigning surgical decision making for high-risk patients. N Engl J Med. 2014;370:1379–1381. [DOI] [PMC free article] [PubMed] [Google Scholar]
- 46.Chow WB, Rosenthal RA, Merkow RP, et al. Optimal preoperative assessment of the geriatric surgical patient: a best practices guideline from the American College of Surgeons National Surgical Quality Improvement Program and the American Geriatrics Society. J Am Coll Surg. 2012;215:453–466. [DOI] [PubMed] [Google Scholar]
- 47.US Census Bureau. American Fact Finder. Available at: http://factfinder.census.gov. Accessed May 29, 2003.
Associated Data
This section collects any data citations, data availability statements, or supplementary materials included in this article.