

Abstract
Cysteamine bitartrate is a US Food and Drug Administration-approved therapy for nephropathic cystinosis also postulated to enhance glutathione biosynthesis. We hypothesized this antioxidant effect may reduce oxidative stress in primary mitochondrial respiratory chain (RC) disease, improving cellular viability and organismal health. Here, we systematically evaluated the therapeutic potential of cysteamine bitartrate in RC disease models spanning three evolutionarily distinct species. These pre-clinical studies demonstrated the narrow therapeutic window of cysteamine bitartrate, with toxicity at millimolar levels directly correlating with marked induction of hydrogen peroxide production. Micromolar range cysteamine bitartrate treatment in Caenorhabditis elegans gas-1(fc21) RC complex I (NDUFS2−/−) disease invertebrate worms significantly improved mitochondrial membrane potential and oxidative stress, with corresponding modest improvement in fecundity but not lifespan. At 10 to 100 μm concentrations, cysteamine bitartrate improved multiple RC complex disease FBXL4 human fibroblast survival, and protected both complex I (rotenone) and complex IV (azide) Danio rerio vertebrate zebrafish disease models from brain death. Mechanistic profiling of cysteamine bitartrate effects showed it increases aspartate levels and flux, without increasing total glutathione levels. Transcriptional normalization of broadly dysregulated intermediary metabolic, glutathione, cell defense, DNA, and immune pathways was greater in RC disease human cells than in C. elegans, with similar rescue in both models of downregulated ribosomal and proteasomal pathway expression. Overall, these data suggest cysteamine bitartrate may hold therapeutic potential in RC disease, although not through obvious modulation of total glutathione levels. Careful consideration is required to determine safe and effective cysteamine bitartrate concentrations to further evaluate in clinical trials of human subjects with primary mitochondrial RC disease.
Introduction
Mitochondrial medicine began in the late 1980s with recognition that mitochondrial DNA (mtDNA) mutations cause human respiratory chain (RC) disease (1–3). Over the past three decades, knowledge about the role of over 350 genes in both mitochondrial and nuclear genomes in which mutations cause mitochondrial disease has dramatically increased (4), as well as the role that secondary mitochondrial RC dysfunction plays in a wide range of medical disorders (5–8). Yet, the highly heterogeneous phenotypic presentations of RC disease with an average of 16 symptoms per patient (9) and the multitude of underlying genetic etiologies among individual patients presents a challenge to effective therapeutic development. No cures or US Food and Drug Administration (FDA)-approved treatments currently exist for any mitochondrial RC disorders (10–12). However, an increasing number of pre-clinical and clinical studies have demonstrated that various RC disorders may significantly respond to antioxidant therapies targeted to the increased oxidative stress characteristic of mitochondrial disease, either within mitochondria or more globally throughout the cell (13). Indeed, we have recently shown that the oxidative stress and short lifespan of complex I-deficient gas-1(fc21) Caenorhabditis elegans animals, which harbor an autosomal recessive missense mutation in the nuclear gene orthologue encoding the complex I NDUFS2 structural subunit (14), are significantly ameliorated by treatment with a cysteine donor, N-acetylcysteine (NAC) (15).
Cysteamine bitartrate is an amino thiol and a byproduct of the cysteine degradation pathway that is an FDA-approved therapy for the treatment of nephropathic cystinosis to decrease accumulation of lysosomal cystine (the disulfide linked form of cysteine) by engaging in disulfide exchange. In addition, cysteamine bitartrate has been postulated to have broader antioxidant properties potentially related to a distinct role in increasing cysteine availability to support biosynthesis of the potent antioxidant molecule, glutathione (16–18). We hypothesized that cysteamine bitartrate would provide a similar source of cysteine as does NAC to enhance glutathione-based cellular antioxidant activity and mitigate the impaired viability and altered mitochondrial physiology of primary RC disease (19). While an early-stage clinical trial conducted to evaluate the potential therapeutic role of cysteamine bitartrate in pediatric mitochondrial disease subjects with Leigh syndrome from various causes (clinicaltrials.gov, NCT02023866 and NCT02473445) was completed in 2016, no clear benefit or toxicity has yet been publicly reported.
Here, we systematically investigated cysteamine bitartrate’s potential benefits, toxicity, and mechanisms in pre-clinical mitochondrial RC disease models that span distinct evolutionary species (Fig. 1). Systematic studies of a range of cysteamine bitartrate concentrations were performed in the gas-1(fc21) worm RC complex I NDUFS2 subunit p.R290K autosomal recessive disease model, with a primary outcome of animal lifespan and mechanistic investigations of early development, fecundity, key domains of mitochondrial physiology, intermediary metabolism and flux through key pathways by stable isotopic profiling with Gas chromatography-mass spectrometry (GC/MS) and RNAseq-based transcriptome profiling. Validation of cysteamine bitartrate’s major physiologic effects were assessed in primary human fibroblasts derived from genetically confirmed RC disease Leigh syndrome subjects, as well as in zebrafish animal models of pharmacologic inhibitor-based RC complex I and IV dysfunction.
Figure 1.
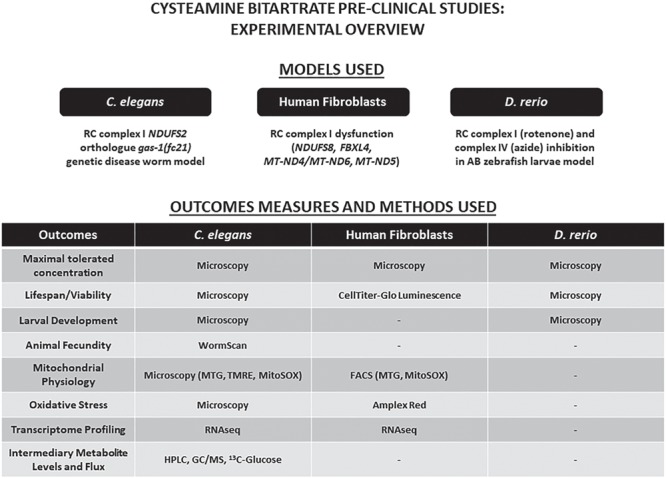
Experimental overview of efficacy analyses of cysteamine bitartrate in respiratory chain dysfunction. We evaluated the efficacy of cysteamine bitartrate in complex I-deficient gas-1 (fc21) mutant (NDUFS2 orthologue) C. elegans (worm) mutants, human mitochondrial disease fibroblast cell lines (FCLs), complex I-deficient Danio rerio (zebrafish) larvae induced by rotenone exposure relative to WT, healthy controls and complex IV-deficient zebrafish larvae induced by sodium azide (NaN3) exposure relative to WT, healthy controls. Cysteamine bitartrate effects at a range of concentrations were evaluated at the level of toxicity and viability in all three models. Developmental effects were assessed through monitoring the growth and hatch rate of gas-1(fc21) worms. Mitochondrial physiology effects were assessed by microscopy in C. elegans and by fluorescence-assisted cell sorting (FACS) analysis in human FCLs. Transcriptome profiling by RNAseq was performed to assess global mechanistic effects of cysteamine treatment in C. elegans gas-1 mutants and human FCLs. Intermediary metabolic effects of cysteamine bitartrate were evaluated in gas-1(fc21) C. elegans by high-performance liquid chromatography (HPLC) and GC/MS quantitation of amino acid and organic acids.
Results
Cysteamine bitartrate at millimolar concentrations is toxic in three evolutionarily distinct species, with induction of hydrogen peroxide production
As previous studies have shown that cysteamine can induce cytotoxicity both by inhibition of glutathione peroxidase and independently by generation of hydrogen peroxide (H2O2) in CCRF-CEM cells (20), we performed initial studies to identify a maximal non-toxic cysteamine bitartrate concentration at the level of growth, development and viability of worms, zebrafish and fibroblasts. Concentrations of cysteamine bitartrate above 1 mm consistently showed toxicity or impaired development in healthy controls of all three evolutionarily distinct species studied (data not shown). Cysteamine bitartrate at or above 1 mm led to impaired egg hatching and delayed or aborted development in N2 Bristol wild-type (WT) worms. Cysteamine bitartrate at or above 1 mm for 24 h similarly induced death in control human fibroblast cells. Cysteamine bitartrate was found to be well-tolerated up to 200 μm in AB (WT) strain zebrafish larvae through 7 days post-fertilization. As it was observed that doses below 1 mm were well tolerated in all models, all experimental assays were completed below this concentration.
Reactive oxidative species (ROS) production in mitochondria is a natural consequence of aerobic respiration (21,22). ROS levels are mediated by scavenging enzymes such as manganese superoxide dismutase (MnSOD), which converts superoxide anions to oxygen or H2O2, which is then converted by catalase within peroxisomes to form water and oxygen. Insufficient capacity to mediate the increased ROS levels generated in RC disease through catalase or glutathione enzyme defenses can result in increased cellular oxidative stress. As previous studies demonstrated cysteamine toxicity was due in part to increased H2O2 production, we sought to verify if similar mechanisms might underlie toxic developmental and viability effects of high-dose cysteamine bitartrate that we observed in all three models. Amplex Red analysis was performed to quantify H2O2 levels in cell culture media either without cells or with human fibroblasts from a healthy control or complex I disease subject (NDUFS8−/−). Indeed, dose-dependent, significantly increased H2O2 production was seen with cysteamine alone in the culture media (without cells present) at 1 and 10 mm cysteamine bitartrate (Fig 2). Media H2O2 levels were further increased under conditions when healthy or RC complex I disease cells were present during cysteamine bitartrate exposure in a clear dose-dependent fashion at 0.1, 1 and 10 mm cysteamine bitrate (Fig. 2). Collectively, these data indicate there is a clear ceiling effect to avoid regarding maximal cysteamine bitartrate concentrations, where cysteamine bitartrate induces toxic H2O2 induction and impaired viability at and above 1 mm.
Figure 2.
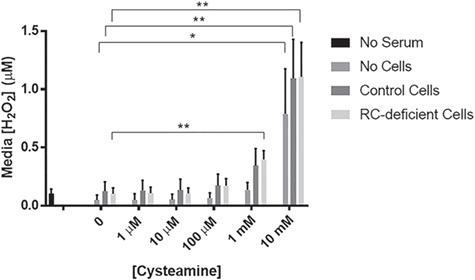
Cysteamine bitartrate treatment of FCLs for 24 hours induced dose-dependent increases in cell culture media of H2O2 production. H2O2 levels were measured using an Amplex Red assay. Values were averaged over three technical replicates and three biological replicates. Error bars indicate SEM. *P < 0.05 and **P < 0.01.
Cysteamine bitartrate reduced mitochondrial oxidative burden and improved mitochondrial membrane potential in gas-1(fc21) complex I-deficient worms
To test whether cysteamine bitartrate rescued their increased mitochondrial oxidant burden (23), synchronized young adult (YA) gas-1(fc21) worms were treated on nematode growth media (NGM) agar plates with 0.1, 1, 10 and 100 μm cysteamine bitartrate for 24 h together with MitoSOX Red (Thermo-Fisher Scientific, Waltham, MA) and then manually evaluated by fluorescence microscopy. Similar as we have prior demonstrated (23), gas-1(fc21) worms had a mean 28% significant increase in MitoSOX fluorescence relative to N2 WT worms (P < 0.001), demonstrating their increased mitochondrial matrix oxidant burden that represents imbalanced oxidant production and scavenging capacity (Fig. 3A). Cysteamine bitartrate at 100 μm treatment led to a significant reduction in MitoSOX mean fluorescence by 21% (P < 0.01) (Fig. 3A), with no significant effects seen at lower concentrations.
Figure 3.
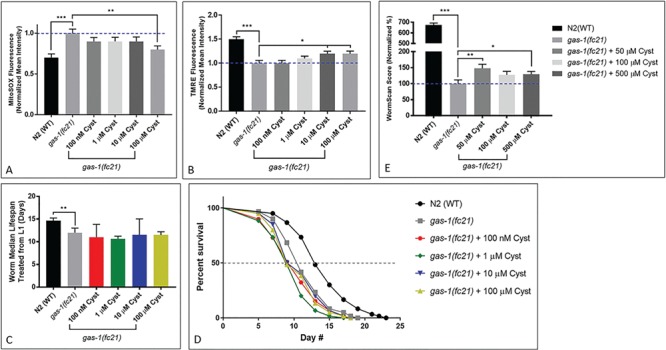
Effects of cysteamine bitartrate on mitochondrial matrix oxidant burden, mitochondrial membrane potential, lifespan and reproductive rate of complex I mutant gas-1(fc21) C. elegans. In vivo fluorescence analysis of relative mitochondrial (A) matrix oxidant burden and (B) membrane potential was performed using MitoSOX (SOX) or tetramethylrhodamine ethyl ester (TMRE), respectively, for 24 h in YA worms. For each condition, each drug treatment was assessed in three independent trials, with n = 50 worms per trial. Error bars indicate SEM. *P < 0.05, **P < 0.01 and ***P < 0.001. (C and D) Lifespan analyses of chronic cysteamine treatment in gas-1(fc21) worms from the L1 early larval development stage were performed at 20°C compared to buffer-only-treated gas-1(fc21) and N2(WT) worms. Values over 3 biological replicates were compiled into the figures shown, with a total of 114 to 223 worms tested across all replicates for each condition. Bars indicate median lifespan normalized to buffer-only-treated gas-1(fc21). (E) Reproductive capacity, or fecundity, assessed by integrating effects on early developmental growth and brood size, was evaluated by WormScan analysis. WormScan scores in each cysteamine bitartrate condition are shown as percentage changes relative to concurrently analyzed buffer-only-treated gas-1(fc21) worms. Values shown were averaged over 15 technical replicates in 3 independent biological replicate experiments. Error bars indicate SEM. *P < 0.05, **P < 0.01 and ***P < 0.001.
As complex I RC-deficient gas-1(fc21) worms also have significantly reduced mitochondrial membrane potential and mitochondrial mass, we further evaluated whether cysteamine bitartrate treatment rescues these aspects of their mitochondrial pathophysiology using fluorescence microscopy with tetramethylrhodamine ethyl ester (TMRE) and MitoTracker Green (MTG) (Thermo-Fisher Scientific, Waltham, MA), respectively. Similarly, as we’ve prior observed, gas-1(fc21) worms had a nearly 50% relative reduction of both their mitochondrial membrane potential and their mitochondrial mass as respectively conveyed by TMRE (Fig. 3B) and MTG (Supplementary Material, Fig. S1) fluorescence relative to WT N2 Bristol worms (P < 0.001) (15,24). Cysteamine bitartrate treatment for 24 h in synchronized YA gas-1(fc21) worms did not improve their reduced mitochondrial mass but significantly rescued their reduced mitochondrial membrane potential toward that of WT N2 worms, with a significant 20% increase in TMRE mean fluorescence intensity (P < 0.05) relative to untreated gas-1(fc21) worms when treated for 24 h with either 10 or 100 μm cysteamine bitartrate (Fig. 3B). No significant change in TMRE mean fluorescence was seen at 24 h with 0.1or 1 μm cysteamine bitartrate (Fig. 3B). Overall, mitochondrial physiology analyses suggested that cysteamine bitartrate has its largest effect by reducing the increased mitochondrial oxidant burden of gas-1(fc21) worms at 100 μm treatment, with partial rescue of their reduced mitochondrial membrane potential at both 10 and 100 μm treatments, and no alteration of mitochondrial mass.
Cysteamine bitartrate did not rescue shortened lifespan of C. elegans gas-1(fc21) complex I-deficient worms but marginally improved its reproductive rate
Since gas-1(fc21) worms exhibit a significantly reduced lifespan, we hypothesized that chronic reduction in oxidative stress from cysteamine bitartrate treatment might increase their lifespan, similar as we have observed with NAC, another compound that increases cysteine bioavailability (15).
Cysteamine bitartrate treatment effects were evaluated following several different concentrations, dosing regimens and exposure times in gas-1(fc21) worms relative to NAC-treated gas-1(fc21), as well as gas-1(fc21) and WT N2 worms in buffer control. As previous studies have shown that drug supplementation timing relative to worm stage plays a key role in determining treatment efficacy (25), we tested multiple treatment regimens to determine if there were potential differences in effects on gas-1(fc21) worm lifespan from cysteamine bitartrate treatment initiation during larval development versus during the post-mitotic YA stage. No significant lifespan benefit was observed in these complex I-deficient animals when 0.1, 1, 10 or 100 μm cysteamine bitartrate treatment was initiated either in early development (Fig. 3C–D) or from the YA stage, though a significant reduction in lifespan with 10 μm treatment was seen in one replicate (Supplementary Material, Fig. S2A-B). Replenishing cysteamine bitartrate at 0.1 or 1 μm weekly on NGM agar plates also failed to rescue the short lifespan of lifespan of gas-1(fc21) worms, although rescue was seen with 2.5 mm NAC used as a positive control, as we have previously reported (Supplementary Material, Fig. S2C-D) (15).
The gas-1(fc21) worms also have substantially reduced reproductive capacity, involving significantly reduced egg laying and egg hatching rates as compared to N2 (WT) worms (14,26). We used WormScan analysis to efficiently screen an integrated endpoint of impaired reproductive rate in these animals at baseline and in response to cysteamine bitartrate (27). This analysis demonstrated a more than 6-fold-reduced reproductive rate of gas-1(fc21) worms relative to WT worms (P < 0.001), which was significantly but marginally improved by 50% (P < 0.01) with 50 μm cysteamine bitartrate and by 25% (P < 0.05) with 500 μm cysteamine bitartrate (Fig. 3E). Overall, cysteamine bitartrate did not dramatically improve nor exacerbate the impaired fertility and survival of gas-1(fc21) RC complex I-deficient worms.
Cysteamine bitartrate increased aspartate levels and molecular species enrichment, but did not broadly alter intermediary metabolic profiles of gas-1(fc21) worms
We have prior demonstrated that gas-1(fc21) worms have a characteristic intermediary metabolic profile identifiable at the amino and organic acid steady state levels when compared to WT N2 worms (24,28). To evaluate if cysteamine bitartrate would normalize these metabolic alterations toward that of N2 WT worms, synchronous YA worms were exposed to 24 h treatments of 0.1, 1, 10 and 100 μm cysteamine bitartrate or 2.5 mm NAC. Whole worm-population free amino acids were extracted, analyzed by high-performance liquid chromatography (HPLC) and normalized to whole worm protein content (Fig. 4A). Characteristic alterations of gas-1(fc21) worms were all present, including increased alanine and branched chain amino acids (leucine, isoleucine and valine), aspartate and glycine with reduction of glutamate (15,28). Neither cysteamine bitartrate treatment nor NAC treatment (similar as prior observed) normalized these amino acid alterations of gas-1(fc21) worms. However, 100 μm cysteamine bitartrate further exacerbated these changes in gas-1(fc21) (Fig. 4A), with ASN, GLN, HIS, THR, ALA, TYR, PHE, ORN, IL, LEU, VAL and LYS levels all clustered slightly higher than untreated gas-1(fc21) and statistically significant (P < 0.05). These results indicate that while cysteamine bitartrate neither mitigates nor exacerbates the amino acid metabolism of gas-1(fc21) at low doses, it may have metabolic effects at higher concentrations (100 μm).
Figure 4.
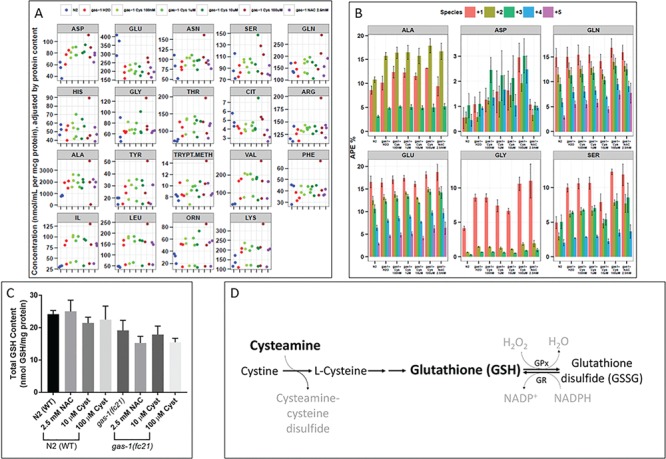
Cysteamine bitartrate treatment showed minimal effects on the altered intermediary metabolism and total glutathione levels of gas-1(fc21) C. elegans. Whole worm concentrations and isotopic enrichment in free amino acids of gas-1(fc21) worms were evaluated following 24 h treatment of synchronous YA populations with cysteamine bitartrate at varying concentrations relative to effects of NAC and buffer-only control. (A) Whole worm free amino acid concentrations were measured by HPLC and normalized to overall protein concentration. Dot color denotes experimental condition as defined in key, with separate dots shown for independent replicate experiments. Random effects analysis of variance was used to account for experimental batch effects. (B) Absolute isotopic enrichment in +1, +2, +3, +4 and + 5 molecular species of each metabolite (indicating the number of carbon atoms on which enrichment was present from U-13C6-glucose fed to the worms) was quantified by GC/MS in synchronous adult worm populations following U-13C6-glucose feeding to WT N2 and gas-1(fc21) worms for 24 h on the first day of adulthood. Feeding was carried out in water buffer-only conditions or with varying concentrations of cysteamine bitartrate (Cys) or 2.5 mm NAC for 24 h, as compared to untreated WT N2 worms. Three biological replicate experiments were performed. *P < 0.05 and **P < 0.01. (C) Total glutathione level quantitation was performed following 24 h treatment with cysteamine bitartrate or NAC in gas-1(fc21) mutant and N2 (WT) worms. n = 6 independent biological replicate experiments for untreated gas-1(fc21) mutant worms, and n = 3 biological replicate experiments for all other conditions. Group differences were statistically analyzed by Student’s t-test (two-way, unequal variance). Error bars indicate SEM. (D) Scheme showing the proposed mechanism for glutathione production following treatment with cysteamine bitartrate by allowing for increased availability of cysteine.
As intermediary flux through glycolysis, pyruvate metabolism and the tricarboxylic acid (TCA) cycle is altered in gas-1(fc21) worms (29), we evaluated whether this is rescued or exacerbated by cysteamine bitartrate treatment. Stable isotopic precursor–product analysis was performed by GC/MS in gas-1(fc21) worms treated for 24 h with 0.1, 1, 10 and 100 μm cysteamine bitartrate relative to buffer-only gas-1(fc21) and N2 WT worms. Increased enrichment (~2% atoms percent excess) was seen in all molecular species of aspartate (ASP) when compared with water-treated gas-1(fc21) worms, with positive direct correlation to cysteamine bitartrate concentration (Fig. 4B). By contrast, NAC did not increase ASP enrichment relative to gas-1(fc21) worms. The remaining metabolic analytes did not show dose-dependent alterations by cysteamine bitartrate. These data indicate that aspartate metabolism was specifically influenced by cysteamine bitartrate treatment, without overall effects on intermediary metabolic flux in gas-1(fc21) worms.
Transcriptome profiling of cysteamine bitartrate treatment in gas-1(fc21) worms revealed dose-dependent effects
The gas-1(fc21) worms have global transcriptome alterations that have been extensively characterized at the level of biochemical, redox and nutrient-sensing signaling pathways (15,24,28). Our previous work has shown drug or supplement exposure in this model can improve mitochondrial and/or overall cellular function by modulating the expression of various dysregulated pathways in gas-1(fc21) worms (15,24). To evaluate whether cysteamine bitartrate normalized these global transcriptome changes and gain further insight into its mechanism of action in the setting of primary RC disease, we performed RNAseq profiling of gas-1(fc21) YA worms treated for 24 h with 0.1, 1, 10 or 100 μm cysteamine bitartrate or 2.5 mm NAC relative to buffer-only-treated gas-1(fc21) and N2 WT control worms.
Gene set enrichment analysis (GSEA) of transcriptome pathway-level changes identified similar upregulation of global metabolic pathways (including oxidative phosphorylation, TCA cycle, pyruvate and glutathione metabolism, among others; Fig. 5A) and downregulation of essential cellular processing pathways (ribosome, lysosome, autophagy, proteasome, and splicesome; Fig. 5B), similarly as we had prior reported to be dysregulated in gas-1(fc21) relative to WT (15,24,28). Expression of most of these dysregulated pathways were not normalized by treating gas-1(fc21) worms with either cysteamine bitartrate or NAC (Fig. 5). Notable exceptions were that 0.1 and 1 μm cysteamine bitartrate treatments completely normalized ribosome and proteasome expression in gas-1(fc21) worms (Fig. 5B), while both 100 μm cysteamine and 2.5 μm NAC significantly normalized expression of the endocytosis pathway (Fig. 5A). Comparatively, 100 μm cysteamine bitartrate did not normalize either ribosome or proteasome expression (Fig. 5A), suggesting that lower concentrations may have greater efficacy to restore disrupted cell physiology in RC disease.
Figure 5.
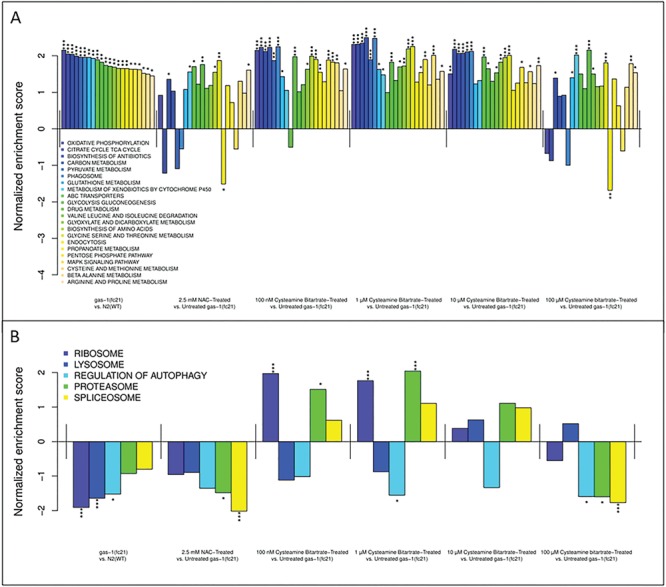
gas-1(fc21) C. elegans show dysregulation in gene expression, while cysteamine bitartrate treatment induced minimal reversal of transcriptome changes in YA gas-1(fc21) worms. Shown are changes in the expression of gene groups that were significantly upregulated in gas-1(fc21) worms compared to WT N2 worms along with the change in each pathway with each of the cysteamine bitartrate- and NAC-treated conditions (A). Also shown are changes in the expression of gene groups that were significantly downregulated in gas-1(fc21) worms compared to WT N2 worms, along with the change in each pathway with each of the cysteamine bitartrate- and NAC-treated conditions (B). Changes in expression are shown as a normalized enrichment score, which reflects relative upregulation or downregulation in mutant relative to WT worms or in treated relative to untreated mutant worms. *P < 0.05, **P < 0.01 and ***P < 0.001.
While the overall mTOR signaling pathway that regulates many of these key biological processes was not significantly dysregulated in gas-1(fc21) relative to WT, the expression of some of the individual genes within this pathway were significantly altered (Supplementary Material, Fig. S3A). Interestingly, normalized expression of the autophagy regulator, ATG1, which was upregulated in gas-1(fc21) relative to N2 worms, occurred with cysteamine bitartrate at 1, 10, and 100 μm doses and NAC at 2.5 mM (Supplementary Material, Fig. S3). While cysteamine bitartrate treatment was not effective in reversing the expression of the glutathione metabolism pathway seen in the gas-1(fc21) worms (Fig. 5A), it did alter the expression of several glutathione pathway genes including upregulation of glutathione-S-transferases and glutathione reductase, along with downregulation of glutathione peroxidase (Supplementary Material, Fig. S4).
The gas-1(fc21) worm model showed significantly upregulated expression relative to WT animals of several amino acid metabolism pathways, including glycine, serine and threonine metabolism, arginine and proline metabolism, as well as cysteine and methionine metabolism, changes that were not reversed by any cysteamine bitartrate concentration (Fig. 5). Interestingly, despite the dose-dependent enrichment of aspartate observed in our metabolic profiling with cysteamine bitartrate (Fig. 4A–B), changes in the overall expression of genes in the aspartate metabolism pathway were not observed, potentially owing to aspartate being grouped in a large KEGG pathway that also includes alanine and glutamate metabolism. However, gene-level analyses revealed significant dysregulation in multiple aspartate metabolism genes in the RC mutant worms, which were normalized by cysteamine bitartrate treatment. Indeed, all key aspartate metabolic enzymes were significantly downregulated in gas-1(fc21) versus N2 (WT) worms, with highly variable effects on their transcript expression with cysteamine bitartrate treatment (Supplementary Material, Fig. S5). While all therapy concentrations significantly normalized expression in gas-1(fc21) of aspartate aminotransferase and further reduced aspartate oxidase expression, dose-dependent treatment effects were observed in asparagine synthetase and adenylosuccinate synthase, which were significantly increased and significantly decreased, respectively, by cysteamine bitartrate at 10 and 100 μm doses as well as by NAC. Interestingly, adenylosuccinate lyase expression, which was unchanged by NAC treatment, most significantly increased with lower doses of cysteamine, with a dose-dependent decrease in expression correlated to increasing cysteamine concentration (1 > 10 > 100 μm effect).
Cysteamine bitartrate did not affect total glutathione levels in gas-1(fc21) C. elegans
Cysteamine has been shown to increase glutathione levels in both normal and cystinotic proximal tubular epithelial cells (PTECs), which has been hypothesized to result in part by increased free cysteine levels through the reduction of cysteine, which can then be stored in the form of GSH (16).
Therefore, we evaluated whether cysteamine bitartrate treatment increased in total glutathione levels in WT N2 Bristol and gas-1(fc21) worms. Interestingly,we found no significant changes in total glutathione levels in either WT or gas-1(fc21) worms with NAC or cysteamine bitartrate 24 h treatment (Fig. 4C). This was surprising, since cysteamine provides cysteine which is a precursor of glutathione (Fig. 4D). It is possible that cysteamine bitartrate altered the levels of reduced (active) or oxidized (inactive) glutathione species, although this was not assessed here.
Cysteamine protected viability under stress of human RC disease fibroblast cell lines
Cysteamine bitartrate effects on cell viability were evaluated in primary fibroblast cell lines (FCLs) from several control and RC disease human subjects under various stressors. Nutrient stressors were tested, involving growing fibroblasts in media either with galactose and glucose, or galactose only without glucose. As expected, RC disease fibroblasts cannot survive without glucose (Supplementary Material, Fig. S6), since alternative ATP generation in the setting of RC deficiency relies on cellular glycolysis, a process that requires glucose and cannot utilize galactose. Cysteamine bitartrate for 24 h with 1, 2 or 4 μm concentrations did not improve cell viability in RC complex I MT-ND5 (m.13513G>A) disease under these nutrient-stressed conditions, although interestingly, 4 μm cysteamine bitartrate did increase cellular viability under galactose stress in healthy control cells (Supplementary Material, Fig. S6).
Figure 6.
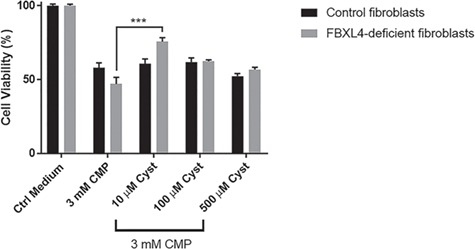
Cysteamine bitartrate significantly rescued cell viability of chloramphenicol stressed FBXL4-deficient FCLs. FBXL4-deficient human FCLs were exposed for 48 h to 3 mm chloramphenicol (CMP, mitochondrial translational inhibitor) alone and/or cysteamine bitartrate at a range of concentrations (10, 100 or 500 μm). Significantly increased cell viability was seen at 10 μm cysteamine bitartrate. Values shown were averaged over nine technical replicates across three independent biological replicate experiments. Error bars indicate SEM. ***P < 0.001.
Cysteamine bitartrate effect on cell viability was also assessed under the stress of RC inhibition in cells with multiple RC dysfunction due to FBXL4 disease (30). Specifically, we used chloramphenicol, a mitochondrial translation inhibitor, as a pharmacologic stressor to induce mitochondrial dysfunction (19). Control and RC disease FBXL4 cells were co-exposed to 3 mm chloramphenicol and 10, 100 or 500 μm of cysteamine bitartrate for 48 h. As expected, chloramphenicol reduced survival of RC disease fibroblasts more than control cells (Fig. 6). Significant rescue of chloramphenicol-stressed RC disease fibroblast viability was seen at 10 μm cysteamine bitartrate, with 30% increased viability relative to chloramphenicol-exposed cells (Fig. 6), showing the benefit of cysteamine bitartrate in improving primary RC disease cell resiliency in the setting of acute RC inhibition.
Potential effects of cysteamine bitartrate on mitochondrial physiology of RC disease fibroblasts were also assessed at the level of mitochondrial content and matrix oxidant burden. In both NDUFS8 and FBXL4 disease fibroblasts, no significant improvement was seen following 24 h cysteamine bitartrate at 0.5 μm concentration using fluorescence-based cell sorting (FACS) analyses (Supplementary Material, Fig. S7). Thus, the improved viability from cysteamine bitartrate in FBXL4 disease lines does not appear to relate to improved mitochondrial-specific oxidant burden, similar as we prior observed with NAC (15), although the higher 10 μm concentration that rescued viability in FBXL4 disease FCLs was not studied.
Figure 7.
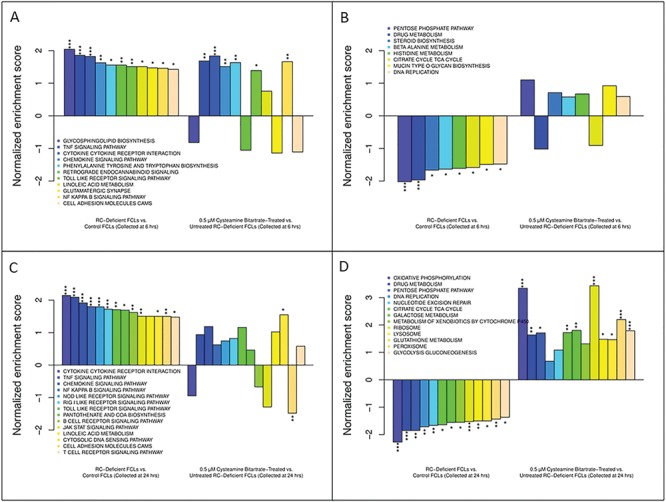
RC-deficient human FCLs showed dysregulated gene expression, while cysteamine bitartrate treatment-induced discrete time-dependent changes in the gene expression of RC-deficient human FCLs. Shown are changes in the expression of gene groups that were significantly upregulated in RC-deficient FCLs compared to control FCLs at 6 h (A) and 24 h (C), along with the change in each pathway with μm cysteamine bitartrate treatment. Also shown are changes in the expression of gene groups that were significantly downregulated in RC disease FCLs relative to control FCLs for either 6 h (B) or 24 h (D), along with the change in each pathway with μm cysteamine bitartrate treatment. Changes in expression are shown as a normalized enrichment score, which reflects relative upregulation or downregulation in RC disease relative to healthy control FCLs or in cysteamine-treated versus untreated RC disease FCLs. *P < 0.05, **P < 0.01 and ***P < 0.001.
Transcriptome profiling of cysteamine bitartrate effects in primary human RC disease fibroblasts
To assess global transcriptome effects of cysteamine bitartrate on RC disease human fibroblasts, we performed RNAseq to evaluate 0.5 μm cysteamine bitartrate over two exposure time courses (6 or 24 h) in three RC-deficient primary human fibroblast lines having mutations in NDUFS8, FBXL4 and MT-ND4/MT-ND6 relative to water-only controls for the same cell lines and two healthy untreated controls. GSEA analysis of transcriptome data from human RC disease fibroblasts relative to healthy controls revealed a similar profile of global transcriptional changes, particularly in the 24 h buffer-treated cells, in similar biochemical and biologic pathways as observed in C. elegans RC mutants as discussed above, and per our prior studies in a wider range of human RC disease fibroblasts (31,32). Most of the upregulated pathways by RC disease relative to controls at both 6 h (Fig. 7A) and 24 h (Fig. 7B) were related to some metabolic pathways (involving linoleic acid, amino acids and cofactors) and many immune functions [cytokine response, tumor necrosis factor signaling pathway, B-cell receptor signaling, cell adhesion molecules (CAM), Janus Kinases (JAK)-Signal Transducer and Activator of Transcription proteins (STAT) signaling and nuclear factor-κB (NF-κB) signaling pathway]. Interestingly, mTOR signaling pathway genes that had shown normalization with cysteamine bitartrate treatment in C. elegans RC disease worms (Supplementary Material, Fig. S3) were also significantly dysregulated in RC disease human fibroblasts, but were not substantially normalized by cysteamine bitartrate treatment (Supplementary Material, Fig. S8).
Figure 8.
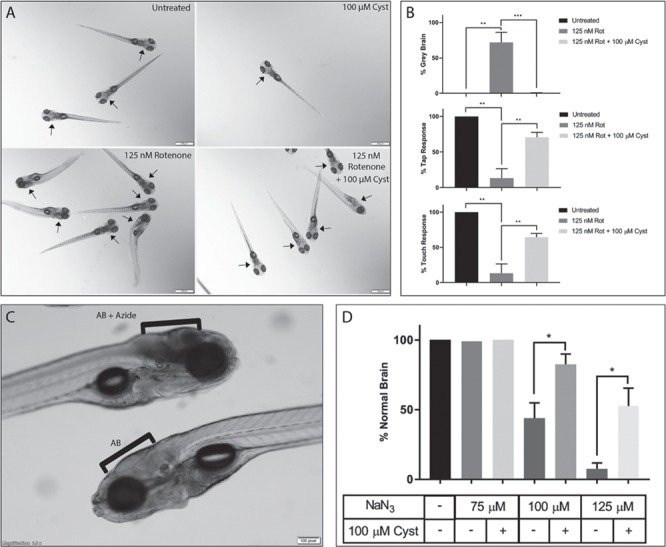
Cysteamine bitartrate treatment prevented brain death and neuromuscular defects resulting from rotenone-based complex I inhibition and sodium azide (NaN3)-based complex IV inhibition in zebrafish. (A) Images demonstrate normal brains in untreated AB (WT) zebrafish (top left panel) and in AB (WT) zebrafish treated only with cysteamine bitartrate from 5–7 dpf (top right panel). Brain death (gray brain) was induced by 125 nm rotenone exposure in AB fish for 4 h at 7 dpf (bottom left panel) but significantly prevented by pre-treating the zebrafish larvae with 100 μm cysteamine bitartrate from 5–7 dpf (bottom right panel). Arrows depict brain region of each larva. (B) Pre-treating the AB (WT) zebrafish larvae with 100 μm cysteamine from 5 dpf significantly prevented brain death (top panel), and loss of tap response (middle panel) and touch response (bottom panel) upon subsequent 4 h rotenone exposure at 7 dpf. Three to five biological replicates were performed per condition, with n = 15 larvae per condition in each replicate. (C) Brain death was induced by 100 μm sodium azide exposure for 17 h beginning at 6 dpf in AB (WT) zebrafish when larvae were examined at 7 dpf (top larva, bracket) as evident on lateral view relative to untreated AB (WT) larvae with normal brain (bottom larva, bracket). (D) Pre-treating the zebrafish larvae with 100 μm cysteamine bitartrate from 5 dpf significantly reduced brain death upon subsequent larval exposure to sodium azide treatment for 17 h beginning at 6 dpf. Gray brain phenotype was examined at 7 dpf. Three independent biological replicates were performed per condition, with n = 15 zebrafish per condition in each replicate. Error bars indicate SEM. *P < 0.05, **P < 0.01 and ***P < 0.001.
Interestingly, cysteamine bitartrate transcriptional effects in human RC disease fibroblasts were time dependent (Fig. 7). While the 6 h cysteamine bitartrate treatment did not significantly reverse any of the significantly upregulated (Fig. 7A) or downregulated (Fig. 7B) pathways in the RC disease cells, the 24 h cysteamine bitartrate treatment was more effective (Fig. 7C and D). Specifically, the 24 h cysteamine bitartrate treatment significantly normalized the upregulated CAM expression in RC disease cells, with a trend toward partial improvement in several other immune response pathways, including cytokine receptor interaction, B-cell receptor signaling and JAK–STAT signaling (Fig. 7C).
Indeed, significant and near complete expression reversal with cysteamine bitartrate was seen in all downregulated biochemical pathways involving metabolism, cell defenses and DNA metabolism (Fig. 7D). In comparison to C. elegans transcriptome profiling results, cysteamine treatment did not reverse altered expression in glutathione metabolism pathway genes (Supplementary Material, Fig. S9) but did reverse dysregulated expression in several genes encoding key aspartate metabolism pathways (Supplementary Material, Fig. S10). Collectively, these data are suggestive that over time cysteamine bitartrate treatment may transcriptionally modulate the broader metabolic dysfunction, and possibly immune dysregulation, caused by primary RC disease.
Zebrafish pharmacological models of RC complex I and IV disease revealed improved survivorship and neuromuscular phenotypes with cysteamine bitartrate treatment
Recently, we have demonstrated that mitochondrial RC dysfunction can be reproducibly modeled in zebrafish with pharmacological agents, including rotenone and sodium azide to directly inhibit RC chain complexes I and IV, respectively (33). Here, we used the rotenone-induced complex I inhibition zebrafish model to evaluate if cysteamine bitartrate pre-treatment would improve the physiologic and neuromuscular abnormalities associated with pharmacological complex I inhibition. Pre-treatment of AB (WT) zebrafish with 100 μm cysteamine bitartrate from 5 dpf significantly protected 7 dpf zebrafish larvae from a gray brain phenotype indicative of brain death when subsequently exposed to rotenone for 4 h on 7 dpf (P < 0.001) (Fig. 8A and B). Cysteamine bitartrate pre-treatment also significantly preserved both tap and touch responses in these animals (P < 0.01), gross neuromuscular behavior defects resulting from rotenone treatment (33). To validate the efficacy of cysteamine bitartrate in another RC disease animal model, we evaluated its effect in a sodium azide RC complex IV inhibition model (33). Indeed, pre-treatment of AB (WT) zebrafish with 100 μm cysteamine bitartrate from 5 dpf significantly protected 7 dpf zebrafish larvae exposed to sodium azide from 6 dpf from brain death. Specifically, after 16 to 18 h of azide exposure at concentrations of 100 to 125 μm, zebrafish larvae developed a severe gray brain phenotype indicative of brain death, similar as prior observed (Fig. 8C). Remarkably, 100 μm cysteamine bitartrate treatment significantly (P < 0.05) prevented brain death upon azide exposure in this model at both low and high azide concentrations (Fig. 8D). Thus, cysteamine bitartrate provided impressive resiliency at the level of survival benefit and prevention of brain death in the setting of acute RC complex I (rotenone) or complex IV (azide) inhibition in zebrafish vertebrate animal models.
Discussion
Here, we utilized a robust series of complementary model systems across three evolutionarily distinct model species to systematically evaluate the pre-clinical efficacy, toxicity and mechanisms of cysteamine bitartrate as a candidate therapy for primary mitochondrial RC disease. Importantly, toxicity consistently occurred with millimolar levels of cysteamine in C. elegans (worms, invertebrate), Danio rerio (zebrafish, vertebrate) and human fibroblasts, where animal and cell death at these doses directly correlated with increasing hydrogen peroxide production. Subsequent experimental studies of cysteamine bitartrate effects in RC disease models therefore used nanomolar to micromolar range concentrations, which had variable therapeutic efficacy but no clear toxicity. Extensive analyses of cysteamine bitartrate effects that were performed across a wide range of concentrations in the well-characterized gas-1(fc21) complex I RC disease C. elegans worm model showed marginal improvement of animal fecundity without long-term survival benefit. Short-term cysteamine bitartrate treatment in this model did significantly reduce mitochondrial oxidant burden and improve mitochondrial membrane potential, as well as increase aspartate level and isotopic enrichment without inducing a more global metabolic disruption or benefit. Transcriptome profiling in the cysteamine bitartrate-treated complex I disease worm model revealed transcriptional normalization of downregulated ribosome and proteasome pathways at low doses, but failure to normalize globally increased metabolic, glutathione, signaling, and cellular defense pathways. Conversely, in human RC disease fibroblasts, significant and near complete expression reversal with cysteamine bitartrate 24 h treatment occurred in all downregulated biochemical pathways involving intermediary metabolism, glutathione, cellular defenses, and DNA metabolism. Most impressively, cysteamine bitartrate pre-treatment prior to either rotenone or azide exposure significantly improved animal survival and prevented brain death and neuromuscular defects arising from acute RC inhibition in the zebrafish vertebrate animal model.
Reducing oxidative stress is an important treatment strategy in RC disease, although as we have previously suggested, this may relate to total cellular, rather than mitochondrial-matrix specific, oxidant burden (15). Mitochondrial matrix oxidant levels were reduced after 24 h cysteamine bitartrate treatment at micromolar concentrations in the gas-1(fc21) worms, but not in NDUFS8 or FBXL4 RC disease human fibroblasts. Similarly, cysteamine bitartrate treatment up to 4 μm did not rescue the impaired cell viability of RC complex I disease fibroblasts grown in galactose to induce metabolic stress, but did improve viability under stress at 10 μm in FBXL4 disease fibroblasts. Prior studies have demonstrated that cysteamine reduces cellular ROS generation by increasing the intracellular thiol pool (34,35). Indeed, cysteamine bitartrate treatment is expected to increase the availability of cysteine, which is stored primarily in the form of glutathione that functions as a major antioxidant defense throughout the cell (36). While cysteine levels were not measured in either model, total glutathione levels were not increased in RC disease or WT worms by treatment with either cysteamine bitartrate or NAC. Cysteamine bitartrate did fully normalize reduced glutathione metabolism pathway expression in RC disease human fibroblasts but was not effective in rescuing upregulated glutathione metabolism pathway expression in RC disease worms. However, gas-1(fc21) worms have increased expression of glutathione peroxidase, which correlates with the observed increase in oxidative stress in this model, and expression of several glutathione pathway genes were normalized in RC disease mutant worms in a dose-dependent fashion, particularly at 1 and 10 μm concentrations. We postulate that the observed decrease in glutathione peroxidase expression, similar as described in previous studies (20), along with increased glutathione reductase expression, likely results as an adaptation to cysteamine bitartrate-based reduction of the RC disease worms’ increased oxidant burden, necessitating increased GSH to normalize the GSH/GSSG ratio (Fig. 4D). As cysteamine has also been previously shown to normalize the Reduced Glutathione/ Glutathione Disulfide (GSH/GSSG) ratio (16) in cystinotic PTECs, it is plausible that cysteamine bitartrate may also modulate the redox status in RC disease models as well, as opposed to increasing total GSH levels. Future studies are needed to evaluate cysteamine bitartrate treatment effects on glutathione redox balance.
Global transcriptome profiling of cysteamine bitartrate concentration and/or duration effects in RC disease worms and human fibroblasts suggest it alters essential metabolic and cellular pathways that play a crucial role in development, growth and metabolic homeostasis, activities regulated by key nodes in the nutrient-sensing signaling network, including Mitogen-Activated Protein Kinases (MAPK) signaling, ribosomes (translation) and lysosomes (autophagy) (31). Impressively, all significantly downregulated metabolic pathways in RC-deficient FCLs were significantly reversed with 24 h treatment with cysteamine bitartrate, particularly oxidative phosphorylation, the TCA cycle, ribosome biogenesis, and glycolysis. Interestingly, patients with cystinosis were recently shown to have altered mTORC1 signaling in their proximal tubular kidney cells (37), a finding of particular interest given that cysteamine bitartrate is an FDA-approved therapy for this disorder, although cysteamine was ineffective in reversing mTORC1-mediated lysosomal effects during starvation in that model. Similarly, our RC disease worm RNAseq analyses demonstrated that cysteamine bitartrate normalized downregulated expression of the ribosome and proteasome pathways as well as upregulated expression of a key autophagy regulator gene, ATG1, but failed to normalize downregulated lysosome expression. However, in human RC disease cells, cysteamine bitartrate did rescue downregulated expression of ribosome, lysosome and peroxisome pathways. mTORC1 pathway expression as a whole was not significantly dysregulated in either worm or human RC disease models, although significantly increased MAPK expression in gas-1(fc21) worms was not rescued by cysteamine bitartrate treatment. RC disease fibroblasts and C. elegans also showed significant upregulation of multiple immune and cell defense pathways, which is not unexpected since reactive oxygen species induction can activate cytokines, apoptotic cell death (38,39), and nuclear transcription factors such as NF-κB (38,40,41). However, most of these immune responses were not normalized by cysteamine bitartrate treatment in either model. Overall, cysteamine bitartrate showed favorable effects at the transcriptional level on altered ribosome and lysosome expression in both worm and human fibroblast RC disease models but not the signaling pathways that modulate them, with greater overall normalization of global intermediary metabolic pathway effects in human cells than worms.
It is intriguing that cysteamine bitartrate protected zebrafish from both rotenone- and sodium azide-induced brain death and neuromuscular defects. Both rotenone and sodium azide function as severe neurotoxins, where rotenone is a potent inhibitor of RC complex I activity, and azide acts primarily by inhibiting cytochrome C oxidase (CCO, RC complex IV) activity, along with several CYP enzymes that form core parts of various RC complexes. Both complex I and complex IV inhibition have been shown to lead to increased free radical generation (42–45). We have previously shown that rotenone-induced brain death can be ameliorated by treatment with antioxidants NAC and vitamin E (15). Moreover, phytochemical antioxidants have also been shown to be neuroprotective agents against sodium azide-induced oxidative stress (44). These results are suggestive that biochemical upregulation of oxidative stress responses may have a therapeutic role in RC disease neuroprotection, an issue of major clinical importance given the frequency and severity of metabolic strokes that occur particularly at times of intercurrent stress in diverse mitochondrial RC disease patients, in a wide variety of clinical syndromes ranging from Leigh syndrome to mitochondrial encephalomyopathy lactic acidosis and stroke-like episodes syndrome (MELAS) (46–48).
Interestingly, our intermediary metabolite flux analysis revealed that cysteamine bitartrate increased aspartate levels and isotopic enrichment (~2%, APE), which did not occur in NAC treatment. These results suggest that aspartate metabolism was specifically influenced by cysteamine bitartrate treatment. Furthermore, dose-dependent decrease in the expression of both adenylosuccinate synthetase and adenylosuccinate lyase was observed with cysteamine bitartrate, changes expected to prevent the metabolism of aspartate into fumarate, and therefore decrease flux of fumarate into the TCA cycle. TCA cycle pathway expression was significantly dysregulated at baseline in both RC disease worms (upregulated) and human fibroblast (downregulated) models relative to WT controls, representing a major adaptive response to underlying RC dysfunction. Cysteamine bitartrate treatment effects on TCA cycle pathway expression were inversely correlated with dose in RC disease worms, suggesting that decreased anaplerotic flux into the TCA cycle through conversion of aspartate to fumarate might plausibly underlie the observed increase in aspartate levels and isotopic enrichment in RC disease worms.
Overall, these data suggest that cysteamine bitartrate may hold therapeutic potential in RC disease. However, careful consideration will be required to identify safe and effective dosages to further support evaluation of cysteamine bitartrate clinical efficacy in robust clinical trials of human subjects with primary mitochondrial RC disease.
Development of a companion diagnostic for cysteamine bitartrate administration would likely hold strong utility to select patients most likely to benefit from clinical trial participation and guide dose tolerability at the level of cell survival and, potentially, glutathione redox balance. Indeed, demonstration of the safety and preliminary indication of treatment efficacy on in vitro survival of fibroblast cells from individual RC disease subjects would enable a precision medicine approach to select specific cysteamine bitartrate doses that optimize the overall health and resiliency against stressor-induced neurodevelopmental decompensation in mitochondrial disease.
Materials and Methods
C. elegans strain selection and maintenance
The well-characterized RC complex I-deficient C. elegans strain, gas-1(fc21) (26), that harbors a recessive missense mutation in the nuclear-encoded NDUFS2 complex I subunit orthologue was used as a mitochondrial disease model, with experimental results compared to WT nematodes, N2 Bristol. Detailed information about strain characterization can be found at www.wormbase.org and is available publicly at the Caenorhabditis Genetics Center (University of Minnesota, Minneapolis, MN). Animal husbandry was performed at 20°C, as previously described (24).
Lifespan analysis of cysteamine bitartrate effects in YA C. elegans
Cysteamine bitartrate was provided by Raptor Therapeutics as part of an investigator-initiated research project. For most experiments, we prepared 1 m stock solutions of cysteamine bitartrate dissolved in distilled water followed by pH adjustment to ~7.0 with 2 m Tris in order to minimize pH changes in the media, since the solution was found to be highly acidic at pH 3. Cysteamine bitartrate effects were evaluated on NGM agar plates at a range of concentrations and exposure regimens in short-lived gas-1(fc21) worms to evaluate lifespan effects, including (1) treatment initiation at L1 larval stage, (2) treatment initiation at L1 larval stage and redosing the drug on adult day 7, or (3) treatment initiation at the YA stage. Lifespan assays were carried out using standard methods and analyzed in GraphPad Prism 7.04, as previously described (15,24).
Fertility and fecundity rate measurements using WormScan in C. elegans
WormScan analysis was performed to assess the integrated outcome of animal fertility and fecundity (reproductive rates), as previously described (27). N2 (WT) and gas-1(fc21) worms were exposed for 4 days to cysteamine bitartrate at different concentrations. Worm plates were then scanned as described previously (27) and analyzed in GraphPad Prism 7.04.
Relative quantitation of mitochondrial content, mitochondrial membrane potential, and mitochondrial matrix oxidant burden by fluorescence microscopy in C. elegans
The gas-1(fc21) worms were treated with cysteamine bitartrate to assess treatment effects on mitochondrial content using MTG, mitochondrial membrane potential using TMRE and mitochondrial matrix oxidant burden using MitoSOX Red (SOX), using fluorescence microscopy as previously described (23,24). YA-stage gas-1(fc21) worms were assessed per condition, which included co-treating for 24 h with 0.1, 1, 10 or 100 μm cysteamine bitartrate and individually with 10 μm MTG, 10 μm SOX or 10 nm TMRE. Untreated WT N2 and gas-1(fc21) worms were also exposed to only fluorescent dyes as baseline controls. Following addition of cysteamine bitartrate and fluorescent dyes, plates were dried for 1 h after which approximately 60 worms were transferred to each plate and incubated for 24 h at 20°C. Worms were then transferred to plates without dye containing OP50 Escherichia coli and placed at 20°C for 1 h to clear residual fluorescent dye from their guts. Worms were then paralyzed with 25 mm levamisole for imaging on a Leica microscope using NIS-Elements BR 3.0 software (Nikon Instruments, Melville, NY). Fifty animals were imaged per plate using the following exposure times: (1) MTG, 300 ms; (2) SOX, 2 s; and (3) TMRE, 320 ms. Analysis of worm images was performed in FIJI (49), and background subtraction was performed using a rolling ball radius of 500 pixels. Terminal pharyngeal bulbs were manually circled and an average mean intensity was determined for each treatment-dye condition. Calculated data were exported to Microsoft Excel (Microsoft Corporation, Redmond, WA), where standard deviation, standard error and percent change were calculated between gas-1(fc21) treated with cysteamine bitartrate and no treatment. All experiments were performed in independent biological triplicates. Mean fluorescence intensity was normalized to the average intensity in untreated gas-1(fc21) worms exposed to each fluorescent dye. The mean fluorescence intensity between strains under different experimental conditions was compared using the mixed effects analysis of variance, which takes into account the potential batch effect due to samples being experimentally prepared, processed and analyzed on different days by including a batch random effect in the model. Bonferroni correction was used for multiple comparisons. All statistical analyses were performed in SAS 9.3.
Amino acid profiling of steady-state levels by HPLC and isotopic enrichment by GC/MS in adult C. elegans
Stage-synchronized first-day YA populations of gas-1(fc21) worms were fed U-13C6-glucose and treated for 24 hours with water control, cysteamine bitartrate (0.1, 1, 10 or 100 μm) or NAC (2.5 mm). N2 worms were used as WT control and treated with an equal volume of water. All conditions were performed in biological triplicates. Whole worm free amino acids were extracted in 4% perchloric acid with quantification performed by HPLC analysis, as previously described (24,29,50). Briefly, 50 μl of neutralized sample was directly injected into the HPLC with pre-column derivatization with o-phthalaldehyde and fluorescence detection in the Children’s Hospital of Philadelphia Metabolomics Core. Free amino acid levels were calculated by normalizing each amino acid standard to an internal standard (ε-aminocaproic acid, 200 μm final concentration) that was added to the worm mixture during extraction. The ratio of each amino acid standard to the internal standard (ε-aminocaproic acid) was calculated (normalized standard ratio). To determine the level of free amino acids in each sample, the area under each peak was normalized by the following formula: area under peak*100* normalized standard ratio/area under internal standard peak to produced nmol/ml of free amino acid. Finally, amino acid levels were normalized to total worm protein to determine the nmol of amino acid/mg worm protein. The rest of the sample was prepared and analyzed for GC/MS analysis of amino acid enrichment as previously performed in our laboratory (50).
Glutathione analysis using enzymatic assay in C. elegans
Total glutathione levels were quantified in WT N2 Bristol controls and gas-1(fc21) mutant worms treated with varying concentrations of cysteamine bitartrate or NAC. About 2000 YA worms per condition were collected and resuspended in 100 μl of S. basal and were then homogenized with a motorized homogenizer and pestle twice for 2 min each on ice. The homogenate was spun down for 10 min at 9200g and 4°C, the supernatant was collected, and 10% metaphosphoric acid was added in a 1:1 ratio, vortexed for 30 s and kept on ice for 15 min to deproteinize the sample. The sample was spun down for 15 min at 16000g and 4°C, and the supernatant was collected and filtered using a 10 kDa filter into a new Eppendorf tube for 30 min at 25000g and 4°C. Glutathione measurement was carried out as previously described (51). Protein was measured using the bicinchoninic acid method.
C. elegans transcriptome profiling by RNAseq analysis
Samples were prepared for gene expression profiling by RNASeq, as previously described (52). Briefly, WT N2 Bristol and gas-1(fc21) RC complex I disease worms were grown at 20°C on NGM agar plates. Synchronized YA gas-1(fc21) worms were treated for 24 h with water control, 0.1, 1, 10 or 100 μm cysteamine bitartrate, or 2.5 mm NAC as a positive control. N2 WT worms were treated only with water control. Four biological replicate independent experiments were performed for each treatment group. Worm population total RNA was extracted using the Trizol method, DNase-treated and evaluated by Agilent Bioanalyzer to determine the RNA quality at the NapCore Facility at the Children’s Hospital of Philadelphia. RNA integrity number (RIN) was between 8.6 and 10 for all samples. cDNA library preparation was performed using the TruSeq Stranded Total RNA Sample Preparation Kit (Illumina, San Diego, CA). Samples were submitted to BGI @ CHOP Sequencing Core Facility at the Children’s Hospital of Philadelphia Research Institute for Next Generation Sequencing (RNAseq) analysis on an Illumina HiSeq 2000 instrument. On average, about 35 million reads were obtained from each RNAseq library and ~82% of the reads were uniquely mapped to known worm genes. Samples were processed and transcriptome analyses were performed, as previously described (19). Paired-end RNAseq reads were aligned to the ws235 reference genome and transcriptome using the STAR program. Processed data of all samples met basic quality requirements. RNAseq data were submitted in MIAMI compliant format to Gene Expression Omnibus (GEO GSE119723). Curated RNAseq data are also available for interrogation at the AWSomics website: http://awsomics.org/project/mito1/.
Hydrogen peroxide (H2O2) production quantitation in human cell culture media by Amplex Red analysis
Primary human fibroblast cell lines from a healthy parental control (Q1508p1) and RC complex I disease subject (Q1508 line, NDUFS8 compound heterozygous for c.160C>T;p.R54W and c.58>C;p.G20R) were incubated for 24 h with 0, 1 μm, 10 μm, 100 μm, 1 mm and 10 mm cysteamine bitartrate. Cell-free control conditions also included fibroblast medium with or without serum. H2O2 levels were determined using the Amplex Red Hydrogen Peroxide Assay Kit (catalog number: A22188; Invitrogen Molecular Probes, Carlsbad, CA). Values were averaged over three technical and three biological replicates (except serum free media only N = 2). Student’s t-test was performed to compare the H2O2 level at each cysteamine bitartrate concentration with the control condition.
Viability analysis by CellTiter-Glo Luminescent Cell Viability Assay in human mitochondrial disease fibroblasts
Fibroblast cell lines derived from human healthy controls and subjects with genetically-confirmed primary RC disease were cultured using standard methods, as previously described (15,24). Specific cell lines studied had mutations in a nuclear gene, FBXL4 (c.1067delG;p.G356AfsX15 and c.1790A>C; p.Q597P)] or mtDNA gene, MT-ND5 m.13513G>A heteroplasmy]. A total of 100 μl of 6000 cells per well were pipetted with standard growth medium (1 g/l glucose, 0.8 g/l glutamine, 110 mg/l sodium pyruvate, 10% Fetal Bovine Serum (FBS) serum, 0.2 mm uridine) in a 96-well plate and seeded overnight to reach 70% confluency. Next day, cells were washed in Phosphate-Buffered Saline (PBS) 1× and incubated for 48 h in stressor-treatment media: 3 mm chloramphenicol and 10, 100 or 500 μm concentrations of cysteamine diluted in standard growth media. After 48 h exposure, CellTiter-Glo reagent (Promega Corporation, Madison, WI, G7571) was added at equal volumes (100 μl) to total media in each well at room temperature, plates were placed on a shaker for 2 min, then incubated at room temperature for 10 min. Luminescence was recorded at 590/35 nm using a Synergy HTX Multi-Mode Reader (BioTek US, Winooski, VT). Three biological and nine technical replicates/conditions were obtained; all data were normalized for the luminescence detected in cells incubated in standard grow media. All data are expressed as mean ± SEM; significance was calculated by Student’s t-test using GraphPad Prism 7.04.
Mitochondrial physiology analysis by FACS in human mitochondrial disease fibroblasts
Fibroblasts were trypsinized and collected in cell growth media (DMEM 1 g/l glucose, 10% FBS, 50ug/ml uridine), centrifuged and resuspended in DMEM to obtain 1–5 × 10⁵ cells per sample, as previously reported (53). Samples were loaded with either 50 nm MTG or 40 nm TMRE at 37°C for 30 min, or 5 μm MitoSOX 37°C for 10 min. Cells then were washed with PBS twice and resuspended in 400 μL PBS. FACS was performed with an Accuri C6 flow cytometer (BD Biosciences, San Jose, CA) equipped with a 488 nm laser with 530/30 nm emission (FL-1) for MTG, 585/42 nm emission (FL-2) for TMRE and 647/52 nm emission (FL-3) for MitoSOX. A total of 10000 events were recorded per condition.
Transcriptome profiling by RNAseq analysis in human mitochondrial disease fibroblasts
Fibroblast cell lines from healthy human controls (Q1269p1 and Q1508p1) and three primary RC disease subjects with pediatric-onset Leigh syndrome including (1) Q1007 (FBXL4, c.1067delG;p.G356AfsX15 and c.1790A>C;p.Q597P) with complex I–III dysfunction (30), (2) Q1508 (NDUFS8, c.160C>T;p.R54W and c.58>C;p.G20R) with complex I dysfunction, and (3) Q1039 (MT-ND4, m.11778G>A heteroplasmy + MT-ND6 m.14484T>C homoplasmy) with complex I dysfunction (31) were grown in media containing DMEM 1 g/l glucose, 10% FBS and 50 μg/ml uridine. RC disease cells at passage 9 were treated at 90% confluence with 0.5 μm cysteamine bitartrate for either 6 or 24 h, with buffer-only RC disease and control cells concurrently prepared. Total RNA was extracted using Trizol, DNase-treated and analyzed by Agilent Bioanalyzer to assess RNA quality. RIN scores between 7.7 and 9.6 were achieved for all samples. cDNA library preparation was performed using the TruSeq Stranded Total RNA Sample Preparation Kit (Illumina, San Diego, CA). Samples were submitted to BGI @ CHOP Sequencing Core Facility at the Children’s Hospital of Philadelphia Research Institute for Next Generation Sequencing (RNAseq) analysis on an Illumina HiSeq 2000 instrument. On average, over 60 million reads were obtained from each RNAseq library and nearly 60% of the reads were uniquely mapped to known human genes. Samples were processed and transcriptome analyses were performed, as previously described (19). Paired-end RNAseq reads were aligned to the GRCh38 reference genome and transcriptome using the STAR program. Processed data of all samples met basic quality requirements. RNAseq data were submitted in MIAMI compliant format to Gene Expression Omnibus (GEO GSE119723). Curated RNAseq data are also available for interrogation at the AWSomics website: http://awsomics.org/project/mito1/.
Viability, brain death and neuromuscular assessment in rotenone-induced RC complex I and sodium azide-induced RC complex IV-deficient D. rerio (zebrafish)
All protocols and methods were performed in accordance with CHOP IACUC number 18-001154 regulations for care and use of D. rerio at the Children’s Hospital of Philadelphia Research Institute. Embryos and larvae were maintained at 28°C throughout the duration of experiments. Adult zebrafish (AB strain) were set pairwise in undivided mating tanks, with resulting embryos collected and sorted on 0 days post-fertilization (0 dpf) and placed in embryo water (E3) in a 28°C incubator overnight. On 1 dpf, embryos were sorted to remove non-viable embryos, sanitized with sodium hypochlorite and treated with pronase by standard methods to promote uniform hatching. On 2 dpf, pronase was removed and larvae were placed in E3 with phenylthiourea (PTU) at 0.03 μg/l for all experiments to prevent larval pigment formation. Unless otherwise specified, all reagents were obtained from Sigma-Aldrich (St Louis, MO, USA). For the rotenone-induced RC complex I inhibition model, AB strain zebrafish larvae were pre-treated with 100 μm cysteamine bitartrate at 5 dpf. Rotenone stock solutions (1 mm) were prepared in DMSO. Cysteamine bitartrate stock solutions (100 mm) were prepared in E3 with 10 mm Tris, pH 7.2. Zebrafish were co-exposed to cysteamine bitartrate and 125 nm rotenone for ~4 h on 7 dpf in 10 mm Tris, pH 7.2 and 0.1% DMSO, and larvae were scored for toxic effects. For the sodium azide-induced RC complex IV inhibition model, AB strain zebrafish were pre-treated as larvae at 5 dpf with 0 or 100 μm cysteamine bitartrate in E3 with PTU at 0.03 μg/l, 10 mm Tris and 0.1% DMSO. At 6 dpf, these zebrafish larvae were co-treated with the potent RC complex IV inhibitor sodium azide (75–125 μm) in E3 with PTU at 0.03 μg/l, 10 mm Tris and 0.1% DMSO. After 16–18 h of sodium azide exposure either with or without cysteamine bitartrate pre-treatment, larvae were scored on 7 dpf for toxic effects.
For both models, viability was scored by presence or absence of a gray brain phenotype, representing brain death (33). Tap and touch response were scored as previously described (33), where the larvae with gray brains were unresponsive to stimuli such as tapping the culture dish or directly touching the larvae with a probe. While slow heartbeats were observed in some fish with gray brains, none recovered normal swimming activity or neuromuscular behavioral responses and were therefore scored as non-surviving. After scoring, surviving fish were euthanized by immersion in ice water. Statistical analysis was undertaken of at least three independent biological replicates per condition using Student’s t-test using GraphPad Prism 7.04.
Supplementary Material
Acknowledgements
We are grateful to Evgueni Daikhin, MD, PhD, and Ilana Nissim for their assistance with sample analysis in the Children’s Hospital of Philadelphia Metabolomics Core Facility; James Byrnes, PhD, for assistance with preliminary data organization and review; and Heeyong Yoon, PhD, and Elizabeth T. Herman for assistance with zebrafish husbandry.
Conflict of Interest statement. None declared.
Funding
Raptor Pharmaceuticals (research-investigated research award to M.J.F.), The Juliet’s Cure Mitochondrial Disease Research Fund; Will Woleben Research Fund; and the National Institutes of Health (R01-HD065858, R01-GM120762 and T32-NS007413). The content is solely the responsibility of the authors and does not necessarily represent the official views of the National Institutes of Health.
Author contributions
M.J.F. conceived and designed the study. J.O. and S.G. performed lifespan analysis in C. elegans. N.D.M. performed WormScan analysis in C. elegans. J.O., E.P. and M.B. performed biochemical studies. Y.J.K. performed fluorescence analyses of mitochondrial physiology in C. elegans. E.N.O. and C.K. performed glutathione analysis studies. E.P. performed RNAseq library sample preparation in cells and C. elegans, with bioinformatics analysis by Z.Z. M.P. and M.L. performed cell viability analyses. M.P. performed mitochondrial fluorescence analyses in FCLs. R.L., N.D.M., M.L. and C.S. performed zebrafish studies. R.X. assisted with statistical analyses. S.G., C.K. E.N.O., and M.J.F. wrote the manuscript. All authors approved of the final version.
References
- 1. Wallace D.C., Singh G., Lott M.T., Hodge J.A., Schurr T.G., Lezza A.M., Elsas L.J. and Nikoskelainen E.K. (1988) Mitochondrial DNA mutation associated with Leber’s hereditary optic neuropathy. Science, 242, 1427–1430. [DOI] [PubMed] [Google Scholar]
- 2. Holt I.J., Harding A.E. and Morgan-Hughes J.A. (1988) Deletions of muscle mitochondrial DNA in patients with mitochondrial myopathies. Nature, 331, 717–717. [DOI] [PubMed] [Google Scholar]
- 3. Muraresku C.C., McCormick E.M. and Falk M.J. (2018) Mitochondrial disease: advances in clinical diagnosis, management, therapeutic development, and preventative strategies. Curr. Genet. Med. Rep., 6, 62–72. [DOI] [PMC free article] [PubMed] [Google Scholar]
- 4. Rahman J. and Rahman S. (2018) Mitochondrial medicine in the omics era. Lancet, 391, 2560–2574. [DOI] [PubMed] [Google Scholar]
- 5. Wortmann S.B., Koolen D.A., Smeitink J.A., Heuvel L. and Rodenburg R.J. (2015) Whole exome sequencing of suspected mitochondrial patients in clinical practice .J. Inherit. Metab. Dis., 38, 437–443. [DOI] [PMC free article] [PubMed] [Google Scholar]
- 6. Haas R.H., Parikh S., Falk M.J., Saneto R.P., Wolf N.I., Darin N., Wong L.J., Cohen B.H. and Naviaux R.K. (2008) The in-depth evaluation of suspected mitochondrial disease. Mol. Genet. Metab., 94, 16–37. [DOI] [PMC free article] [PubMed] [Google Scholar]
- 7. Niyazov D.M., Kahler S.G., Frye R.E. (2016) Primary mitochondrial disease and secondary mitochondrial dysfunction: Importance of distinction for diagnosis and treatment. Mol. Syndromol., 7, 122–137. [DOI] [PMC free article] [PubMed] [Google Scholar]
- 8. McCormick E.M., Muraresku C.C. and Falk M.J. (2018) Mitochondrial genomics: a complex field now coming of age. Curr. Genet. Med. Rep., 6, 52–61. [DOI] [PMC free article] [PubMed] [Google Scholar]
- 9. Zolkipli-Cunningham Z., Xiao R., Stoddart A., McCormick E.M., Holberts A., Burrill N., McCormack S., Williams L., Wang X., Thompson J.L.P. et al. (2018) Mitochondrial disease patient motivations and barriers to participate in clinical trials. PLoS One, 13, e0197513–e0197513. [DOI] [PMC free article] [PubMed] [Google Scholar]
- 10. Camp K.M., Krotoski D., Parisi M.A., Gwinn K.A., Cohen B.H., Cox C.S., Enns G.M., Falk M.J., Goldstein A.C., Gopal-Srivastava R. et al. (2016) Nutritional interventions in primary mitochondrial disorders: developing an evidence base. Mol. Genet. Metab., 119, 187–206. [DOI] [PMC free article] [PubMed] [Google Scholar]
- 11. Enns G.M. (2014) Treatment of mitochondrial disorders: antioxidants and beyond. J. Child Neurol., 29, 1235–1240. [DOI] [PubMed] [Google Scholar]
- 12. Kanabus M., Heales S.J. and Rahman S. (2014) Development of pharmacological strategies for mitochondrial disorders. Br. J. Pharmacol., 171, 1798–1817. [DOI] [PMC free article] [PubMed] [Google Scholar]
- 13. Enns G.M. (2003) The contribution of mitochondria to common disorders. Mol. Genet. Metab., 80, 11–26. [DOI] [PubMed] [Google Scholar]
- 14. Kayser E.B., Sedensky M.M. and Morgan P.G. (2004) The effects of complex I function and oxidative damage on lifespan and anesthetic sensitivity in Caenorhabditis elegans. Mech. Ageing Dev., 125, 455–464. [DOI] [PubMed] [Google Scholar]
- 15. Polyak E., Ostrovsky J., Peng M., Dingley S.D., Tsukikawa M., Kwon Y.J., McCormack S.E., Bennett M., Xiao R., Seiler C. et al. (2018) N-acetylcysteine and vitamin E rescue animal longevity and cellular oxidative stress in pre-clinical models of mitochondrial complex I disease. Mol. Genet. Metab., 123, 449–462. [DOI] [PMC free article] [PubMed] [Google Scholar]
- 16. Wilmer M.J., Kluijtmans L.A.J., Velden T.J., Willems P.H., Scheffer P.G., Masereeuw R., Monnens L.A., Heuvel L.P. and Levtchenko E.N. (2011) Cysteamine restores glutathione redox status in cultured cystinotic proximal tubular epithelial cells. BBA-Mol. Cell. Res. ,1812, 643–651. [DOI] [PubMed] [Google Scholar]
- 17. Djurhuus R., Svardal A.M. and Ueland P.M. (1990) Cysteamine increases homocysteine export and glutathione content by independent mechanisms in C3H/10T1/2 cells. Mol. Pharmacol., 38, 327–332. [PubMed] [Google Scholar]
- 18. Fleck R.M.M., Junior V.R., Giacomazzi J., Parissoto D., Dutra-Filho C.S., Souza Wyse A.T., Wajner M. and Wannmacher C.M.D. (2005) Cysteamine prevents and reverses the inhibition of creatine kinase activity caused by cystine in rat brain cortex. Neurochem. Int., 46, 391–397. [DOI] [PubMed] [Google Scholar]
- 19. Peng M., Ostrovsky J., Kwon Y.J., Polyak E., Licata J., Tsukikawa M., Marty E., Thomas J., Felix C.A., Xiao R. et al. (2015) Inhibiting cytosolic translation and autophagy improves health in mitochondrial disease. Hum. Mol. Genet., 24, 4829–4847. [DOI] [PMC free article] [PubMed] [Google Scholar]
- 20. Jeitner T.M. and Lawrence D.A. (2001) Mechanisms for the cytotoxicity of cysteamine. Toxicol. Sci., 63, 57–64. [DOI] [PubMed] [Google Scholar]
- 21. Loschen G. and Flohé L. (2018) Respiratory chain linked H2O2 production in pigeon heart mitochondria. FEBS Lett., 18, 261–264. [DOI] [PubMed] [Google Scholar]
- 22. Gerriet L., Angelo A., Christoph R. and Leopold F. (2018) Superoxide radicals as precursors of mitochondrial hydrogen peroxide. FEBS Lett., 42, 68–72. [DOI] [PubMed] [Google Scholar]
- 23. Dingley S., Polyak E., Lightfoot R., Ostrovsky J., Rao M., Greco T., Ischiropoulos H. and Falk M.J. (2010) Mitochondrial respiratory chain dysfunction variably increases oxidant stress in Caenorhabditis elegans. Mitochondrion, 10, 125–136. [DOI] [PMC free article] [PubMed] [Google Scholar]
- 24. McCormack S., Polyak E., Ostrovsky J., Dingley S.D., Rao M., Kwon Y.J., Xiao R., Zhang Z., Nakamaru-Ogiso E. and Falk M.J. (2015) Pharmacologic targeting of sirtuin and PPAR signaling improves longevity and mitochondrial physiology in respiratory chain complex I mutant Caenorhabditis elegans. Mitochondrion, 22, 45–59. [DOI] [PMC free article] [PubMed] [Google Scholar]
- 25. Guha S., Natarajan O., Murbach C.G., Dinh J., Wilson E.C., Cao M., Zou S. and Dong Y. (2014) Supplement timing of cranberry extract plays a key role in promoting Caenorhabditis elegans healthspan. Nutrients, 6, 911–921. [DOI] [PMC free article] [PubMed] [Google Scholar]
- 26. Kayser E.B., Morgan P.G. and Sedensky M.M. (1999) GAS-1 A mitochondrial protein controls sensitivity to volatile anesthetics in the nematode Caenorhabditis elegans. Anesthesiology, 90, 545–554. [DOI] [PubMed] [Google Scholar]
- 27. Mathew M.D., Mathew N.D., Miller A., Simpson M., Au V., Garland S., Gestin M., Edgley M.L., Flibotte S., Balgi A. et al. (2016) Using C. elegans forward and reverse genetics to identify new compounds with anthelmintic activity. PLoS Negl. Trop. Dis., 10, e0005058. [DOI] [PMC free article] [PubMed] [Google Scholar]
- 28. Falk M.J., Zhang Z., Rosenjack J.R., Nissim I., Daikhin E., Nissim I., Sedensky M.M., Yudkoff M. and Morgan P.G. (2008) Metabolic pathway profiling of mitochondrial respiratory chain mutants in C. elegans. Mol. Genet. Metab., 93, 388–397. [DOI] [PMC free article] [PubMed] [Google Scholar]
- 29. Vergano S.S., Rao M., McCormack S., Ostrovsky J., Clarke C., Preston J., Bennett M.J., Yudkoff M., Xiao R. and Falk M.J. (2014) In vivo metabolic flux profiling with stable isotopes discriminates sites and quantifies effects of mitochondrial dysfunction in C. elegans. Mol. Genet. Metab., 111, 331–341. [DOI] [PMC free article] [PubMed] [Google Scholar]
- 30. Gai X., Ghezzi D., Johnson M.A., Biagosch C.A., Shamseldin H.E., Haack T.B., Reyes A., Tsukikawa M., Sheldon C.A., Srinivasan S. et al. (2013) Mutations in FBXL4, encoding a mitochondrial protein, cause early-onset mitochondrial encephalomyopathy. Am. J. Hum. Genet., 93, 482–495. [DOI] [PMC free article] [PubMed] [Google Scholar]
- 31. Zhang Z., Tsukikawa M., Peng M., Polyak E., Nakamaru-Ogiso E., Ostrovsky J., McCormack S., Place E., Clarke C., Reiner G. et al. (2013) Primary respiratory chain disease causes tissue-specific dysregulation of the global transcriptome and nutrient-sensing signaling network. PLoS One, 8, e69282. [DOI] [PMC free article] [PubMed] [Google Scholar]
- 32. Zhang Z. and Falk M.J. (2014) Integrated transcriptome analysis across mitochondrial disease etiologies and tissues improves understanding of common cellular adaptations to respiratory chain dysfunction. Int. J. Biochem. Cell Biol., 50, 106–111. [DOI] [PMC free article] [PubMed] [Google Scholar]
- 33. Byrnes J., Ganetzky R., Lightfoot R., Tzeng M., Nakamaru-Ogiso E., Seiler C. and Falk M.J. (2018) Pharmacologic modeling of primary mitochondrial respiratory chain dysfunction in zebrafish. Neurochem. Int., 117, 23–34. [DOI] [PMC free article] [PubMed] [Google Scholar]
- 34. Okamura D.M., Bahrami N.M., Ren S., Pasichnyk K., Williams J.M., Gangoiti J.A., Lopez-Guisa J.M., Yamaguchi I., Barshop B.A., Duffield J.S. et al. (2014) Cysteamine modulates oxidative stress and blocks myofibroblast activity in CKD. J. Am. Soc. Nephrol., 25, 43–54. [DOI] [PMC free article] [PubMed] [Google Scholar]
- 35. Kessler A., Biasibetti M., Silva Melo D.A., Wajner M., Dutra-Filho C.S., Souza Wyse Â.T. and Wannmacher C.M.D. (2008) Antioxidant effect of cysteamine in brain cortex of young rats. Neurochem. Res., 33, 737–744. [DOI] [PubMed] [Google Scholar]
- 36. Meister A., Anderson M.E. and Hwang O. (1986) Intracellular cysteine and glutathione delivery systems. J. Am. Coll. Nutr., 5, 137–151. [DOI] [PubMed] [Google Scholar]
- 37. Ivanova E.A., Heuvel L.P., Elmonem M.A., De Smedt H., Missiaen L., Pastore A., Mekahli D., Bultynck G. and Levtchenko E.N. (2016) Altered mTOR signalling in nephropathic cystinosis. J. Inherit. Metab. Dis., 39, 457–464. [DOI] [PubMed] [Google Scholar]
- 38. Brambilla D., Mancuso C., Scuderi M.R., Bosco P., Cantarella G., Lempereur L., Di Benedetto G., Pezzino S. and Bernardini R. (2008) The role of antioxidant supplement in immune system, neoplastic, and neurodegenerative disorders: a point of view for an assessment of the risk/benefit profile. Nutr. J., 7, 29–29. [DOI] [PMC free article] [PubMed] [Google Scholar]
- 39. Jabs T. (1999) Reactive oxygen intermediates as mediators of programmed cell death in plants and animals. Biochem. Pharmacol., 57, 231–245. [DOI] [PubMed] [Google Scholar]
- 40. Bedogni B., Pani G., Colavitti R., Riccio A., Borrello S., Murphy M., Smith R., Eboli M.L. and Galeotti T. (2003) Redox regulation of cAMP-responsive element-binding protein and induction of manganous superoxide dismutase in nerve growth factor-dependent cell survival. J. Biol. Chem., 278, 16510–16519. [DOI] [PubMed] [Google Scholar]
- 41. Schulze-Osthoff K., Beyaert R., Vandevoorde V., Haegeman G. and Fiers W. (1993) Depletion of the mitochondrial electron transport abrogates the cytotoxic and gene-inductive effects of TNF. EMBO J., 12, 3095–3104. [DOI] [PMC free article] [PubMed] [Google Scholar]
- 42. Salmela Katja T.I. and Charles L. (2006) Azide inhibits human cytochrome P-4502E1, 1A2, and 3A4. Alcohol. Clin. Exp. Res., 25, 253–260. [PubMed] [Google Scholar]
- 43. Valmas N., Zuryn S. and Ebert P.R. (2008) Mitochondrial uncouplers act synergistically with the fumigant phosphine to disrupt mitochondrial membrane potential and cause cell death. Toxicology, 252, 33–39. [DOI] [PubMed] [Google Scholar]
- 44. Unitt D.C., Hollis V.S., Palacios-Callender M., Frakich N. and Moncada S. (2010) Inactivation of nitric oxide by cytochrome c oxidase under steady-state oxygen conditions. Biochim. Biophys. Acta, 1797, 371–377. [DOI] [PubMed] [Google Scholar]
- 45. Li N., Ragheb K., Lawler G., Sturgis J., Rajwa B., Melendez J.A. and Robinson J.P. (2003) Mitochondrial complex I inhibitor rotenone induces apoptosis through enhancing mitochondrial reactive oxygen species production. J. Biol. Chem., 278, 8516–8525. [DOI] [PubMed] [Google Scholar]
- 46. Lake N.J., Compton A.G., Rahman S. and Thorburn D.R. (2015) Leigh syndrome: one disorder, more than 75 monogenic causes. Ann. Neurol., 79, 190–203. [DOI] [PubMed] [Google Scholar]
- 47. Tranah G.J., Katzman S.M., Lauterjung K., Yaffe K., Manini T.M., Kritchevsky S., Newman A.B., Harris T.B. and Cummings S.R. (2018) Mitochondrial DNA m.3243A>G heteroplasmy affects multiple aging phenotypes and risk of mortality. Sci. Rep., 8, 11887–11887. [DOI] [PMC free article] [PubMed] [Google Scholar]
- 48. Ganetzky R.D. and Falk M.J. (2018) 8-year retrospective analysis of intravenous arginine therapy for acute metabolic strokes in pediatric mitochondrial disease. Mol. Genet. Metab., 123, 301–308. [DOI] [PMC free article] [PubMed] [Google Scholar]
- 49. Schindelin J., Arganda-Carreras I., Frise E., Kaynig V., Longair M., Pietzsch T., Preibisch S., Rueden C., Saalfeld S., Schmid B. et al. (2012) Fiji: an open-source platform for biological image analysis. Nat. Methods, 9, 676–682. [DOI] [PMC free article] [PubMed] [Google Scholar]
- 50. Falk M.J., Rao M., Ostrovsky J., Daikhin E., Nissim I. and Yudkoff M. (2011) Stable isotopic profiling of intermediary metabolic flux in developing and adult stage Caenorhabditis elegans. J. Vis. Exp., 48, 2288–2288. [DOI] [PMC free article] [PubMed] [Google Scholar]
- 51. Caito S.W. and Aschner M. (2015) Quantification of glutathione in Caenorhabditis elegans. Curr. Protoc. Toxicol., 64, 6.18.1–16.18.6. [DOI] [PMC free article] [PubMed] [Google Scholar]
- 52. Polyak E., Zhang Z. and Falk M.J. (2012) Molecular profiling of mitochondrial dysfunction in Caenorhabditis elegans. Methods Mol. Biol., 837, 241–255. [DOI] [PMC free article] [PubMed] [Google Scholar]
- 53. Dingley S., Chapman K.A. and Falk M.J. (2012) Fluorescence-activated cell sorting analysis of mitochondrial content, membrane potential, and matrix oxidant burden in human lymphoblastoid cell lines. Methods Mol. Biol., 837, 231–239. [DOI] [PMC free article] [PubMed] [Google Scholar]
Associated Data
This section collects any data citations, data availability statements, or supplementary materials included in this article.