Abstract
Emerging evidence revealed important roles of tumor neoantigens in generating spontaneous antitumor immune responses and predicting clinical responses to immunotherapies1,2. Despite the presence of numerous neoantigens, complete tumor elimination rarely occurs in many patients, due to failures in mounting a sufficient and lasting antitumor immune response3,4. Here, we show that durable neoantigen-specific immunity is regulated by messenger RNA (mRNA) N6-methyadenosine (m6A) methylation through the m6A-binding protein YTHDF15. In contrast to wild-type mice, Ythdf1-deficient (Ythdf1−/−) mice exhibit an elevated antigen-specific CD8+ T cell antitumor response. Loss of YTHDF1 in classical dendritic cells (cDCs) enhanced the cross-presentation of tumor antigen and the cross-priming of CD8+ T cells in vivo. Mechanistically, transcripts encoding lysosomal proteases are marked by m6A and recognized by YTHDF1. Binding of YTHDF1 to these transcripts elevates translation of lysosomal cathepsins in DCs, with the inhibition of cathepsins markedly enhancing cross-presentation of the wild-type DCs. Furthermore, the therapeutic efficacy of PD-L1 checkpoint blockade is enhanced in Ythdf1−/− mice, implicating YTHDF1 as a new potential therapeutic target in anticancer immunotherapy.
Spontaneous T cell priming against tumor neoantigens is critical for the clinical efficacy of immunotherapies. However, in many patients, neoantigen recognition is insufficient to induce the lasting T cell response required for complete tumor rejection. Identifying molecular pathways that influence the immunoreactivity to tumor neoantigen could provide new targets for improving the response to immunotherapy.
m6A, the most abundant internal mRNA modification, is responsible for posttranscriptional regulation of mRNA in diverse cell types6-10. m6A can affect mRNA translation efficiency via the m6A-binding protein YTHDF15. Dysregulation of m6A pathway components could affect oncogene expression, revealing a link between m6A and tumorigenesis11-14. As most studies focus on tumor intrinsic oncogenic pathways, potential roles of the mRNA m6A modification in host antitumor immune response are unknown. Further, the roles of various m6A reader proteins in cancer remain largely unexplored.
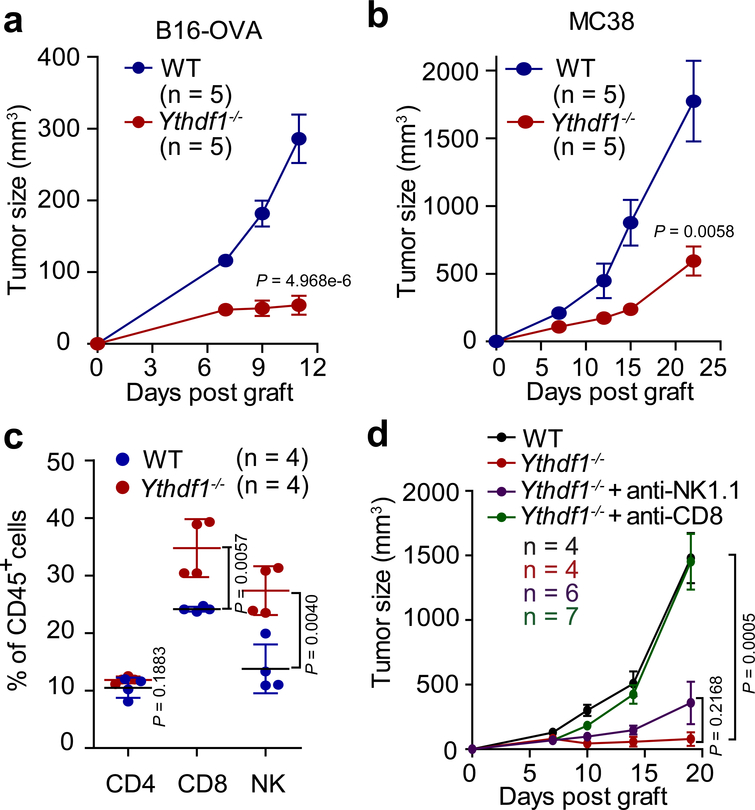
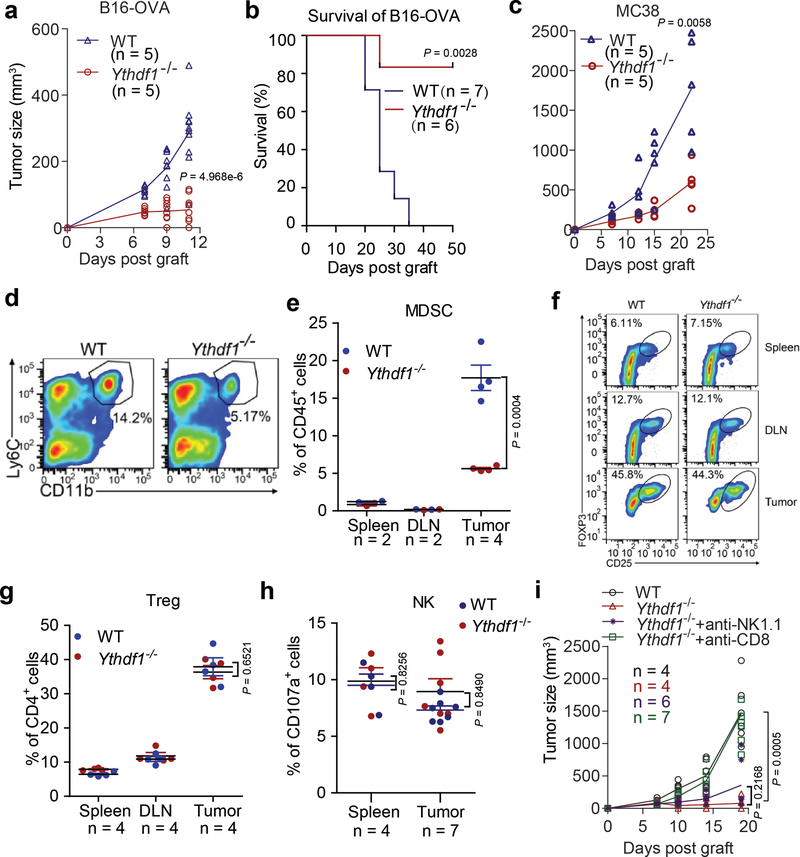
We employed the Ythdf1 knockout mice15 (Extended Data Fig. 1) and inoculated ovalbumin (OVA)-expressing B16 melanoma cells subcutaneously (s.c.) into WT and Ythdf1−/− mice. Compared to WT mice, Ythdf1−/− mice showed slower growth of B16-OVA tumors and prolonged survival (Fig. 1a, Extended Data Fig. 2a, b). We also tested a MC38 colon carcinoma model, which has been recently reported to have a broader neoantigen pool16. Consistently, we observed a similar level of tumor inhibition in Ythdf1−/− relative to WT mice (Fig. 1b, Extended Data Fig. 2c). We analyzed immune infiltrates, and observed higher levels of CD8+ cytotoxic T cells and natural killer (NK) cells in tumors from Ythdf1−/− mice compared to WT mice, suggesting that an enhanced immunosurveillance occurs in the absence of YTHDF1 (Fig. 1c). Accordingly, we observed a reduced infiltration of myeloid-derived suppressor cells (MDSC) in tumors of Ythdf1−/− mice (Extended Data Fig. 2d, e), whereas there was no significant difference in Treg (Extended Data Fig. 2f, g). Both CD8+ T cells and NK cells are critical for controlling tumor growth17, therefore we dissected their contributions to the anti-tumor response in Ythdf1−/− mice. NK cells from WT and Ythdf1−/− mice showed similar degranulation responses (Extended Data Fig. 2h), and antibody-mediated depletion of NK cells had no effect on tumor growth in Ythdf1−/− mice (Fig. 1e, Extended Data Fig. 2i). In contrast, the anti-tumor response in Ythdf1−/− mice was completely abrogated in the absence of CD8+ T cells (Fig. 1e, Extended Data Fig. 2i), indicating that CD8+ T cells are essential for tumor control in the Ythdf1-deficient host.
Figure 1 |. Ythdf1−/− mice shows effective tumor control dependent on CD8+ T cells.
a, WT or Ythdf1−/− mice were injected s.c. with 106 B16-OVA cells. Tumor growth were monitored. One of three representative experiments is shown. b, WT or Ythdf1−/− mice were injected s.c. with 106 MC38 cells. Tumor growth was monitored. One of three representative experiments is shown. c, Percentage of tumor-infiltrating T cells and NK cells at day 12 post tumor inoculation. d, WT or Ythdf1−/− mice were injected s.c. with 106 B16-OVA cells. 200 μg of CD8- or NK-depleting antibody were administered twice a week starting on day 0. Tumor size was monitored overtime. n, numbers of mice. Data are mean ± s.e.m. and were analyzed by two-tailed unpaired Student’s t-test.
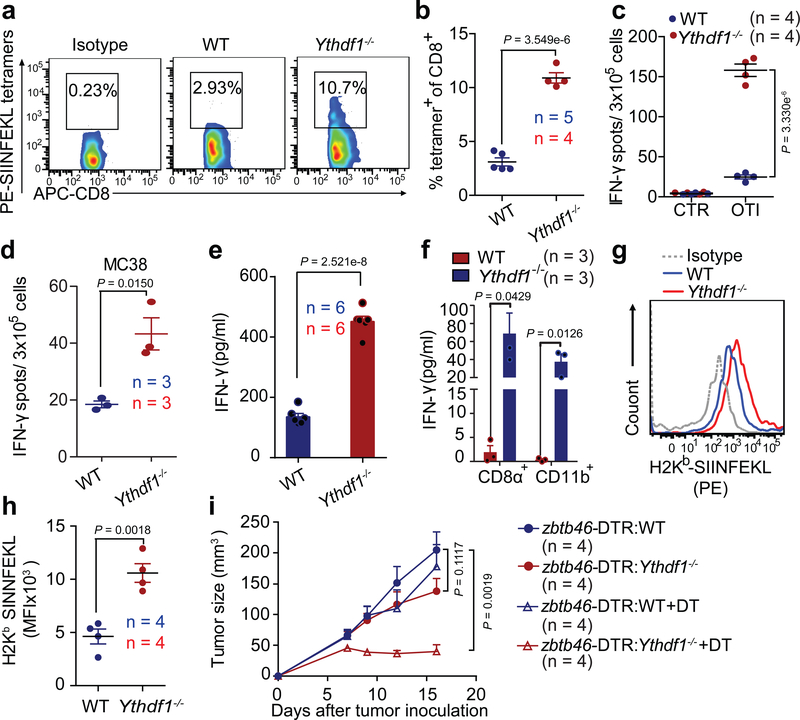
To determine whether neoantigen-specific CD8+ T cell responses are generated in B16-OVA tumors, we analyzed the frequency of tumor-infiltrating SIINFEKL MHC-I tetramer+ CD8+ T cells in WT and Ythdf1−/− mice. While WT mice failed to accumulate antigen-specific CD8+ T cells within the tumor, Ythdf1−/− showed a substantially increased CD8+ T cells against tumor neoantigen in vivo relative to WT mice (Fig. 2a, b). To investigate whether the infiltration of neoantigen-specific CD8+ T cells in Ythdf1−/− mice is due to enhanced spontaneous CD8+ T cell priming at an early stage, we stimulated lymphocytes from tumor-draining lymph node in vitro, with or without the OVA-derived SIINFEKL peptide or tumor cells, and measured endogenous CD8+ T-cell responses using IFN-γ ELISPOT. Significantly more IFN-γ spot-forming cells were present in Ythdf1−/− mice than in WT mice in both B16-OVA and MC38 tumor models (Fig. 2c, d), indicating that YTHDF1 depletion in host cells potentiates the early steps of T-cell priming against tumor neoantigens.
Figure 2 |. Cross-priming capacity of DC is enhanced in Ythdf1−/− mice.
a-c, WT or Ythdf1−/− mice were injected s.c. with 106 B16-OVA cells. The frequency of tumor-infiltrating OVA-Specific CD8+ T cells was assessed 12 days post tumor inoculation (a-b). Six days post tumor inoculation, lymphocytes from DLN were isolated and stimulated with 10 μg/ml OTI peptide. IFN-γ–producing cells were enumerated by ELISPOT assay (c). d, WT or Ythdf1−/− mice were injected s.c. with 106 MC38 cells. Six days post tumor inoculation, lymphocytes from DLN were isolated and stimulated with irradiated MC38 cells for 48 hours. e, Flt3L-DCs were co-cultured with necrotic B16-OVA overnight, and B220− CD11c+ cells were purified and co-cultured with OT-I T cells. IFN-γ production was assessed by IFN-γ cytometric bead array. Data are representative of six biological replicates. f, 6 days after tumor inoculation, CD8+ or CD11b+ DCs were sorted from draining LNs. DCs were co-cultured with isolated OT-I cells for 3 days and analyzed by IFN-γ CBA. g-h, Formation of H-2Kb-SIINFEKL on tumor-infiltrating DCs from B16-OVA tumor-bearing WT and Ythdf1−/− mice (g). Mean fluoresce intensity (MFI) is shown (h). i, WT mice were transferred with WT or Ythdf1−/− bone marrow cells (BMCs) mixed with Zbtb46-DTR BMCs in 1:1 ratio. Six weeks after bone marrow chimera reconstitution, mice were injected s.c. with 1×10⁶ B16-OVA cells. 400 ng DT was administrated on the same day (+ DT). Tumor size was monitored over time. n, numbers of mice. Data are mean ± s.e.m. and were analyzed by two-tailed unpaired Student’s t-test. Data are representative of two independent experiments (a, g).
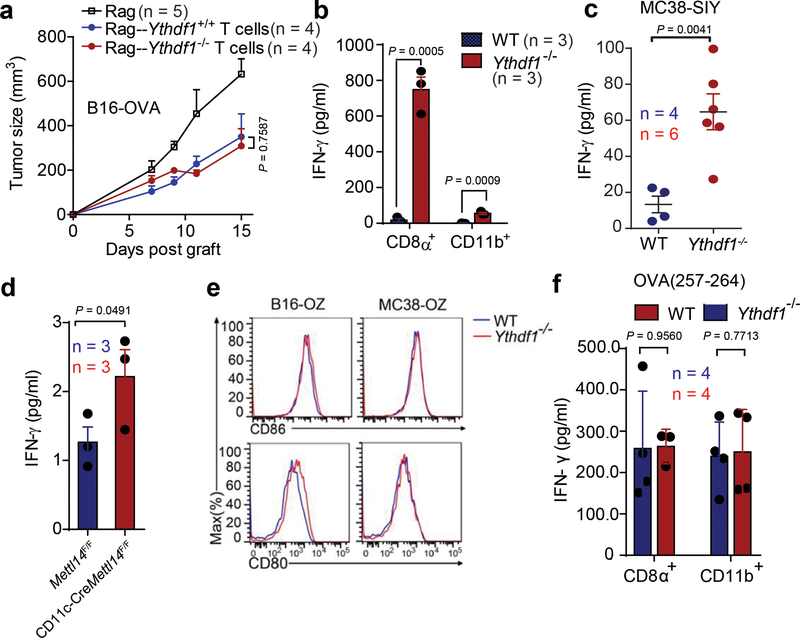
Next, we showed that loss of Ythdf1 in T cells makes a minor contribution to the observed antitumor immunity (Extended Data Fig. 3a). Since dendritic cells (DCs) are the main antigen-presenting cells (APCs) that cross-prime CD8+ T cells, we hypothesized that the increased T cell priming in Ythdf1−/− mice could be attributed to an improved recognition of tumor cells through an increased cross-priming ability of DCs18,19. To test this hypothesis, we used Flt3L-supplemented cultures for classical DCs (Flt3L-DC) to model how cross-presentation occurs20-22. We pulsed Flt3L-DCs with necrotic B16-OVA in vitro and evaluated their ability to cross-prime OTI-specific TCR-transgenic OT-I T cells. We found that Ythdf1−/− Flt3L-DCs were able to cross-prime OT-I T cells to a greater extent than WT DCs (Fig. 2e). To determine the cross-priming capacity of classical DCs (cDC) in vivo, we collected CD8α+ DCs and CD11b+ DCs from draining lymph nodes (DLNs) of B16-OVA- or MC38-OTIp-tumor bearing mice and co-cultured them with OT-I T cells. While a weak cross-priming of CD8+ T cells was detected in WT mice, we observed a significantly augmented T cell cross-priming induced by both CD8α+ DCs and CD11b+ DCs in Ythdf1−/− mice (Fig. 2f, Extended Data Fig. 3b). In addition, we utilized a less sensitive model antigen SIY and confirmed that the enhanced cross-presentation capacity was consistently detected in Ythdf1−/− DCs (Extended Data Fig. 3c). To test whether cross-priming in DCs depends on RNA m6A methylation in general, we employed the CD11c-CreMettl14f/f conditional knockout mice. We compared the cross-presentation capacity of Mettl14-deficient DCs and WT DCs. Indeed, DCs deficient in Mettl14 showed enhanced capacity in cross-presentation (Extended Data Fig. 3d), confirming the critical role of the m6A-YTHDF1 axis in restricting the cross-priming capacity of DCs.
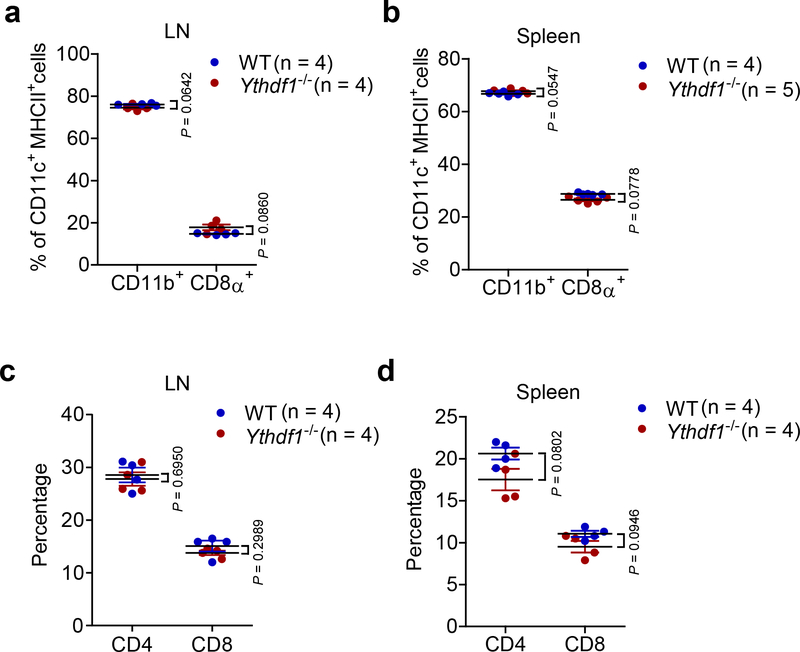
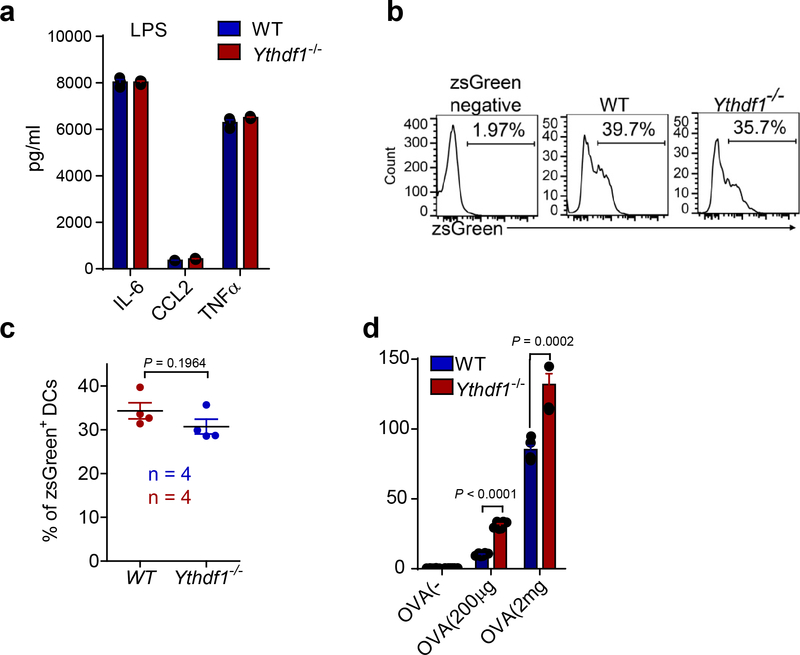
Considering the possibility that the increased cross-capacity of YTHDF1-deficient DCs for priming could be attributed to differential expression of co-stimulatory molecules23, we evaluated the expressions of CD80 and CD86 on DCs. WT and Ythdf1−/− DCs expressed comparable levels of CD80 and CD86, and also exhibited a similar ability to directly prime OT-I T cells with peptide stimulation (Extended Data Fig. 3e, f). In addition, loss of YTHDF1 did not affect the composition of DC subpopulations in naive mice (Extended Data Fig. 4), nor did it affect LPS-mediated DC activation (Extended Data Fig. 5a). These findings suggest that loss of YTHDF1 increases cross-priming capacity of DCs, rather than impacting the development or activation of DCs.
To determine if YTHDF1 deficiency enhances the cross-presentation of tumor antigens on DCs, leading to better cross-priming of CD8+ T cells24,25, we assessed the abundance of H-2Kb-SIINFEKL complexes on DCs from WT and Ythdf1−/− mice bearing B16-OVA tumors. Although phagocytosis of tumor cells was similar in WT and Ythdf1−/− mice (Extended Data Fig. 5b, c), H-2Kb-SIINFEKL complexes were significantly higher in tumor-infiltrating Ythdf1−/− DCs than in WT DCs (Fig. 2g, h). Furthermore, compared with splenic WT DCs, DCs from Ythdf1−/− mice exhibited a higher potential for cross-presentation of soluble OVA in vitro (Extended Data Fig. 5d). These data suggest that DCs from Ythdf1−/− mice possess improved antigen-presentation relative to DCs from WT mice.
To investigate whether the antitumor immunity relies on loss of Ythdf1 specifically in DCs, we generated chimeric, DC-specific Ythdf1 knockout mice. Specifically, we reconstituted irradiated mice with a 1:1 mixture of Ythdf1−/− bone marrow cells and of WT bone marrow cells with a Zbtb46-DTR transgene, which drives expression of the diphtheria toxin receptor in classical DCs. Upon administration of diphtheria toxin (DT), WT cDCs expressing Zbtb46-DTR are selectively eliminated, with all remaining cDCs in Zbtb46-DTR:Ythdf1−/− being Ythdf1-deficient. We also established chimeric Zbtb46-DTR:Ythdf1+/+ mice as controls. We found that B16-OVA tumors grew similarly in Zbtb46-DTR:Ythdf1+/+ and Zbtb46-DTR:Ythdf1−/− chimeric mice that were not treated with DT (Fig. 2i). Importantly, treatment with DT substantially reduced tumor growth in Zbtb46-DTR:Ythdf1−/− mice compared to Zbtb46-DTR:Ythdf1+/+ mice (Fig. 2i). These data demonstrate that loss of Ythdf1 specifically in cDCs is sufficient to generate the antitumor response. Together, these findings suggest that YTHDF1 in cDCs limits their cross-presentation capacity in vivo, and that altered T cell or DC homeostasis or development in Ythdf1−/− mice does not substantially contribute to the antitumor activity.
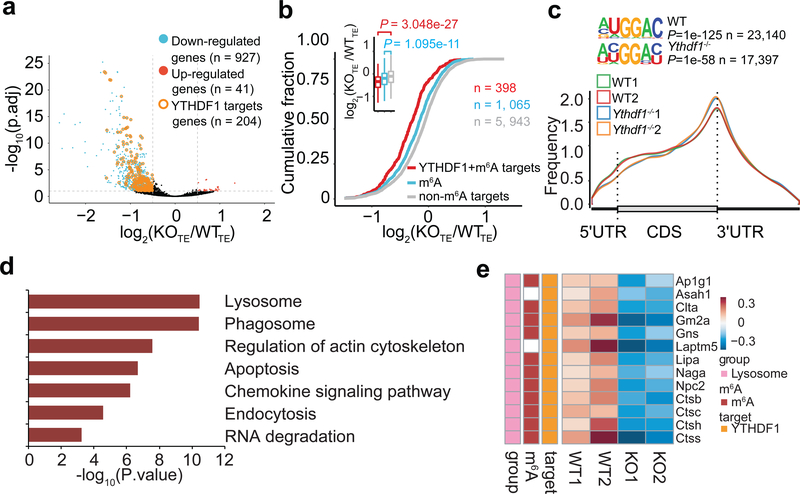
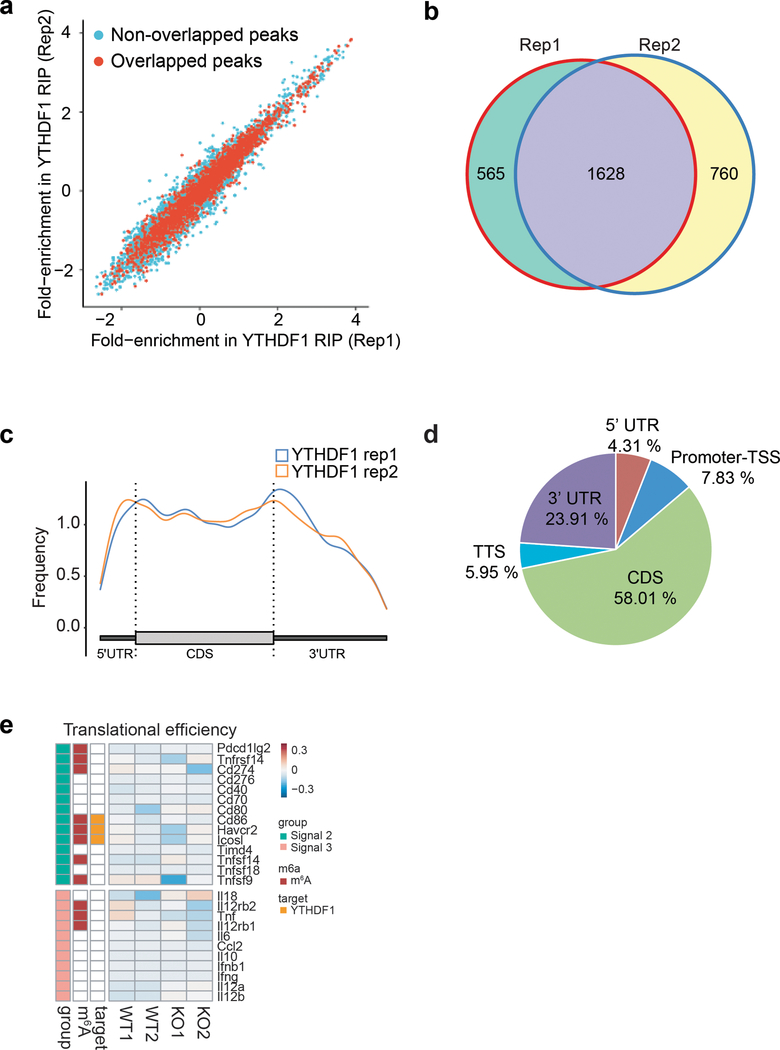
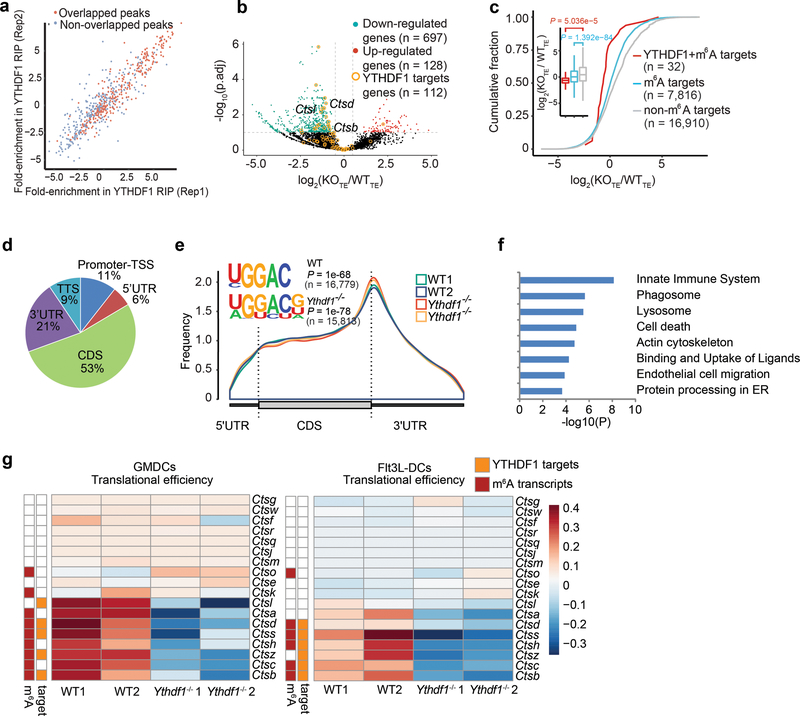
We next performed RIP-seq to map target transcripts bound by YTHDF1 in Flt3L-DCs. YTHDF1-binding sites were highly reproducible between two biological replicates (Extended Data Fig. 6a, b), and were predominantly distributed in the coding region and 3’ UTR (Extended Data Fig. 6c, d). Given that YTHDF1 is known to affect mRNA translation5, we assessed the translational efficiency of WT and Ythdf1−/− DCs by ribosome profiling. Antibody-based m6A profiling and RNA-seq were also performed in the same cells. We categorized transcripts into three groups: non-m6A marked transcripts, m6A-containing transcripts, and m6A-marked transcripts bound by YTHDF1. As expected, we found a significant decrease of translation efficiency, particularly for YTHDF1-targeted and m6A-marked transcripts, in Ythdf1−/−DCs compared to WT DCs (Fig. 3a, b), while Ythdf1 deficiency did not substantially alter the distribution of m6A in mRNAs from DCs (Fig. 3c).
Figure 3 |. Transcriptome-wide identification and analysis of the YTHDF1-binding sites.
a, Volcano plots of genes with differential translational efficiency in WT and Ythdf1−/− Flt3L-DCs. Transcripts with significant YTHDF1 binding sites in 3’ UTR were marked with yellow circles. P values were calculated by two-sided likelihood ratio test and adjusted by Benjamini & Hochberg method; n = 4 (2 conditions x 2 biological replicates). b, Cumulative distribution log2FoldChange of translational efficiency between WT and Ythdf1−/− Flt3L-DCs. P values were calculated by two-sided Kolmogorov-Smirnov test; n = 2 independent biological replicates. Box-plot elements: centre line, median; box limits, upper and lower quartiles; whiskers, 1–99%. c, Metagene-plot depicting nearly unchanged m6A peak distribution and similar consensus motifs in WT and Ythdf1−/− Flt3L-DCs. P values of consensus motifs were generated by HOMER31 with one-sided binomial test. d, KEGG enrichment analysis of genes with significant decreased translation efficiency and YTHDF1 binding sites in 3’UTR (n = 204). One-tail hypergeometric test was used to determine statistical significance of enrichment. e, Heatmap showing the translational efficiency of lysosome genes in WT and Ythdf1−/− Flt3L-DCs. n, numbers of genes or m6A peaks.
To determine functional pathways associated with YTHDF1-targeted mRNAs, we analyzed m6A-marked mRNAs that are both targets of YTHDF1 and translationally regulated by YTHDF1. We performed Gene Ontology (GO) Enrichment Analysis, which showed that YTHDF1-targeted transcripts were enriched for functions in the KEGG pathways of phagosome and lysosome (Fig. 3d). It is known that limiting lysosomal proteolysis in DCs could enhance the cross-presentation by minimizing destruction of internalized antigens26,27. We noticed that translation of a group of transcripts encoding lysosomal cathepsins, which are responsible for antigen degradation in DC lysosomes26,27, was repressed in Ythdf1−/− DCs compared with WT control (Fig. 3e). In contrast, the translational efficacy of co-stimulatory/inhibitory molecules (signal 2) and cytokines (signal 3) did not exhibit substantial change in YTHDF1-deficient Flt3L-DCs (Extended Data Fig. 6e). In line with the observation in Flt3L-DCs, loss of Ythdf1 resulted in decreased translational efficiency of cathespins in GMCSF-induced bone marrow DCs (GMDCs) (Extended Data Fig. 7a-f). Consistently, we found that multiple cathepsin transcripts are bound by YTHDF1, and Ythdf1 knock-out resulted in significant decreases of the translation efficiency of these genes, in both GMDCs and Flt3L-DCs (Extended Data Fig. 7g). These data suggest lysosomal cathepsins as the main targets controlled by YTHDF1, which subsequently affect the cross-priming capacity of DCs.
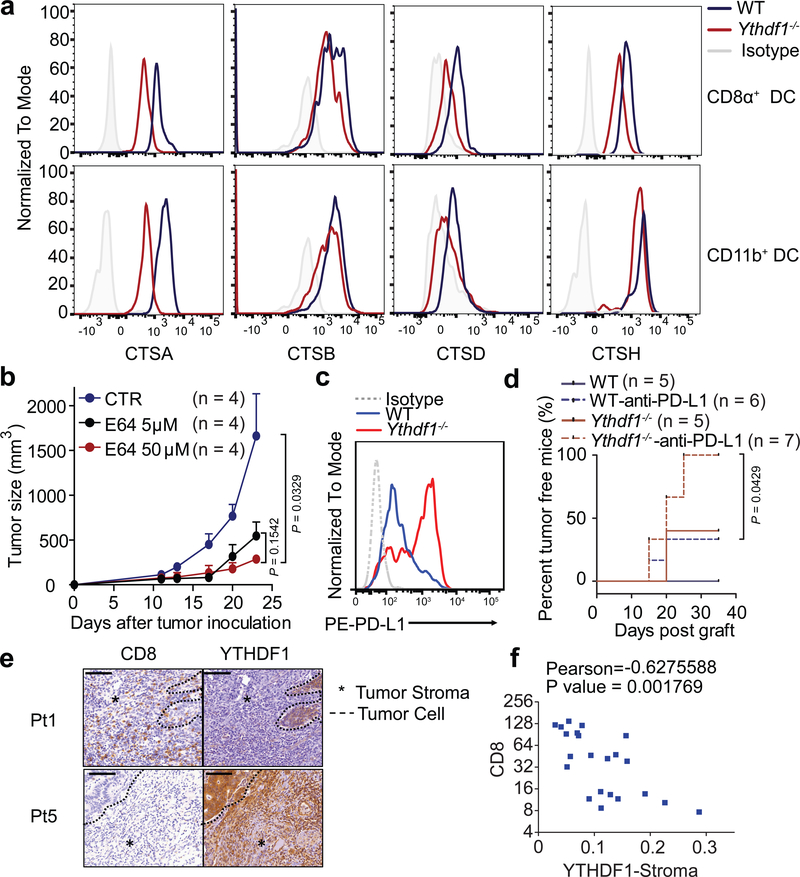
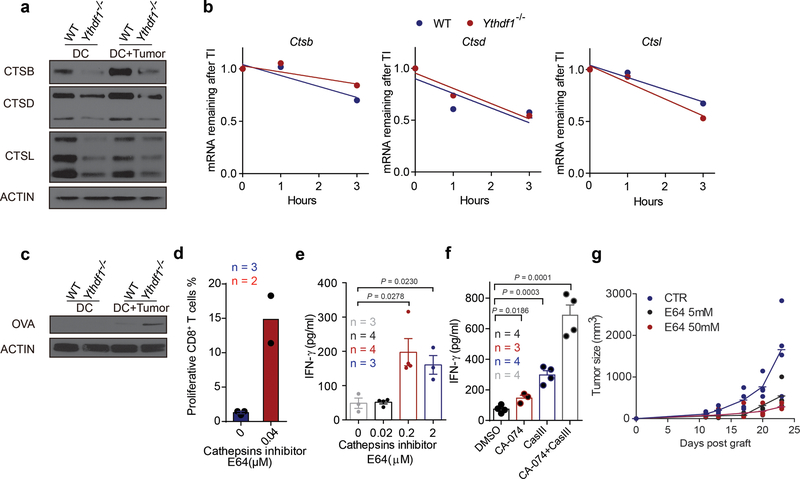
Consistent with the reduced translational efficiency of m6A-marked transcripts in Ythdf1−/− cDCs based on ribosome profiling, we also observed a downregulation of cathepsins from Ythdf1−/− cDCs compared to WT cDCs in vivo (Fig. 4a) and in vitro (Extended Data Fig. 8a), although the decay of their transcripts was less affected (Extended Data Fig. 8b). We reasoned that the reduced cathepsin levels may delay the degradation of the ingested neoantigens and facilitate a sustained antigen release within endosomes/lysosomes, thereby contributing to the improved antigen presentation in Ythdf1−/− DCs. To test this hypothesis, we co-cultured GMDCs from WT and Ythdf1−/− mice with B16-OVA cells overnight and assessed purified DCs for intact residual OVA. We observed more residual intact OVA in Ythdf1−/− DCs compared to Ythdf1+/+ GMDCs (Extended Data Fig. 8c). We subsequently investigated whether the reduced translation efficiency of the YTHDF1 target cathepsins affects cross-presentation in Ythdf1−/− DCs. Indeed, inhibition of cathepsins using a broad-spectrum cysteine protease inhibitor E64 or more selective inhibitors CA-074 (for cathepsin B) and cathepsin L inhibitor III notably enhanced the efficiency of cross-priming in wild-type DCs (Extended Data Fig. 8d-f). Moreover, the in vivo antitumor response was also markedly improved by cathepsin blockade (Fig. 4b, Extended Data Fig. 8g), suggesting that cathepsins are critical factors determining the antitumor response in the current system. Collectively, these data show that loss of YTHDF1 in DCs attenuates antigen degradation by restricting the expression of lysosomal proteases, leading to improved cross-presentation and better cross-priming of CD8+ T cells.
Figure 4 |. YTHDF1 promotes translation of proteases for excessive antigen degradation.
a, Representative histogram plots showing expressions of cathepsins on splenic CD8α+ and CD11b+ cDCs from WT and Ythdf1−/− mice. b, WT mice were injected s.c. with 106 B16-OVA cells. After 11 days, tumor-bearing mice were injected with DMSO as vehicle control (CTR) or E64 intratumorally (5 μM or 50 μM). Tumor growth was monitored over time. c, WT or Ythdf1−/− mice were injected s.c. with 106 B16-zsGreen-OT1 cells. The PDL1 expression on zsGreen+ tumor cells is shown. d, WT or Ythdf1−/− mice (n = 5/group) were injected s.c. with 106 B16-OVA cells. 200 μg of anti-PDL1 antibody were administered on day 8 and day 15. Percentage of mice with tumor regression were monitored over time and represented as percent tumor-free survival. (e-f) Tissue sections were characterized by immunohistochemical staining for CD8 and YTHDF1. Dash line delineates the edge of tumor area. Asterisk marks the stroma tissues. Representative YTHDF1 low (Patient 1) and YTHDF1 high (Patient 5) specimens are shown (e). Scale bars, 100 μm. f, Correlations between YTHDF1 in stroma area and CD8+ infiltrates are shown (n = 22 patients). Data are representative of two independent experiments with similar results (a, c); one of three representative images per tumor was shown (e). n, numbers of mice. Data are mean ± s.e.m. and were analyzed by two-tailed unpaired Student’s t-test (b, f) or two-tailed log-rank (Mantel-Cox) test (d).
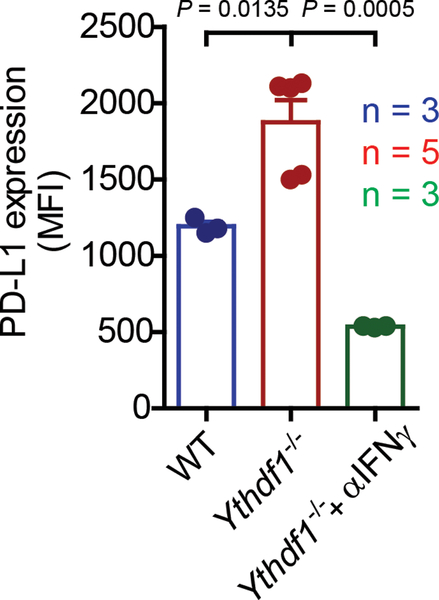
Finally, we examined whether loss of YTHDF1, with increased neoantigen-specific CD8+ T cells, could enhance the antitumor response of immune checkpoint blockade, which targets the T cell inhibitor receptor PD1. Since Ythdf1−/− mice showed a marked increase of IFNγ in CD8+ T cell and IFNγ signaling upregulates the expression of PD-L128, the ligand for PD1, we evaluated the level of PD-L1 and observed increased PD-L1 expression in tumor cells from Ythdf1−/− tumor-bearing mice (Fig. 4c), whereas neutralizing IFNγ diminished the expression of PD-L1 (Extended Data Fig. 9). We then tested whether PD-L1 blockade can potentiate the antitumor response in Ythdf1−/− mice. We treated WT and Ythdf1−/− tumor-bearing mice with an anti-PD-L1 antibody (clone 10F.9G2). Although tumor regression occurred in 40% of untreated Ythdf1−/− mice or anti-PD-L1-treated WT mice, we found that 100% of Ythdf1−/− mice showed complete tumor regression after PD-L1 blockade (Fig. 4d). These data suggest that combining a checkpoint blockade with YTHDF1 depletion could be a potential new therapeutic strategy to improve the outcome in patients with low response to checkpoint blockade.
In line with the observations in mouse models, we found that colon cancer patients with low expression of YTHDF1 in tumor stroma tended to have higher number of CD8+ cells, while biopsies with high expression of YTHDF1 in tumor stroma lacked CD8+ cell infiltrates (Fig. 4e-f), further supporting the notion that the reduced YTHDF1 expression may correlate with the T-cell inflamed tumor microenvironment.
Tumors can evade immune recognition despite expressing neoantigens. Our current results reveal that the m6A-marked mRNAs encoding lysosomal proteases are recognized by YTHDF1 in DCs. YTHDF1 binding promotes translation of lysosomal proteases, suppressing the cross-presentation of engulfed tumor neoantigens, which represents a previously unrecognized mechanism of immune evasion. Our data did not exclude potential contributions from other targets of YTHDF1; further investigation of complex regulatory pathways mediated by the m6A axis is necessary to expand current knowledge and uncover additional features of antitumor immunity discovered here. Finally, this work suggests that YTHDF1 could be a therapeutic target for immunotherapy in combination with emerging checkpoint inhibitors or DC vaccines.
METHODS
Mice
Ythdf1−/− mice were generated as previously described15. Founder mice with mutant alleles were backcrossed to C57BL/6J for two generations. Mice used for experiments are further backcrossed to C57BL/6J for seven generations, totally 9 generations. To ensure the comparability in genetic background, mice were maintained by crossing heterozygous and heterozygous. Ythdf1−/− mice or their littermates control WT mice were used in all experiments. Littermates were co-housing during experiments to reduce variants in their microbiome and environment. Primers used for genotyping of Ythdf1−/− mice: CACCTGAGTTCAGATCATTAC and GCTCCAGACTGTTCATCC. Female Rag2−/− mice, 2C CD8+ T cell receptor (TCR)-Tg, CD11c-Cre and Zbtb46-DTR mice were purchased from Jackson laboratory. Female CD11c-CreMettl14f/f conditional knockout mice were generated in house. All mice were used at 6–12 weeks of age. All the mice were maintained under specific pathogen-free conditions and used in accordance with the animal experimental guidelines set by the Institute of Animal Care and Use Committee. This study has been approved by the Institutional Animal Care and Use Committee of The University of Chicago.
Cell lines
MC38 is a murine colon adenocarcinoma cell line that was provided by D. Bartlett (University of Pittsburgh, Pittsburgh). B16-OVA, an OVA-transfected clone derived from the murine melanoma cell line B16, were provided by Dr. Yang-Xin Fu (UT Southwestern). B16F10 cell line was purchased from ATCC. MC38-zsGreen-OTIp (MC38-OZ) and B16F10-zsGreen-OTIp (B16-OZ) were selected for a single clone after being transduced by lentivirus expressing zsGreen-OTIp (SIINFEKEL). MC38-SIY is an EGFR-SIY-transfected clone derived from the murine colon cell line MC38. Cells were maintained either in DMEM (Invitrogen) supplemented with 10% FBS and 1% penicillin-streptomycin supplemented with 2 mM L-glutamine, 1 mM sodium pyruvate and 0.1 mM non-essential amino acid at 37 °C in 5% CO2.
Primary cell cultures
Single-cell suspensions of bone marrow cells were cultured in RPMI-1640 medium containing 10% fetal bovine serum, supplemented with 20 ng/ml GM-CSF (Biolegend). Fresh media with GM-CSF was added into culture on days 3 and 5. On day 6, CD11c+ DCs were purified using EasySep Mouse CD11c Positive Selection Kit II (STEMCELL). To culture Flt3L-DCs, single-cell suspensions of bone marrow cells were cultured in IMDM medium containing 10% fetal bovine serum at the concentration of 1×10⁶/ml. Cells were supplemented with 100 ng/ml Flt3-Ligand (PEPROTECH) for 9–10 days to obtain the Flt3L-DCs.
Tumor growth and treatments
1 × 10⁶ B16-OVA or MC38 tumor cells were injected s.c. into the flank of mice. Tumor volumes were measured by length (a) and width (b) and calculated as tumor volume = ab2/2. Mice with tumor volumes less than 200 mm3 are considered to be survival. For in vivo depletion study, 200 μg of anti-CD8 antibody (clone YTS169.4) or anti-NK1.1 (clone PK136) was injected i.p. three days after tumor inoculation. To block cathepsins in vivo, mice were inoculated with 1× 10⁶ B16-OVA cells. On day 11, mice with established tumors were treated with E64 intratumorally. For anti-PDL1 treatment, 1× 10⁶ B16-OVA tumor cells were s.c. injected into the flank of mice. Tumors were allowed to grow for seven days and treated i.p. by anti-PDL1 (clone10F.9G2) or Rat Ig. Tumor-free mice after treatment were monitored over time and the percentage of tumor-regression was calculated. To block IFNγ, tumor-bearing mice were treated with 50 μg anti-IFNγ m6Ab (clone XMG1.2) intratumorally and PD-L1 expression on tumor cells was evaluated by flow cytometry. All antibodies were ‘InVivoMAb’ from BioXCell. For adoptive transfer of T cells, Rag mice were inoculated with 5×10⁵ B16-OVA on day 0. On the same day, T cells were purified from WT or Ythdf1−/− mice using T cell negative isolation Kit (STEM CELL). 5×10⁶ T cells were i.v. injected into Rag2−/− mice. Tumor-bearing mice were sacrificed before the diameter of tumor reached to 2 cm and tumor size limit has been approved by the Institutional Animal Care and Use Committee of The University of Chicago.
Generation of bone marrow chimera
To generate bone marrow chimeric mice, C57BL/6 mice were exposed to 800 rads of X-ray. After 24 hours, 5×10⁶ bone marrow cells, consisting of 2.5×10⁶ WT or Ythdf1−/− BM cells and 2.5×10⁶ Zbtb46-DTR BM cells, were i.v. injected into irradiated mice. Six weeks after reconstitution, Zbtb46-DTR:Ythdf1+/+and Zbtb46-DTR:Ythdf1−/− mixed BM chimera mice were inoculated with 106 B16-OVA cells and treated with 400 ng diphtheria toxin (sigma) or PBS every other day for sixteen days.
Flow cytometry and cell sorting
For flow cytometric analysis and cell sorting, tumors, lymph nodes and spleens were collected from mice and digested with 0.26 U/ml Liberase TM and 0.25 mg/ml DNase I at 37°C for 30 min. Samples were then filtered through a 70 μm cell strainer and washed twice with staining buffer. Cells were re-suspended in staining buffer (PBS with 2% FCS and 0.5 M EDTA). Cells were incubated with Fc Block (clone 2.4G2; BioX Cell) for 10 min. Subsequently, specific antibodies were added and staining was continued for 30 min on ice. Information for all the antibodies used are provided in Supplementary Table 1. OT-I specific T cells were stained using iTAg Tetramer/H-2KbOVA (SIINFEKEL) (MBL). After a washing step, cells were either analyzed on a BD Fortessa (BD) or sorted by AriaIIIu (BD). For the staining of cathepsins, splenocytes were stained with CD11c, B220, MHCII, CD8 and CD11b and then fixed with 4% PFA (Biolegend) for 30 minutes. Fixed cells were then washed twice with the 1x intracellular staining perm and wash buffer (Biolegend). Antibody against CTSA, CTSB, CTSD or CTSH was added and incubated overnight respectively. Alexa Fluor 568 Goat-anti-Rabbit IgG was added as the secondary antibody. CD11c+MHCII+B220− was gated and the expression of cathepsins was evaluated by the fluorescence intensity. Analysis of flow cytometry data was performed using Flowjo (Treestar).
Measurement of IFNγ-secreting CD8+ T cells by ELISPOT assay
For antigen-specific CD8+ T cell functional assay in the B16-OVA model, 12 days after tumor inoculation, 3×10⁵ lymphocytes were re-stimulated with 1μg/ml SIINFEKEL or MC38 tumor cells (lymphocyte:MC38 = 50:1) for 48 hours. 96-well HTS-IP plate (Millipore) was pre-coated with anti-IFNγ antibody (BD Bioscience) with a 1:250 dilution overnight at 4 °C. After co-culture, cells were removed. 2 mg/ml biotinylated anti-IFNγ antibody (BD Bioscience) with a 1:250 dilution was added and incubated for 2 h at room temperature or overnight at 4°C. Avidin-horseradish peroxidase (BD Bioscience) with a 1:1000 dilution was then added and the plate was incubated for 1h at room temperature. The cytokine spots of IFN-γ were developed according to product protocol (BD Bioscience).
Antigen-presentation assay
For cross-presentation of tumor neoantigen, CD11b+ or CD8+ DC were purified from draining lymph node of WT or Ythdf1−/− mice six days after inoculating with B16-OVA, MC38-OTIp or MC38-EGFR-SIY. OT-I or 2C naive CD8+ T cells were isolated from lymph nodes and spleen of 6 to 12-week-old mice. Negative selection was carried out with a negative CD8 isolation kit (StemCell Technologies, Inc.) following manufacturer’s instruction. DCs were co-cultured with OT-I naive CD8 T cells at the ratio of 1:10 for three days with or without 1 μg/ml SIINFEKEL peptide. For cross-presentation of soluble OVA, splenic DCs were sorted and stimulated with 100 ng/ml LPS overnight. DCs were then pulsed with different concentration of OVA (endotoxin free, Sigma) for 5 hours. Cells were washed and co-cultured with OT-I naive CD8+ T cells for three days. For in vitro cross-presentation of tumor neoantigen, Flt3L-DCs were collected on day 9–10 and co-cultured with necrotic B16-OVA tumor cells overnight. B220−CD11c+ cells were subsequently purified. GMDCs from Mettl14f/f or CD11c-CreMettl14f/f mice were harvested on day 6 and co-cultured with necrotic B16-OVA tumor cells for 16 hours. To inhibit cathepsins, GMDCs were pre-treated with E64 (sigma) for two hours followed by co-culturing with tumor cells. CD11c+ cells were then purified and incubated with naive CD8+ T cells from OT-I mice for three days. IFN-γ production was detected by IFN-γ Flex Set CBA assay (BD Bioscience). To inhibit cathepsins in ex vivo cDCs, WT or Ythdf1−/− mice were inoculated with 5×10⁵ MC38. 36 hours after tumor inoculation, spleens were collected and digested, and CD11c+ DCs were purified using EasySep Mouse CD11c Positive Selection Kit II (STEMCELL). CD11+ cDCs were then treated with 0.04 μM E64 (Sigma) overnight followed by co-culturing with OVA protein for 4 hours. Any free OVA protein was then removed from the culture medium, and CD11c+ cells were incubated with CTV-labelled OT-I cells for three days. The cross-priming capacity of DC was analyzed by the dilution of CTV in CD8+ T cells. For cathepsin inhibition assay in vitro, Flt3L-DCs were treated with 5μg/ml CA-074 methyl ester (Selleck), 5μg/ml cathepsin L inhibitor III(Sigma) or the combination (5μg/ml CA-074 methyl ester and 5μg/ml cathepsin L inhibitor III) for 2 h followed by co-culturing with necrotic B16-OVA for 16 h, and then Flt3L-DCs were purified using EasySep Mouse CD11c Positive Selection Kit II (STEMCELL). The purified cells were incubated with OT I cells at the ratio of 1:20 for three days. The cross-priming capacity of DCs was then evaluated by the IFN-γproduction. To detect the MHC-H2Kb-SIINFEKEL, mice were inoculated with B16-OVA. After 12 days, tumors were collected and tumor infiltrating DCs (CD45+CD11b+ly6c−MHCII+CD24+CD11c+) were stained with monoclonal antibody 25.D1.
Cell trace violet labelling
10 million splenocytes from naive OT- I mouse were re-suspended in 1 ml PBS followed by incubating with 5 uM CellTraceViolet Dye(CTV, ThermoFisher) at 37°C for 20 minutes. 5 ml RPMI-1640 medium was added to the cells and incubated for 5 minutes to remove the free dye in the solution. These cells were then centrifuged and incubated with pre-warmed RPMI- for at least 10 minutes at room temperature for subsequent analysis.
RIP-seq
20 million GMDCs were harvested and co-cultured with or without necrotic B16-OVA overnight. The procedure was adapted from the previous report10. Five million Flt3L-DCs were harvested. DCs were then purified and pelleted by centrifuge for 5 min. Cells were washed twice with cold PBS and the cell pellet was re-suspended with 2 volumes of lysis buffer (150 mM KCl, 10 mM HEPES pH 7.6, 2 mM EDTA, 0.5% NP-40, 0.5 mM DTT, 1:100 protease inhibitor cocktail, 400 U/mL RNase inhibitor). Lysate was incubated on ice for 5 min and centrifuged for 15 min to clear the lysate. 1/10 volume of cell lysate was saved as input and total RNA was extracted by Trizol. The rest of cell lysate was incubated with 5 μg anti-YTHDF1 (Proteintech) at 4°C overnight with gentle rotation followed by incubation with 40μl protein G beads for 1 hour at 4°C. The beads were then washed five times with 1 mL ice-cold washing buffer (200 mM NaCl, 50 mM HEPES pH 7.6, 2 mM EDTA, 0.05% NP-40, 0.5 mM DTT, 200 U/mL RNase inhibitor). The IP complex was resuspended in 400 μl 1xProteinase K and digested with 2 mg Proteinase K at 55°C for 1 hour. RNA was then extracted by RNA isolation kit (Zymo). Input and IP RNA of each sample were used to generate the library using TruSeq stranded mRNA sample preparation kit (Illumina).
m6A-seq
Total RNA was isolated from DCs. Polyadenylated RNA was further enriched from total RNA by using Dynabeads® mRNA Purification Kit (Invitrogen). RNA samples were fragmented into ~100-nucleotide-long fragments with sonication. Fragmented RNA (100 ng mRNA or 5 μg total RNA) was performed m6A-IP following EpiMark N6-methyladenosine enrichment kit (NEB E1610S) protocol. RNA was enriched through RNA Clean&Concentration-5 (Zymo Research) and used for library generation with SMARTer Stranded Total RNA-Seq Kit (Takara). Sequencing was performed at the University of Chicago Genomics Facility on an Illumina HiSeq4000 machine in single-read mode with 50 bp per read. Sequencing reads were aligned to the mouse genome mm9 by STAR (version 2.6.0c)29. The m6A-enriched regions (peaks) in each m6A-IP sample were detected by MACS2 (version 2.1.1.20160309)30 with q value less than 0.01 and corresponding m6A-Input sample was used as the control. Peaks that were detected by both replicates were considered as high confident peaks. The peaks annotation and binding motif were analyzed by HOMER (version 4.9)31.
Ribosome profiling
5×10⁶ DCs were treated with 100 μg/ml cycloheximide (CHX) for 7 minutes. The cells were then harvested by the cell lifter. The cell suspension was spun at 400g for 5 min and the cell pellet was washed twice with 5 ml cold PBS with CHX (100 μg/ml). 200 μl lysis buffer (10 mM Tris, pH 7.4, 150 mM KCl, 5 mM MgCl2, 100 μg/ml CHX, 0.5% Triton-X-100, freshly added 1:100 protease inhibitor, 40 U/ml SUPERasin) was added to the cell pellet and lysed on ice for 15 minutes with rotating. 10% clarified lysate was saved as INPUT and the rest lysate was separated through a 5 ml 10%−50% sucrose gradient and centrifuged at 4 °C for 2 h at 28,000 r.p.m. Fractions were collected separately and analyzed by Qubit™ RNA HS Assay Kit (Invitrogen). The fractions corresponding to monosome or polysome were combined resepectively and concentrated on Amicon-Ultra 100K columns (Millipore). Two A260 units of ribosome fractions were digested with 60 U RNase I (Ambion) at room temperature for 30 minutes. RNA was extracted by RNA Clean&Concentrate (Zymo) and ribosomal RNA were deleted prior to size selection. RNA fragments (26–32 nt) were isolated by 15% denaturing Urea-PAGE gel. RNA was eluted from gel in elution buffer (300 mM sodium acetate pH 5.2, 1 mM EDTA) followed by phenol-chloroform extract and ethanol precipitation. RNA fragments were dephosphorylated and prepared into libraries by SMARTer® smRNA-Seq Kit (Clontech). The first 3 bases of sequencing reads were removed fastx_trimmer (version 0.0.14). The adapter sequences and polyA tails were firstly trimmed from sequencing reads by using cutadapt (version 1.15) with --minimum-length 18 -n 3 -a “AAAAAAAAAAAAAA” -a “AGATCGGAAGAGCACACGTCTGAACTCCAGTCAC” parameters32. Trimmed reads were filtered for mitochondrial DNA and ribosomal RNA by Bowtie2 (version 2.3.4)33. All remaining reads were mapped to the mouse genome mm9 with STAR (version 2.6.0c)29. Uniquely mapped reads were selected by using SAMtools (version 1.7)34 with mapping quality >= 20, and then removing duplication. The raw counts of coding regions were calculated by HOMER (version 4.9)31. The differentially TE (translational efficiency35, Equation 1) genes were detected by Bioconductor DESeq2 package (version 1.18.1)36 with p.adj <= 0.1 and |log2FoldChange| >= 0.5.
| (Equation 1) |
Measurement of RNA lifetime
DCs were seeded in 24-well plate at 50% confluency. After 2 h, actinomycin D was added to 5 mg/ml at 3 h, 1 h and 0 h before collection. The total RNA was purified by RNeasy kit with an additional DNase-I digestion step on column. RNA quantities were determined by RT-qPCR. The specific primers used are as follows: Ctsb_Forward: CTGCTTACCATACACCAT, Ctsb_Reverse: TCCTTCACACTGTTAGAC; Ctsd_Forward: GGCAAGAGGTATCAAGGT, Ctsd_Reverse: CAGGTAGAAGGAGAAGATGT; Ctsl_Forward: GAGTTCGCTGTGGCTAAT, Ctsl_Reverse: GAGGTTCTTGCTGCTACA; Gapdh_Forward: ACCTGCCAAGTATGATGA, Gapdh_Reverse: GGAGTTGCTGTTGAAGTC.
Immunohistochemistry of human biopsies
All samples encompassing tumor biopsies from 22 colorectal cancer patients were obtained with informed consent under a protocol approved by the University of Chicago Institutional Review Board. We have complied with all relevant ethical regulations. Information about the patient sex, age, and tumor characteristics are given in Supplementary Table 2. To stain YTHDF1 and CD8, antigen retrieval was performed with 10 mM Tris base, 1 mM EDTA, 0.05% Tween 20, pH9. Slides were processed with the VECTASTAIN Elite ABC HRP kit and DAB Substrate Kit (Vector Laboratories). Slides were counterstained with hematoxylin and dehydrated through graded alcohols and xylene. A total of 22 tumor samples had sufficient tissue for unambiguous analyses; For IHC quantification, DAB stains of IHC images were separated by color deconvolution algorithms47 in Fiji, a derivative of ImageJ. The mean DAB intensity of 3 random images at 795×650 pixels was calculated and converted into optical density (OD). CD8 positive cells were analyzed by Image J cell counter. The average infiltration of CD8+ cell and average expression of YTHDF1 were assessed within the surrounding stroma tissues.
Western blot analysis
To detect the expression of cathepins, GMDCs were harvested on day 6 and co-cultured with necrotic B16-OVA cells at the ratio of 1:1 for 16 hours. CD11c+ DCs were then purified. Equal numbers of cells were lysed on ice for 15 min using 1xlysis buffer (CST) supplemented with a protease inhibitor cocktail (Calbiochem). Cell lysis was centrifuged at 16,100g at 4°C for 15 min. Clarified supernatant was loaded into 4–12% NuPAGE Bis-Tris gel and transferred to PVDF membranes (Life Technologies). Membranes were blocked for 1 hour in 5% milk TBST and then incubated with primary antibodies in the blocking buffer overnight at 4°C. After 5 times washing, membranes were incubated with secondary antibodies for 1 hour at room temperature. The information for all the antibodies used are provided in Supplementary Table 1.
Degranulation of tumor infiltrating NK cells
Tumor infiltrating leukocytes were resuspended at 5×10⁵/ml and stimulated with phorbol-12-myristate-13-acetate (PMA) (2.5 μg/ml) and ionomycin (0.5 μg/ml) in 96-well plate. CD107α-PE antibody and 1xbredeldin A (Biolegend) were added directly to the well and incubated for 4 h at 37 °C in 5% CO2. Cells were stained for CD45 and NK1.1 (BD Biosciences) for 30 min. Samples were washed and then fixed in 1% paraformaldehyde.
Phagocytosis in vivo
5 × 10⁵ B16F10 cells expressing zsGreen-OTI were injected s.c. into WT and Ythdf1−/− mice. Tumor tissues were harvested and digested.
Maturation of DC
GMDCs were harvested and co-cultured with 100 ng/ml LPS overnight. The cytokine production was measured by mouse inflammation kit (BD).
Identification of off-target site and T7EI assay
Identified two off-target loci for each sgRNA site with highest score were selectively amplified by primers listed below:
YTHDF1_For: TGACATTGGTGGCCATATCTGTC
YTHDF1_Rev: TGTCTGCCCATCAACAACTGTGC
Tex52_For: AGGATGAGAGGTGTTCAGCTAGAC
Tex52_Rev: TCTGTAGGCCCAGAGTCCTCAG
Nrp2_For: AGGGTAATACTACCACACATCAACCG
Nrp2_Rev: AGAGCTGGGGTCTAATTGAATTTGGG
Eme1_For: TGCTGTCTCGCCTCGCAATAGC
Eme1_Rev: TGCGTACACTTAAGTCTGCCTGG
MED20_For: TCAAGGGCTTCTTCCAGAGTGCC
MED20_Rev: AGGCACCACACAAACCAGGCAAG
HiPure Tissue DNA Mini Kit (Magen, D3121–03) was used to extract genomic DNA from the tails of WT and Ythdf1−/− mice. The PCR reactions to amplify 350 bp fragment (for Y1 mouse) and 510 bp fragment (for WT mouse) were carried out in 30 μl reaction, using 15 μl of 2x EasyTaq PCR SuperMix (AS111 TransGen Biotech), 0.75 μM each of forward and reverse primers and 1 μl genomic DNA. The reaction products were subjected to 1.5% agarose gel electrophoresis. For T7E1 cleavage assay, equal volume PCR products of Ythdf1−/− and WT mouse were mixed and then denatured and annealed in NEBuffer 2 (NEB) using a thermal cycler. Hybridized PCR products were digested with T7 endonuclease I (NEB, M0302L) or ddH2O (as control) for 20 minutes at 37°C and subjected to 1.5% agarose gel electrophoresis.
Statistical analysis and reproducibility
No statistical method was used to predetermine sample size. Mice were assigned at random to treatment groups for all mouse studies and, where possible, mixed among cages. There were no mice excluded from experiments. Blinded staining and blinded analysis were performed for IHC experiments. Experiments were independently repeated two to three times. Data were analyzed using Prism 5.0 software (GraphPad) and presented as mean values ± s.e.m. The P values were assessed using one-tailed or two-tailed unpaired Student’s t-test. For survival curve, statistics were done with the log-rank (Mantel-Cox) test. For translational efficiency, P values were calculated by likelihood ratio test and adjusted by Benjamini & Hochberg method. For cumulative distribution, two-sided Kolmogorov-Smirnov test was used to calculate the P values.
Data processing and analysis
Illumina reads were post-processed and aligned to the mouse mm9 assembly using STAR29 program (version 2.6.0c) with default parameters. To visualize sequencing signals in the genome browser, we generated RIP-seq and m6A-seq bigwig files with bamCoverage function from deepTools (version 3.0.1)37 with ‘-bs=1 --normalizeUsing BPM’. For RIP-seq, Piranha software (version 1.2.1)38 was to detect the binding sites of YTHDF1 with “-b 100 -i 100”. Metagene plots were performed by the Bioconductor GUITAR39 package (version 1.16.0). Peaks that were detected by both replicates were considered as high confident peaks. GO term analyses were performed by metascape40.
Data availability
The data that support the findings of this study are available from the corresponding author upon reasonable request. RIP-seq, Ribo-seq and m6A-seq data sets have been deposited in Gene Expression Omnibus under the accession number GSE115106. A summary of sequencing experiments is provided in Supplementary Table 3. The differential translational efficiency results provided in Supplementary Table 4. Source data for bar graphs and box-plots in Figures and Extended Data Figures are provided in separate excel files.
Extended Data
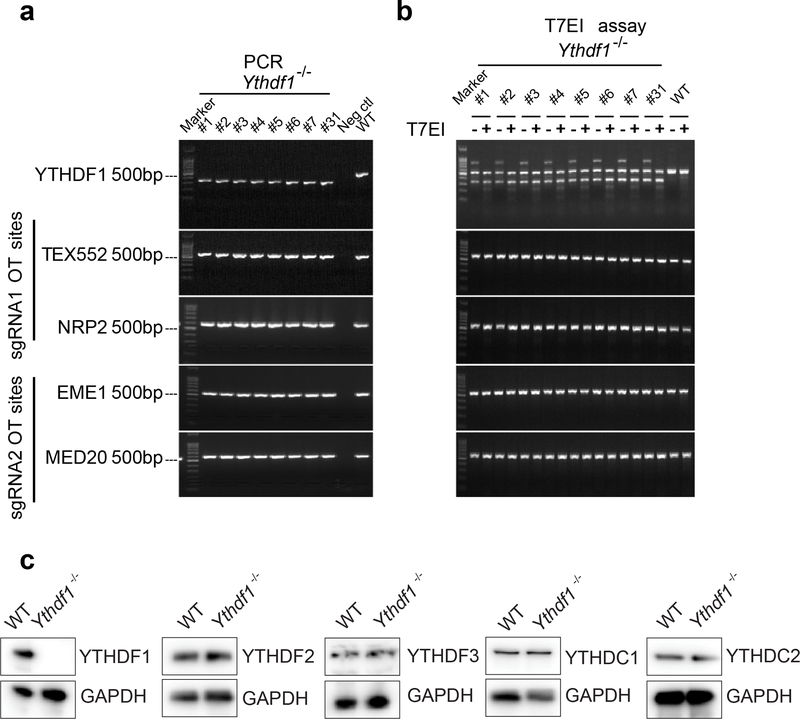
Extended Data Fig. 1 |. Deletion efficacy of Ythdf1−/− mice.
a-b, Off-target analysis of the CRISPR/Cas9 system in Ythdf1−/− mice. (a) Ythdf1 sgRNA targeting sites and four putative off-target sites were amplified. (b) PCR products of Ythdf1−/− mice and WT mice were mixed and digested by T7EI. The PCR product from WT mice was used as negative control. c, Immunoblot assays were shown to validate YTH protein expression level changes in Ythdf1−/− DCs. Data are representative of one experiment (a, b) and two independent biological replications for (c).
Extended Data Fig. 2 |. Characterizations of immune phenotypes of Ythdf1-deficient mice.
(a) data points for Fig. 1a. (b) WT or Ythdf1−/− mice were injected s.c. with 106 B16-OVAcells. Tumor survival were monitored. Mice with tumor volumes less than 200 mm3 are considered to be surviving. One of three representative experiments is shown. (c) data points for Fig. 1b. d-h, WT or Ythdf1−/− mice were injected s.c. with 106 B16-OVAcells. (d,e) The frequency of tumor infiltrating MDSC (Ly6c+CD11b+) cells was assessed 12 days post tumor inoculation. (f,g) The percentages of Treg in spleen, draining lymph node (DLN) and tumor are shown. (h) Degranulation of tumor NK cells in response to in vitro re-stimulation with PMA/ionomycin. (i) data points for Fig. 1d. Data are representative of two independent experiments (a, c). n, numbers of mice. Data are mean ± s.e.m. and were analyzed by two-tailed unpaired Student’s t-test for (a, c, e, g-i) and two- tailed log-rank (Mantel-Cox) test (b).
Extended Data Fig. 3 |. Cross priming of tumor neoantigen is increased in Ythdf1-deficient mice.
a, Rag2−/− mice were transferred with T cells isolated from WTor Ythdf1−/− miceon day 0. On the same day, mice were injected s.c. with 5×10⁵ B16-OVA cells. Tumor growth was monitored over time. b, WT or Ythdf1−/− mice were injected s.c. with 106 MC38-OTIp cells. 6 days after tumor inoculation, CD8+ or CD11b+ DCs were sorted from draining LNs. DCs were co-cultured with CD8T+ cells isolated from naive OTI mice. Capacity of cross priming was determined by the production of IFN-γ. c, WT or Ythdf1−/− mice were injected s.c. with 106 MC38-SIY cells. 6 days after tumor inoculation, DCs were sorted from draining LNs and co-cultured with CD8+ T cells isolated from naive 2C mice. Capacity of cross priming was determined by the production of IFN-γ. d, WT or Mett14-deficient GMDCs were co-cultured with B16-OVA cells. The cross-priming capacity was shown. e, WT or Ythdf1−/− mice were injected s.c. with 106 B16-OVAcells. Data is shown as the expression of CD80 and CD86 on tumor infiltrating DCs. f, WT or Ythdf1−/− mice were injected s.c. with 106 B16-OVA cells. 6 days after tumor inoculation, CD8+ or CD11b+ DCs were sorted from draining LNs. DCs were pulsed with 1 μg/ml exogenous OT-I peptide and co-cultured with isolated CD8+ T cells from naive OTI mice for 3 days and analyzed by IFN-γ CBA. Data are representative of two independent experiments with similar results(e). n, numbers of mice. Data are mean ± s.e.m. and were analyzed by two-tailed unpaired Student’s t-test (a-c, f) or one-tailed unpaired Student’s t-test (d).
Extended Data Fig. 4 |. The development of DCs and T cells were similar in Ythdf1+/+ and Ythdf1−/− mice.
a-b, Percentages of CD11b+ and CD8α+ DCs in lymph node (LN) and spleen are shown. c-d, Percentages of CD4+ and CD8+ T cells in lymph node (LN) and spleen are shown. No significant difference was detected between WT and Ythdf1−/− mice. n, numbers of mice. Data are mean ± s.e.m. and were analyzed by two-tailed unpaired Student’s t-test.
Extended Data Fig. 5 |. In vitro functional analysis of GMCSF-induced DCs (GMDCs) generated from Ythdf1−/− mice.
a, The production of IL-6, CCL2 and TNFα upon stimulation of Ythdf1−/− GMDCs with LPS. b-c, WT or Ythdf1−/− mice were injected s.c. with 106 B16-OTI-zsGreencells. Percentage of tumor infiltrating zsGreen+ DC, six days after tumor inoculation, is shown. Data are representative of two independent experiments (b). d, Splenic DCs from WT and Ythdf1−/− mice were stimulated with LPS overnight. Cross-presentation capacity of DCs in response to soluble OVA was assessed. n = 3 independent experiments for (a); n = 6 independent experiments for (d). n, numbers of mice. Data are mean ± s.e.m. and were analyzed by two-tailed unpaired Student’s t-test.
Extended Data Fig. 6 |. Transcriptome-wide analysis of the YTHDF1 binding sites in Flt3L-DCs.
a, High reproducibility of YTHDF1 RIP-seq data. For each potential YTHDF1 binding peak, the fold-enrichment of RIP/Input signal was determined for both Replicate 1 and Replicate 2. The peaks identified in both replicates were considered as high-confidence peak and indicated in red. b, Overlap of YTHDF1-binding transcripts revealed from RIP-seq of two biological replicates. c, Meta-gene analysis to show the distribution of YTHDF1-binding sites along a normalized transcript. d, Distribution of YTHDF1-binding sites in transcripts. (e) Heatmap showing the translational efficiency of co-simulatory/inhibitory (signal 2) and cytokines (signal 3) in WT and Ythdf1−/− Flt3L-DCs.
Extended Data Fig. 7 |. YTHDF1-deficient GMDCs exhibit lower translational rates.
a, High reproducibility of YTHDF1 RIP-seq data in GMDCs. For each potential YTHDF1 binding peak, the fold-enrichment of RIP/Input signal was determined for both Replicate 1 and Replicate 2. The peaks identified in both replicates were considered as high-confidence peak and indicated in red. b, Volcano plots of genes with differential translational efficiency in WT and Ythdf1−/− GMDCs. YTHDF1 targets were marked with yellow circles. P values were calculated by two-sided likelihood ratio test and adjusted by Benjamini & Hochberg method; n = 4 (2 conditions x 2 biological replicates) c, Cumulative distribution log2FoldChange of translational efficiency between WT and Ythdf1−/− GMDCs. P values were calculated by two-sided Kolmogorov-Smirnov test; n = 2 independent biological replicates. Box-plot elements: centre line, median; box limits, upper and lower quartiles; whiskers, 1–99%. d, Pie charts presenting the distribution of YTHDF1-binding sites in transcripts. e, Metagene-plot depicting nearly unchanged m6A peaks distribution and similar consensus motifs in WT and Ythdf1−/− GMDCs. P values of consensus motifs were generated by HOMER31 with one-sided binomial test. f, KEGG and GO enrichment analysis of YTHDF1 target genes revealed enrichment of biological functions related to innate immune system, lysosome and phagosome (n = 79). One-tail hypergeometric test was used to determine statistical significance of enrichment. g, Heatmap showing translational efficiency of cathepsin genes in GMDCs and Flt3L-DCs. n, numbers of genes or m6A peaks.
Extended Data Fig. 8 |. Antigen degradation is reduced in Ythdf1−/− mice and inhibition of protease cathepsins enhanced the cross-priming of WT DCs.
a, GMDCs were co-cultured with necrotic B16-OVA cells overnight. Immunoblot analysis of proteases Cathespins B/D/L (CTSB, CTSD and CTSL) in GMDCs. b, WT and Ythdf1−/− DCs were treated with Actinomycin D, RNAs collected at different time points after treatment, and mRNA levels were measured using RT-qPCR and represented as mRNA remaining after transcription inhibition (TI). ns not significant. c, GMDCs were co-cultured with necrotic B16-OVA cells overnight and OVA degradation in BMDCs was measure by Immunoblot. d, Ex vivo purified wild-type cDCs were pre-treated with 0.04 μM cathepsin inhibitor E64 and pulsed with OVA protein for 4 h. The cross-priming capacity of DCs was compared by co-culturing DCs with cell trace violet (CTV) labeled OTI-T cells. The proliferation was measured by the dilution of CTV. e, GMDCs were pre-treated with 0.2–2 μM cathepsin inhibitor E64 and co-cultured with B16-OVA cells. The cross-priming capacity of DC was compared by co-culturing DCs with isolated CD8+ T cells from naive OTI mice and analyzed by IFN-γ cytometric bead array. f, Flt3L-DCs were pre-treated with cathepsin inhibitor CA-074 or/and cathepsin L inhibitor III (CASIII), followed by co-culturing with necrotic B16-OVA cells. Synergistic inhibition effects were observed. The cross-priming capacity of DC was determined. g, data points for Fig. 4b. n = 3 independent experiments with similar results (a, c); n = 2 independent experiments (b). n, numbers of sample size. Data are mean ± s.e.m. and were analyzed by two-tailed unpaired Student’s t-test (e) or one-tailed unpaired Student’s t-test (f).
Extended Data Fig. 9 |. IFNγ within tumor tissues is responsible for the upregulation of PD-L1 in Ythdf1−/− mice.
Tumor-bearing mice were treated with 50 μg anti-IFNγ m6Ab intratumorally (i.t.) and PD-L1 expression on tumor cells is shown. n, numbers of mice. Data are mean ± s.e.m. and were analyzed by two-tailed unpaired Student’s t-test.
Supplementary Material
Acknowledgements
This study was supported by the National Key Research and Development Program of China, Stem Cell and Translational Research (2018YFA0109700 to D.H.), Strategic Priority Research Program of the Chinese Academy of Science (XDA16010404 to D.H.), National Institute of Health (HG008935 and GM113194 to C.H), Ludwig Center at the University of Chicago (C.H. and R.W.), the CAS Hundred Talent Program (D.H.), the National Natural Science Foundation of China (31870890 to M.M.X, 31741074 to D.H.), National Science Fund for Excellent Young Scholars (31622039 to B.S.), the Science Foundation for Distinguished Young Scholars of Jiangsu Province (BK20160045 to B.S.) and the Open Project of Key Laboratory of Genomic and Precision Medicine of the CAS. The Mass Spectrometry Facility of the University of Chicago is funded by National Science Foundation (CHE-1048528). C.H. is an investigator of the Howard Hughes Medical Institute. We thank Dr. J. Tauler for editing.
Footnotes
Competing interests C.H. is a scientific founder and a member of the scientific advisory board of Accent Therapeutics, Inc. A patent application on YTHDF1 has been filed by the University of Chicago.
REFERENCES
- 1.Schumacher TN & Schreiber RD Neoantigens in cancer immunotherapy. Science 348, 69–74 (2015). [DOI] [PubMed] [Google Scholar]
- 2.Ott PA et al. An immunogenic personal neoantigen vaccine for patients with melanoma. Nature 547, 217–221 (2017). [DOI] [PMC free article] [PubMed] [Google Scholar]
- 3.Yarchoan M, Johnson BA 3rd, Lutz ER, Laheru DA & Jaffee EM Targeting neoantigens to augment antitumour immunity. Nat. Rev. Cancer 17, 209–222 (2017). [DOI] [PMC free article] [PubMed] [Google Scholar]
- 4.Sahin U et al. Personalized RNA mutanome vaccines mobilize poly-specific therapeutic immunity against cancer. Nature 547, 222–226 (2017). [DOI] [PubMed] [Google Scholar]
- 5.Wang X et al. N6-methyladenosine modulates messenger RNA translation efficiency. Cell 161, 1388–1399 (2015). [DOI] [PMC free article] [PubMed] [Google Scholar]
- 6.Desrosiers R, Friderici K & Rottman F Identification of methylated nucleosides in messenger RNA from Novikoff hepatoma cells. Proc. Natl. Acad. Sci. U. S. A 71, 3971–3975 (1974). [DOI] [PMC free article] [PubMed] [Google Scholar]
- 7.Dominissini D et al. Topology of the human and mouse m6A RNA methylomes revealed by m6A-seq. Nature 485, 201–206 (2012). [DOI] [PubMed] [Google Scholar]
- 8.Jia G et al. N6-methyladenosine in nuclear RNA is a major substrate of the obesity-associated FTO. Nat. Chem. Biol 7, 885–887 (2011). [DOI] [PMC free article] [PubMed] [Google Scholar]
- 9.Meyer KD et al. Comprehensive analysis of mRNA methylation reveals enrichment in 3’ UTRs and near stop codons. Cell 149, 1635–1646 (2012). [DOI] [PMC free article] [PubMed] [Google Scholar]
- 10.Wang X et al. N-methyladenosine-dependent regulation of messenger RNA stability. Nature 505, 117–120 (2014). [DOI] [PMC free article] [PubMed] [Google Scholar]
- 11.Barbieri I et al. Promoter-bound METTL3 maintains myeloid leukaemia by m6A-dependent translation control. Nature 552, 126–131 (2017). [DOI] [PMC free article] [PubMed] [Google Scholar]
- 12.Li Z et al. FTO plays an oncogenic role in acute myeloid leukemia as a N6-Methyladenosine RNA demethylase. Cancer Cell 31, 127–141 (2017). [DOI] [PMC free article] [PubMed] [Google Scholar]
- 13.Vu LP et al. The N6-methyladenosine (m6A)-forming enzyme METTL3 controls myeloid differentiation of normal hematopoietic and leukemia cells. Nat. Med (2017). [DOI] [PMC free article] [PubMed] [Google Scholar]
- 14.Liu J et al. m6A mRNA methylation regulates AKT activity to promote the proliferation and tumorigenicity of endometrial cancer. Nat. Cell Biol 20, 1074–1083 (2018). [DOI] [PMC free article] [PubMed] [Google Scholar]
- 15.Shi H et al. m6A facilitates hippocampus-dependent learning and memory through YTHDF1. Nature 563, 249–253 (2018). [DOI] [PMC free article] [PubMed] [Google Scholar]
- 16.Yadav M et al. Predicting immunogenic tumour mutations by combining mass spectrometry and exome sequencing. Nature 515, 572–576 (2014). [DOI] [PubMed] [Google Scholar]
- 17.Mellman I, Coukos G & Dranoff G Cancer immunotherapy comes of age. Nature 480, 480–489 (2011). [DOI] [PMC free article] [PubMed] [Google Scholar]
- 18.Jongbloed SL et al. Human CD141+ (BDCA-3)+ dendritic cells (DCs) represent a unique myeloid DC subset that cross-presents necrotic cell antigens. J. Exp. Med 207, 1247–1260 (2010). [DOI] [PMC free article] [PubMed] [Google Scholar]
- 19.Spranger S, Bao R & Gajewski TF Melanoma-intrinsic beta-catenin signalling prevents anti-tumour immunity. Nature 523, 231–235 (2015). [DOI] [PubMed] [Google Scholar]
- 20.Naik SH et al. Cutting edge: generation of splenic CD8+ and CD8- dendritic cell equivalents in Fms-like tyrosine kinase 3 ligand bone marrow cultures. J. Immunol 174, 6592–6597 (2005). [DOI] [PubMed] [Google Scholar]
- 21.Mayer CT et al. Selective and efficient generation of functional Batf3-dependent CD103+ dendritic cells from mouse bone marrow. Blood 124, 3081–3091 (2014). [DOI] [PMC free article] [PubMed] [Google Scholar]
- 22.Kretzer NM et al. RAB43 facilitates cross-presentation of cell-associated antigens by CD8alpha+ dendritic cells. J. Exp. Med 213, 2871–2883 (2016). [DOI] [PMC free article] [PubMed] [Google Scholar]
- 23.Driessens G, Kline J & Gajewski TF Costimulatory and coinhibitory receptors in anti-tumor immunity. Immunol. Rev 229, 126–144 (2009). [DOI] [PMC free article] [PubMed] [Google Scholar]
- 24.Fuertes MB et al. Host type I IFN signals are required for antitumor CD8+ T cell responses through CD8{alpha}+ dendritic cells. J. Exp. Med 208, 2005–2016 (2011). [DOI] [PMC free article] [PubMed] [Google Scholar]
- 25.Woo SR et al. STING-dependent cytosolic DNA sensing mediates innate immune recognition of immunogenic tumors. Immunity 41, 830–842 (2014). [DOI] [PMC free article] [PubMed] [Google Scholar]
- 26.Cebrian I et al. Sec22b regulates phagosomal maturation and antigen crosspresentation by dendritic cells. Cell 147, 1355–1368 (2011). [DOI] [PubMed] [Google Scholar]
- 27.Samie M & Cresswell P The transcription factor TFEB acts as a molecular switch that regulates exogenous antigen-presentation pathways. Nat. Immunol 16, 729–736 (2015). [DOI] [PMC free article] [PubMed] [Google Scholar]
- 28.Benci JL et al. Tumor interferon signaling regulates a multigenic resistance program to immune checkpoint blockade. Cell 167, 1540–1554 e1512 (2016). [DOI] [PMC free article] [PubMed] [Google Scholar]
- 29.Dobin A et al. STAR: ultrafast universal RNA-seq aligner. Bioinformatics 29, 15–21 (2013). [DOI] [PMC free article] [PubMed] [Google Scholar]
- 30.Zhang Y et al. Model-based analysis of ChIP-Seq (MACS). Genome Biol. 9, R137 (2008). [DOI] [PMC free article] [PubMed] [Google Scholar]
- 31.Tripathi S et al. Meta- and orthogonal integration of influenza “OMICs” data defines a role for UBR4 in virus budding. Cell host & microbe 18, 723–735 (2015). [DOI] [PMC free article] [PubMed] [Google Scholar]
- 32.Martin M Cutadapt removes adapter sequences from high-throughput sequencing reads. Embnet Journal 17(2011). [Google Scholar]
- 33.Langmead B & Salzberg SL Fast gapped-read alignment with Bowtie 2. Nat. Methods 9, 357–359 (2012). [DOI] [PMC free article] [PubMed] [Google Scholar]
- 34.Li H et al. The sequence alignment/map format and SAMtools. Bioinformatics 25, 2078–2079 (2009). [DOI] [PMC free article] [PubMed] [Google Scholar]
- 35.Ingolia NT, Lareau LF & Weissman JS Ribosome profiling of mouse embryonic stem cells reveals the complexity and dynamics of mammalian proteomes. Cell 147, 789–802 (2011). [DOI] [PMC free article] [PubMed] [Google Scholar]
- 36.Love MI, Huber W & Anders S Moderated estimation of fold change and dispersion for RNA-seq data with DESeq2. Genome Biol. 15, 550 (2014). [DOI] [PMC free article] [PubMed] [Google Scholar]
- 37.Ramirez F, Dundar F, Diehl S, Gruning BA & Manke T deepTools: a flexible platform for exploring deep-sequencing data. Nucleic Acids Res. 42, W187–191 (2014). [DOI] [PMC free article] [PubMed] [Google Scholar]
- 38.Uren PJ et al. Site identification in high-throughput RNA-protein interaction data. Bioinformatics 28, 3013–3020 (2012). [DOI] [PMC free article] [PubMed] [Google Scholar]
- 39.Cui X et al. Guitar: An R/Bioconductor package for gene annotation guided transcriptomic analysis of RNA-related genomic features. BioMed research international 2016, 8367534 (2016). [DOI] [PMC free article] [PubMed] [Google Scholar]
- 40.Heinz S et al. Simple combinations of lineage-determining transcription factors prime cis-regulatory elements required for macrophage and B cell identities. Mol. Cell 38, 576–589 (2010). [DOI] [PMC free article] [PubMed] [Google Scholar]
Associated Data
This section collects any data citations, data availability statements, or supplementary materials included in this article.
Supplementary Materials
Data Availability Statement
The data that support the findings of this study are available from the corresponding author upon reasonable request. RIP-seq, Ribo-seq and m6A-seq data sets have been deposited in Gene Expression Omnibus under the accession number GSE115106. A summary of sequencing experiments is provided in Supplementary Table 3. The differential translational efficiency results provided in Supplementary Table 4. Source data for bar graphs and box-plots in Figures and Extended Data Figures are provided in separate excel files.


