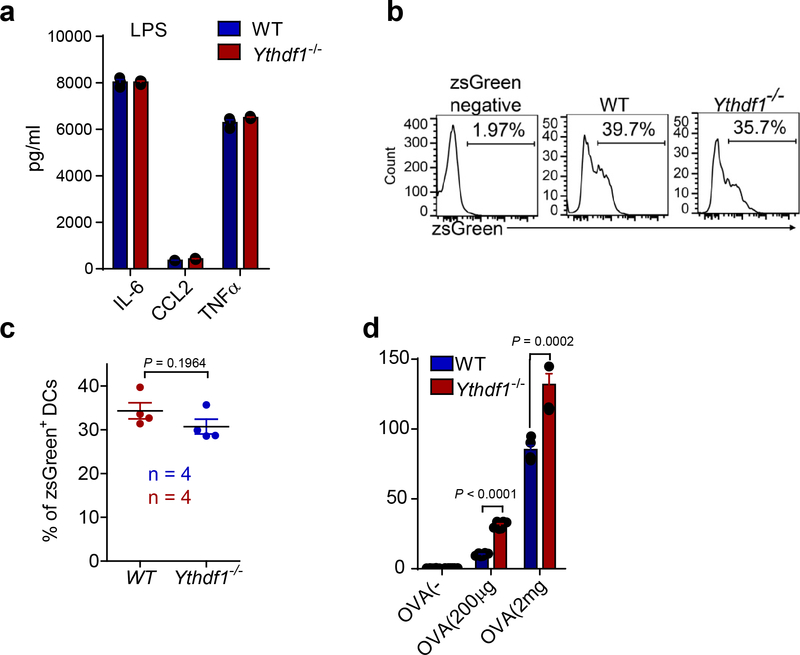
Extended Data Fig. 5 |. In vitro functional analysis of GMCSF-induced DCs (GMDCs) generated from Ythdf1−/− mice.
a, The production of IL-6, CCL2 and TNFα upon stimulation of Ythdf1−/− GMDCs with LPS. b-c, WT or Ythdf1−/− mice were injected s.c. with 106 B16-OTI-zsGreencells. Percentage of tumor infiltrating zsGreen+ DC, six days after tumor inoculation, is shown. Data are representative of two independent experiments (b). d, Splenic DCs from WT and Ythdf1−/− mice were stimulated with LPS overnight. Cross-presentation capacity of DCs in response to soluble OVA was assessed. n = 3 independent experiments for (a); n = 6 independent experiments for (d). n, numbers of mice. Data are mean ± s.e.m. and were analyzed by two-tailed unpaired Student’s t-test.

