

Abstract
Objective.
To examine whether the decline in physical activity observed from childhood through adolescence is explained by moderating effects of self-efficacy on concurrent changes in children’s goals and beliefs about their physical activity environments.
Methods.
Latent growth modeling was used in longitudinal tests in a cohort of 79 boys and 108 girls assessed in 5th, 6th, 7th, 9th and 11th grades.
Results.
Physical activity measured objectively by an accelerometer declined most in students who had bigger declines in self-efficacy and: (1) maintained higher perceptions of barriers to physical activity, (2) had bigger declines in enjoyment and fitness goals, or (3) had smaller declines in appearance and social goals.
Conclusions.
Trials of physical activity interventions based on social-cognitive theory should consider that the influence of changing goals on physical activity may differ according to whether students maintain high efficacy beliefs about overcoming barriers to physical activity coincident with perceptions of their physical activity environment.
Keywords: accelerometer, longitudinal, multi-ethnic, maturity, perceived environment
INTRODUCTION
Physical activity levels among youths are not sufficient according to national guidelines and decrease markedly between ages 9 to 15 years in the U.S. and in other nations (Corder et al., 2015; Dumith et al., 2012; Kwon & Janz, 2012; Troiano et al., 2008). This decline in physical activity during adolescence is viewed as a global public health burden (Ramires, Dumith, & Goncalves, 2015), warranting intervention to promote higher levels of physical activity in young people (Kraus et al., 2015). Physical activity interventions in children and youths have had limited success in increasing physical activity outside of school settings (Metcalf, Henley, & Wilkin, 2012; Physical Activity Guidelines for Americans Midcourse Report, 2012; van Sluijs, Kriemler, & McMinn, 2011; Rhodes et al., 2017). This is partly explainable by a shortage of prospective evidence verifying that changes in probable determinants of physical activity (e.g., social-cognitive beliefs and goals) are associated with change in physical activity among youths as they develop from childhood through adolescence (Craggs, Corder, van Sluijs, & Griffin,2011). To our knowledge, whether physical activity beliefs and goals change naturally from elementary through high school has not been determined (Plotnikoff, Costigan, Karunamuni, & Lubans, 2013). Also, it is not known whether change in physical activity and children’s beliefs and goals are influenced by maturity and body fatness (Labbrozzi, Robazza, Bertollo, Bucci, & Bortoli, 2013), which also change rapidly during early adolescence (Cairney, Veldhuizen, Kwan, Hay, & Faught, 2014; Metcalf, Hosking, Jeffery, Henley, & Wilkin, 2015).
Social-cognitive beliefs are putative influences on self-initiated change in health behaviors such as physical activity (Bandura, 2004) that may vary in importance from childhood to late adolescence, as children presumably gain more control over behavioral choices. Social-cognitive theory holds that self-efficacy should moderate the relation between changes in physical activity and perceived social and physical environments (Bandura, 2004), which are the most consistently observed correlates of physical activity among children and adolescents (Sallis et al., 2016). For example, students who maintain high self-efficacy for overcoming barriers to physical activity would be more likely to maintain higher physical activity even if social support decreases (e.g., reduced engagement with parents or changing social networks) during adolescence. In a longitudinal analysis from 5th through 7th grades, physical activity declined less in children who maintained higher concurrent levels of self-efficacy and perceived parental support (Dishman, Dowda, McIver, Saunders, & Pate, 2017). In a report on another cohort of high school girls, those who maintained a perception of strong social support had less of a decline in physical activity from 8th grade through high school if they also maintained high self-efficacy (Dishman et al., 2009).
Self-efficacy theory also posits that youths with high self-efficacy are more likely to set goals for increasing their physical activity (Bandura, 1997). Intrinsic and extrinsic goals for physical activity have been studied according to levels of autonomous or controlled motivation according to self-determination theory (e.g., Dishman et al., 2018; Sebire, Standage & Vansteenkiste, 2011). Among boys and girls followed from 6th grade through 9th grade, physical activity declined least in students who maintained higher intrinsic motivation or integrated regulation and enjoyment goal compared with students who had bigger declines in enjoyment goal. It also declined least in students who maintained higher intrinsic motivation or integrated regulation and had bigger declines in appearance, competence, or social goals (Dishman et al., 2018).
It is understood that people with high self-efficacy set higher goals, are more committed to the goals, are more likely to act on the goals, and are more likely to develop tactics to reach the goals (Bandura, 1997; Bandura, 2004). However, whether self-efficacy for physical activity moderates the influence of physical activity goals according to specific goal contents has been understudied (Plotnikoff et al., 2013; Williams & Rhodes, 2016). Changes in enjoyment (an intrinsic content) and social (an extrinsic content) goals were unrelated to change in physical activity during the transition between elementary school and middle school regardless of self-efficacy in one study (Dishman et al., 2017). We are unaware of other longitudinal studies that have tested whether self-efficacy, or its change, moderates the influence of goals on declining physical activity in a cohort of youths followed throughout adolescence. It is plausible, although untested as far as we know, that high efficacy beliefs might be differently important to sustaining physical activity when goals are intrinsic (e.g., enjoyment and competence) or extrinsic (e.g., appearance and social) (Bandura, 1997). The report here is responsive to a recent call to expand the study of self-efficacy to sources of motivation for health behaviors (Williams & Rhodes, 2016), particularly whether interactions of self-efficacy with other motivational factors can predict change in behavior (de Vries, 2016). The few physical activity studies of youths that have examined interactions of self-efficacy with environments used cross-sectional designs (Rhodes, Saelens, & Sauvage-Mar, 2018).
In the study we report here, prospective associations of beliefs drawn from social-cognitive theory (Bandura, 2004) (i.e., self-efficacy and perceptions of barriers, support from parents and friends, and the perceived neighborhood environment) and goals drawn from self-determination theory (Ryan & Deci, 2007) (i.e., enjoyment, social, fitness, appearance and competence) with change in physical activity were observed in a cohort of boys and girls followed from elementary school through high school.
The analysis extends the longitudinal analysis of change from 5th to 7th grades (Dishman et al., 2017) to children from the same cohort who were subsequently followed into high school and assessed also in their 9th and 11th grade years. We examined direct and moderated (i.e., interactions) effects of change in the variables on decline in physical activity, while also correcting for time-varying changes in maturation and an estimate of body fatness. The main hypotheses were: (1) change in self-efficacy, other social-cognitive beliefs, and goals would be related to change in physical activity, (2) self-efficacy, or its change, would moderate the relation between change in those social-cognitive beliefs and goals with change in physical activity.
METHODS
Study Design
The Transitions and Activity Changes in Kids (TRACK) study was a prospective cohort observational study elaborated elsewhere (Dishman et al., 2017) that aimed to determine personal and environmental influences on naturally occurring change in physical activity during the developmental period from elementary school through high school. Students and their parents or legal guardians were enrolled in the study when the children were in 5th grade. Assessments occurred when the students were in the 5th, 6th, 7th, 9th, and 11th grades.
Participants
The sample included a prospective cohort of 187 boys (n=79) and girls (n=108) (aged 11 ± 0.5 years) recruited in 5th grade from 21 elementary schools and followed to 13 middle schools and then nine high schools in two school districts in South Carolina. Active consent and assent forms approved by the Institutional Review Board at the University of South Carolina were completed by parents or legal guardians. The multi-ethnic cohort was maintained through the 11th grade from an initial sample of 868 5th grade boys (n=382) and girls (n=446) recruited in Spring and Fall 2010. Fourteen of the 17 elementary schools and subsequently all seven middle schools in one district and all seven elementary and all six middle schools in the other district agreed to participate. All nine high schools agreed to participate. Fifth-grade samples in each school ranged from 11 to 178 students (mean = 51, median = 46) in elementary schools and 6–172 students (mean = 78, median = 73) in middle schools. The participants represented a mean of 60% (range = 44–95%, median = 59%) of the schools’ student populations during recruitment.
Data Collection Procedures
A standardized measurement protocol was carried out at each school each year during the first month of fall semester in district one and spring semester in district two by trained data collectors according to a manual of procedures approved by Institutional Review Board. During the first visit, each participant completed the questionnaires on laptop computers, had anthropometric variables assessed, and received an accelerometer which was returned at the second visit.
Anthropometric variables.
Height and weight were each measured two times each visit by a Seca height board and a Seca Model 880 weight scale. Body masss index (BMI) was expressed as kg/m2. Maturity was defined as years of offset from estimated peak height velocity using validated prediction equations for boys (Malina & Koziel, 2014) and girls (Mirwald, Baxter-Jones, Bailey, & Beunen, 2002). Missing values were < 4%.
Race, ethnicity, and socio-economic variables.
Students self-identified as Hispanic or Latino and as American Indian or Alaskan Native, Black/African American, Native Hawaiian or other Pacific Islander, White, Asian or other (e.g., multi-racial). Percent poverty was calculated using the US Census American Community Survey variable “Poverty status in the past 12 months” based on the Census tract of each child’s place of residence (American Community Survey, 2010). Parents reported their highest level of education (1=attended high school, 2=completed high school, 3=attended college or technical school, 4=completed college or technical school, 5=attended graduate school, 6=completed graduate school) on a mailed survey at home.
Physical activity.
Each child wore an Actigraph accelerometer (models GT1M and GT3X, Pensacola, FL) during waking hours for 7 consecutive days, except while bathing, swimming or sleeping, consistent with established methods (Strath, Pfeiffer, & Whitt-Glover, 2012). An accelerometer estimates the timing and intensity of physical activity by estimating force transduced from accelerations of body movement. Studies of youths have indicated moderate associations between Actigraph counts and energy expenditure measured by indirect calorimetry during several physical activities (sweeping, laundry, throwing and catching, aerobics, basketball, comfortable walking, brisk walking, and running), which are distinguishable from static or sedentary activities (lying down, writing, computer gaming) (Trost, Loprinzi, Moore, & Pfeiffer, 2011). Accelerometers are not suitable for aquatic activities or activities that involve minimal movement, and they will underestimate the volume of activity when the force of movement is uncoupled from displacement of the body’s mass, such as rowing, cycling, or many weight lifting exercises. Accelerometry is a preferred method of estimating physical activity in observational studies (Sirard & Pate, 2001), in part because of unclear validity of commonly used self-report questionnaires (Hidding, Chinapaw, van Poppel, Mokkink, & Altenburg, 2018).
Accelerometer counts in the vertical plane were collected and stored in 60-sec epochs and reduced using methods previously described (Catellier et al., 2005; Dishman et al., 2017). Total physical activity (PA) was expressed as mean daily minutes per hour of wear time. A sustained (60 min) period of zero counts was judged as a time when the monitor was not worn. Data for Sunday were excluded from analysis because of poor wear rates and low reliability. Eighty percent of children provided accelerometer data for eight or more hours of daily wear on four or more days, representing 77% of the total records possible on Monday through Saturday. Missing values for children with at least two days of 8 or more hours of wear each day were estimated using Proc MI in SAS (Version 9.3, SAS Institute, Inc., Cary, NC). Physical activity was expressed as min/hour of wear time and was available for 187 children who were assessed in 5th grade and 11th grade and also assessed in two or all of the other grades: 6th (N=170), 7th (N=175), and 9th (N= 151) (7% missing data). Reliability (intra-class correlation coefficient (Wong & McGraw, 1996); ICC (3,6) across the 6 days was 0.82 in 5th grade, 0.81 in 6th grade, 0.86 in 7th grade, 0.75 in 9th grade, and 0.60 in 11th grade. Stability coefficients (ICC, 3,2) were .63, .55, .45, and .41 between 5th and 6th grades, 6th and 7th and 9th, and 9th and 11th grades, respectively.
Social-cognitive beliefs.
Standardized questions validated elsewhere (Dishman et al., 2002; Dishman et al., 2010; Dishman et al., 2013; Dowda et al., 2007), and here in the TRACK cohort for boys and girls in grades 5 through 11, were administered using a four-point ordered response format (“disagree a lot”, “disagree a little”, “agree a little”, “agree a lot” ) to assess eight statements assessing self-efficacy to overcome barriers (e.g., “I can be physically active during my free time on most days no matter how busy my day is”), nine statements about the perceived neighborhood environment (e.g.,”There are many places I like to go within easy walking distance of my home”) (Evenson et al., 2006), and five statements about perceived barriers (“How often do these things keep you from being physically active?”, e.g., “it would make me embarrassed” -- “never”, “sometimes”, “often”, “very often”), perceived parent and friend support (Dishman et al., 2010; Dishman et al., 2013). A five-point ordered response format (“none”, “once”, “sometimes”, “almost daily”, “daily”) was used for items from the student survey of the Amherst Health and Activity Study (Sallis, Taylor, Dowda, Freedson, & Pate, 2002) to assess perceived parental support (four statements) (e.g. “During a normal week, how often has [a male or female parent or guardian] done a physical activity or played sports with you?”) and perceived support from friends (three statements) (e.g., “During a normal week, how often do your friends encourage you to do sports or physical activities”). Missing responses to items on the questionnaires ranged from 0% to 5%.
Goals for physical activity.
Four-point ordered response scales (“not at all true for me”, “a little untrue for me”, “a little true for me”, “very true for me”) previously validated for use with boys and girls in grades 5 through 7 assessed: Enjoyment (4 items, e.g., “because it’s fun”), Social (3 items, e.g., “because I want to be with my friends”), Fitness (3 items, e.g., “because I want to be physically fit”), Competence (3 items, e.g., “because I like to do activities that are physically challenging”), and Appearance (4 items, e.g., “because I want to improve my appearance”) goals for participation in physical activities (Ryan, Frederick, Lepes, Rubio, Sheldon, 1997), consistent with self-determination theory (Ryan & Deci, 2007). Missing responses to items on the questionnaires ranged from 0% to 7%.
Statistical Analysis
Confirmatory Factor Analysis and Invariance.
Factor structures previously established in grades 5 through 7 (Dishman et al., 2013) were tested in 9th and 11th grades by confirmatory factor analysis, using standard procedures (Muthén & Muthén, 2012). The longitudinal measurement equivalence/invariance (MEI) of the model for each scale was examined between boys and girls by testing the equality of item variance and covariance between boys and girls across the five measurement periods, followed up with nested tests of metric and scalar invariance compared to the configural model (Meredith & West, 1991).
Latent Growth Modeling.
Change in physical activity and beliefs and goals was analyzed by latent growth modeling in Mplus 8.1 (Muthén & Muthén, 2012) using robust maximum likelihood (MLR) estimation, which is robust with up to 25% missing data, and multi-level adjustment for nesting effects of students within schools, as elaborated elsewhere (Dishman et al., 2017). Parameters and their standard errors were estimated for initial status (i.e., mean at 5th-grade baseline), change (i.e., slope of differences across the 5 time points from 5th to 11th grades), and the variances (i.e., inter-individual differences) of initial status and change. Slope weights were 0, 1, 2, 4, and 6).
Prediction of change in physical activity was tested by including initial status (i.e., mean at 5th grade baseline and change in physical activity regressed on initial status and change in each social-cognitive belief or goal in separate models to avoid expected multi-collinearity among related variables. All growth models converged normally, with positive variances. Residual diagnostic plots for models indicated constant variance and linearity, meeting assumptions of linear mixed model regression (Singer & Willett, 2003). Growth models (initial values in 5th grade and change between 5th and 11th grades) were compared between boys and girls in a multi-group model using the Wald test.
Latent interaction effects between changes in self-efficacy with the other social-cognitive beliefs and goals were added to the main effects in regression models and tested using robust maximum likelihood estimation (Klein & Moosbrugger, 2000; Muthen & Muthén,2012). Significant interactions were decomposed according to standard procedures for regression modeling of interactions described elsewhere (Aiken & West, 1991). Variable intercepts and regression coefficients for main effects and their interaction are used to estimate physical activity at high (plus 1 SD) and low (minus 1 SD) scores on the independent variables. Here, we convert to T-scores so that estimated physical activity scores are positive. Higher physical activity scores indicate less decline. Gender, race/ethnicity (non-Hispanic black vs others, non-Hispanic white vs others, and Hispanic vs others), parental education, and poverty level were added to the growth models as covariates. Maturity and BMI were tested as time-varying covariates.
Values of the Comparative Fit Index (CFI) ≥ 0.90 and 0.95 were used to indicate acceptable and good fit. Values ≤0.06 of the root mean square error of approximation (RMSEA) and the standardized root mean square residual (SRMR) were used to represent close fit. Concurrent values ≥ 0.95 of CFI and ≤ 0.10 of SRMR yield lowest type I and type II error rates, particulary in samples ≤250 (Hu & Bentler, 1999). The sample size of 187 was adequate for model tests. Statistical power exceeded .90 at an alpha of .05 for rejecting close fit at a RMSEA of .06 and a conservative estimate of model complexity at 60 df (MacCallum, Browne, Sugawara, 1996; MacCallum, Browne, Cai, 2006; Preacher & Coffman, 2006). Fit of the growth models reported here was acceptable (CFI ≥ 0.949, RMSEA ≤ 0.051, and SRMR ≤.100).
RESULTS
Sample Characteristics
Boys and girls in the cohort did not differ from boys and girls in the full sample in 5th grade, 6th grade, or 7th grade on any variable reported here. The sample was: 46% non-Hispanic black, 28% non-Hispanic white, 9.6% Hispanic/Latino, 3.7% Asian/Pacific Islander, 2.7% American Indian, and 10% multi-racial. The median (low to high quartiles) rate below the Federal poverty level was 18.5% (11.2% to 19.6 %). Among parents: 57% had attended or graduated from college or technical school, another 11% had attended or graduated from graduate school, 20% had completed high school only, and 12% had not completed high school. The percentage of students who were overweight (BMI ≥ 85th percentile) ranged across grades from 51% to 47% for girls and 46% to 34% for boys based on sex-specific BMI-for-age growth charts published by the Centers for Disease Control and Prevention (CDC) (Kuczmarski et al., 2000).
Between-School Variance
There was non-significant variance (i.e., p > .05 and/or ICC < .10) between schools (intra-class correlation coefficient; ICC) in physical activity in 5th (.098, p = .273), 6th (.003, p = .775), 7th (.001, p = .725), 9th (.025, p = .045), and 11th (.050, p = .209) grades. Between-school variance in the social-cognitive variables (ICC ≤ .116, p ≥ .102) and goals (ICC ≤ .056, p ≥ .127) was also small and was significant only for perceived friend support in 11th grade (ICC = .038, p = .030). Between-school variance in maturity (ICC ≤ .031, p ≥ .212) and BMI (ICC ≤ .069, p ≥.178) was also small. Thus, tests of cross-level influences of school features on child-level associations were not conducted.
Confirmatory Factor Analysis and Invariance
Factor structures were confirmed in grades 9 and 11 for self-efficacy (χ 2 ≤ 31.4, p ≥ .05, CFI ≥ 0.963, RMSEA ≤ 0.055, SRMR ≤ .044), perceived barriers (χ2 ≤ 2.83, p ≥ .419, CFI = 1.00, RMSEA = 0.000, SRMR ≤ .031), perceived neighborhood environment (χ2 ≤ 63.0, p ≥ .001, CFI > 0.907, RMSEA < 0.085, SRMR < .057), perceived parental support (χ2 ≤ 7.3, p ≥ .026, CFI ≥ 0.976, RMSEA ≤ 0.131, SRMR ≤ .025), enjoyment goal (χ2 ≤ 1.1, p ≥ .580, CFI = 1.0, RMSEA ≤ 0.00, SRMR ≤ .008, appearance goal (χ2 ≤ 5.5, p ≥ .062, CFI ≥ 0.977, RMSEA ≤ 0.098, SRMR ≤ .026, and were saturated for the three-indicator models for perceived friend support and social, fitness, and competence goals. Longitudinal tests of equal variance and covariance of scale items between boys and girls across the 6 years between 5th and 11th grades supported metric and scalar invariances for all scales (CFI difference, p ≥ .104). Equal covariance and variance of items was supported for all scales except perceived parental support.
Growth Models
Physical activity.
From a daily mean of 27.98 min/hour (95% CI = 27.43 to 28.53) in 5th grade, there was a linear decline each year of −3.36 min/hour (95% CI = −3.91 to −2.82, p <.001) followed by a quadratic slowing of the decline from 9th to 11th grades (0.31 min/hour (95% CI= 0.21 to 0.41, p <.001). (χ 2 (6)=3.17, p =.787, CFI = 1.0, RMSEA = 0.00 (95% CI = 0.0 to 0.062), SRMR = 0.061). Boys and girls differed on initial values (p <.001) and linear slope (p = .012) but had similar quadratic (p = .224) change trajectories. Mean physical activity in the 5th grade was 29.13 min/hour (95% CI = 28.02 to 30.25) in boys and 27.23 min/hour (95% CI = 26.92 to 27.55) in girls. There was a decline from 5th grade to 11th grade for boys (−3.07 min/hour (95% CI = − 3.90 to −2.23, p <.001)) and girls (−3.62 min/hour (95% CI = −4.09 to −3.15) p <.001).
Maturity.
Boys and girls differed on initial maturity offset (p <.001) and both linear (p <.001) and quadratic change (p < .001) change trajectories. Mean maturity offset in the 5th grade was −2.41 years (95% CI = −2.54 to −2.28) in boys and −0.62 years (95% CI = −0.80 to −0.43) in girls. The linear decrease each year was 0.74 (95% CI = 0.70 to 0.77) years in boys and 0.84 (95% CI = 0.80 to 0.88) years in girls. The quadratic decrease each year was 0.011 (95% CI = 0.01 to 0.02) years in boys and −0.033 (95% CI = −0.04 to −0.03) years in girls. The differences remained after adjustment for race/ethnicity.
Physical activity levels in 5th grade no longer differed significantly between boys and girls (p = .359) after adjustment for maturity offset. The difference in decline was reduced but still significant for linear decline (p = .021) and quadratic decline (p = .05) after adjusting for maturity. Adjusted for maturity offset each year, physical activity level and decline did not differ according to race (p ≥ .411) and were unrelated to parental education (p ≥ .509) or poverty (p ≥ .490).
BMI.
There was a linear increase in BMI (kg/m2) of 0.82 (95% CI = 0.71 to 0.93) each year from a mean of 21.47 (95% CI = 20.50 to 22.44) in 5th grade. Neither initial value (p =.140) or slope (p ≥ .103) differed between boys and girls. Mean in the 5th grade was 20.83 (95% CI = 20.23 to −21.42) in boys and 21.95 (95% CI = 20.49 to 23.42) in girls. The increase in BMI (kg/m2) per year was 0.70 (95% CI = 0.56 to 0.83) in boys and 0.86 (95% CI = 0.67 to 1.06) in girls. Adjusted for maturity offset, boys had higher initial BMI than girls (p = .003), but change did not differ (−p = .853) between boys and girls. Adjusted for maturity offset and BMI each year, physical activity level in 5th grade was higher in boys than girls (p = .018), but neither linear change (p = .246) nor quadratic change (p = .161) in physical activity differed between boys and girls. Initial level, linear decline, and quadratic change were not significantly related to race (p ≥ .248), parental education (p ≥ .472), or poverty (p ≥ .620).
Social-cognitive Beliefs and Goals.
There were linear declines each year for all variables (p ≤ .015), excepting a quadratic decline (− 0.009, p = .017) for competence goal and no change in appearance goal (− 0.002, p = .887). Correlations among variables and their changes are shown in Table 1. Variables were normally distributed, with the exception of enjoyment and fitness goals, which were negatively skewed. Tests of growth models were confirmed using standardized scores. Tests of growth models were confirmed using standardized scores. Growth model results according to gender are shown in Table 2. Boys had higher initial values (p ≤ =.05) for self-efficacy, friend support, and social goal. Girls had a bigger decline in favorableness of their perceived neighborhood environment and the linear component of decline in competence goal. Those gender differences were eliminated after adjustment for race. After further adjustment for maturity, parental support and appearance goal declined more in girls than boys. After further adjustment for BMI, self-efficacy declined more in boys, parent support declined less, while competence goal declined more, in girls than boys.
Table 1.
Correlations among social-cognitive beliefs and goals.
| Self- efficacy |
Perceived barriers |
Perceived environment |
Parent support |
Friend support |
Enjoyment goal |
Social goal |
Competence goal |
Fitness goal |
|
|---|---|---|---|---|---|---|---|---|---|
| Perceived | −.350*** | ||||||||
| barriers | −.436** | ||||||||
| Perceived | .306*** | −.164* | |||||||
| environment | .714*** | .217 | |||||||
| Parent | .230*** | −.088 | .352*** | ||||||
| support | .700*** | −.447* | .460* | ||||||
| Friend | .203** | −.153* | .264*** | .474*** | |||||
| support | .809*** | −.592** | .462** | .880*** | |||||
| Enjoyment | .455*** | −.188** | .180* | .121 | .257*** | ||||
| goal | .704*** | −.361* | .495** | .321 | .642** | ||||
| Social | .238*** | −.071 | .132 | .135 | .262*** | .258*** | |||
| goal | .540*** | −.247 | .241 | .281 | .626*** | .735*** | |||
| Competence | .441*** | −.217** | .187* | .354*** | .356*** | .538*** | .303*** | ||
| goal | .755*** | −.428 | .406* | .486** | 752*** | .780*** | .691*** | ||
| Fitness | .383*** | −.211** | .165* | .170* | .189* | .428*** | .222** | .595*** | |
| goal | .641*** | −.326* | .497*** | .009 | .557** | .710*** | .375** | .890*** | |
| Appearance | .178* | −.007 | .008 | .081 | .175* | .156* | .378*** | .406*** | .524*** |
| goal | .181 | −.115 | .211 | −.019 | .161 | .420** | .550*** | .794*** | .893*** |
Top row is cross-sectional association (Pearson coefficient) in 5th grade. Bottom row is association of change (standardized regression adjusted for 5th grade association).
P<.05,
P<.01
P<.001.
Table 2.
Growth models for social-cognitive beliefs and goals according to gender.
| Boys (N=79) | Girls (N=108) | Boys versus Girls | ||||||
|---|---|---|---|---|---|---|---|---|
| Variable | Unadjusted (adjusted Race) |
Adjusted Race and Maturity (and BMI) |
||||||
| 5th grade Mean (95 %CI) |
Change per year | 5th grade Mean (95% CI) |
Change per year | Initial status (p) |
Change per year (p) |
Initial status (p) |
Change per year (p) |
|
| Self-efficacy | 3.355 (3.273, 3.437) |
−0.045 (−0.066, -0.024) |
3.218 (3.168, 3.268) |
−0.042 (−0.062, -0.022) |
.009** (.864) |
.824 (.014)* |
.733 (.548) |
.274 (.021)* |
| Perceived barriers |
1.601 (1.538, 1.664) |
−0.027 (−0.041, -0.012) |
1.675 (1.579, 1.771) |
−0.010 (−0.032, 0.013) |
.138 (.238) |
.199 (.088) |
.266 (.762 ) |
<.001***
(.558) |
| Perceived neighborhood |
2.880 (2.780, 2.980) |
−0.045 (−0.069, -0.021) |
2.904 (2.774, 3.035) |
−0.069 (−0.102, -0.037) |
.718 (.818) |
.031* (<.001)*** |
.689 (.929) |
.503 (.979) |
| Parent support | 6.899 (6.595,7.203) |
−0.201 (−0.258, -0.145) |
6.683 (6.558, 6.808) |
−0.258 (−0.318, -0.199) |
.195 (.994) |
.235 (.223) |
<.001*** (<.001)** |
.035* (.001)*** |
| Friend support | 3.617 (3.379, 3.855) |
−0.083 (−0.118, -0.048) |
3.280 (3.172, 3.387) |
−0.101 (−0.146, -0.056) |
.028* (.346) |
.586 (.509) |
.729 (.276) |
.839 (.353) |
| Enjoyment goal |
3.692 (3.576, 3.808) |
−0.037 (−0.065, − 0.008) |
3.576 (3.509, 3.644) |
−0.048 (−0.072, −0.025) |
.087 (.336) |
.562 (.294) |
.866 (.380) |
.196 (<.001)*** |
| Social goal | 2.763 (2.632, 2.895) |
0.002 (−0.012, 0.016) |
2.562 (2.466, 2.658) |
−0.041 (−0.075, -0.007) |
.030* (.502) |
.063 (.049)* |
.758 (.670) |
<.001*** (.030)* |
| Competence goal |
3.462 (3.345, 3.578) |
0.016 −0.041, 0.074) −.004 quadratic (−0.013,0.004 |
3.357 (3.238, 3.477) |
−0.132 (−0.216, −0.047) 0.015 quadratic (0.000, 0.030) |
.349 (.499) |
.027* .066 (.876) |
.314 (.020)* |
.004** <.001*** (.009)** (<.001)*** |
| Fitness goal | 3.655 (3.554, 3.757) |
−0.017 −0.047, 0.014) |
3.596 (3.481, 3.712) |
−0.041 (−0.059, −0.023) |
.546 .544 |
.260 (<.001)*** |
.396 (.522) |
.222 (.357) |
| Appearance goal |
3.221 (3.071, 3.372) |
0.002 −0.054, 0.058) |
3.186 (2.952, 3.419) |
−0.003 (−0.023, -0.016) |
.820 (.817) |
.869 (<.001)*** |
.076 (.347) |
.014* (.058) |
P-value <.05
P-value <.01
P-value <.001
5th grade Relationships.
Initial physical activity was positively related to initial levels of parent support (p =.002). After adjustment for gender and race (Table 3, model 1), initial physical activity was inversely related to perceived barriers and positively related to initial levels of self-efficacy, parent support, and social goal. After further adjustment for maturity (Table 3, model 2) and BMI (Table 3, model 3), physical activity was related to self-efficacy, parental support, friend support and to enjoyment, social, fitness, and competence goals. Enjoyment goal was positively related to parental education (.238, p = .014), but otherwise initial levels of variables were not significantly related to parental education (p > .161), or poverty (p ≥ .091).
Table 3.
Cross-sectional and longitudinal associations of physical activity with social-cognitive beliefs and goals.
| Model 1 | Model 2 | Model 3 | ||||
|---|---|---|---|---|---|---|
| Variable | 5th grade Coefficient β (SE) |
Change slope Coefficient β (SE) |
5th grade Coefficient β (SE) |
Change slope Coefficient β (SE) |
5th grade Coefficient β (SE) |
Change slope Coefficient β (SE) |
| Self-efficacy | .332 (.143)* | −.020 (.098) .210 (.259) |
.384 (.117)*** | −.027 (.072) .169 (.206) |
.408 (.099)*** | −.082 (.076) .184 (.211) |
| Perceived barriers | −.110 (.046)* | .094 (.123) −.234 (.138) |
−.066 (.054) | .068 (.118) −.194 (.127) |
−.059 (.053) | .064 (.116) −.212 (.154) |
| Perceived neighborhood | .135 (.073) | −.002 (.126) −.027 (.153) |
.170 (.076)* | −.043 (.105) −.036 (.128) |
.207 (.114) | −.058 (.129) −.021 (.138) |
| Parent support | .339 (.067)*** | .078 (.207) .150 (.075)* |
.429 (.055)*** | .032 (.171) .118 (.062) |
.469 (.054)*** | −.037 (.170) .149 (.062)* |
| Friend support | .169 (.105) | −.078 (.117) .244 (.144) |
.196 (.100)* | −.068 (.099) .205 (.100)* |
.245 (.096)** | −.132 (.106) .196 (.116) |
| Enjoyment goal | .120 (.071) | −.003 (.011) .085 (.044)* |
.314 (.138)* | −.042 (.068) .162 (.094) |
.299 (.150)* | −.058 (.071) .170 (.115) |
| Social goal | .217 (.112)* | .046 (.092) −.092 (.127) |
.306 (.112)** | .009 (.070) −.081 (.099) |
.347 (.102)*** | −.037 (.104) −.101 (.097) |
| Competence goal | .194 (.143) | .184 (.086)* .092 (.139) |
.252 (.150) | .050 (.095) .345 (.137)* |
.268 (.136)* | .043 (.101) .302 (.097)** |
| Fitness goal | .150 (.171) | .135 (.071) .241 (.100)* |
.182 (.133) | .082 (.071) .231 (.080)** |
.216 (.107)* | .060 (.094) .224 (.099)* |
| Appearance goal | .005 (.130) | .195 (.048)*** −.017 (.066) |
.061 (.134) | .142 (.051)** .030 (.074) |
.106 (.130) | .121 (.072) .010 (.085) |
Change slope coefficient on first line indicates prediction of change in physical activity by 5th grade level of beliefs and goals.
Change slope coefficient on second line indicates prediction of change in physical activity by change in beliefs and goals.
Model 1 adjusted for gender and race. Model 2 also adjusted for maturity. Model 3 also adjusted for BMI.
P-value <.05
P-value <.01
P-value <.001
Longitudinal Relationships.
Decline in physical activity was positively related to 5th grade self-efficacy (p = .006) and parental support (p = .039), positively related to declines in self-efficacy (p < .001), friend support (p = .016) and to enjoyment (p = .008), fitness (p <.001), and competence (p = .009) goals, and negatively related to decline in perceived barriers (p = .001). After adjustment for gender and race, decline in physical activity was positively related to 5th grade appearance and competence goals and to declines in parental support and to enjoyment and fitness goals (Table 3, model 1). After further adjustment for maturity (Table 3, model 2) and BMI (Table 3, model 3), decline in physical activity was related to declines in parental support and declines in fitness and competence goals. Change in perceived friend support was positively related to parental education (.281, p =.023). Otherwise, declines in the variables were not significantly related to parental education (p ≥ .208), or poverty (p ≥ .135).
Moderated (i.e., interaction) Effects
There was an interaction effect between change in self-efficacy and change in perceived barriers (z-value = 4.30, p < .001). After adjustment for gender and race, there were interaction effects between change in self-efficacy and changes in perceived barriers (z-value = 2.89, p = .004) perceived environment (z-value = 3.07, p = .002) and changes in enjoyment (z-value = 2.62, p = .009) and appearance (z-value = 10.63, p < .001) goals on decline in physical activity.
Physical activity declined most in students who had bigger declines in self-efficacy and maintained higher perceptions of barriers to physical activity compared to students who maintained higher self-efficacy and lower perceived barriers (Figure 1). Students who had bigger declines in self-efficacy had bigger declines in physical activity even when they maintained more favorable perceptions of their neighborhood environment (Figure 1). Declines in physical activity were also larger in students who had bigger declines in self-efficacy concurrent with bigger declines in enjoyment or fitness goals (Figure 2) or smaller declines in appearance or social goals (Figure 3). The interaction effects of change in self-efficacy with changes in perceived barriers and perceived environment and with enjoyment and appearance goals remained after further adjustment for maturity (p ≤ .006), when the interaction of selfefficacy with social goals was also significant (z-value = 2.91, p = .004). Those effects remained significant after adjustment for BMI, when the interaction of self-efficacy with fitness goal was also significant (z-value = 3.32, p = .001).
Figure 1.
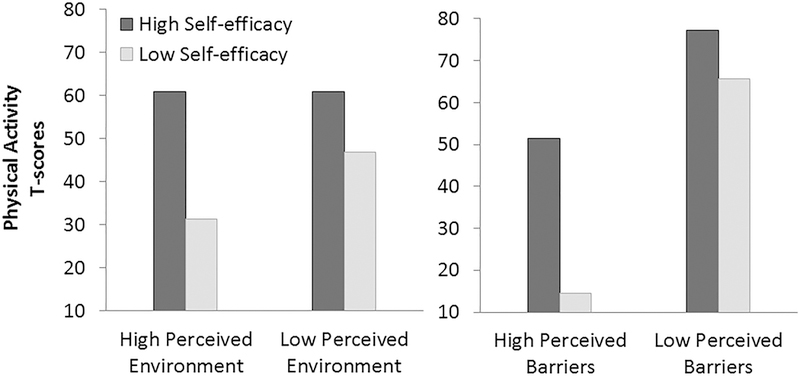
Change in self-efficacy moderated the influence of change in perceived environment and perceived barriers on physical activity in a cohort of boys and girls from 5th through 11th grades. Higher physical activity scores indicate less decline.
Figure 2.
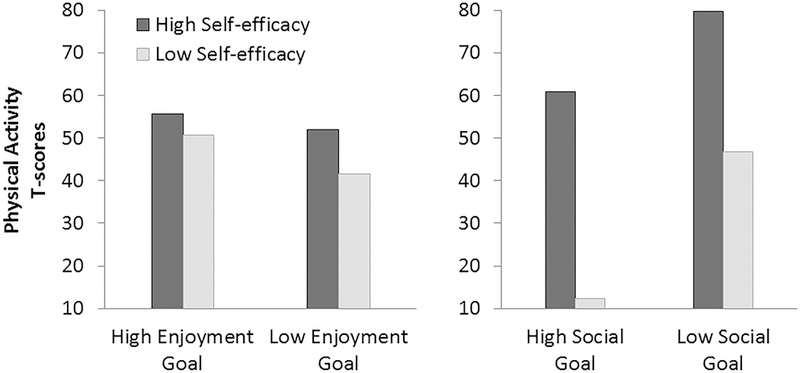
Change in self-efficacy moderated the influence of change in enjoyment and social goals on physical activity in a cohort of boys and girls from 5 th through 11th grades.Higher physical activity scores indicate less decline.
Figure 3.
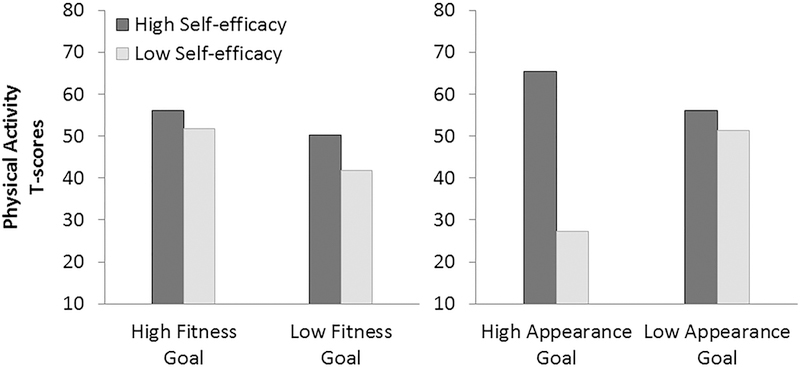
Change in self-efficacy moderated the influence of change in finess and appearance goals on physical activity in a cohort of boys and girls from 5th through 11th grades. Higher physical activity scores indicate less decline.
DISCUSSION
New findings of the study are the moderating effects of self-efficacy for overcoming barriers on concurrent changes in perceived barriers and the neighborhood environment, as well as students’ goals, to influence change in physical activity. Prior observational studies that used a longitudinal design to test social-cognitive theories of adolescent physical activity did not model change across more than a few months, relied on a self-report of physical activity, and did not test whether changes in goals interacted with self-efficacy (Plotnikoff et al., 2013), as is posited by self-efficacy theory (Bandura, 1997). As far as we know, this is the first report of change in objectively measured physical activity across this time period in a cohort of youths.
Neither initial 5th grade level nor change in self-efficacy was directly related to decline in physical activity, after adjustment for gender and race. Rather, physical activity declined most in students who had bigger declines in self-efficacy and maintained higher perceptions of barriers to physical activity compared to students who maintained higher self-efficacy and lower perceived barriers. Students who had bigger declines in self-efficacy had bigger declines in physical activity even when they maintained more favorable perceptions of their neighborhood environment. Declines in physical activity were also larger in students who had bigger declines in self-efficacy concurrent with bigger declines in enjoyment or fitness goals or smaller declines in appearance or social goals.
Collectively, the results suggest that change in self-efficacy may have different impacts on changing goals for engaging in physical activity. Declines in self-efficacy were additive with declines in goals for enjoyment or fitness, such that loss of confidence in overcoming barriers to physical activity were compounded by lessened motivation to pursue fitness or fun through engaging in physical activity. In contrast, students who tended to maintain appearance and social goals nonetheless had larger declines in physical activity when self-efficacy declined. This seems explained by the negative relationships of change in self-efficacy with change in social and goal and null relationship with appearance goals, in contrast with positive associations of self-efficacy with other goals. Students who maintained higher self-efficacy from 5th through 11th grades had larger declines in social goal, while those who had larger declines in self-efficacy maintained higher social goals. These differences have implications for physical activity interventions by suggesting that students who continue to view physical activity as a means to pursue appearance and social outcomes, while losing confidence in their ability to be active in the face of perceived barriers, may particularly benefit from interventions designed to build efficacy beliefs (Dishman et al., 2009).
Here, social goals were limited to affiliation with friends, but social goals are likely more complex than this during adolescence. Beyond a desire to spend time with friends, other facets of social motivations such as a desire to impress friends or others or the pursuit of other social needs or ideals might influence physical activity. Here, social embarrassment was one indicator of perceived barriers to physical (Dishman et al., 2013). Social goals and perceived barriers were verified as separate constructs in the TRACK cohort, but their negative relationship encourages future elaboration of how specific goals and perceived barriers relate or interact to influence physical activity.
Strengths of the study are the use of an objective measure of physical activity, repeated observations of a cohort of boys and girls followed for six years from the 5th grade through the 11th grade, and the use of latent growth modeling to estimate the typical change, and its variance, across students in physical activity and the social-cognitive determinants. Other longitudinal studies of similar variables were limited to less precise estimates of change across one, two, or three years and did not encompass this developmental range in the same cohort (Corder et al., 2013; Dishman et al., 2017; Dishman, Dunn et al., 2010; Hearst, Patnode, Sirard, Farbakhsh, & Lytle, 2012).
A limitation of the study is potential sample bias of the smaller cohort derived from the larger sample recruited initially in the 5th grade. However, the cohort did not differ from the full sample on the study variables at study outset or at 6th and 7th grades, which mitigates the likelihood of selection bias. Cohort maintenance is a challenge during the longitudinal study of children through adolescence and may partly explain why so few cohort studies of physical activity motivation have been reported. A systematic review and meta-analysis of 46 self-determination studies of physical activity in children and adolescents (Owen et al., 2014) located only five longitudinal studies. None used an objective measure of physical activity, none observed change across more than two years, and all were judged to have sampling bias. Only six of 23 observational studies of physical activity located in a systematic review and meta-analysis of social-cognitive theories and adolescent physical activity (Plotnikoff et al., 2013) used a longitudinal design. None used an objective measure of physical activity, observed change across more than two years, or tested whether changes in social-cognitive variables interacted (Plotnikoff et al., 2013). Another limitation is the assessment of variables across several weeks in fall semester in one district and spring semester in the other district. However, variation in timing of assessments was addressed by testing nesting effects within schools and including maturity as a covariate.
Growth models were tested while adjusting for maturational differences between boys and girls and BMI. Maturity was inversely related to physical activity and explained higher physical activity among boys in the 5th grade and part of the steeper decline in physical activity among girls during middle school, after which most boys have narrowed the developmental lag with girls in height. However, interaction effects of change in self-efficacy with changes in perceived barriers and perceived environment, and with enjoyment and appearance goals, were independent of time-varying adjustment for maturity. In contrast, adjustment for maturity revealed that levels of fitness and competence goals in 5th grade predicted less of a decline in physical activity and strengthened the interaction between declining self-efficacy and social goals.
Decline in physical activity was not directly related to declines in students’ perceptions of parental or friend support, as was previously reported between grades 5 through 7 (Dishman et al. 2017). Here, perceived parent support, but not friend support, was related to physical activity in 5th grade and predicted less of a decline in physical activity, independently of change in self-efficacy. In prior reports, initial levels on similar constructs were predictive of change in physical activity measured by accelerometer among boys and girls across one year from age 9 to 10 years (Corder et al., 2013), and self-efficacy mediated the cross-sectional influence of social support on physical activity in 6th graders (Peterson et al., 2013). In another report, self-efficacy moderated the influence of declining social support on declining physical activity in girls from 8th through 12th grades (Dishman et al., 2009). The present findings suggest that perceptions of social support from parents and friends decline, and have less influence on physical activity, from early to late adolescence, regardless of self-efficacy for overcoming barriers to physical activity.
The findings extend evidence for the longitudinal measurement equivalence/ invariance of the social-cognitive measures, previously validated in 5th, 6th, and 7h grade boys and girls (Dishman et al., 2013; Dishman et al., 2017), to boys and girls in 9th and 11th grades. Results were similar for boys and girls. Findings were not influenced by race/ethnicity, except for the influence on physical activity. Except for small positive correlations of parental education with 5th grade friend support and change in enjoyment goal, variables were not influenced by parents’ reports of education level and the percentage of families at or below poverty level based on US census tract data. We cannot rule out influences by other measures of socio-economic status not measured here, but which have been found inconsistently in mainly cross-sectional studies using a self-report of physical activity (Stalsberg & Pedersen, 2010).
In conclusion, the findings indicate that naturally occurring changes in self-efficacy for overcoming barriers to physical activity interact with other beliefs about physical activity (i.e., perceptions of barriers and the perceived neighborhood) and changing goals for participating in physical activity (i.e. enjoyment, appearance, fitness, and social goal contents) that are feasible targets of interventions designed to stop or lessen the steep decline in physical activity observed during adolescence from elementary school through high school.
Acknowledgments
This study was funded by grant number R01HL091002 from the National Heart, Lung and Blood Institute.
References
- Aiken LS, West SG. (1991). Multiple Regression: Testing and Interpreting Interactions. Thousand Oaks, CA: Sage Publications. [Google Scholar]
- American Community Survey (2010). 2006–2010 American Community Survey Selected Population Tables: Poverty Status in the Past 12 Months by Sex and Age. Washington, DC: US Census Bureau. [Google Scholar]
- Atkin AJ, van Sluijs EM, Dollman J, Taylor WC, & Stanley RM. (2016). Identifying correlates and determinants of physical activity in youth: How can we advance the field? Preventive Medicine, 87:167–169. doi: 10.1016/j.ypmed.2016.02.040. [DOI] [PMC free article] [PubMed] [Google Scholar]
- Bandura A (2004). Health promotion by social cognitive means. Health Education and Behavior, 31, 143–164. [DOI] [PubMed] [Google Scholar]
- Bandura A (1997). Self-efficacy: The exercise of controlL New York, NY: W.H. Freeman and Company. [Google Scholar]
- Cairney J, Veldhuizen S, Kwan M, Hay J, & Faught BE. (2014). Biological age and sex-related declines in physical activity during adolescence. Medicine and Science in Sports and Exercise, 46(4), 730–735. doi: 10.1249/MSS.0000000000000168. [DOI] [PubMed] [Google Scholar]
- Catellier DJ, Hannan PJ, Murray DM, Addy CL, Conway TL, Yang S, & Rice JC (2005). Imputation of missing data when measuring physical activity by accelerometry. Medicine and Science in Sports and Exercise, 37(11 Suppl), S555–S562. [DOI] [PMC free article] [PubMed] [Google Scholar]
- Corder K, Craggs C, Jones AP, Ekelund U, Griffin SJ, van Sluijs EM. (2013). Predictors of change differ for moderate and vigorous intensity physical activity and for weekdays and weekends: a longitudinal analysis. International Journal of Behavioral Nutrition and Physical Activity, 10:69. doi: 10.1186/1479-5868-10-69. [DOI] [PMC free article] [PubMed] [Google Scholar]
- Corder K, Sharp SJ, Atkin AJ, Griffin SJ, Jones AP, Ekelund U, & van Sluijs EM. (2015). Change in objectively measured physical activity during the transition to adolescence. British Journal of Sports Medicine, 49(11):730–736. doi: 10.1136/bjsports-2013-093190. [DOI] [PMC free article] [PubMed] [Google Scholar]
- Craggs C, Corder K, van Sluijs EM, & Griffin SJ. (2011). Determinants of change in physical activity in children and adolescents: A systematic review. American Journal of Preventive Medicine, 40(6), 645–658. doi: 10.1016/j.amepre.2011.02.025. Review. [DOI] [PMC free article] [PubMed] [Google Scholar]
- de Vries H (2016). Self-efficacy: skip the main factor paradigm! A comment on Williams and Rhodes. Health Psychology Review, 10(2), 140–143. [DOI] [PubMed] [Google Scholar]
- Dishman RK, Dowda M, Mclver KL, Saunders RP, Pate RR. (2017). Naturally-occurring changes in social-cognitive factors modify change in physical activity during early adolescence. PLoS One, 12(2):e0172040. doi: 10.1371/journal.pone.0172040. [DOI] [PMC free article] [PubMed] [Google Scholar]
- Dishman RK, Dunn AL, Sallis JF, Vandenberg RJ, & Pratt CA. (2010). Social-cognitive correlates of physical activity in a multi-ethnic cohort of middle-school girls: Two-year prospective study. Journal of Pediatric Psychology, 35(2), 188–198. doi: 10.1093/jpepsy/jsp042. [DOI] [PMC free article] [PubMed] [Google Scholar]
- Dishman RK, Hales DP, Sallis JF, Saunders R, Dunn AL, Bedimo-Rung AL, & Ring KB. (2010). Validity of social-cognitive measures for physical activity in middle-school girls. Journal of Pediatric Psychology, 35(1), 72–88. doi: jsp031 [pii]; 10.1093/jpepsy/jsp031. [DOI] [PMC free article] [PubMed] [Google Scholar]
- Dishman RK, Mclver KL, Dowda M, Pate RR. (2018). Declining physical activity and motivation from middle school to high school. Medicine and Science in Sports and Exercise, 2018, 50(6), 1206–1215. [DOI] [PMC free article] [PubMed] [Google Scholar]
- Dishman RK, Motl RW, Saunders RP, Dowda M, Felton G, Ward DS, & Pate RR. (2002). Factorial invariance and latent mean structure of questionnaires measuring social-cognitive determinants of physical activity among black and white adolescent girls. Preventive Medicine, 34(1), 100–108. [DOI] [PubMed] [Google Scholar]
- Dishman RK, Saunders RP, Felton G, Ward DS, Dowda M, Pate RR. (2006). Goals and intentions mediate efficacy beliefs and declining physical activity in high school girls. American Journal of Preventive Medicine, 31(6), 475–483. [DOI] [PubMed] [Google Scholar]
- Dishman RK, Saunders RP, McIver KL, Dowda M, & Pate RR. (2013). Construct validity of selected measures of physical activity beliefs and motives in fifth and sixth grade boys and girls. Journal of Pediatric Psychology, 38(5), 563–576. doi: 10.1093/jpepsy/jst013. [DOI] [PMC free article] [PubMed] [Google Scholar]
- Dishman RK, Saunders RP, Motl RW, Dowda M, & Pate RR (2009). Self-efficacy moderates the relation between declines in physical activity and perceived social support in high school girls. Journal of Pediatric Psychology, 34, 441–451. doi: 10.1093/jpepsy/jsn100. [DOI] [PMC free article] [PubMed] [Google Scholar]
- Dowda M, Dishman RK, Pfeiffer KA, & Pate RR. (2007). Family support for physical activity in girls from 8th to 12th grade in South Carolina. Preventive Medicine, 44, 153–159. [DOI] [PMC free article] [PubMed] [Google Scholar]
- Dowda M, Dishman RK, Porter D, Saunders RP, & Pate RR. (2009). Commercial facilities, social cognitive variables, and physical activity of 12th grade girls. Annals of Behavioral Medicine, 37(1), 77–87. doi: 10.1007/s12160-009-9080-0. [DOI] [PubMed] [Google Scholar]
- Dumith SC, Gigante DP, Domingues MR, Hallal PC, Menezes AM, & Kohl HW III, (2012). A longitudinal evaluation of physical activity in Brazilian adolescents: tracking, change and predictors. Pediatric Exercise Science, 24(1), 58–71. [DOI] [PMC free article] [PubMed] [Google Scholar]
- Duncan SC, Duncan TE, Strycker LA, and Chaumeton NR. (2007). A cohort-sequential latent growth model of physical activity from ages 12 to 17 years. Annals of Behavioral Medicine, 33, 80–89. [DOI] [PMC free article] [PubMed] [Google Scholar]
- Evenson KR, Birnbaum AS, Bedimo-Rung AL, Sallis JF, Voorhees CC, Ring K, & Elder JP. (2006). Girls’ perception of physical environmental factors and transportation: Reliability and association with physical activity and active transport to school. International Journal of Behavioral Nutrition and Physical Activity, 3, 28. [DOI] [PMC free article] [PubMed] [Google Scholar]
- Graham DJ, Wall MM, Larson N, & Neumark-Sztainer D. (2014). Multicontextual correlates of adolescent leisure-time physical activity. American Journal of Preventive Medicine, 46(6), 605–616. doi: 10.1016/j.amepre.2014.01.009. [DOI] [PMC free article] [PubMed] [Google Scholar]
- Hearst MO, Patnode CD, Sirard JR, Farbakhsh K, & Lytle LA. (2012). Multilevel predictors of adolescent physical activity: A longitudinal analysis. International Journal of Behavioral Nutrition and Physical Activity, 9,8. doi: 10.1186/1479-5868-9-8. [DOI] [PMC free article] [PubMed] [Google Scholar]
- Hidding LM, Chinapaw MJM, van Poppel MNM, Mokkink LB, Altenburg TM. (2018). An Updated Systematic Review of Childhood Physical Activity Questionnaires. Sports Medicine, October 8. doi: 10.1007/s40279-018-0987-0. [Epub ahead of print] Review. [DOI] [PMC free article] [PubMed] [Google Scholar]
- Hu L, Bentler PM. (1999). Cutoff criteria for fit indices in covariance structure analysis: Conventional criteria versus new alternatives. Structural Equation Modeling, 6,1–55. [Google Scholar]
- Klein A, & Moosbrugger H (2000). Maximum likelihood estimation of latent interaction effects with the LMS method. Psychometrika, 65(4), 457–474. [Google Scholar]
- Kraus WE, Bittner V, Appel L, Blair SN, Church T, Despres JP, … Whitsel L (2015). The National Physical Activity Plan: a call to action from the American Heart Association: a science advisory from the American Heart Association. Circulation, 131(21), 1932–40. doi: 10.1161/CIR.0000000000000203. [DOI] [PubMed] [Google Scholar]
- Kwon S, Janz KF. (2012). International Children’s Accelerometry Database C. Tracking of accelerometry-measured physical activity during childhood: ICAD pooled analysis. Internaitonal Journal of Behavioral Nutrition and Physical Activity, 9, 68. doi: 10.1186/1479-5868-9-68. [DOI] [PMC free article] [PubMed] [Google Scholar]
- Kuczmarski RJ, Ogden CL, Grummer-Strawn LM, Flegal KM, Guo SS, Wei R, … Johnson CL (2000). CDC Growth Charts: United States. Advance Data. June 8;(314):1–27. [PubMed] [Google Scholar]
- Labbrozzi D, Robazza C, Bertollo M, Bucci I, & Bortoli L. (2013). Pubertal development, physical self-perception, and motivation toward physical activity in girls. Journal of Adolescence, 36(4),759–765. doi: 10.1016/j.adolescence.2013.06.002. [DOI] [PubMed] [Google Scholar]
- Lubans DR, Foster C, & Biddle SJ. (2008). A review of mediators of behavior in interventions to promote physical activity among children and adolescents. Preventive Medicine, 47(5), 463–470. doi: 10.1016/j.ypmed.2008.07.011. [DOI] [PubMed] [Google Scholar]
- MacCallum RC, Browne MW, Sugawara HM. Power analysis and determination of sample size for covariance structure modeling. Psychol Methods. 1996;1:130–149. [Google Scholar]
- MacCallum RC, Browne MW, Cai L. Testing differences between nested covariance structure models: Power analysis and null hypotheses. Psychol Methods. 2006;11(1):19–35. [DOI] [PubMed] [Google Scholar]
- Malina RM, & Koziel SM. (2014). Validation of maturity offset in a longitudinal sample of Polish boys. Journal of Sports Science, 32(5), 424–437. doi: 10.1080/02640414.2013.828850. [DOI] [PubMed] [Google Scholar]
- Meredith W, & Teresi JA. (2006). An essay on measurement and factorial invariance. Medical Care, 44(11), S69–S77. doi: DOI 10.1097/01.mlr.0000245438.73837.89. [DOI] [PubMed] [Google Scholar]
- Metcalf B, Henley W, & Wilkin T. (2012). Effectiveness of intervention on physical activity of children: Systematic review and meta-analysis of controlled trials with objectively measured outcomes (EarlyBird 54). British Medical Journal, 345:e5888 DOI: 10.1136/bmj.e5888. [DOI] [PubMed] [Google Scholar]
- Metcalf BS, Hosking J, Jeffery AN, Henley WE, & Wilkin TJ. (2015). Exploring the adolescent fall in physical activity: A 10-year cohort study (EarlyBird 41). Medicine and Science in Sports and Exercise, 47(10), 2084–2092. doi: 10.1249/MSS.0000000000000644. [DOI] [PubMed] [Google Scholar]
- Mirwald RL, Baxter-Jones AD, Bailey DA, & Beunen GP. (2002). An assessment of maturity from anthropometric measurements. Medicine and Science in Sports and Exercise, 34(4), 689–694. [DOI] [PubMed] [Google Scholar]
- Muthé LK, Muthén BO. (2012). Mplus: Statistical Analysis with Latent Variables (edition 7.0). Los Angeles: Muthen and Muthen. [Google Scholar]
- Nader PR, Bradley RH, Houts RM, McRitchie SL, & O’Brien M. (2008). Moderate-to-vigorous physical activity from ages 9 to 15 years. JAMA, 300(3), 295–305. doi: 10.1001/jama.300.3.295. PMID: . [DOI] [PubMed] [Google Scholar]
- Owen KB, Smith J, Lubans DR, Ng JY, Lonsdale C. (2014). Self-determined motivation and physical activity in children and adolescents: a systematic review and meta-analysis. Preventive Medicine, 67, 270–279. [DOI] [PubMed] [Google Scholar]
- Peterson MS, Lawman HG, Wilson DK, Fairchild A, & Van Horn M (2013). The association of self-efficacy and parent support on physical activity in male and female adolescents. Health Psycyhology, 32(6), 666–674. doi: 10.1037/a0029129. [DOI] [PMC free article] [PubMed] [Google Scholar]
- Physical Activity Guidelines for Americans Midcourse Report Subcommittee (2013). President’s Council on Fitness Sports and Nutrition Physical Activity Guidelines for Americans Midcourse Report: Strategies to Increase Physical Activity Among Youth. Washington, DC: U.S. Department of Health and Human Services 2012. [Google Scholar]
- Plotnikoff RC, Costigan SA, Karunamuni N, Lubans DR. (2013). Social cognitive theories used to explain physical activity behavior in adolescents: a systematic review and meta-analysis. Preventive Medicine, 56, 245–253. doi: 10.1016/j.ypmed. [DOI] [PubMed] [Google Scholar]
- Preacher KJ, & Coffman DL (2006, May). Computing power and minimum sample size for RMSEA [Computer software]. Available from http://quantpsy.org/.
- Ramires VV, Dumith SC, & Goncalves H. (2015). Longitudinal association between physical activity and body fat during adolescence: A systematic review. Journal of Physical Activity and Health, 12(9), 1344–58. doi: 10.1123/jpah.2014-0222. [DOI] [PubMed] [Google Scholar]
- Rhodes RE, Janssen I, Bredin SSD, Warburton DER, Bauman A. (2017). Physical activity: Health impact, prevalence, correlates and interventions. Psychology & Health, 32(8), 942–975. [DOI] [PubMed] [Google Scholar]
- Rhodes RE, Saelens BE, Sauvage-Mar C. (2018). Understanding Physical Activity through Interactions Between the Built Environment and Social Cognition: A Systematic Review. Sports Medicine, 48, 1893–1912. [DOI] [PubMed] [Google Scholar]
- Ryan RM, Deci EL (2007). Active human nature: Self-determination theory and the promotion and maintenance of sport, exercise, and health In: Hagger MS, Chatzisarantis NLD, editors. Intrinsic Motivation and Self-determination in Exercise and Sport.(pp. 1–19). Champaign: Human Kinetics. [Google Scholar]
- Ryan RM, Frederick CM, Lepes D, Rubio N, & Sheldon KM. (1997). Intrinsic motivation and exercise adherence. International Journal of Sport Psychology. 1997;28(4):335–354. [Google Scholar]
- Sallis JF, Bull F, Guthold R, Heath GW, Inoue S, Kelly P, … Hallal PC (2016). Progress in physical activity over the Olympic quadrennium. The Lancet, 388, 1325–1336. [DOI] [PubMed] [Google Scholar]
- Sallis JF, Taylor WC, Dowda M, Freedson PS, Pate RR. Correlates of vigorous physical activity for children in grades 1 through 12: Comparing parent-reported and objectively measured physical activity. Pediatr Exerc Sci. 2002;14(1):30–44. [Google Scholar]
- Sebire SJ, Standage M, Vansteenkiste M. (2011). Predicting objectively assessed physical activity from the content and regulation of exercise goals: evidence for a mediational model. J Sport and Exercise Psychology, 33, 175–197. [DOI] [PubMed] [Google Scholar]
- Singer JD, Willett JB. (2003). Applied Longitudinal Data Analysis (pp. 127–132). New York, New York: Oxford University Press. [Google Scholar]
- Sirard JR, Pate RR. (2001), Physical activity assessment in children and adolescents. Sports Medicine, 31(6) 439–454. [DOI] [PubMed] [Google Scholar]
- Stalsberg R, Pedersen AV. (2010). Effects of socioeconomic status on the physical activity in adolescents: a systematic review of the evidence. Scandinavian Journal of Medicine and Science in Sports, 20(3), 368–383. [DOI] [PubMed] [Google Scholar]
- Strath SJ, Pfeiffer KA, & Whitt-Glover MC. (2012). Accelerometer use with children, older adults, and adults with functional limitations. Medicine and Science in Sports and Exercise, 44, (1 Suppl 1), S77–S85. doi: 10.1249/MSS.0b013e3182399eb1. [DOI] [PMC free article] [PubMed] [Google Scholar]
- Troiano RP, Berrigan D, Dodd KW, Masse LC, Tilert T, & McDowell M. (2008). Physical activity in the United States measured by accelerometer. Medicine and Science in Sports and Exercise, 40(1), 181–188. [DOI] [PubMed] [Google Scholar]
- Trost SG, Loprinzi PD, Moore R, Pfeiffer KA. (2011). Comparison of accelerometer cut points for predicting activity intensity in youth. Medicine and Science in Sports and Exercise, 43(7), 1360–1368. [DOI] [PubMed] [Google Scholar]
- U.S. Department of Health and Human Services. (2008). 2008 Physical Activity Guidelines for Americans. US Department of Health and Human Services [Internet] Available from: http://www.health.gov/paguidelines/. [Google Scholar]
- van Sluijs EM, Kriemler S, & McMinn AM. (2011). The effect of community and family interventions on young people’s physical activity levels: a review of reviews and updated systematic review. British Journal of Sports Medicine, 45(11),914–922. doi: 10.1136/bjsports-2011-090187. PubMed PMID: ; [DOI] [PMC free article] [PubMed] [Google Scholar]
- Williams DM, & Rhodes RE (2016). The confounded self-efficacy construct: conceptual analysis and recommendations for future research. Health Psychology Review, 10(2), 113–128. [DOI] [PMC free article] [PubMed] [Google Scholar]